
Cross-platform report - December 2013 (Nielsen)
22
THE CROSS-PLATFORM SERIES | Q3 2013 A LOOK ACROSS MEDIA THE CROSS-PLATFORM REPORT DECEMBER 2013
-
Upload
maple-aikon -
Category
Education
-
view
532 -
download
0
description
Transcript of Cross-platform report - December 2013 (Nielsen)
Copyright © 2013 The Nielsen Company THE CROSS-PLATFORM SERIES | Q3 2013
A L O O KA C R O S SM E D I ATHE CROSS-PLATFORM REPORTDECEMBER 2013
2 Copyright © 2013 The Nielsen Company
Some of what keeps me up at night is the drive to understand and
explain how we each consume media content across all screens and at
all times. At Nielsen, we work on providing the metrics that allow our
clients to understand how many people were reached with entertainment
content, how the entertainment and marketing messages resonated with
consumers and the Holy Grail, knowing what action this triggered.
DID PEOPLE wATCH, READ, LISTEn TO OR InTERACT wITH COnTEnT AnD COMMERCIAL MESSAgES THAT DROvE THEM TO THAT PuRCHASE POInT?
This year we’ve added audio measurement to our portfolio. Imagine a
consumer’s day as a pie chart, this capability provides another piece that
makes up the consumer’s daily contact and interaction with content.
Each milestone in total audience measurement allows us to get closer to
that full “day in the life,” and gets me closer to a full night of sleep!
We are driven to add all types media and to provide data that is inclusive
of an increasingly multicultural population, of segments of the population
both young and old who consume different types of content on different
devices and at all times of the day and night.
wELCOMEDOUNIA TURRILL
SVP INSIGHTS, NIELSEN
D O U N I A
3Copyright © 2013 The Nielsen Company THE CROSS-PLATFORm REPORT | Q3 2013
Adding the radio listener’s media habits to the mix highlights the part that
am/fm radio plays in people’s daily lives. How many of us tune in to the
radio during the week listening to news, sports, music and talk shows as
well as the all-important traffic report?
In FACT, MORE THAn nInETy PERCEnT OF AMERICAnS LISTEn TO RADIO EACH wEEk, AnD THOSE nuMbERS ARE HIgHEST wITH AFRICAn AMERICAnS (92%) AnD HISPAnICS (94%).
Radio is a constant in our daily lives and the average American radio
listener tunes in to radio over two hours per day. Interestingly, audio
reaches a plateau in the morning hours, peaking around noon and then
staying fairly constant through the day before tapering off as people start
their evening. In addition we know that people who listen to a lot of radio
also spend time with online radio, most prevalently the millennials.
Morning commutes, listening “on the go” during the day as well as the
much-anticipated evening commute, create the daily view of time spent
one might expect. In fact we see that between the morning hours and
early evening hours, roughly two-thirds of audio listening comes from
out-of-home tuning. The hyper local nature of audio offers advertisers
community-level engagement between content and in-store activity - radio
catches you right before you shop and make purchase decisions.
As we continue to take a close look at the similarities and differences
between radio listeners, digital consumers and television viewers we
keep building to that total view of daily media consumption.
Is the composition of the audio audience more like the online and mobile
audience or more like the traditional television viewer? For years, we’ve
shared insights into the expanding pie of media consumption. Radio
listeners prove that there are always more ways to reach and inform
motivated customers and more than one way to slice that data.

4 Copyright © 2013 The nielsen Company
A L O O K A C R O S S M E D I A
5Copyright © 2013 The nielsen Company THE CROSS-PLATFORM REPORT | Q3 2013
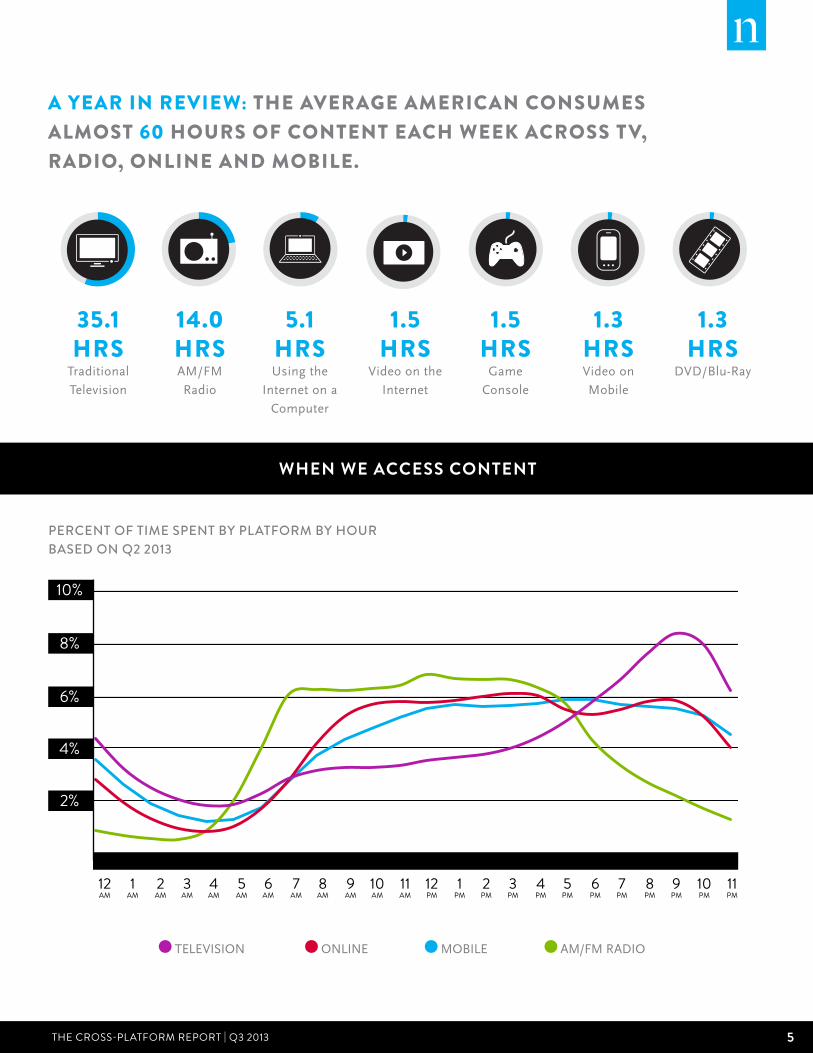
A YEAR In REvIEw: THE AvERAgE AMERICAn COnSuMES ALMOST 60 HOuRS OF COnTEnT EACH wEEk ACROSS Tv, RAdIO, OnLInE And MObILE.
35.1 HRS
Traditional
Television
14.0 HRS
AM/FM
Radio
5.1 HRS
Using the
Internet on a
Computer
1.5 HRS
Video on the
Internet
1.5 HRS
Game
Console
1.3 HRS
Video on
Mobile
1.3 HRS
DVD/Blu-Ray
WHEN WE ACCESS CONTENT
PERCENt Of tIME SPENt By PlAtfORM By HOURBASED ON Q2 2013
12AM
2%
4%
6%
8%
10%
1AM
2AM
3AM
4AM
5AM
6AM
7AM
8AM
9AM
10AM
11AM
12PM
1PM
2PM
3PM
4PM
5PM
6PM
7PM
8PM
9PM
10PM
11PM
TELEVISIONPURPLE
ONLINERED
MOBILEBLUE
RADIOGREENTELEVISION ONLINE MOBILE AM/FM RADIO
6 Copyright © 2013 The Nielsen Company
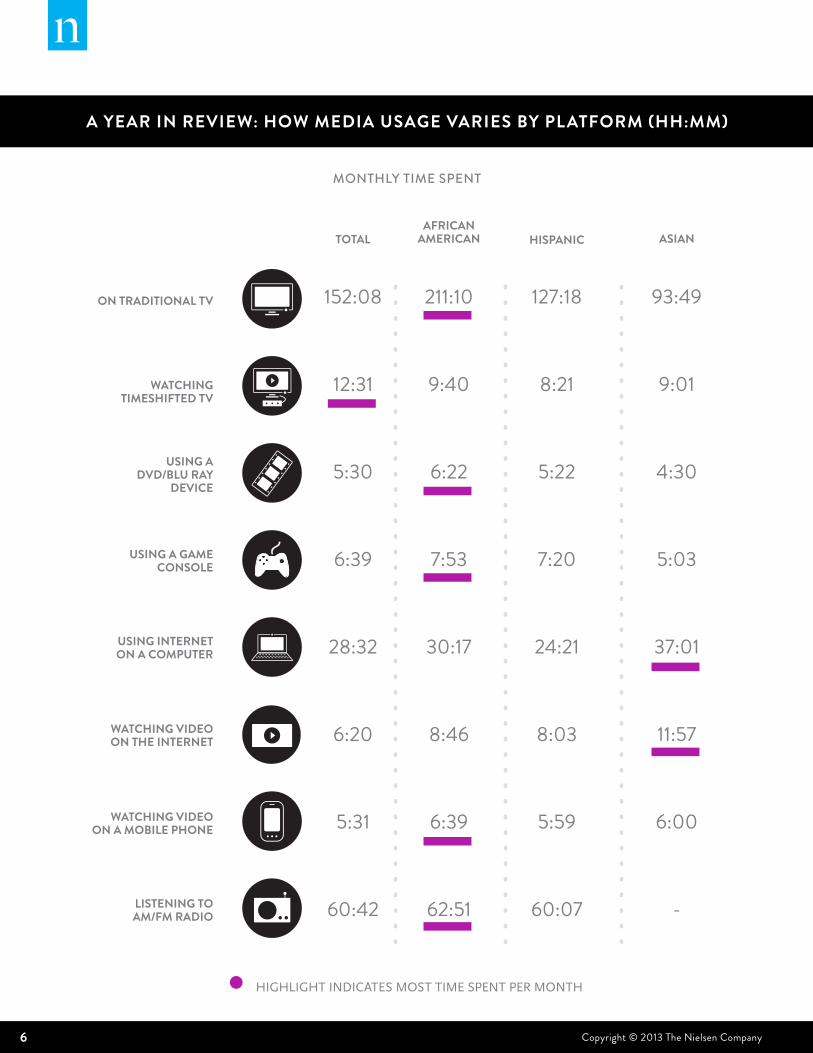
HIGHLIGHT INDICATES MOST TIME SPENT PER MONTH
152:08
12:31
5:30
6:39
28:32
6:20
5:31
60:42
TOTAL
ON TRADITIONAL TV
WATCHING TIMESHIFTED TV
USING A DVD/BLU RAY
DEVICE
USING A GAMECONSOLE
USING INTERNET ON A COMPUTER
WATCHING VIDEO ON THE INTERNET
WATCHING VIDEO ON A MOBILE PHONE
LISTENING TOAM/FM RADIO
AFRICAN AMERICAN HISPANIC ASIAN
211:10
9:40
6:22
7:53
30:17
8:46
6:39
62:51
127:18
8:21
5:22
7:20
24:21
8:03
5:59
60:07
93:49
9:01
4:30
5:03
37:01
11:57
6:00
-
A YEAr IN rEvIEW: HOW MEdIA USAgE vArIES bY PlATfOrM (HH:MM)
MONtHly tIME SPENt
7Copyright © 2013 The Nielsen Company THE CROSS-PLATFORm REPORT | Q3 2013
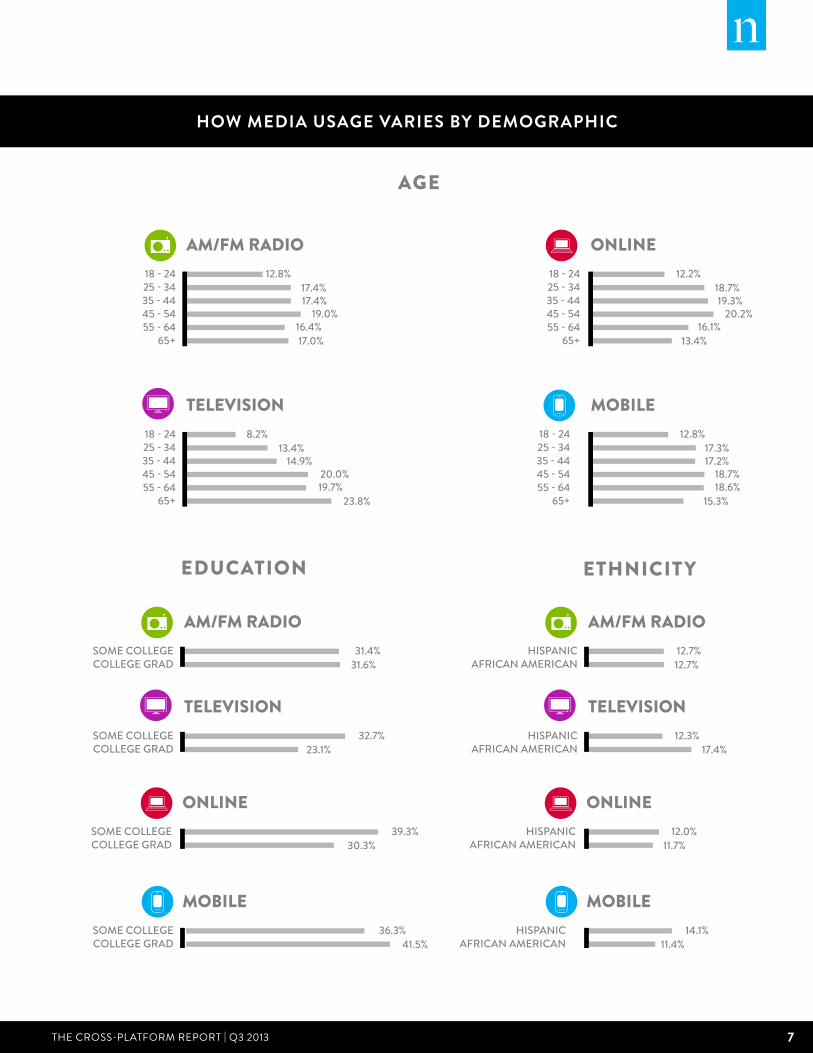
18 - 24 25 - 3435 - 4445 - 54 55 - 64
65+
12.8%17.4%17.4%
19.0%16.4%17.0%
8.2%13.4%
14.9%20.0%19.7%
23.8%
12.2%18.7%19.3%
20.2%16.1%
13.4%
12.8%17.3%17.2%
18.7%18.6%
15.3%
AM/FM RADIO
18 - 24 25 - 3435 - 4445 - 54 55 - 64
65+
TELEVISION
18 - 24 25 - 3435 - 4445 - 54 55 - 64
65+
ONLINE
18 - 24 25 - 3435 - 4445 - 54 55 - 64
65+
MOBILE
31.4%31.6%
SOME COLLEGECOLLEGE GRAD
AM/FM RADIO
32.7%23.1%
SOME COLLEGECOLLEGE GRAD
TELEVISION
39.3%30.3%
SOME COLLEGECOLLEGE GRAD
ONLINE
36.3%41.5%
MOBILE
12.7%12.7%
HISPANICAFRICAN AMERICAN
AM/FM RADIO
12.3%17.4%
HISPANICAFRICAN AMERICAN
TELEVISION
12.0%11.7%
HISPANICAFRICAN AMERICAN
ONLINE
14.1%11.4%
HISPANICAFRICAN AMERICAN
MOBILESOME COLLEGECOLLEGE GRAD
HOW MEdIA USAgE vArIES bY dEMOgrAPHIC
AgE
EduCATIOn ETHnICITY
8 Copyright © 2013 The nielsen Company
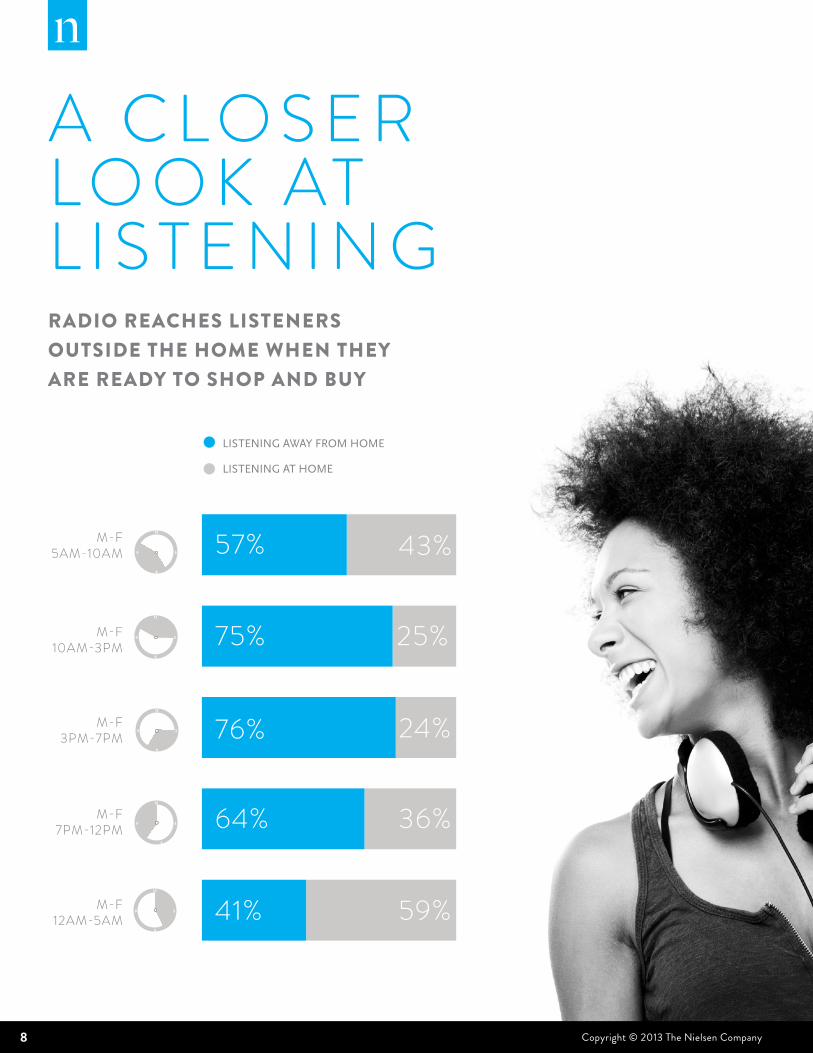
A C L O S E R L O O K AT L I S T E N I N G RAdIO REACHES LISTEnERS OuTSIdE THE HOME wHEn THEY ARE REAdY TO SHOP And buY
25%
43%
24%
36%
59%41%
64%
76%
75%
57%
LISTENING AWAY FROM HOME
LISTENING AT HOME
12
6
39
6
9
12
6
39
12
6
39
3
12
12
6
39
M-F 5AM-10AM
M-F 10AM-3PM
M-F 3PM-7PM
M-F 7PM-12PM
M-F 12AM-5AM
9THE CROSS-PLATFORM REPORT | Q3 2013Copyright © 2013 The nielsen Company
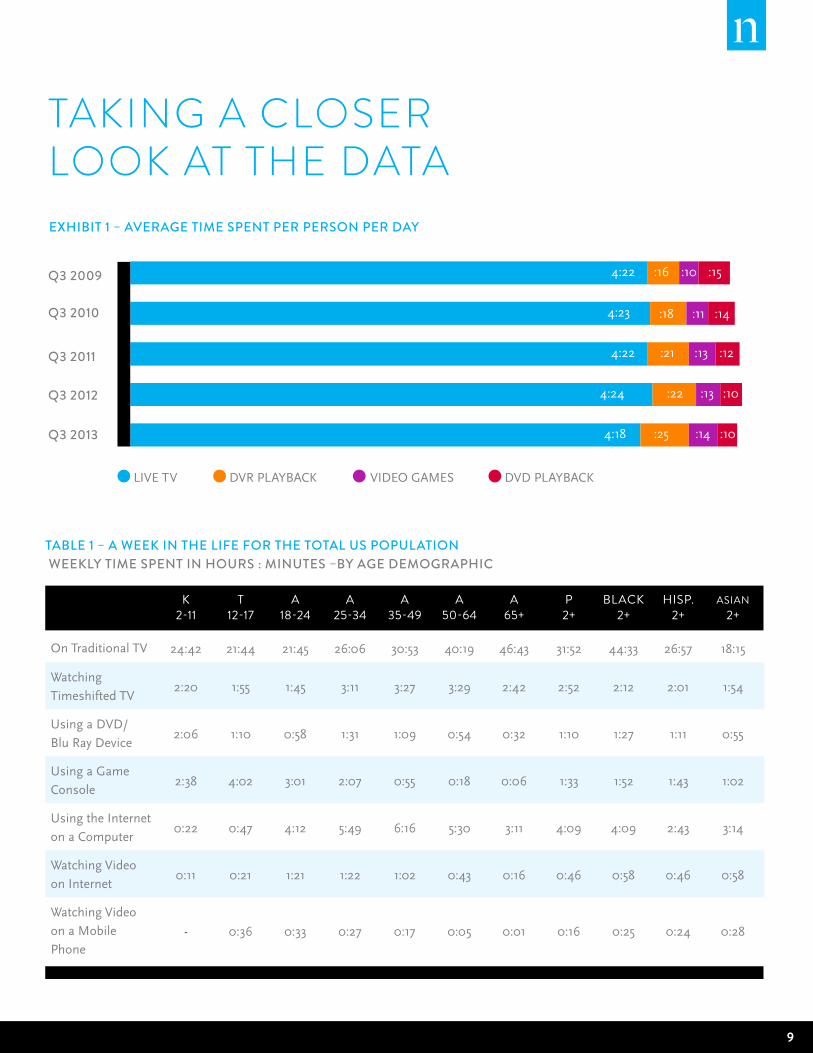
TAKING A CLOSER LOOK AT THE DATA
tABlE 1 – A WEEk IN tHE lIfE fOR tHE tOtAl US POPUlAtION WEEkly tIME SPENt IN HOURS : MINUtES –By AgE DEMOgRAPHIC
k 2-11
T 12-17
A 18-24
A 25-34
A 35-49
A 50-64
A 65+
P 2+
bLACk 2+
HISP. 2+
ASIAn 2+
On Traditional TV 24:42 21:44 21:45 26:06 30:53 40:19 46:43 31:52 44:33 26:57 18:15
Watching
Timeshifted TV 2:20 1:55 1:45 3:11 3:27 3:29 2:42 2:52 2:12 2:01 1:54
Using a DVD/
Blu Ray Device2:06 1:10 0:58 1:31 1:09 0:54 0:32 1:10 1:27 1:11 0:55
Using a Game
Console2:38 4:02 3:01 2:07 0:55 0:18 0:06 1:33 1:52 1:43 1:02
Using the Internet
on a Computer 0:22 0:47 4:12 5:49 6:16 5:30 3:11 4:09 4:09 2:43 3:14
Watching Video
on Internet 0:11 0:21 1:21 1:22 1:02 0:43 0:16 0:46 0:58 0:46 0:58
Watching Video
on a Mobile
Phone - 0:36 0:33 0:27 0:17 0:05 0:01 0:16 0:25 0:24 0:28
4:22
4:23
4:22
4:24
4:18
:16
:18
:21
:22
:25
:10
:11
:13
:13
:14
:15
:14
:12
:10
:10
Q3 2009
Q3 2010
Q3 2011
Q3 2012
Q3 2013
EXHIBIt 1 – AVERAgE tIME SPENt PER PERSON PER DAy
LIVE TV DVR PLAYBACK VIDEO GAMES DVD PLAYBACK
9
10 Copyright © 2013 The Nielsen Company
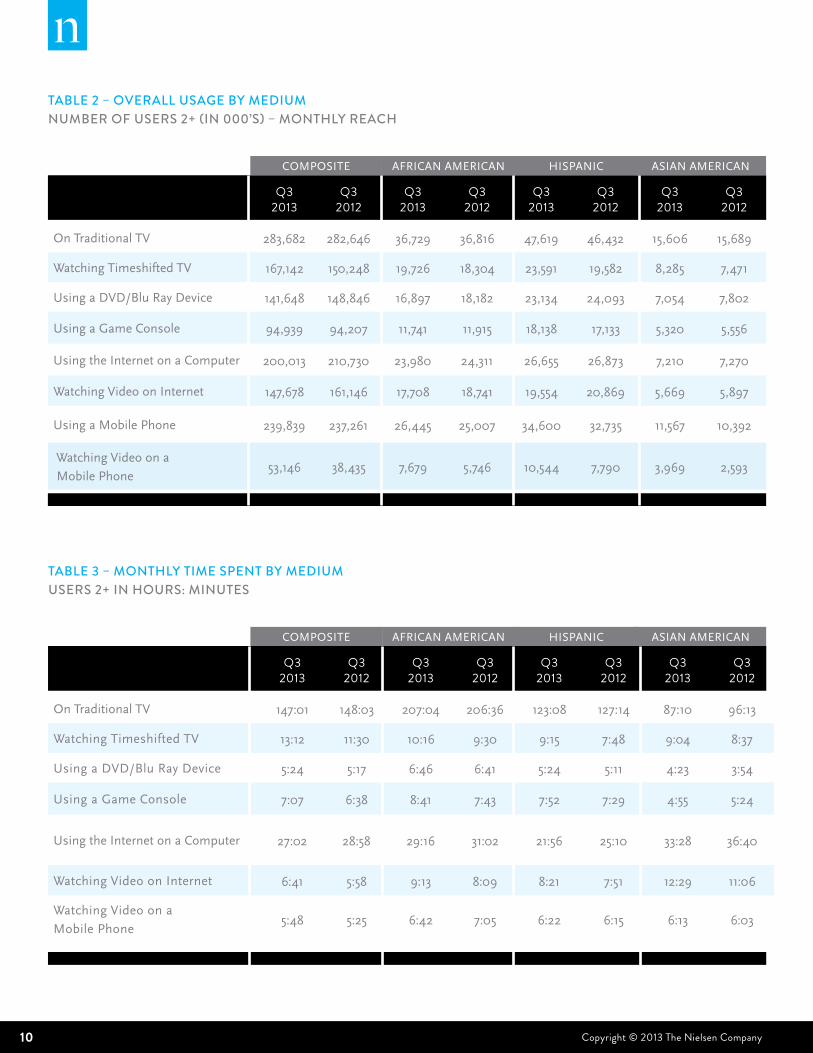
tABlE 2 – OVERAll USAgE By MEDIUM NUMBER Of USERS 2+ (IN 000’S) – MONtHly REACH
Q3 2013
Q3 2012
Q3 2013
Q3 2012
Q3 2013
Q3 2012
Q3 2013
Q3 2012
On Traditional TV 283,682 282,646 36,729 36,816 47,619 46,432 15,606 15,689
Watching Timeshifted TV 167,142 150,248 19,726 18,304 23,591 19,582 8,285 7,471
Using a DVD/Blu Ray Device 141,648 148,846 16,897 18,182 23,134 24,093 7,054 7,802
Using a Game Console 94,939 94,207 11,741 11,915 18,138 17,133 5,320 5,556
Using the Internet on a Computer 200,013 210,730 23,980 24,311 26,655 26,873 7,210 7,270
Watching Video on Internet 147,678 161,146 17,708 18,741 19,554 20,869 5,669 5,897
Using a Mobile Phone 239,839 237,261 26,445 25,007 34,600 32,735 11,567 10,392
Watching Video on a
Mobile Phone53,146 38,435 7,679 5,746 10,544 7,790 3,969 2,593
AFRICAN AMERICAN HISPANIC ASIAN AMERICANCOMPOSITE
tABlE 3 – MONtHly tIME SPENt By MEDIUMUSERS 2+ IN HOURS: MINUtES
Q3 2013
Q3 2012
Q3 2013
Q3 2012
Q3 2013
Q3 2012
Q3 2013
Q3 2012
On Traditional TV 147:01 148:03 207:04 206:36 123:08 127:14 87:10 96:13
Watching Timeshifted TV 13:12 11:30 10:16 9:30 9:15 7:48 9:04 8:37
Using a DVD/Blu Ray Device 5:24 5:17 6:46 6:41 5:24 5:11 4:23 3:54
Using a Game Console 7:07 6:38 8:41 7:43 7:52 7:29 4:55 5:24
Using the Internet on a Computer 27:02 28:58 29:16 31:02 21:56 25:10 33:28 36:40
Watching Video on Internet 6:41 5:58 9:13 8:09 8:21 7:51 12:29 11:06
Watching Video on a
Mobile Phone5:48 5:25 6:42 7:05 6:22 6:15 6:13 6:03
AFRICAN AMERICAN HISPANIC ASIAN AMERICANCOMPOSITE
11Copyright © 2013 The Nielsen Company THE CROSS-PLATFORm REPORT | Q3 2013
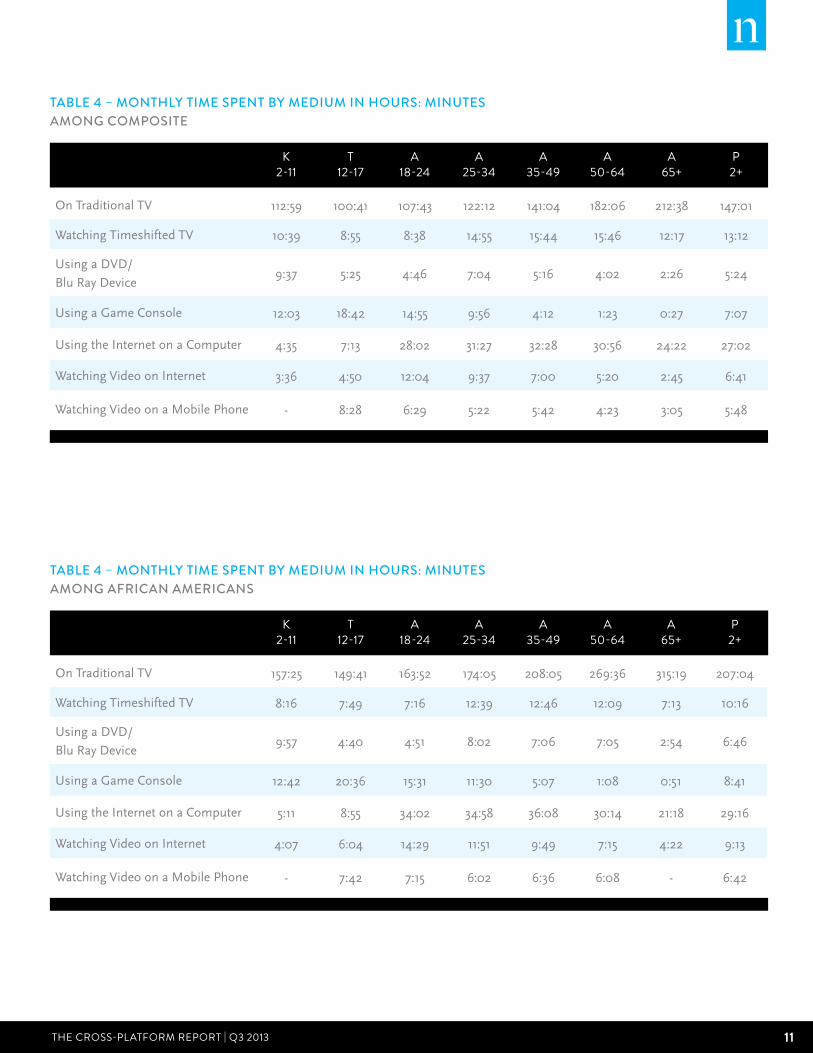
tABlE 4 – MONtHly tIME SPENt By MEDIUM IN HOURS: MINUtES AMONg COMPOSItE
k 2-11
T 12-17
A 18-24
A 25-34
A 35-49
A 50-64
A 65+
P 2+
On Traditional TV 112:59 100:41 107:43 122:12 141:04 182:06 212:38 147:01
Watching Timeshifted TV 10:39 8:55 8:38 14:55 15:44 15:46 12:17 13:12
Using a DVD/
Blu Ray Device9:37 5:25 4:46 7:04 5:16 4:02 2:26 5:24
Using a Game Console 12:03 18:42 14:55 9:56 4:12 1:23 0:27 7:07
Using the Internet on a Computer 4:35 7:13 28:02 31:27 32:28 30:56 24:22 27:02
Watching Video on Internet 3:36 4:50 12:04 9:37 7:00 5:20 2:45 6:41
Watching Video on a Mobile Phone - 8:28 6:29 5:22 5:42 4:23 3:05 5:48
tABlE 4 – MONtHly tIME SPENt By MEDIUM IN HOURS: MINUtES AMONg AfRICAN AMERICANS
k 2-11
T 12-17
A 18-24
A 25-34
A 35-49
A 50-64
A 65+
P 2+
On Traditional TV 157:25 149:41 163:52 174:05 208:05 269:36 315:19 207:04
Watching Timeshifted TV 8:16 7:49 7:16 12:39 12:46 12:09 7:13 10:16
Using a DVD/
Blu Ray Device9:57 4:40 4:51 8:02 7:06 7:05 2:54 6:46
Using a Game Console 12:42 20:36 15:31 11:30 5:07 1:08 0:51 8:41
Using the Internet on a Computer 5:11 8:55 34:02 34:58 36:08 30:14 21:18 29:16
Watching Video on Internet 4:07 6:04 14:29 11:51 9:49 7:15 4:22 9:13
Watching Video on a Mobile Phone - 7:42 7:15 6:02 6:36 6:08 - 6:42
12 Copyright © 2013 The Nielsen Company
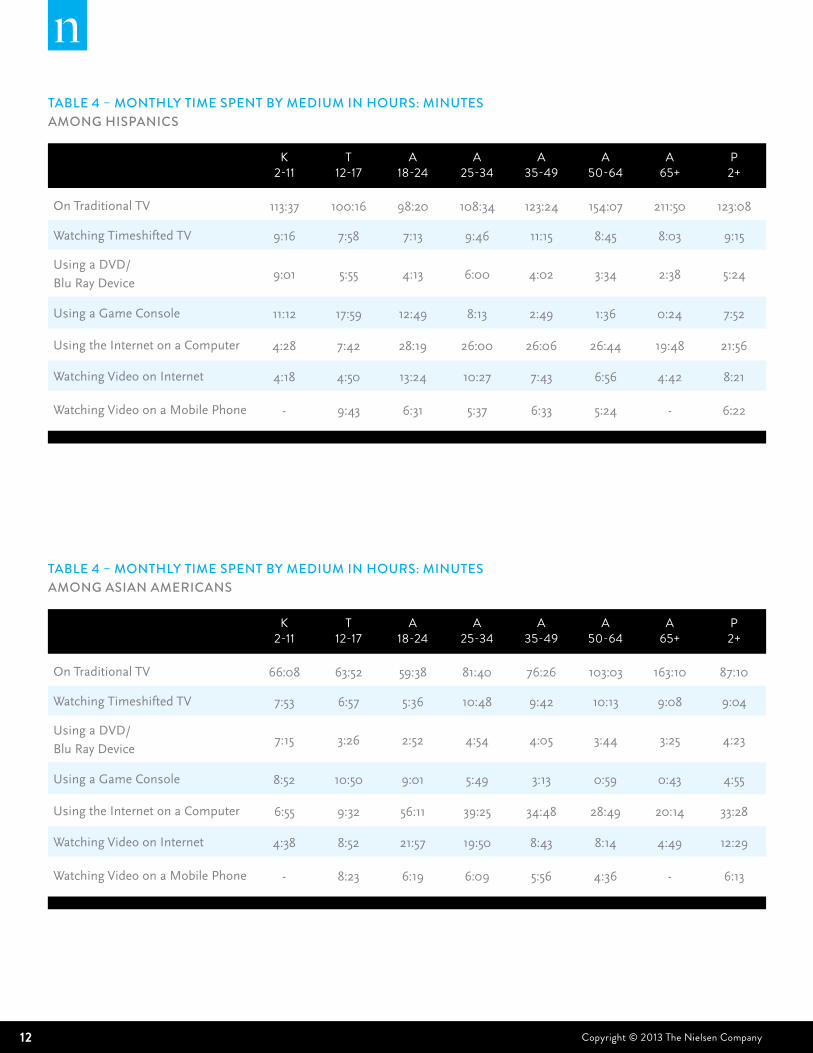
tABlE 4 – MONtHly tIME SPENt By MEDIUM IN HOURS: MINUtES AMONg ASIAN AMERICANS
k 2-11
T 12-17
A 18-24
A 25-34
A 35-49
A 50-64
A 65+
P 2+
On Traditional TV 66:08 63:52 59:38 81:40 76:26 103:03 163:10 87:10
Watching Timeshifted TV 7:53 6:57 5:36 10:48 9:42 10:13 9:08 9:04
Using a DVD/
Blu Ray Device7:15 3:26 2:52 4:54 4:05 3:44 3:25 4:23
Using a Game Console 8:52 10:50 9:01 5:49 3:13 0:59 0:43 4:55
Using the Internet on a Computer 6:55 9:32 56:11 39:25 34:48 28:49 20:14 33:28
Watching Video on Internet 4:38 8:52 21:57 19:50 8:43 8:14 4:49 12:29
Watching Video on a Mobile Phone - 8:23 6:19 6:09 5:56 4:36 - 6:13
tABlE 4 – MONtHly tIME SPENt By MEDIUM IN HOURS: MINUtES AMONg HISPANICS
k 2-11
T 12-17
A 18-24
A 25-34
A 35-49
A 50-64
A 65+
P 2+
On Traditional TV 113:37 100:16 98:20 108:34 123:24 154:07 211:50 123:08
Watching Timeshifted TV 9:16 7:58 7:13 9:46 11:15 8:45 8:03 9:15
Using a DVD/
Blu Ray Device9:01 5:55 4:13 6:00 4:02 3:34 2:38 5:24
Using a Game Console 11:12 17:59 12:49 8:13 2:49 1:36 0:24 7:52
Using the Internet on a Computer 4:28 7:42 28:19 26:00 26:06 26:44 19:48 21:56
Watching Video on Internet 4:18 4:50 13:24 10:27 7:43 6:56 4:42 8:21
Watching Video on a Mobile Phone - 9:43 6:31 5:37 6:33 5:24 - 6:22
13Copyright © 2013 The Nielsen Company THE CROSS-PLATFORm REPORT | Q3 2013
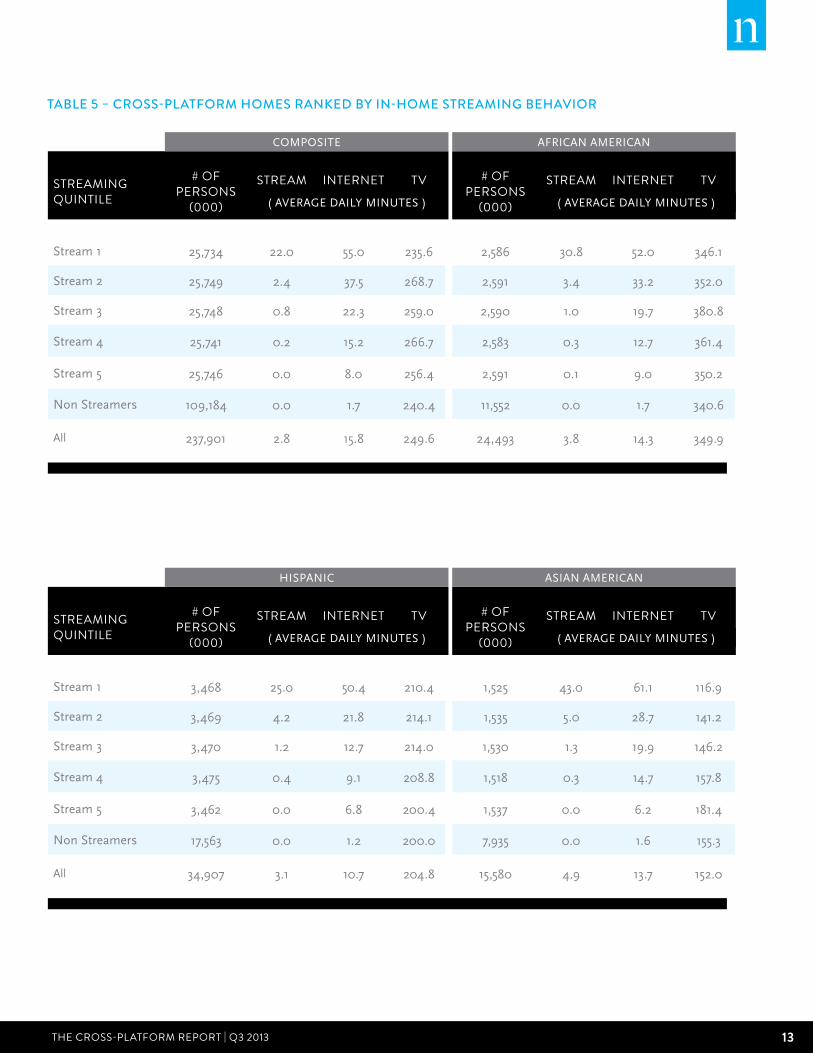
STREAMIng QuInTILE
# OF PERSOnS
(000)
STREAM InTERnET Tv
Stream 1 25,734 22.0 55.0 235.6
Stream 2 25,749 2.4 37.5 268.7
Stream 3 25,748 0.8 22.3 259.0
Stream 4 25,741 0.2 15.2 266.7
Stream 5 25,746 0.0 8.0 256.4
Non Streamers 109,184 0.0 1.7 240.4
All 237,901 2.8 15.8 249.6
COMPOSITE
( AVERAGE DAILY MINUTES )
tABlE 5 – CROSS-PlAtfORM HOMES RANkED By IN-HOME StREAMINg BEHAVIOR
# OF PERSOnS
(000)
STREAM InTERnET Tv
2,586 30.8 52.0 346.1
2,591 3.4 33.2 352.0
2,590 1.0 19.7 380.8
2,583 0.3 12.7 361.4
2,591 0.1 9.0 350.2
11,552 0.0 1.7 340.6
24,493 3.8 14.3 349.9
( AVERAGE DAILY MINUTES )
AFRICAN AMERICAN
STREAMIng QuInTILE
# OF PERSOnS
(000)
STREAM InTERnET Tv
Stream 1 3,468 25.0 50.4 210.4
Stream 2 3,469 4.2 21.8 214.1
Stream 3 3,470 1.2 12.7 214.0
Stream 4 3,475 0.4 9.1 208.8
Stream 5 3,462 0.0 6.8 200.4
Non Streamers 17,563 0.0 1.2 200.0
All 34,907 3.1 10.7 204.8
HISPANIC
( AVERAGE DAILY MINUTES )
# OF PERSOnS
(000)
STREAM InTERnET Tv
1,525 43.0 61.1 116.9
1,535 5.0 28.7 141.2
1,530 1.3 19.9 146.2
1,518 0.3 14.7 157.8
1,537 0.0 6.2 181.4
7,935 0.0 1.6 155.3
15,580 4.9 13.7 152.0
( AVERAGE DAILY MINUTES )
ASIAN AMERICAN
14 Copyright © 2013 The Nielsen Company
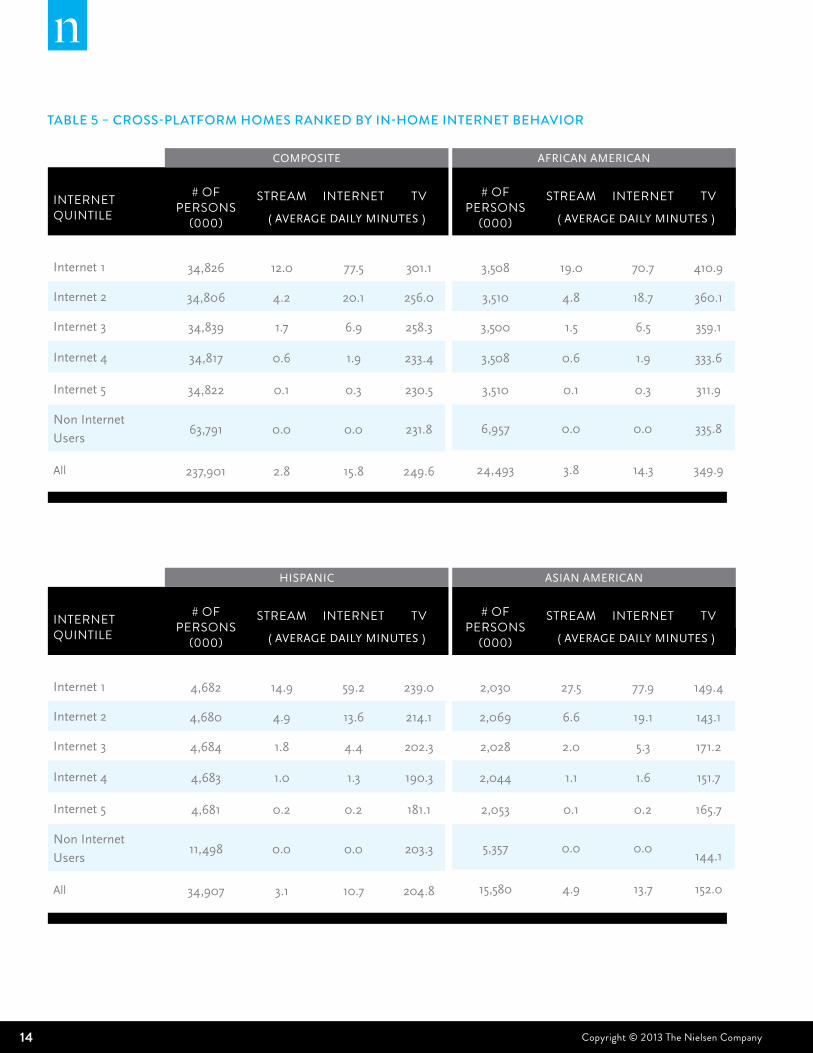
InTERnET QuInTILE
# OF PERSOnS
(000)
STREAM InTERnET Tv
Internet 1 34,826 12.0 77.5 301.1
Internet 2 34,806 4.2 20.1 256.0
Internet 3 34,839 1.7 6.9 258.3
Internet 4 34,817 0.6 1.9 233.4
Internet 5 34,822 0.1 0.3 230.5
Non Internet
Users63,791 0.0 0.0 231.8
All 237,901 2.8 15.8 249.6
COMPOSITE
( AVERAGE DAILY MINUTES )
tABlE 5 – CROSS-PlAtfORM HOMES RANkED By IN-HOME INtERNEt BEHAVIOR
# OF PERSOnS
(000)
STREAM InTERnET Tv
3,508 19.0 70.7 410.9
3,510 4.8 18.7 360.1
3,500 1.5 6.5 359.1
3,508 0.6 1.9 333.6
3,510 0.1 0.3 311.9
6,957 0.0 0.0 335.8
24,493 3.8 14.3 349.9
( AVERAGE DAILY MINUTES )
AFRICAN AMERICAN
InTERnET QuInTILE
# OF PERSOnS
(000)
STREAM InTERnET Tv
Internet 1 4,682 14.9 59.2 239.0
Internet 2 4,680 4.9 13.6 214.1
Internet 3 4,684 1.8 4.4 202.3
Internet 4 4,683 1.0 1.3 190.3
Internet 5 4,681 0.2 0.2 181.1
Non Internet
Users11,498 0.0 0.0 203.3
All 34,907 3.1 10.7 204.8
HISPANIC
( AVERAGE DAILY MINUTES )
# OF PERSOnS
(000)
STREAM InTERnET Tv
2,030 27.5 77.9 149.4
2,069 6.6 19.1 143.1
2,028 2.0 5.3 171.2
2,044 1.1 1.6 151.7
2,053 0.1 0.2 165.7
5,357 0.0 0.0144.1
15,580 4.9 13.7 152.0
( AVERAGE DAILY MINUTES )
ASIAN AMERICAN
15Copyright © 2013 The Nielsen Company THE CROSS-PLATFORm REPORT | Q3 2013
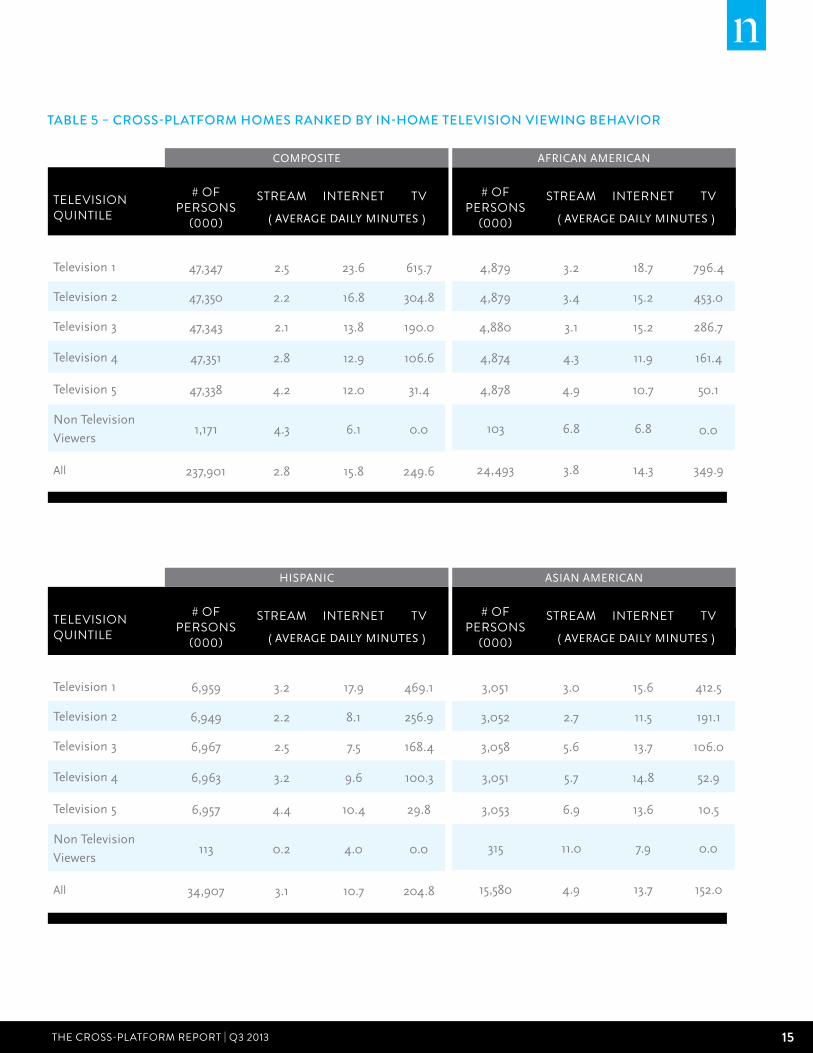
TELEvISIOn QuInTILE
# OF PERSOnS
(000)
STREAM InTERnET Tv
Television 1 47,347 2.5 23.6 615.7
Television 2 47,350 2.2 16.8 304.8
Television 3 47,343 2.1 13.8 190.0
Television 4 47,351 2.8 12.9 106.6
Television 5 47,338 4.2 12.0 31.4
Non Television
Viewers1,171 4.3 6.1 0.0
All 237,901 2.8 15.8 249.6
COMPOSITE
( AVERAGE DAILY MINUTES )
tABlE 5 – CROSS-PlAtfORM HOMES RANkED By IN-HOME tElEVISION VIEWINg BEHAVIOR
# OF PERSOnS
(000)
STREAM InTERnET Tv
4,879 3.2 18.7 796.4
4,879 3.4 15.2 453.0
4,880 3.1 15.2 286.7
4,874 4.3 11.9 161.4
4,878 4.9 10.7 50.1
103 6.8 6.8 0.0
24,493 3.8 14.3 349.9
( AVERAGE DAILY MINUTES )
AFRICAN AMERICAN
TELEvISIOn QuInTILE
# OF PERSOnS
(000)
STREAM InTERnET Tv
Television 1 6,959 3.2 17.9 469.1
Television 2 6,949 2.2 8.1 256.9
Television 3 6,967 2.5 7.5 168.4
Television 4 6,963 3.2 9.6 100.3
Television 5 6,957 4.4 10.4 29.8
Non Television
Viewers113 0.2 4.0 0.0
All 34,907 3.1 10.7 204.8
HISPANIC
( AVERAGE DAILY MINUTES )
# OF PERSOnS
(000)
STREAM InTERnET Tv
3,051 3.0 15.6 412.5
3,052 2.7 11.5 191.1
3,058 5.6 13.7 106.0
3,051 5.7 14.8 52.9
3,053 6.9 13.6 10.5
315 11.0 7.9 0.0
15,580 4.9 13.7 152.0
( AVERAGE DAILY MINUTES )
ASIAN AMERICAN
16 Copyright © 2013 The Nielsen Company
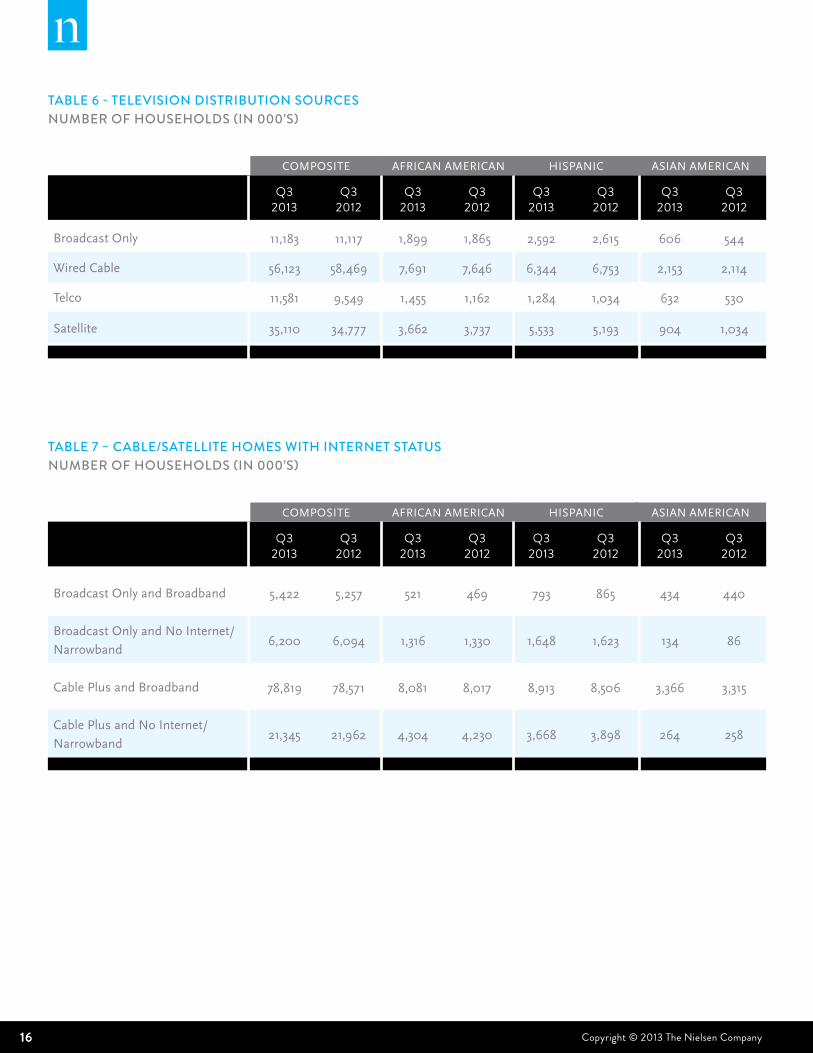
tABlE 6 - tElEVISION DIStRIBUtION SOURCESNUMBER Of HOUSEHOlDS (IN 000’S)
Q3 2013
Q3 2012
Q3 2013
Q3 2012
Q3 2013
Q3 2012
Q3 2013
Q3 2012
Broadcast Only 11,183 11,117 1,899 1,865 2,592 2,615 606 544
Wired Cable 56,123 58,469 7,691 7,646 6,344 6,753 2,153 2,114
Telco 11,581 9,549 1,455 1,162 1,284 1,034 632 530
Satellite 35,110 34,777 3,662 3,737 5,533 5,193 904 1,034
AFRICAN AMERICAN HISPANIC ASIAN AMERICANCOMPOSITE
tABlE 7 – CABlE/SAtEllItE HOMES WItH INtERNEt StAtUSNUMBER Of HOUSEHOlDS (IN 000’S)
Q3 2013
Q3 2012
Q3 2013
Q3 2012
Q3 2013
Q3 2012
Q3 2013
Q3 2012
Broadcast Only and Broadband 5,422 5,257 521 469 793 865 434 440
Broadcast Only and No Internet/
Narrowband6,200 6,094 1,316 1,330 1,648 1,623 134 86
Cable Plus and Broadband 78,819 78,571 8,081 8,017 8,913 8,506 3,366 3,315
Cable Plus and No Internet/
Narrowband21,345 21,962 4,304 4,230 3,668 3,898 264 258
AFRICAN AMERICAN HISPANIC ASIAN AMERICANCOMPOSITE
17Copyright © 2013 The Nielsen Company THE CROSS-PLATFORm REPORT | Q3 2013
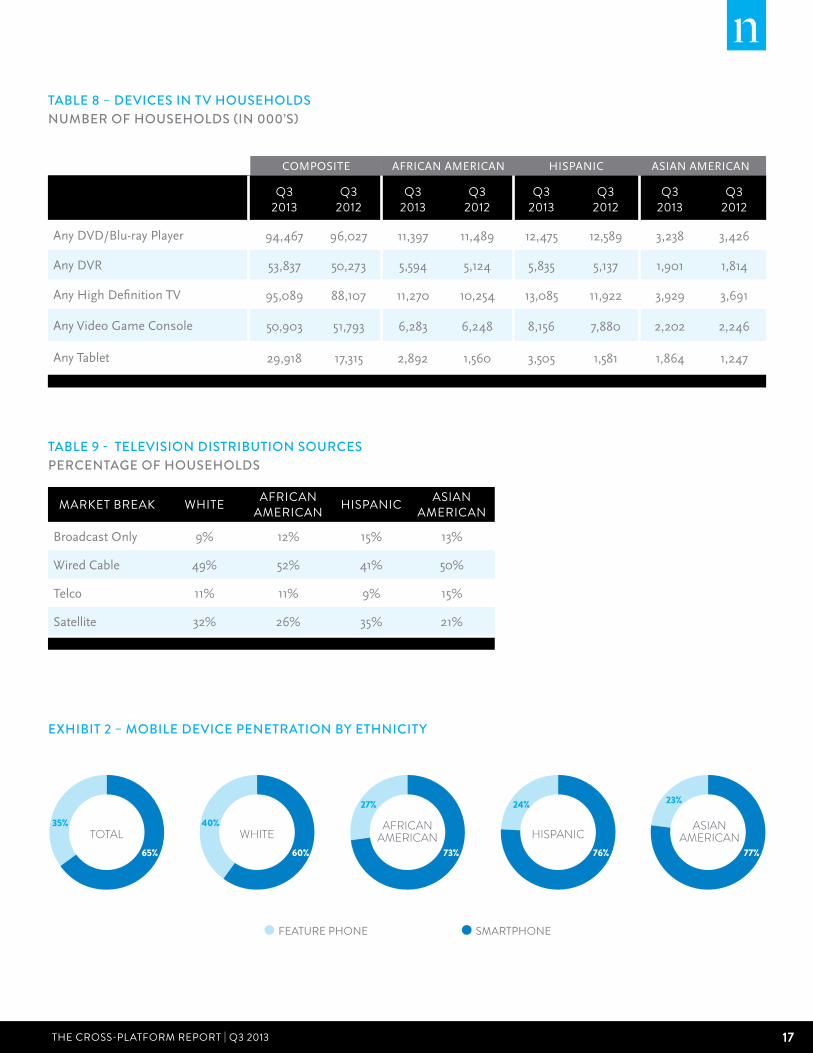
tABlE 8 – DEVICES IN tV HOUSEHOlDS NUMBER Of HOUSEHOlDS (IN 000’S)
Q3 2013
Q3 2012
Q3 2013
Q3 2012
Q3 2013
Q3 2012
Q3 2013
Q3 2012
Any DVD/Blu-ray Player 94,467 96,027 11,397 11,489 12,475 12,589 3,238 3,426
Any DVR 53,837 50,273 5,594 5,124 5,835 5,137 1,901 1,814
Any High Definition TV 95,089 88,107 11,270 10,254 13,085 11,922 3,929 3,691
Any Video Game Console 50,903 51,793 6,283 6,248 8,156 7,880 2,202 2,246
Any Tablet 29,918 17,315 2,892 1,560 3,505 1,581 1,864 1,247
AFRICAN AMERICAN HISPANIC ASIAN AMERICANCOMPOSITE
EXHIBIt 2 – MOBIlE DEVICE PENEtRAtION By EtHNICIty
SMARTPHONEFEATURE PHONE
TOTAL35%
65%
WHITE40%
60%
AFRICANAMERICAN
27%
73%
23%
77%
HISPANIC
24%
76%
ASIANAMERICAN
SMARTPHONEFEATURE PHONE
TOTAL35%
65%
WHITE40%
60%
AFRICANAMERICAN
27%
73%
23%
77%
HISPANIC
24%
76%
ASIANAMERICAN
tABlE 9 - tElEVISION DIStRIBUtION SOURCES PERCENtAgE Of HOUSEHOlDS
MARkET bREAk wHITE AFRICAn AMERICAn HISPAnIC ASIAn
AMERICAn
Broadcast Only 9% 12% 15% 13%
Wired Cable 49% 52% 41% 50%
Telco 11% 11% 9% 15%
Satellite 32% 26% 35% 21%
18 Copyright © 2013 The Nielsen Company
SOURCING & METHODOLOGIESglOSSArY
TV HouseHold: Nielsen defines a TV household as a home with at least one operable
TV/monitor with the ability to deliver video via traditional means of antennae, cable STB or
Satellite receiver and /or with a broadband connection.
TradiTional TV: Watching live or timeshifted content on a television set.
Wired Cable: Traditional cable delivered through wires to your home.
TelCo: A paid TV subscription delivered fiber-optically via a traditional telephony provider.
saTelliTe: A paid TV subscription where the signal is distributed to an orbiting
satellite. The amplified signal is then re-transmitted to the home and received via a dish.
(Sometimes also referred to as “dish”).
broadband: A paid, high-speed Internet access delivered via DSL, Cable Internet
through cable provider, Fiber-Optic Service, U-Verse, Satellite Internet, Data Card (aircard
that connects to a cellular phone network) or PC tethered to cell phone (cellular phone
network).
narroWband: A household that accesses the Internet via a telephone line (often
referred to as dial up).
broadCasT only: A mode of television content delivery that does not involve satellite
transmission or cables (ie—a paid service). Also commonly referred to as “Over-the-air.”
aM/FM radio: Listening to programming from AM/FM radio stations
or network programming.
TElEvISION METHOdOlOgY
On Traditional TV includes Live usage plus any playback viewing within the measurement period. Timeshifted TV is playback primarily on a DVR but includes playback from VOD, DVD recorders, server based DVR’s and services like Start Over.
On Traditional TV reach includes those viewing at least one minute within the measurement period. This includes Live viewing plus any playback within the measurement period. Third Quarter 2013 Television data is based on the following measurement interval: 07/01/13 - 09/29/13. As of February 2011, DVR Playback has been incorporated into the Persons Using Television (PUT) Statistic.
Metrics for Using a DVD/Blu Ray Device and Using a Game Console are based on when these devices are in use for any purpose, not just for accessing media content. For example, Using a Game Console will also include time when the game console is being
used to play video games.
19Copyright © 2013 The Nielsen Company THE CROSS-PLATFORm REPORT | Q3 2013
ONlINE METHOdOlOgY
In July 2011 an improved hybrid methodology was introduced in Nielsen’s NetView and VideoCensus product. This methodology combines a census level accounting of page views and video streams where Nielsen measurement tags have been deployed in order to project audience and behavior to the full universe of all Internet users. For VideoCensus, the portion of the total video streams calibrated by census data, previously allocated to Home/Work computers, are now allocated to other devices and locations such as smartphones and viewing outside of home and work. This change affects both “Watching Video on the Internet” and “Using the Internet” figures. Beginning in Q1 2012, Cross-Platform metrics are derived from the new hybrid panel. Year over year trends are available beginning in Q3 2012. Data should not be trended to previous quarters’ published editions.
Hours:minutes for Internet and video use are based on the universe of persons who used the Internet/watched online video. All Internet figures are weekly or monthly averages over the course of the quarter. All “Using the Internet on a Computer” metrics are derived from Nielsen NetView product, while all “Watching Video on the Internet” metrics are derived from Nielsen VideoCensus product. Watching video on the Internet is a subset of Using the Internet on a computer.
Due to a processing error, YouTube brand-level stream and duration metrics were inflated from May 2012 – May 2013 which impacted “Watching Video on Internet”. The current report contains the corrected metrics for the prior year data in the year over year
comparisons.
rAdIO METHOdOlOgY
AM/FM RADIO METHODOLOGY: Audience estimates for 48 large markets are based on a panel of people who carry a portable device called PPM that passively detects exposure to content that contains inaudible codes embedded within the program content. Audience estimates from the balance of markets and counties in the US are based on surveys of people who record their listening in a written diary for a week.
The estimates in this report are based on RADAR and the National Regional Database. RADAR reports national network radio ratings covering the US using both PPM and Diary measurement and it is based on a rolling one-year average of nearly 400,000 respondents aged 12+ per year. The National Regional Database reports national and regional radio ratings for individual radio stations using both PPM and Diary measurement. It is published twice a year and the annual sample is more than 600,000 respondents aged 12+.
NOTES: Listening to HD radio broadcasts, Internet streams of AM/FM radio stations and Satellite Radio is included the Persons Using Radio estimates in this report where the tuning meets our reporting and crediting requirements. Monthly Time Spent Listening is derived by multiplying the weekly time spent listening estimate by 4.33 (the average number of
weeks in a calendar month).
MObIlE METHOdOlOgY
Mobile video user projection, time spent and composition data are based on survey analysis of past 30 day use during the period. The mobile video audience figures in this report include mobile phone users (aged 13+) who access mobile video through any means (including mobile Web, subscription based,downloads and applications). Beginning in Q1 2012, data reflect enhanced methodology for calculating the Total Minutes spent watching video on a mobile phone. Total Minutes = (median#sessions)*(mean#minutes). All previous quarter/year metrics have been recalculated with new methodology. Data are trendable within this version of the report, but not to previous quarters’ published editions.
Nielsen’s mobile survey reports mobile video usage for those users 13 and older. Thus, 12-17 is T13-17 for all mobile data.
20 Copyright © 2013 The Nielsen Company
SOUrCINg
TAbLES 1, 2, 3, 4 - A wEEk In THE LIFE, OvERALL uSAgE by MEDIuM, MOnTHLy TIME SPEnT by MEDIuM In HOuRS:MInuTES uSERS 2+, MOnTHLy TIME SPEnT by MEDIuM In HOuRS: MInuTES Source: Traditional TV, Timeshifted TV, DVD, Game Consoles 07/01/13 - 09/29/13 via Nielsen NPOWER/NPM Panel, Online 07/01/13 - 09/30/13 via Nielsen Netview and Nielsen VideoCensus, Mobile 07/01/13 - 09/30/13 via Nielsen Mobile Video Report/Mobile Insights. Table 1 is based on the total US population whether or not they have the technology.
Tables 2-4 are based on users of each medium.
TAbLE 5 – CROSS-PLATFORM HOMES RAnkED by In-HOME STREAMIng bEHAvIOR
Source: 07/01/13 - 09/30/13 via Nielsen NPOWER/Cross-Platform Homes Panel for P2+.
TAbLE 6, 7, 8–TELEvISIOn DISTRIbuTIOn SOuRCES, CAbLE/SATELLITE HOMES wITH InTERnET STATuS, DEvICES In Tv HOuSEHOLDS
Source: Based on the Universe Estimates for the 15th of each month within the quarter via
Nielsen NPOWER/NPM Panel.
TAbLE 9 - TELEvISIOn DISTRIbuTIOn SOuRCES - PERCEnTAgE OF HOuSEHOLDS
Source: Based on the scaled installed counts for 07/01/13 - 09/29/13 via Nielsen
NPOWER/NPM Panel.
EXHIbIT 1 – AvERAgE TIME SPEnT PER PERSOn PER DAy
Source: Daily time spent based on ratings, 07/01/13 - 09/29/13 vs. corresponding
quarters in prior years via Nielsen NPOWER/NPM Panel.
21Copyright © 2013 The Nielsen Company THE CROSS-PLATFORm REPORT | Q3 2013
EXHIbIT 2 – MObILE DEvICE PEnETRATIOn by ETHnICITy
Source: Mobile 07/01/13 - 09/30/13 via Nielsen Mobile Insights.
PAgES 4-8 - ALL DATA bASED On uSERS OF EACH MEDIuM a year in review: weekly and monthly time spentAM/FM Radio: Radar 118, June ’12- June ’13, M-Su Total Day, P12+. TV, Online and Mobile: NPower NPM, Netview, Video Census P2+; Mobile Video Report/Mobile Insights P13+, July ‘12 – June ’13.
Percent of Time spent by Platform by Hour AM/FM Radio: National Respondent Level Data, 03/28/13 – 06/19/13, M-SU Total Day, Percent AQH Listening by Hour, P18+ TV, Online and Mobile: NPower NPM, Netview, Mobile P18+, Q2 2013
How Media usage Varies by demographicAM/FM Radio: Radar 118, June ’12- June ’13, M-Su Total Day, P18+.TV, Online and Mobile: NPower NPM, Netview, Mobile Insights P18+, June ‘12 – June ’13
a Closer look at listeningAM/FM Radio: Portable People Meter, 06/20/13 – 09/11/2013, Percent of AQH Persons by listening location, P6+.
AbOuT nIELSEn Nielsen Holdings N.V. (NYSE: NLSN) is a global information and measurement company
with leading market positions in marketing and consumer information, television and
other media measurement, online intelligence, mobile measurement, trade shows
and related properties. Nielsen has a presence in approximately 100 countries, with
headquarters in New York, USA and Diemen, the Netherlands.
For more information, visit www.nielsen.com.
Copyright © 2013 The Nielsen Company. All rights reserved. Nielsen and the Nielsen logo
are trademarks or registered trademarks of CZT/ACN Trademarks, L.L.C. Other product
and service names are trademarks or registered trademarks of their respective companies.
13/7212

22