Cross Comparisons of CFD Pred iction for Wind Environment · Cross Comparisons of CFD Pred iction...
10
Cross Comparisons of CFD Prediction for Wind Environment at Pedestrian Level around Buildings Part 2 : Comparison of Results for Flowfield around Building Complex in Actual Urban Area Yoshihide Tominaga 1) Ryuichiro Yoshie 2) Akashi Mochida 3) Hiroto Kataoka 4) Kazuyoshi Harimoto 5) Tsuyoshi Nozu 6) 1) Niigata Institute of Technology, Fujihashi 1719, Kashiwazaki-City, Niigata, Japan ; [email protected] 2) Tokyo Polytechnic University, Iiyama 1583, Atsugi-City, Kanagawa, Japan ; [email protected] 3) Tohoku University, Aoba 06, Aramaki, Aoba-ku, Sendai-City, Miyagi, Japan ; [email protected] 4) Technical Research Institute, Obayashi Corp., Shimokiyoto 4-640, Kiyose-City, Tokyo, Japan ; [email protected] 5) Technology Center, Taisei Corp., Nasecho 344-1, Totsuka-ku, Yokohama, Japan ; [email protected] 6) Institute of Technology, Shimizu Corp., Echujima 3-4-17, Koto-ku, Tokyo, Japan ; [email protected] ABSTRACT This paper compares the results of wind environments at pedestrian level within two types of building complexes in actual urban areas obtained by different CFD codes and grid systems. The first part describes the results for a flowfield in an actual urban area in Niigata, where low-rise houses are jammed closely together. Wind tunnel experiments and three types of CFD prediction with different grid systems were performed to predict the wind speed distribution and to assess the pedestrian wind environment. The latter part of the paper describes the results of CFD prediction for the flowfield around a high-rise building complex in the Shinjuku Sub-central area. For this flowfield, detailed wind tunnel experiments and the field measurements were carried out in cooperation with many research organizations. The validity of the prediction accuracy of CFD was assessed by comparison with these results. INTRODUCTION In previous studies [1-3], we reported results of bench mark tests for relatively simple shapes such as single buildings and relatively regular model urban blocks. In actual urban areas, however, buildings have complicated shapes and are distributed in an irregular manner. In order to accurately reproduce them in CFD simulation, a great number of meshes are required. In particular, with an orthogonal structured grid system, it is difficult to provide a grid configuration that matches well with the building configuration, and special care must be taken to allow for the influence of mismatching on the prediction accuracy. This problem can be solved with an unstructured grid system, although there are some difficulties in generating a suitable grid discretization. Furthermore, for the wind environment in urban areas, prediction is normally made for 16 wind directions on two patterns, i.e. before and after construction of the planned building. In some
Transcript of Cross Comparisons of CFD Pred iction for Wind Environment · Cross Comparisons of CFD Pred iction...

Cross Comparisons of CFD Prediction for Wind Environment at Pedestrian Level around Buildings
Part 2 : Comparison of Results for Flowfield around Building Complex in Actual Urban Area
Yoshihide Tominaga1) Ryuichiro Yoshie2) Akashi Mochida3) Hiroto Kataoka4) Kazuyoshi Harimoto5) Tsuyoshi Nozu6)
1) Niigata Institute of Technology, Fujihashi 1719, Kashiwazaki-City, Niigata, Japan ;
[email protected] 2) Tokyo Polytechnic University, Iiyama 1583, Atsugi-City, Kanagawa, Japan ;
[email protected] 3) Tohoku University, Aoba 06, Aramaki, Aoba-ku, Sendai-City, Miyagi, Japan ;
[email protected] 4) Technical Research Institute, Obayashi Corp., Shimokiyoto 4-640, Kiyose-City, Tokyo,
Japan ; [email protected] 5) Technology Center, Taisei Corp., Nasecho 344-1, Totsuka-ku, Yokohama, Japan ;
[email protected] 6) Institute of Technology, Shimizu Corp., Echujima 3-4-17, Koto-ku, Tokyo, Japan ;
[email protected] ABSTRACT
This paper compares the results of wind environments at pedestrian level within two types of building complexes in actual urban areas obtained by different CFD codes and grid systems. The first part describes the results for a flowfield in an actual urban area in Niigata, where low-rise houses are jammed closely together. Wind tunnel experiments and three types of CFD prediction with different grid systems were performed to predict the wind speed distribution and to assess the pedestrian wind environment. The latter part of the paper describes the results of CFD prediction for the flowfield around a high-rise building complex in the Shinjuku Sub-central area. For this flowfield, detailed wind tunnel experiments and the field measurements were carried out in cooperation with many research organizations. The validity of the prediction accuracy of CFD was assessed by comparison with these results.
INTRODUCTION
In previous studies [1-3], we reported results of bench mark tests for relatively simple shapes such as single buildings and relatively regular model urban blocks. In actual urban areas, however, buildings have complicated shapes and are distributed in an irregular manner. In order to accurately reproduce them in CFD simulation, a great number of meshes are required. In particular, with an orthogonal structured grid system, it is difficult to provide a grid configuration that matches well with the building configuration, and special care must be taken to allow for the influence of mismatching on the prediction accuracy. This problem can be solved with an unstructured grid system, although there are some difficulties in generating a suitable grid discretization.
Furthermore, for the wind environment in urban areas, prediction is normally made for 16 wind directions on two patterns, i.e. before and after construction of the planned building. In some
situations, it is necessary to consider protection against wind such as by planting trees. This increases the number of cases that need to be considered, and calculation accuracy must be maintained under restrictive conditions for practical application.
The first part of this paper describes the results for the flowfield in an actual urban area in Niigata, where low-rise houses are jammed closely together. Wind tunnel experiments and three types of CFD prediction with different grid systems were performed to predict the wind speed distribution and to assess the pedestrian wind environment. The latter part of the paper concerns the results of CFD prediction for the flowfield around a high-rise building complex in the Shinjuku Sub-central area. For this flowfield, detailed wind tunnel experiments and field measurements were carried out in cooperation with many research organizations. The validity of the prediction accuracy of CFD was assessed by comparison with these results.
RESULTS OF FLOWFIELD IN ACTUAL URBAN AREA(NIIGATA)
Analyzed urban area model and outline of wind tunnel experiment
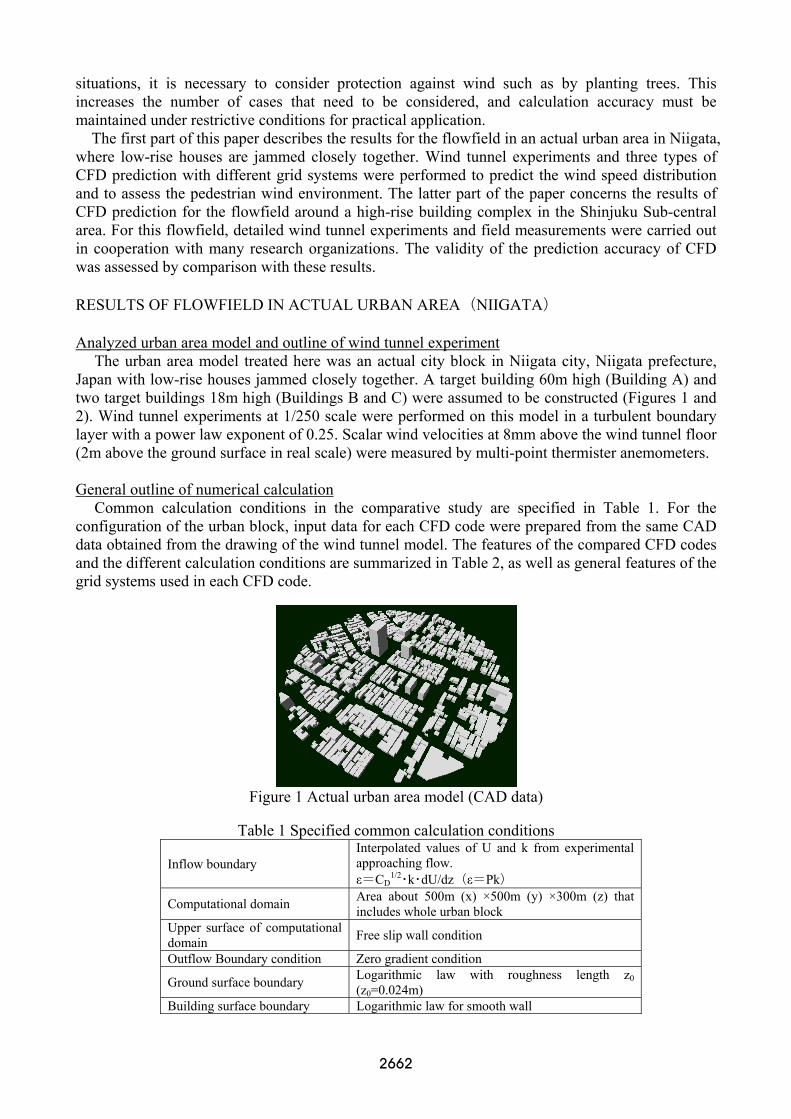
The urban area model treated here was an actual city block in Niigata city, Niigata prefecture, Japan with low-rise houses jammed closely together. A target building 60m high (Building A) and two target buildings 18m high (Buildings B and C) were assumed to be constructed (Figures 1 and 2). Wind tunnel experiments at 1/250 scale were performed on this model in a turbulent boundary layer with a power law exponent of 0.25. Scalar wind velocities at 8mm above the wind tunnel floor (2m above the ground surface in real scale) were measured by multi-point thermister anemometers.
General outline of numerical calculation
Common calculation conditions in the comparative study are specified in Table 1. For the configuration of the urban block, input data for each CFD code were prepared from the same CAD data obtained from the drawing of the wind tunnel model. The features of the compared CFD codes and the different calculation conditions are summarized in Table 2, as well as general features of the grid systems used in each CFD code.
Figure 1 Actual urban area model (CAD data)
Table 1 Specified common calculation conditions
Inflow boundary Interpolated values of U and k from experimental approaching flow. ε=CD
1/2・k・dU/dz(ε=Pk)
Computational domain Area about 500m (x) ×500m (y) ×300m (z) that includes whole urban block
Upper surface of computational domain Free slip wall condition
Outflow Boundary condition Zero gradient condition
Ground surface boundary Logarithmic law with roughness length z0 (z0=0.024m)
Building surface boundary Logarithmic law for smooth wall
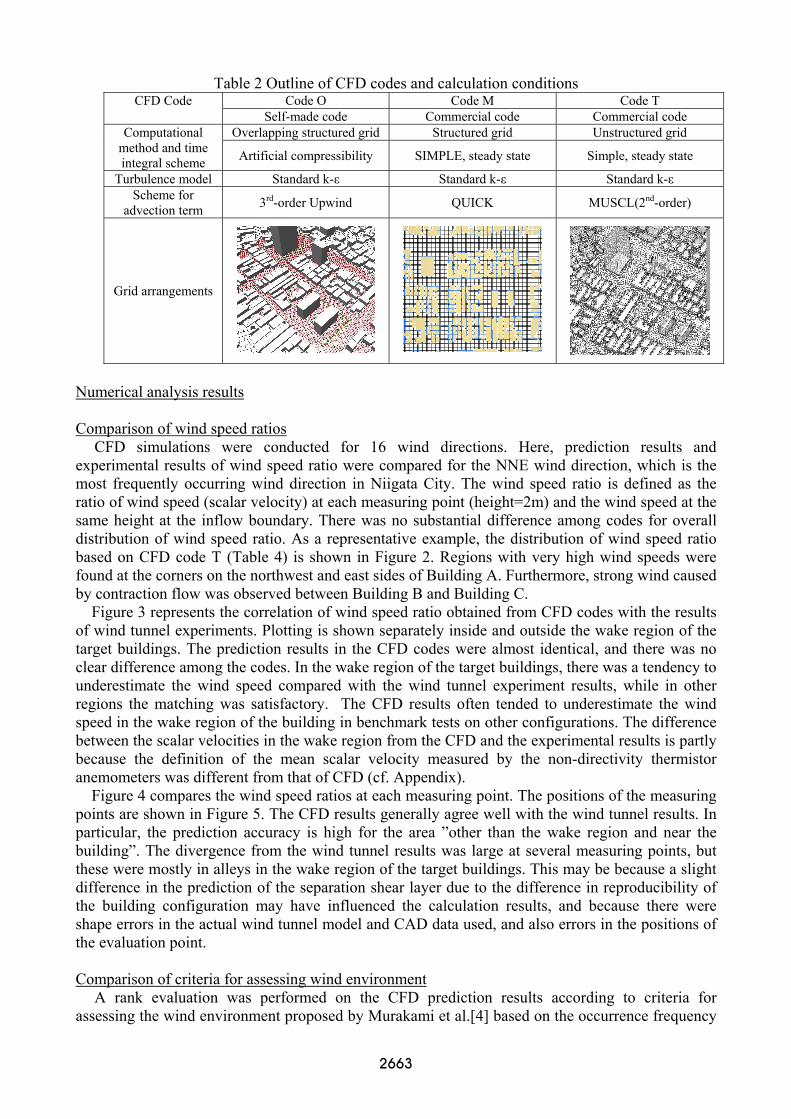
Table 2 Outline of CFD codes and calculation conditions Code O Code M Code T CFD Code
Self-made code Commercial code Commercial code Overlapping structured grid Structured grid Unstructured grid Computational
method and time integral scheme Artificial compressibility SIMPLE, steady state Simple, steady state
Turbulence model Standard k-ε Standard k-ε Standard k-ε Scheme for
advection term 3rd-order Upwind QUICK MUSCL(2nd-order)
Grid arrangements
Numerical analysis results Comparison of wind speed ratios
CFD simulations were conducted for 16 wind directions. Here, prediction results and experimental results of wind speed ratio were compared for the NNE wind direction, which is the most frequently occurring wind direction in Niigata City. The wind speed ratio is defined as the ratio of wind speed (scalar velocity) at each measuring point (height=2m) and the wind speed at the same height at the inflow boundary. There was no substantial difference among codes for overall distribution of wind speed ratio. As a representative example, the distribution of wind speed ratio based on CFD code T (Table 4) is shown in Figure 2. Regions with very high wind speeds were found at the corners on the northwest and east sides of Building A. Furthermore, strong wind caused by contraction flow was observed between Building B and Building C.
Figure 3 represents the correlation of wind speed ratio obtained from CFD codes with the results of wind tunnel experiments. Plotting is shown separately inside and outside the wake region of the target buildings. The prediction results in the CFD codes were almost identical, and there was no clear difference among the codes. In the wake region of the target buildings, there was a tendency to underestimate the wind speed compared with the wind tunnel experiment results, while in other regions the matching was satisfactory. The CFD results often tended to underestimate the wind speed in the wake region of the building in benchmark tests on other configurations. The difference between the scalar velocities in the wake region from the CFD and the experimental results is partly because the definition of the mean scalar velocity measured by the non-directivity thermistor anemometers was different from that of CFD (cf. Appendix).
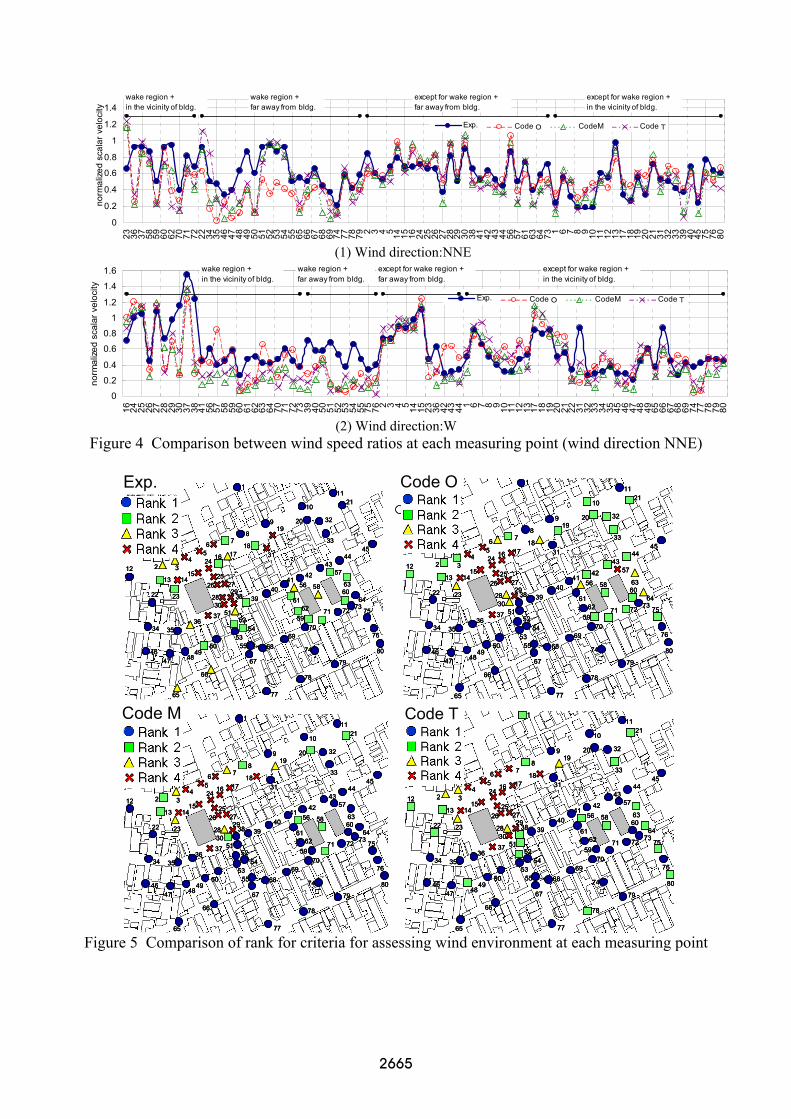
Figure 4 compares the wind speed ratios at each measuring point. The positions of the measuring points are shown in Figure 5. The CFD results generally agree well with the wind tunnel results. In particular, the prediction accuracy is high for the area ”other than the wake region and near the building”. The divergence from the wind tunnel results was large at several measuring points, but these were mostly in alleys in the wake region of the target buildings. This may be because a slight difference in the prediction of the separation shear layer due to the difference in reproducibility of the building configuration may have influenced the calculation results, and because there were shape errors in the actual wind tunnel model and CAD data used, and also errors in the positions of the evaluation point. Comparison of criteria for assessing wind environment
A rank evaluation was performed on the CFD prediction results according to criteria for assessing the wind environment proposed by Murakami et al.[4] based on the occurrence frequency

of daily maximum gust wind speed using observation data from the Niigata Regional Meteorological Observatory. The results are summarized in Figure 5. The gust factor G.F. was assumed to be 2.5. Including the results at the measuring points with rank 4 on the northeast and south sides of Building A, the CFD results generally showed good matching with the wind tunnel experiment results. However, as described above, there were differences between some of the experimental results and CFD codes for the measuring points near low-rise houses in alleys or along large avenues.
Wake region
In the vicinity of Bldg.
Target Bldg.(60m)
Target Bldg.(10m)
Wake region
In the vicinity of Bldg.
Target Bldg.(60m)
Target Bldg.(10m)
(1) Wind direction: NNE (2) Wind direction: W
Figure 2 Distribution of wind speed ratio near ground surface (z=2m)(Code T)
0
0.2
0.4
0.6
0.8
1
1.2
1.4
0 0.2 0.4 0.6 0.8 1 1.2 1.4風洞実験
CFD
後流域
後流域以外
コードO
Experiment
● wake region△ except for
wake region
0
0.2
0.4
0.6
0.8
1
1.2
1.4
0 0.2 0.4 0.6 0.8 1 1.2 1.4風洞実験
CFD
後流域
後流域以外
コードM
Experiment
● wake region△ except for
wake region
0
0.2
0.4
0.6
0.8
1
1.2
1.4
0 0.2 0.4 0.6 0.8 1 1.2 1.4風洞実験
CFD
後流域
後流域以外
コードT
Experiment
● wake region△ except for
wake region
(a) Code O (b) Code M (c) Code T
(1) Wind direction: NNE
0
0.2
0.4
0.6
0.8
1
1.2
1.4
0 0.2 0.4 0.6 0.8 1 1.2 1.4Exp.
CFD
(C
ode M
)
wake region
except forwake region
0
0.2
0.4
0.6
0.8
1
1.2
1.4
0 0.2 0.4 0.6 0.8 1 1.2 1.4Exp.
CFD
(C
ode T
)
wake region
except forwake region
0
0.2
0.4
0.6
0.8
1
1.2
1.4
0 0.2 0.4 0.6 0.8 1 1.2 1.4Exp.
CFD
(C
ode O
)
wake region
except forwake region
(a) Code O (b) Code M (c) Code T
(2) Wind direction: W Figure 3 Correlation between CFD and experimental wind speed ratios
wake region wake region
in the vicinity of bldg.
target bldg.(60m)
target bldg.(18m)
The wind velocity
ratio
N
wake region wake region
in the vicinity of bldg.
target bldg.(60m)
target bldg.(18m)
The wind velocity
ratio
N
A B C
Wake region Wake region
Target Bldg. (60m)
Target Bldg. (18m)
In the vicinity of Bldg.
0
0.2
0.4
0.6
0.8
1
1.2
1.4
23 36 37 58 59 60 62 70 71 72 22 34 35 46 47 48 49 50 51 52 53 54 55 65 66 67 68 69 74 77 78 79 2 3 4 5 14 15 16 24 25 26 27 28 29 30 38 41 42 43 44 56 57 61 63 64 73 1 6 7 8 9 10 11 12 13 17 18 19 20 21 31 32 33 39 40 45 75 76 80
norm
alize
d sc
alar
vel
ocity
Exp. Code O CodeM Code T
wake region +in the vicinity of bldg.
wake region +far away from bldg.
except for wake region +far away from bldg.
except for wake region +in the vicinity of bldg.
(1) Wind direction:NNE
0
0.2
0.4
0.6
0.8
1
1.2
1.4
1.6
16 24 25 26 27 28 29 30 37 38 41 56 57 58 59 60 61 62 63 64 70 71 72 73 39 40 50 51 52 53 54 55 75 76 2 3 4 5 14 15 23 36 42 43 44 1 6 7 8 9 10 11 12 13 17 18 19 20 21 22 31 32 33 34 35 45 46 47 48 49 65 66 67 68 69 74 77 78 79 80
norm
alize
d sc
alar
vel
ocity
Exp. Code O CodeM Code T
wake region +in the vicinity of bldg.
wake region +far away from bldg.
except for wake region +in the vicinity of bldg.
except for wake region +far away from bldg.
(2) Wind direction:W
Figure 4 Comparison between wind speed ratios at each measuring point (wind direction NNE)
実験結果
ランク1ランク2ランク3ランク4
ランク1ランク2ランク3ランク4
11
12
13 1415
16 1718
1920
5152
5354
55
56
57
58
59
6061
62
63
64
65
66
67
6869
70
31
32
33
34 3536
37
38 3940
1
2 34
56 7
8
9
1021
22 23
24
2526 27
2829
30
4142
4344
45
4647 48
4950
71 72 73
74
75
76
77
78
79
80
11
12
13 1415
16 1718
1920
11
12
13 1415
16 1718
1920
5152
5354
55
56
57
58
59
60
5152
5354
55
56
57
58
59
6061
62
63
64
65
66
67
6869
70
6162
63
64
65
66
67
6869
70
31
32
33
34 3536
37
38 3940
31
32
33
34 3536
37
38 3940
1
2 34
56 7
8
9
10
1
2 34
56 7
8
9
1021
22 23
24
2526 27
2829
30
21
22 23
24
2526 27
2829
30
4142
4344
45
4647 48
4950
4142
4344
45
4647 48
4950
71 72 73
74
75
76
77
78
79
80
71 72 73
74
75
76
77
78
79
80
Exp.
コードO
ランク1ランク2ランク3ランク4
ランク1ランク2ランク3ランク4
11
12
13 1415
16 1718
1920
5152
5354
55
56
57
58
59
6061
62
63
64
65
66
67
6869
70
31
32
33
34 3536
37
38 3940
1
2 34
56 7
8
9
1021
22 23
24
2526 27
2829
30
4142
4344
45
4647 48
4950
71 72 73
74
75
76
77
78
79
80
11
12
13 1415
16 1718
1920
11
12
13 1415
16 1718
1920
5152
5354
55
56
57
58
59
60
5152
5354
55
56
57
58
59
6061
62
63
64
65
66
67
6869
70
6162
63
64
65
66
67
6869
70
31
32
33
34 3536
37
38 3940
31
32
33
34 3536
37
38 3940
1
2 34
56 7
8
9
10
1
2 34
56 7
8
9
1021
22 23
24
2526 27
2829
30
21
22 23
24
2526 27
2829
30
4142
4344
45
4647 48
4950
4142
4344
45
4647 48
4950
71 72 73
74
75
76
77
78
79
80
71 72 73
74
75
76
77
78
79
80
Code O
ードM
ランク1ランク2ランク3ランク4
ランク1ランク2ランク3ランク4
11
12
13 1415
16 1718
1920
5152
5354
55
56
57
58
59
6061
62
63
64
65
66
67
6869
70
31
32
33
34 3536
37
38 3940
1
2 34
56 7
8
9
1021
22 23
24
2526 27
2829
30
4142
4344
45
4647 48
4950
71 72 73
74
75
76
77
78
79
80
11
12
13 1415
16 1718
1920
11
12
13 1415
16 1718
1920
5152
5354
55
56
57
58
59
60
5152
5354
55
56
57
58
59
6061
62
63
64
65
66
67
6869
70
6162
63
64
65
66
67
6869
70
31
32
33
34 3536
37
38 3940
31
32
33
34 3536
37
38 3940
1
2 34
56 7
8
9
10
1
2 34
56 7
8
9
1021
22 23
24
2526 27
2829
30
21
22 23
24
2526 27
2829
30
4142
4344
45
4647 48
4950
4142
4344
45
4647 48
4950
71 72 73
74
75
76
77
78
79
80
71 72 73
74
75
76
77
78
79
80
Code M
ードT
ランク1ランク2ランク3ランク4
ランク1ランク2ランク3ランク4
11
12
13 1415
16 1718
1920
5152
5354
55
56
57
58
59
6061
62
63
64
65
66
67
6869
70
31
32
33
34 3536
37
38 3940
1
2 34
56 7
8
9
1021
22 23
24
2526 27
2829
30
4142
4344
45
4647 48
4950
71 72 73
74
75
76
77
78
79
80
11
12
13 1415
16 1718
1920
11
12
13 1415
16 1718
1920
5152
5354
55
56
57
58
59
60
5152
5354
55
56
57
58
59
6061
62
63
64
65
66
67
6869
70
6162
63
64
65
66
67
6869
70
31
32
33
34 3536
37
38 3940
31
32
33
34 3536
37
38 3940
1
2 34
56 7
8
9
10
1
2 34
56 7
8
9
1021
22 23
24
2526 27
2829
30
21
22 23
24
2526 27
2829
30
4142
4344
45
4647 48
4950
4142
4344
45
4647 48
4950
71 72 73
74
75
76
77
78
79
80
71 72 73
74
75
76
77
78
79
80
Code T
Figure 5 Comparison of rank for criteria for assessing wind environment at each measuring point

RESULTS OF FLOWFIELD AROUND HIGH-RISE BUILDING COMPLEX IN ACTUAL URBAN AREA (SHINJUKU) General description of wind tunnel experiment and field measurement to be compared
To verify the CFD prediction results, it is important to compare them not only with the wind tunnel experiment results but also with the field measurement results. However, adequate field measurements are not always available, and they have almost never been performed in the past. Thus, a benchmark test was conducted in the Shinjuku Sub-central Area in Tokyo, Japan in its early development stage, for which detailed wind tunnel experiments and field measurements were carried out in cooperation with many research organizations during construction [5,6], and the validity of the CFD prediction accuracy was assessed.
The CFD simulations were carried out based on the conditions of Experiments carried out in 1977. Field measurements were carried out from December 1975 to November 1983. The present CFD simulations were performed for 1977 measurements, when the situations of field measurement were similar to those of the wind tunnel experiment model. In the field measurement, three-cup anemometers were used. The measurement heights differed according to the measuring point, being 3 - 9m above the ground surface. The reproduced urban area and the measuring point distribution are shown in Figure 6. General outline of numerical calculation
In the study on the urban area of Niigata City, common calculation conditions were designated. For the configuration of urban blocks, no wind tunnel experiment models at the time of the measurement were available. Thus, CADs on the urban area configuration and topography at the time of measurement were obtained from drawings, photographs, and white maps at the time of measurement. These data were then used to obtain input data of the CFD analysis code. Because no details were available of the models on topographical height difference, reproduction was made stepwise every 5 meters by referring to the maps used at the time of the measurement. The CAD data thus prepared are shown in Figure 7. Figure 8 shows the grid arrangements of the CFD codes. Here, only CFD_A uses a structured grid system, while the others are based on a non-structured grid. However, CFD_A uses an overlapping grid, and the range of grid resolution in different horizontal regions is shown in Figure 6.
In the comparison given below, measurement values for standard wind speeds of 5m/s or more were extracted from the observation data in the year 1977. The wind speed ratio with the standard wind speed was obtained for each measuring point, and the average value for each wind direction was used as the measurement value.
Figure 6 Reproduced urban area and measuring points
10
9 87
6
5
3
1418
1920
2
1
21
13
2223
243031
3217 161533
29
25
26
27
28
11
D
C
原点
CFD_A に
おける
中間領域
市街地再現
領域外周
CFD_A
における
詳細領域
C
DFinely divided regionin CFD_A
Coarsely divided regionin CFD_A
Intermediateregionin CFD_A
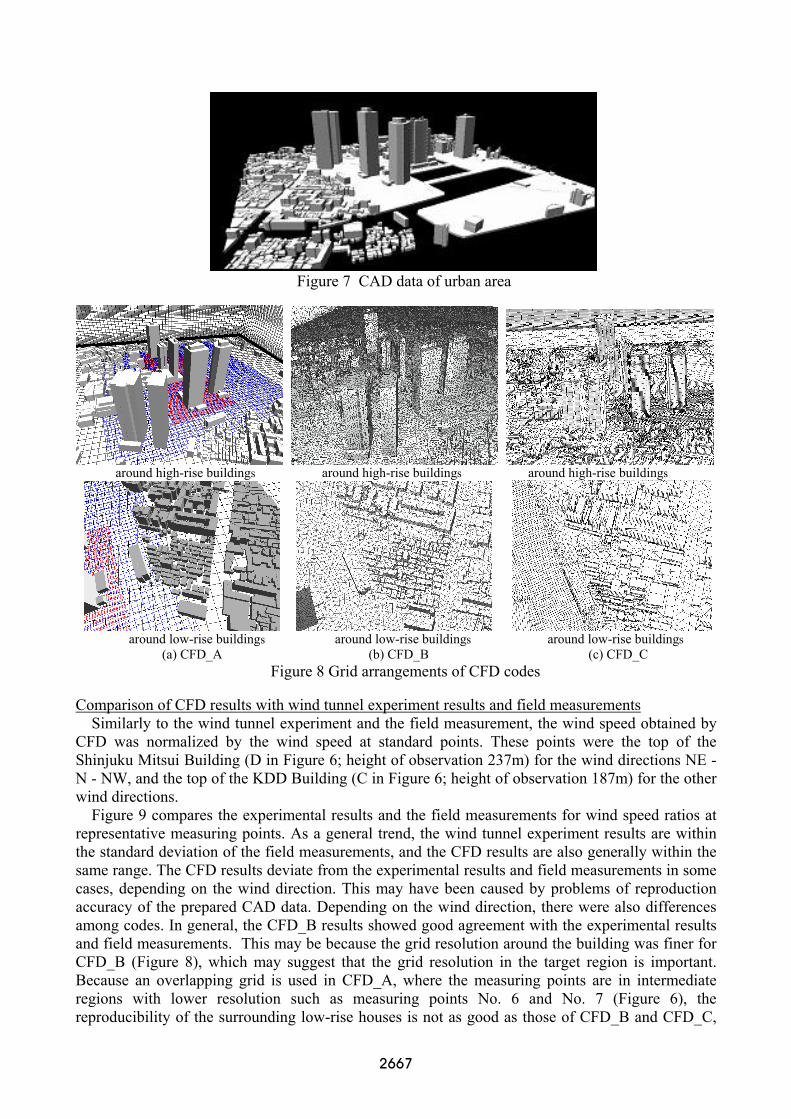
Figure 7 CAD data of urban area
around high-rise buildings around high-rise buildings around high-rise buildings
around low-rise buildings around low-rise buildings around low-rise buildings
(a) CFD_A (b) CFD_B (c) CFD_C Figure 8 Grid arrangements of CFD codes
Comparison of CFD results with wind tunnel experiment results and field measurements
Similarly to the wind tunnel experiment and the field measurement, the wind speed obtained by CFD was normalized by the wind speed at standard points. These points were the top of the Shinjuku Mitsui Building (D in Figure 6; height of observation 237m) for the wind directions NE - N - NW, and the top of the KDD Building (C in Figure 6; height of observation 187m) for the other wind directions.
Figure 9 compares the experimental results and the field measurements for wind speed ratios at representative measuring points. As a general trend, the wind tunnel experiment results are within the standard deviation of the field measurements, and the CFD results are also generally within the same range. The CFD results deviate from the experimental results and field measurements in some cases, depending on the wind direction. This may have been caused by problems of reproduction accuracy of the prepared CAD data. Depending on the wind direction, there were also differences among codes. In general, the CFD_B results showed good agreement with the experimental results and field measurements. This may be because the grid resolution around the building was finer for CFD_B (Figure 8), which may suggest that the grid resolution in the target region is important. Because an overlapping grid is used in CFD_A, where the measuring points are in intermediate regions with lower resolution such as measuring points No. 6 and No. 7 (Figure 6), the reproducibility of the surrounding low-rise houses is not as good as those of CFD_B and CFD_C,

and this may have influenced the prediction results. Next, Figure 10 compares the wind speed ratios at the measuring points with wind direction S. For the reasons described above, there were differences at some measuring points in CFD_A. In general, however, the CFD results showed good matching with the experimental results and the field measurements.
0.0
0.5
1.0
NE E SE S SW W NW N
風向
風
速
比
CFD_A
CFD_B
CFD_C
Win
d sp
eed
ratio
Wind direction
* Field meas.(mean) Field meas.(±σ)
○ Target wind tunnel exp. ● Other wind tunnel exp.
No.6
0.0
0.5
1.0
NE E SE S SW W NW N風向
風速比
CFD_A
CFD_B
CFD_C
vcccc
Win
d sp
eed
ratio
Wind direction
No.7
0.0
0.5
1.0
NE E SE S SW W NW N
風向
風速比
CFD_A
CFD_B
CFD_C
Win
d sp
eed
ratio
Wind direction
No.13
0.0
0.5
1.0
NE E SE S SW W NW N
風向
風速比
CFD_A
CFD_B
CFD_C
Win
d sp
eed
ratio
Wind direction
No.15
Figure 9 Comparison of wind speed ratio for 16 wind directions
0
0.2
0.4
0.6
0.8
1
23 12 27 28 29 36 14 26 7 33 13 15
測定点
風速
比
実測(平均値)
実測(+σ)
実測(-σ)
風洞実験
CFD_A
CFD_B
CFD_C
Measuring Point
Win
d sp
eed
ratio
CFD_A
CFD_B
CFD_C
field meas.(mean)
field meas.(+σ)
field meas.(-σ)
wind tunnel
Figure 10 Comparison of wind speed ratio at each measuring point with wind direction S
CONCLUSION
This paper has compared results of wind environments and field measurements at pedestrian
level within two types of building complexes in actual urban areas obtained by different CFD codes and grid systems.
The first part compared the prediction results for a flowfield in the actual urban area by CFD with the results of a wind tunnel experiment. The following findings were obtained: ・ Under common conditions with grid resolution around a target building, there was no
substantial difference among codes with different spatial discretizations. ・In the high-velocity area near a high-rise building, the CFD results generally agreed closely with
the results of the wind tunnel experiment. ・In the wake region of the target buildings, there was a tendency to underestimate the wind speed
compared with the results of the wind tunnel experiment. This tendency corresponds with the results of the flowfield around a single building model.

・For comparison of criteria for assessing the wind environment, the CFD results generally showed good matching with the wind tunnel experiment results, although there were differences for measuring points near low-rise houses in alleys or along large avenues.
The latter part of the paper examined the prediction accuracy of CFD for the flowfield around high-rise buildings in the Shinjuku Sub-central area in comparison with the results of the wind tunnel experiment and field measurements. The following results were obtained:
・In regions around the high-rise buildings with sufficient grid resolution, the CFD results agreed closely with the wind tunnel experiment results and field measurements.
・However, in regions such as around low-rise houses where the grid resolution strongly influences the reproducibility of configurations, differences were observed in the CFD results due to differences in grid resolution .
・CAD data used as the basis for the urban block model in the CFD analysis did not completely match the wind tunnel model and real urban block. This may have been one of the causes of the difference among the experimental results, field measurement results, and the CFD analysis results.
The results presented in this paper will be used as a basic database for the guideline for CFD prediction of pedestrian wind environment prepared by the working group in the Architectural Institute of Japan. We shall be very pleased if this guideline is helpful in achieving the best results within the current limitations of prediction by CFD as described above.
ACKNOWLEDGEMENT
The authors would like to express their gratitude to the members of the “Working Group for Preparation of Wind Environment Evaluation Guideline based on CFD” established in Architectural Institute of Japan.[cf. Note]
NOTE
The working group members are: A. Mochida (Chair, Tohoku Univ.), Y.Tominaga (Secretary, Niigata Inst. of Tech.), Y Ishida (Kajima Corp.), T.Ishihara (Univ. of Tokyo), K. Uehara (National Inst. of Environ. Studies), R. Ooka (I.I.S., Univ. of Tokyo), H. Kataoka (Obayashi Corp.), T. Kurabuchi (Tokyo Univ. of Sci.), N. Kobayashi (Tokyo Polytechnic Univ.), N. Tuchiya (Takenaka Corp.), Y. Nonomura (Fujita Corp.), T. Nozu (Shimizu Corp.), K. Harimoto (Taisei Corp.), K. Hibi (Shimizu Corp.), S. Murakami (Keio Univ.), R. Yoshie (Tokyo Polytechnic Univ.) APPENDIX The mean scalar velocity measured in the wind tunnel using a non-directive thermistor anemometer (Sexp) is regarded as the time averaged instantaneous scalar velocity, which can be expressed as: Sexp=<(u2+v2+w2)1/2>. However, the mean scalar velocity given from CFD (SCFD) is calculated from the time averaged velocity vector, namely, SCFD=(<u>2 +<v>2+<w>2)1/2. Thus, the output of the thermistor anemometer is larger than that given by CFD. Sexp=<(u2+v2+w2)1/2>
=<{(<u>+u’)2+(<v>+v’)2+(<w>+w’)2}1/2> =<(<u>2+<v>2+<w>2+<u’2+v’2+w’2>)1/2> =(<u>2+<v>2+<w>2+2k)1/2
=(SCFD2+2k)1/2 Here, u,v,w: three components of instantaneous velocity vector, <f>: time-averaged value of f, f’=f-<f>.

REFERENCES [1] Mochida, A., Tominaga, Y., Murakami, S., Yoshie, R., Ishihara, T., and Ooka, R. (2002)
Comparison of various k-ε models and DSM applied to flow around a high-rise building -report on AIJ cooperative project for CFD prediction on wind environment, Wind&Structures, Vol.5, No.2~4, pp.227-244.
[2] Shirasawa, T., Mochida, A., Tominaga, Y., Yoshie, R., Kataoka, H., Nozu T. and Yoshino, H. (2003) Development of CFD method for predicting wind environment around a high-rise building, Part2: The cross comparison of CFD results on the flow field around a 4:4:1 prism, AIJ Journal of Technology and Design, No.18, 441-446.(written in Japanese)
[3] Yoshie, R., Mochida, A., Tominaga, Y., Kataoka, H. and Yoshikawa, M. (2005) Cross Comparisons of CFD Prediction for Wind Environment at Pedestrian Level around Buildings Part 1 : Comparison of Results for Flow-field around a High-rise Building Located in Surrounding City Blocks, Sixth Asia-Pacific Conference on Wind Engineering, Korea (to be submitted)
[4] Murakami, S., Iwasa, Y., Morikawa Y. (1983) Investigation of statistical characteristics of wind at ground level and criteria for assessing wind-induced discomfort - part � Criteria for assessing wind-induced discomfort, Journal of Architectural Institute of Japan, No. 325, pp.74-84.( in Japanese)
[5]Yoshida, M., Sanada, S., Fujii, K., Asami, Y., Iwasa, Y., Fukao, Y., Kawaguchi, A., and Members of AIJ (1978) Full-scale measurement of environmental wind on New-Shinjuku-Center -Characteristics of wind in built-up area (part1)-, Proceeding of fifth Symposium on wind effects on structures, pp.75-82.(in Japanese)
[6] Asami, Y., Iwasa, Y., Fukao, Y., Kawaguchi, A., Yoshida, M., Sanada, S., Fujii, K., and Members of AIJ (1978) Full-scale measurement of environmental wind on New-Shinjuku-Center -Characteristics of wind in built-up area (part2)-, Proceeding of fifth Symposium on wind effects on structures, pp.83-90.(in Japanese)