Cropwell Bishop Housing Needs Survey Report · CROPWELL BISHOP HOUSING NEEDS SURVEY Midlands Rural...
25
CROPWELL BISHOP HOUSING NEEDS SURVEY Midlands Rural Housing in partnership with Rushcliffe Borough Council and Cropwell Bishop Parish Council May 2011
-
Upload
truongtram -
Category
Documents
-
view
214 -
download
0
Transcript of Cropwell Bishop Housing Needs Survey Report · CROPWELL BISHOP HOUSING NEEDS SURVEY Midlands Rural...
CROPWELL BISHOP
HOUSING NEEDS
SURVEY
Midlands Rural Housing in partnership with
Rushcliffe Borough Council and Cropwell Bishop Parish Council
May 2011
2
Thank you to the residents of Cropwell Bishop parish for their help and support with this survey.
3
CONTENTS Executive Summary 4 1. Introduction 5 2. Purpose of the Survey 5 3. Housing Costs 6 4. Availability of Affordable Housing 7 5. Planning Context 8 6. Respondents’ Details 9 6.1. Age Profile 9 6.2. Household Size & Mix 10 6.3. Tenure of all Respondents 10 6.4. Property Types 11 6.5. Residency 11 6.6. Migration 12 6.7. Timescales 12 7. Local Support for Affordable Housing 13 8. Housing Needs Analysis 14 8.1. Local Connection 14 8.2. Housing Tenure 15 8.3. Registered for Housing? 15 8.4. When is Housing Required? 16 8.5. How long is it required for? 16 8.6. Reason for Requiring Alternative Housing 17 9. Financial Information 17 9.1. Annual Household Income 17 9.2. Source of Income 18 9.3. Level of Savings 18 10. Respondents in Need – Details 19 10.1. Results of Analysis 21 11. Conclusions & Recommendations 22 12. Acknowledgements 24 13. Contact Details 24 Appendix A: Comments Regarding a Small-Scale Development 25
4
Executive Summary
Midlands Rural Housing completed a Housing Needs Survey in Cropwell Bishop during April/May 2011, to assess the housing need in the parish. As well as
requesting specific housing information, the survey asks some general questions relating to the quality of life in the parish.
Midlands Rural Housing works with local authorities and other partners to increase
the availability of affordable homes for local people. Affordable housing may be provided through both rental and shared ownership schemes and is for people with
a strong connection to the parish.
Cropwell Bishop is a popular and sought after village with good amenities, local employment opportunities and good road links to Nottingham and the East Midlands.
The age range of the population is well balanced and there are a high proportion of
families. People settle in the village and tend not to move on readily. This restricts the availability of properties to the open market. Local house prices are not as high as elsewhere in Rushcliffe, but are still unaffordable to those on low incomes.
The existing housing stock is well balanced and provides a selection of small to
medium and large properties, including flats and bungalows. Owner-occupation is popular. There is a reasonable proportion of social housing, however, private rental
property is in short supply and rents are therefore high.
There are considered to be twelve genuine claims expressing a need for affordable housing. Some of these are from families who are living in difficult circumstances, however, the majority are from single people who are living at home and cannot
afford to access the local housing market. They want the opportunity to set up their
own independent homes. The resulting breakdown is:-
7 x 1 or 2 bed houses or flats for Social Rent (with the option of providing 2 for Homebuy). 2 x 3 bed houses for Homebuy
1 x 4 bed house for Social Rent
1 x 2 bed bungalow (physically adapted) for Social Rent
1 x 4 bed bungalow (physically adapted) for Social Rent or Homebuy
Our recommendation is that a mixed development of twelve affordable dwellings should be considered. This development will alleviate the current housing needs in Cropwell Bishop, whilst remaining available to
the parish in perpetuity, to allow for future requirements which may arise.
5
1. Introduction
Midlands Rural Housing works with local authorities and other partners to increase the availability of affordable homes for local people in rural areas. In 2005 MRH
established the Trent Valley Partnership to work closely with authorities in the East Midlands region.
Rushcliffe Borough Council has identified the Trent Valley Partnership as their
preferred partner, for the purpose of undertaking Housing Needs Studies in rural villages and identifying opportunities for the development of affordable housing
within the district. Trent Valley Partnership is now undertaking the fourth year of a
programme of studies on behalf of Rushcliffe Borough Council.
Cropwell Bishop currently has a population of 1,791 in 760 households (2001
census). 800 survey forms were produced for distribution to residents throughout
the parish.
During April 2011, Midlands Rural Housing and Rushcliffe Borough Council worked
together to deliver a Housing Needs Survey form to every household in the village. The return date for the survey was 9th May 2011 and returns were made via a
‘Freepost’ envelope directly to Midlands Rural Housing.
2. Purpose of the Survey
The aim of the survey was to assess the current and future housing needs in the parish of Cropwell Bishop, in order to provide Rushcliffe Borough Council with the
information it requires to formulate plans and anticipate future housing requirements.
6
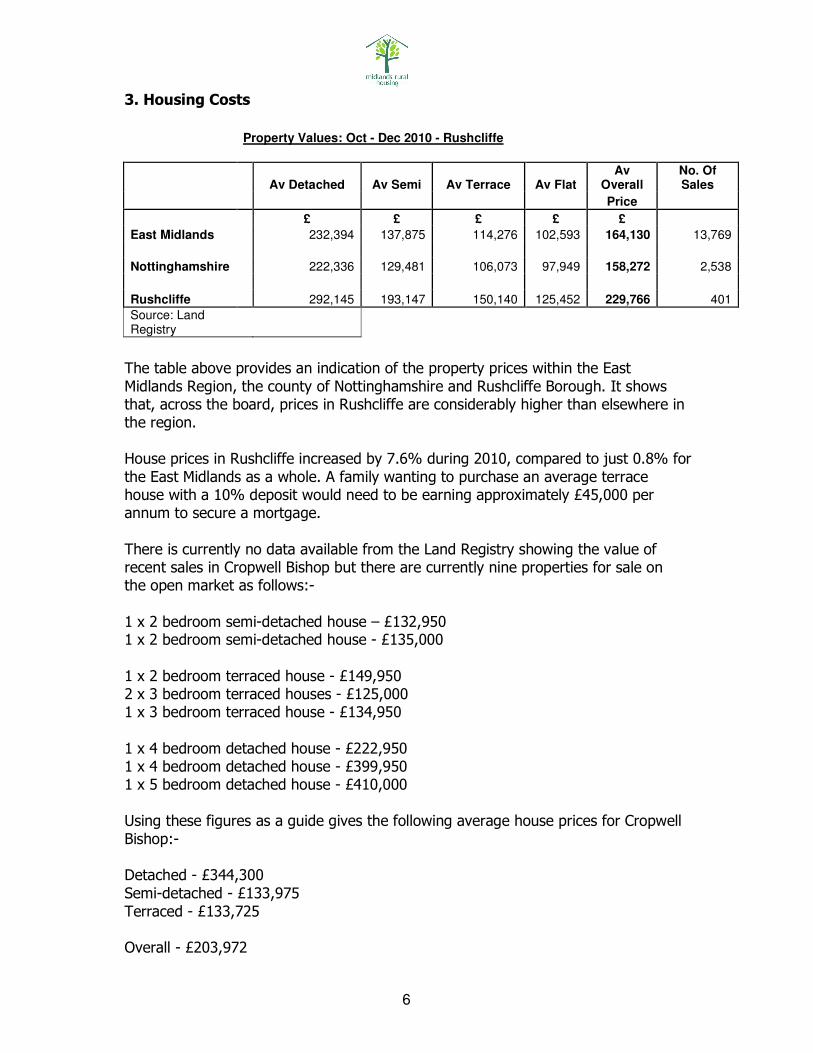
3. Housing Costs
Property Values: Oct - Dec 2010 - Rushcliffe
Av Detached Av Semi Av Terrace Av Flat Av
Overall No. Of Sales
Price
£ £ £ £ £
East Midlands 232,394 137,875 114,276 102,593 164,130 13,769
Nottinghamshire 222,336 129,481 106,073 97,949 158,272 2,538
Rushcliffe 292,145 193,147 150,140 125,452 229,766 401
Source: Land Registry
The table above provides an indication of the property prices within the East
Midlands Region, the county of Nottinghamshire and Rushcliffe Borough. It shows that, across the board, prices in Rushcliffe are considerably higher than elsewhere in the region.
House prices in Rushcliffe increased by 7.6% during 2010, compared to just 0.8% for
the East Midlands as a whole. A family wanting to purchase an average terrace house with a 10% deposit would need to be earning approximately £45,000 per annum to secure a mortgage.
There is currently no data available from the Land Registry showing the value of recent sales in Cropwell Bishop but there are currently nine properties for sale on the open market as follows:-
1 x 2 bedroom semi-detached house – £132,950 1 x 2 bedroom semi-detached house - £135,000
1 x 2 bedroom terraced house - £149,950 2 x 3 bedroom terraced houses - £125,000 1 x 3 bedroom terraced house - £134,950
1 x 4 bedroom detached house - £222,950 1 x 4 bedroom detached house - £399,950 1 x 5 bedroom detached house - £410,000
Using these figures as a guide gives the following average house prices for Cropwell
Bishop:- Detached - £344,300
Semi-detached - £133,975
Terraced - £133,725 Overall - £203,972
7
Making a comparison with the table above, it can be seen that, with the exception of detached houses, property prices in Cropwell Bishop are generally lower than prices
in Rushcliffe but higher than elsewhere in Nottinghamshire. However, a family
wanting to buy an average terraced or semi-detached property with a 10% deposit would need to have an annual household income of around £40,000.
4. Availability of Affordable Housing in Rushcliffe
Housing costs in Rushcliffe are the highest in the County, reflecting the desirability
and prosperity of the Borough. This creates problems of affordability, particularly for new entrants to the housing market.
House prices rose steadily for the 10 years to 2007, declined slightly 2008/09 but
increased by almost 8% during 2010, remaining above the regional average (which has fallen by over 15% since early 2008). The average Rushcliffe house price now stands at almost £230,000 compared to £210,805 in April 2009.
The 2009 SHMA update estimates that 43% of all households in Rushcliffe are unable to afford the entry level owner occupation price of £139,995 (based on 90% mortgage on a lower quartile flat/apartment). The price of a family home is of course, considerably higher. The Borough’s private rented sector is unable to offer much help in making housing costs affordable. An estimated 46% of all households would be unable to afford lowest quartile market rents.
With the primary exception of West Bridgford, Rushcliffe is a predominantly rural Borough, characterised by small towns and interspersed villages. Many historic
villages have Conservation Area status due to their unique character.
Rushcliffe Borough Councils’ Housing Strategy 2009- 2016 identifies that there are significant issues of rural housing need, particularly around affordability, and the inability of local families to access housing in their own communities. Lack of
employment opportunities, school closures and poor access to local services are
contributing to this problem.
4.1 Cropwell Bishop Affordable Housing Supply and Turnover Turnover Definitions: High Turnover where a vacancy arises on average every six months or under. Medium Turnover when a vacancy arises on average every six months to two years. Low Turnover when a vacancy arises on average less often than every two years.

8
Social Rent Location Number & Type of Property Landlord Turnover Cropwell Bishop 38 one bedroom apartments Spirita High Cropwell Bishop 10 two bedroom apartments
12 two bedroom houses Spirita High
Cropwell Bishop
38 three bedroom houses Spirita High
Cropwell Bishop
2 three bedroom houses De Montfort Housing Low
Total 100 Homebuy Location Number & Type of Property Landlord Turnover
Cropwell Bishop
1 two bedroom house 3 three bedroom houses
De Montfort Housing
Low
Total 4
5. Planning Context
Planning policy at national, regional and local levels imposes strict restraints on new
housing development in rural areas. However in exceptional circumstances, consideration for affordable housing in rural areas, where the Council is satisfied that local need exists, may be permitted.
Strategic actions contained within the Rushcliffe Borough Council Housing Strategy 2009-2016 encourage Parish Councils and local communities to explore their housing
needs as part of their comprehensive Parish Plans. It is anticipated that, in due
course, the Housing Needs Survey will form an integral part of a Cropwell Bishop Parish Pan that will be adopted by the Parish Council.
The provision of any housing that may be provided as a result of this survey would be subject to a planning condition (known as an S106 agreement) being placed on the development. This has the effect of limiting occupation of the properties to
people with a strong local connection who have exceptional personal reasons for
residing there, or are required to work in the locality and are in housing need.

9
6. Respondents’ Details
The following sections of this report detail the responses from the questionnaires
distributed and returned during April/May 2011 in Cropwell Bishop Parish.
Respondents individual details have been kept confidential and any identifiable attributes have not been included in the results. Any comments that have been
made may also have been edited so as not to identify individual circumstances.
The following results are a snapshot in time and provide the village and Rushcliffe
Borough Council with an insight into the parish in terms of current housing need, the
desirability of the village as a place to live, and the current level of facilities serving the local community.
A total of 242 survey forms were received giving a return rate of 30%. This is
considered a reasonable response, taking into consideration that only people who have a housing need, or those who are interested in commenting on local matters, are likely to respond.
6.1 Age Profile
The chart below shows the age profile of the 520 people captured on the 242 survey forms returned. The responses show that the largest single group of the population
in Cropwell Bishop, representing 55%, are people in the 25-64 years age group. 24% of respondents are over 65 and children under 16 represent 17% of the population.
89
24
284
123
0
50
100
150
200
250
300
0-16 17-24 25-64 65+
Years
Age Profile

10
6.2 Household Size & Mix
The following chart shows the number of households in each size/mix category.
Households containing families with children accounted for almost 31% of the total,
with properties containing singles and couples accounting for 68%.
6.3 Tenure of all Respondents
The following chart shows the current household tenure of all respondents. Owner-
occupiers make up almost 84% of households. Private rentals account for less than 3% and social rented properties account for 12%.
0
10
20
30
40
50
60
70
80
90
100
Nu
mb
er
of
Ho
us
eh
old
s
Category
2
14
60
94
71
One person householdCouple Two parent familyLone parent familyOther
Household
Occupancy
0
20
40
60
80
100
120
140
Nu
mb
er
of
Ho
us
eh
old
s
Tenure Type
1
29
121
17
82 Owner occupier - mortgagePrivate rentingLiving with parentsOwner occupier - No mortgageHA rentingHA shared ownership
Current Tenure
11
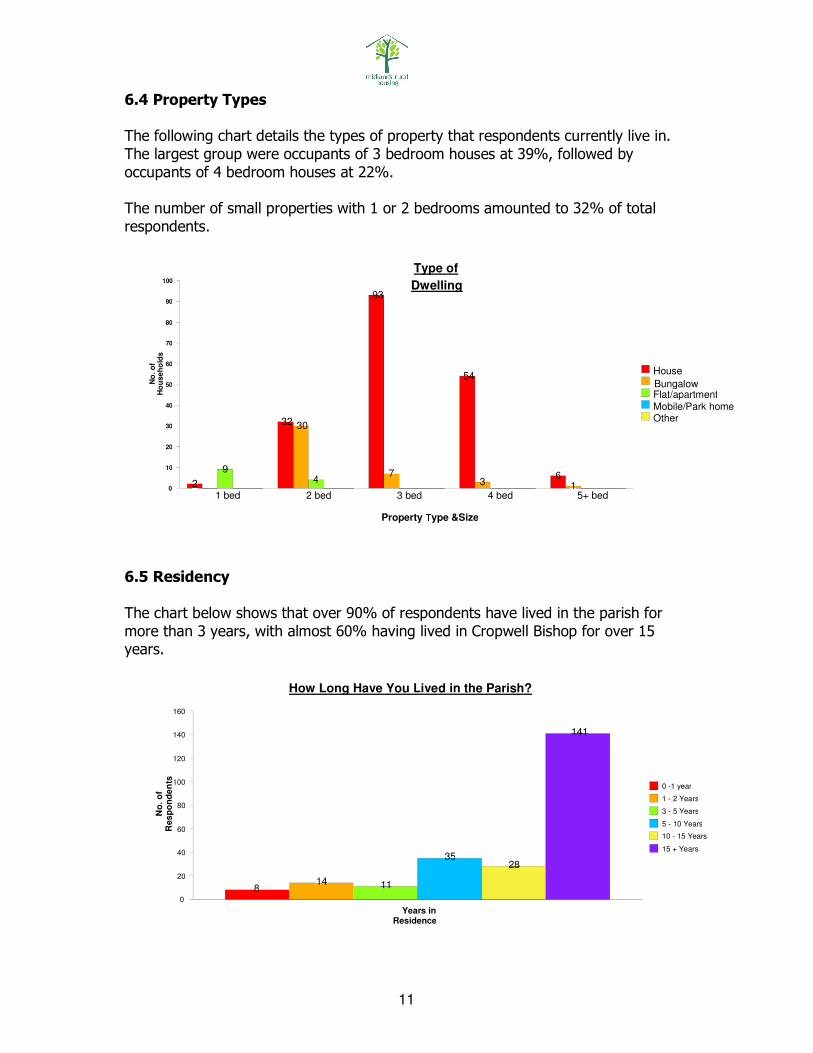
6.4 Property Types
The following chart details the types of property that respondents currently live in.
The largest group were occupants of 3 bedroom houses at 39%, followed by
occupants of 4 bedroom houses at 22%.
The number of small properties with 1 or 2 bedrooms amounted to 32% of total
respondents.
6.5 Residency
The chart below shows that over 90% of respondents have lived in the parish for
more than 3 years, with almost 60% having lived in Cropwell Bishop for over 15 years.
0
10
20
30
40
50
60
70
80
90
100
No
. o
f H
ou
seh
old
s
1 bed 2 bed 3 bed 4 bed 5+ bed
Property Type &Size
94
30
73 1
54
93
32
26
House
BungalowFlat/apartmentMobile/Park home Other
Type of
Dwelling
0
20
40
60
80
100
120
140
160
No
. o
f R
es
po
nd
en
ts
Years inResidence
141
2835
1114 8
0 -1 year
1 - 2 Years
3 - 5 Years
5 - 10 Years
10 - 15 Years
15 + Years
How Long Have You Lived in the Parish?
12
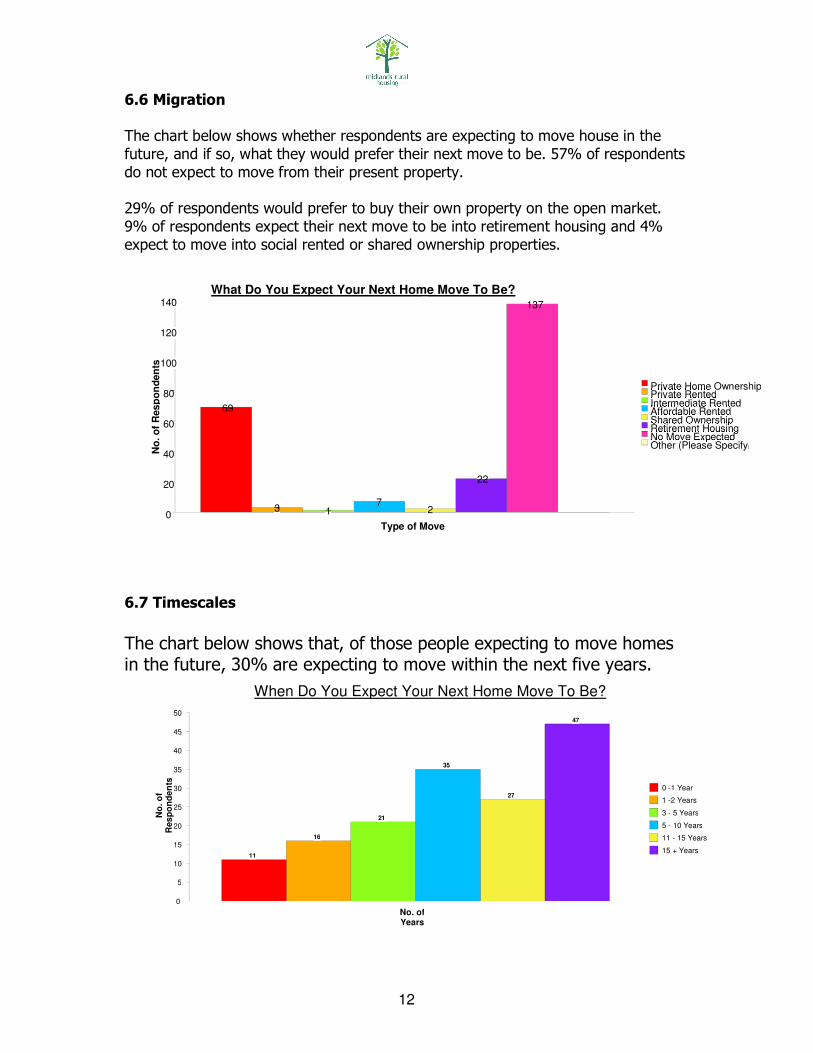
6.6 Migration
The chart below shows whether respondents are expecting to move house in the
future, and if so, what they would prefer their next move to be. 57% of respondents
do not expect to move from their present property.
29% of respondents would prefer to buy their own property on the open market.
9% of respondents expect their next move to be into retirement housing and 4%
expect to move into social rented or shared ownership properties.
6.7 Timescales
The chart below shows that, of those people expecting to move homes in the future, 30% are expecting to move within the next five years.
0
20
40
60
80
100
120
140
No
. o
f R
esp
on
den
ts
Type of Move
137
22
27
13
69
Private Home OwnershipPrivate RentedIntermediate RentedAffordable RentedShared OwnershipRetirement HousingNo Move ExpectedOther (Please Specify)
What Do You Expect Your Next Home Move To Be?
0
5
10
15
20
25
30
35
40
45
50
No
. o
f R
es
po
nd
en
ts
No. ofYears
47
27
35
21
16
11
0 -1 Year
1 -2 Years
3 - 5 Years
5 - 10 Years
11 - 15 Years
15 + Years
When Do You Expect Your Next Home Move To Be?

13
7.0 Local Support for Affordable Housing The chart below indicates that a number of local people have had to move out of the
village in order to secure suitable housing. Almost 13% of respondents were aware
of somebody who needed to move out to find affordable or suitable accommodation.
.
The second chart below shows the level of support for a small development of
affordable homes for local people, being built in the parish. Almost 60% of respondents would be in favour.
12.9
82.6
4.6
YesNoNot given
Migration - % Leavers in Last 5
Years
59.319.5
15.85.4
Yes
No
Don't Know
Not given
% In Favour of a Small Scheme

14
8.0 Housing Needs Analysis
Of the 242 returns 225 were from people who would be considered as adequately
housed and would not be looking to move to alternative accommodation within the
next 5 years. These respondents completed a survey form primarily to offer their support or objection towards a ‘local needs’ housing development, as well as to give their comments regarding the sustainability of Cropwell Bishop and comment on its
facilities. These were therefore discounted from the rest of the analysis.
Accordingly, as far as the requirement for affordable housing is concerned, there are
17 returns detailing a housing need. Some of these may not be eligible for
affordable housing and may need to be discounted from the final result.
8.1 Local Connection
The graph below shows the type of local connection held by the 17 respondents with a specific housing need. 14 live in the parish, 2 have previously lived in the parish
and 8 also have immediate family living locally.
0
2
4
6
8
10
12
14
No
. o
f R
es
po
nd
en
ts
Type of Connection
2
8
14
Live in the parishImmediate family in the parishPreviously lived in the parish
Local Connection

15
8.2 Current Housing Tenure
The chart below shows that 8 respondents are currently living with parents, 1 is privately renting, 5 are owner-occupiers and 3 are living in social rented properties.
8.3 Registered for Housing?
The chart below shows that 11 respondents are not registered with either Local Authority or Housing Association. 5 are registered with both, and 1 with just Local Authority.
0
1
2
3
4
5
6
7
8
No
. o
f R
esp
on
de
nts
TypeOf
Tenure
3
2
8
1
3
Owner occupier mortgage Private rentingLiving with parentsOwner occupier - no mortgageHA renting
Current Housing Tenure
0
2
4
6
8
10
12
Yes
No
11
5
11
6Local Authority Register
HA register
Are You Registered on a Housing Register?

16
8.4 When is Housing Required?
The chart below indicates that all 17 respondents will require alternative housing within the next five years, although the majority will have a need within 2 years.
8.5 How long is it needed for?
The chart shows that 4 respondents will need housing for a period between one and five years, but 13 will need it for a minimum of ten years.
0
1
2
3
4
5
6
7
8
No
. o
f R
es
po
nd
en
ts
Timescale
5
8
4 Now
Within 2 years
2-5 years
When Will You Require Alternative Accommodation?
0
1
2
3
4
5
6
7
8
9
10
No
. o
f R
esp
on
de
nts
Years
10
3
22
0 – 1 1 - 2 3 - 5 5 - 10 10 - 15 15 +
How Long Will You Need The Housing For?

17
8.6 Reason for Needing Alternative Housing The chart below shows people’s reasons for requiring alternative housing. The
largest group are those wanting independent accommodation to set up their own
homes.
9.0 Financial Information
The charts below indicate the levels of household income, source of income and savings held by respondents claiming a need for housing.
9.1 Household Income
0
1
2
3
4
5
6
7
8
No
. o
f R
esp
on
de
nts
ReasonFor
Move
8
1
1
33
2
3
Larger accommodation
Smaller accommodation
Physically adapted accommodation
Cheaper home
Closer to relatives
Closer to employment
Closer to carer or dependent
Security of tenure
Supported accommodation
First home
Change tenure
Independent accommodation
Why do You Need Alternative Accommodation?
0
1
2
3
4
5
6
7
8
No
. o
f R
esp
on
de
nts
Income
11
2
4
8
Below £14,999
£15-£19,999 £20-£24,999 £25-£29,999 £30-£39,999 £40-£49,999 £50-£59,999 Over £60,000
Basic Annual Income (Household)

18
9.2 Source of Income
9.3 Level of Savings
0
2
4
6
8
10
12
SourceOf
Earnings
6
12
SalaryMeans Tested Benefits
How will this Income Be Earned?
73.3%
20.0%
6.7%
Below £1,000 £1 - £4,999 £5 - £9,999 £10 - £19,999 £20 - £29,999 £30,000+
Do You Have Savings?
19
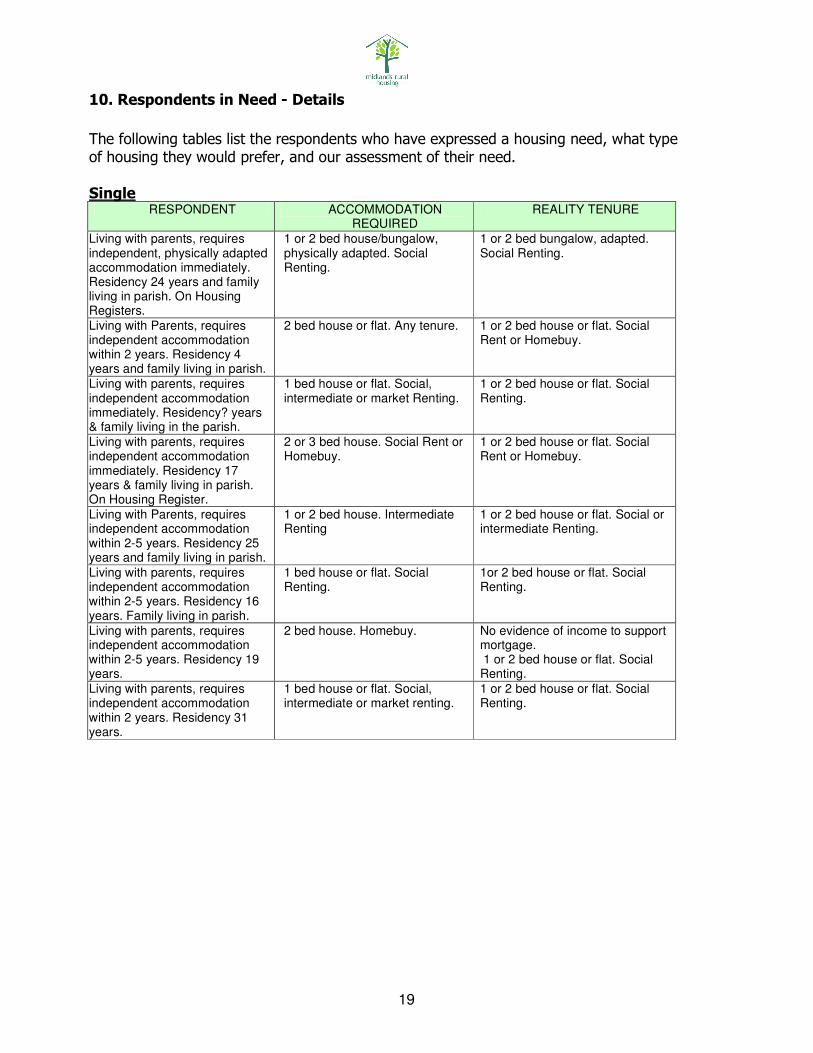
10. Respondents in Need - Details
The following tables list the respondents who have expressed a housing need, what type of housing they would prefer, and our assessment of their need.
Single
RESPONDENT ACCOMMODATION REQUIRED
REALITY TENURE
Living with parents, requires independent, physically adapted accommodation immediately. Residency 24 years and family living in parish. On Housing Registers.
1 or 2 bed house/bungalow, physically adapted. Social Renting.
1 or 2 bed bungalow, adapted. Social Renting.
Living with Parents, requires independent accommodation within 2 years. Residency 4 years and family living in parish.
2 bed house or flat. Any tenure. 1 or 2 bed house or flat. Social Rent or Homebuy.
Living with parents, requires independent accommodation immediately. Residency? years & family living in the parish.
1 bed house or flat. Social, intermediate or market Renting.
1 or 2 bed house or flat. Social Renting.
Living with parents, requires independent accommodation immediately. Residency 17 years & family living in parish. On Housing Register.
2 or 3 bed house. Social Rent or Homebuy.
1 or 2 bed house or flat. Social Rent or Homebuy.
Living with Parents, requires independent accommodation within 2-5 years. Residency 25 years and family living in parish.
1 or 2 bed house. Intermediate Renting
1 or 2 bed house or flat. Social or intermediate Renting.
Living with parents, requires independent accommodation within 2-5 years. Residency 16 years. Family living in parish.
1 bed house or flat. Social Renting.
1or 2 bed house or flat. Social Renting.
Living with parents, requires independent accommodation within 2-5 years. Residency 19 years.
2 bed house. Homebuy. No evidence of income to support mortgage. 1 or 2 bed house or flat. Social Renting.
Living with parents, requires independent accommodation within 2 years. Residency 31 years.
1 bed house or flat. Social, intermediate or market renting.
1 or 2 bed house or flat. Social Renting.

20
Elderly RESPONDENT ACCOMMODATION
REQUIRED REALITY TENURE
Single person, has own property in nearby parish, wishes to live closer to family within 2 years. Family residency 10 years.
1 or 2 bed house. Homebuy, intermediate or market renting.
No mitigating factors in support of this claim and insufficient evidence of need. This person may have sufficient equity and savings to be able to afford market housing.
Single person living in rented HA 1 bed flat, requires sheltered housing within 2-5 years. Residency 12 years. On HA Register.
1 bed flat. Social Renting. This person’s requirements are already being met. He/She should contact their HA directly to discuss sheltered housing provision.
Single person, living in own property in neighbouring county, wishes to live nearer family within 2 years. Previous residency 25 years, family residency 2 years.
2 bed bungalow. Social renting or Homebuy.
There are no mitigating factors in support of this claim and insufficient evidence of need. This person appears to have sufficient equity and savings to be able to afford market housing.
Families RESPONDENT ACCOMMODATION
REQUIRED REALITY TENURE
Couple with one child, owner-occupiers, require larger property within 2 years. Residency 20 years.
4 bed house. Homebuy. This family have adequate equity, income and savings to afford local market housing. They would not qualify for 4 bed social housing.
Lone parent with 2 children living in privately rented property requires cheaper home within 2 years. 32 years residency and family living in the parish. On H A Register.
3 bed house. Homebuy, intermediate or market renting.
3 bed House. Homebuy.
Family of 5, one adult with health and mobility problems, require alternative accomm. within 2-5 years. Residency 5 years.
3/4 bed bungalow, adapted. Homebuy.
4 bed bungalow, adapted. Social Rent or Homebuy.
Couple with three children and baby, living separately out of parish, in privately rented and HA rented properties, require larger, independent property, close to family carer, immediately. Previous residency 5 years. On Housing Register.
3 or 4 bed house. Social, intermediate or market renting.
4 bed house. Social Renting.
Lone parent with 2 children, currently living in family home, pending divorce forces sale. Low equity, low income. Needs cheaper home within 2 years. Residency 9 years.
3 bed house. Homebuy. 3 bed house. Homebuy.
Lone parent with teenage child living in HA 2 bed house requires larger accommodation. Residency 37 years. On Registers.
3 or 4 bed house. Social renting. This person’s needs are already being met. He/She should contact their HA directly to discuss future requirements.
21
10.1 Results of Analysis Although seventeen respondents have claimed a need for affordable housing, five of
the claims cannot be supported as their need is already being met or they have
sufficient financial resources to resolve their needs on the open market. They have therefore been discounted from the final results.
The housing needs derived directly from the survey are:
7 x 1 or 2 bed houses or flats for Social Rent (with the option of providing 2 for Homebuy). 2 x 3 bed houses for Homebuy
1 x 4 bed house for Social Rent
1 x 2 bed bungalow (physically adapted) for Social Rent
1 x 4 bed bungalow (physically adapted) for Social Rent or Homebuy

22
11. Conclusions & Recommendations
Midlands Rural Housing, in partnership with Cropwell Bishop Parish Council, has
conducted a detailed study of the housing needs of the parish. This study has not only investigated the actual housing needs, but has also ascertained residents’ views with regard to living in the village, and has identified the level of local support for a
development to meet local needs.
Cropwell Bishop is a popular and sought after village in which to live. It has a good
range of amenities available and there are local employment opportunities. The
village lies within easy reach of the A46 which gives good transport links to Nottingham and the East Midlands.
The population has a well balanced age range and almost one third of households
are composed of families with children under 16. There is an ample supply of three and four bedroom family houses in the parish and also a good supply of smaller properties, with almost one third of housing stock having only one or two bedrooms.
A high proportion of these are either bungalows or flats and some may be elderly persons housing.
There is little evidence of a private rental market. Social housing accounts for 12%
of housing stock. Social housing, by its nature, does not become available on a regular basis. The lack of availability of privately rented properties will keep local
rents high.
There is a high level of owner-occupation. The evidence shows that people settle in
the village for lengthy periods. 60% of respondents have lived in the parish for over
15 years and 57% do not expect to move again. This restricts the supply of properties coming readily to the market. The values of houses currently for sale show that, while prices are not as high as elsewhere in Rushcliffe, a family would
still need a household income of £40,000 per year to afford a mortgage. The evidence of income, for those claiming a need in our survey, shows that household incomes are generally below £20,000 and savings are below £1,000. Local property
values are therefore unattainable for this group of people.
Most people who do expect to move would prefer to buy on the open market. 30% expect to move within 5 years. Only 4% expect to move into social housing.
However, 9% expect to move into some form of retirement housing. The Borough
Council may wish to look at this as a separate issue.
Although seventeen respondents have claimed a need for affordable housing, five of
these would be ineligible on the grounds that they do not show sufficient evidence of need, or they have sufficient financial resources to purchase property on the open
market.
Of the remaining twelve, eight are single people who are living with parents and
wish to set up their first independent home. This group generally do not have

23
sufficient savings to afford the deposit, or income to support a mortgage, on a market property. There may be a lack of suitable low cost entry level housing available for this group of young starters.
Almost 60% of respondents have shown support for developing a small scheme of affordable properties, with a further 16% undecided. Less than 20% of respondents were against any development. The recently completed scheme off Cropwell Butler
Road has drawn favourable comments and is popular with residents.
Our recommendation is that a mixed development of twelve affordable
dwellings should be considered. This development will alleviate the
current housing needs in Cropwell Bishop, whilst remaining available to the parish in perpetuity, to allow for future requirements which may arise.
24
12. Acknowledgements
Midlands Rural Housing would like to thank Mr Alan Wilson, Chairman of Cropwell
Bishop Parish Council and Mrs Jacqui Grice, Clerk to Cropwell Bishop Parish Council, for their time and help in carrying out this Housing Needs Survey.
13. Contact Details
Miles King Trent Valley Partnership Project Officer Midlands Rural Housing
1st Floor
10 Cromford Mill Mill Lane
Cromford
Derbyshire
DE4 3RQ Tel: 01629 826040
Email: [email protected]
25
Appendix A: Comments Regarding a Small-Scale Development of Affordable Housing for Local People.
The following comments were received from respondents and give a general indication of their concerns for and against an affordable housing scheme. A random selection of comments has been reproduced.
• We disagree with building on greenbelt land, even for an exception site.
• I would support it if I could be assured that the housing would go to young people within the village.
• There is housing already available in this village at reasonable prices.
• Why should we accept ‘creeping development’ so that people can stay in the village? The infrastructure cannot continue to support more housing.
• No more affordable houses. Properties in nice rural areas should command a premium and not be subsidised.
• Don’t allow the village to get too big and lose its identity.
• The new housing scheme has given people an opportunity to improve their circumstances and is highly appreciated by residents. The interest in this scheme shows that there is a need for more affordable housing in the parish.
• The recent new build is excellent. It’s a shame it wasn’t here when my children were leaving home.
• I am in favour of affordable housing provided it is only available to households with insufficient income to afford open market prices.