Crop nutrient presentation - USDASoil test results are no better than the sample taken. •If the...
68
1 4/9/99 Crop Nutrient Planning and Manure Management
Transcript of Crop nutrient presentation - USDASoil test results are no better than the sample taken. •If the...

14/9/99
Crop Nutrient Planning and Manure Management

24/9/99
Nutrient ManagementManaging the amount, form, placement and timing of
applications of plant nutrients
Purpose:• supply nutrients for optimum forage and crop yields• minimize movement of nutrients towards surface and
groundwater• maintain or improve the chemical and biological condition
of the soil
Nutrient Management has three phases:1. Development of a crop nutrient management plan2. Implementation of the plan, i.e. managing amount, form, placement and timing of nutrients3. Evaluation of results of the plan in order to make adjustments in subsequent years
A successful nutrient management plan has to be both economically and environmentally sound (improving profitability, and protecting natural resources)

34/9/99
Nutrient Management…The Planning Process
Plan Development• Field-specific information• Comprehensive nutrient budget
Management• Crop rotations• Planned manure applications• Commercial fertilizer use
Record keeping• Annual records
1. Plan Development•Utilizes farm or field-specific information to develop a comprehensive nutrient budget that considers all nutrient sources.•Base the plan on University of Minnesota recommendations for crop production.
2. Management•A good plan will economically optimize nutrients in a cropping system.•It will manage the amount, form, placement, and timing of:
•Manure applications.•Commercial fertilizer applications.
•It will reduce movement of nutrients from the soil surface or from the root zone into surface or groundwater.
3. Record-keeping•Field-specific farm records will allow:
•Development of a field-specific plan.•Continued monitoring of plan results.•Adjustments to the plan with a high degree of confidence.
•Start with estimates if actual records are not available.•Maintain records yearly.

44/9/99
Field Specific Information• Field size and location• Cropping history• Past and current yields• Soil test results• Manure test results• Commercial fertilizer applications• Manure applications• Tillage practices• Special field features
1. Knowing field size and location allows a manager to prioritize fields for nutrient applications, especially manure applications.2. Crop and yield history are necessary to establish yield goals and to give proper credit from previous crops.3. Soil and manure test results provide a measure of present nutrient availability.4. Commercial fertilizer application records allow the producer to track the progress of the nutrient management plan.5. Manure application records are necessary to provide proper nutrient credits to the specific fields where manure is applied and also to measure the progress of the plan.6. Tillage practices affect the depth of placement of nutrients in the soil.7. Field features may have an impact on keeping the nutrients on the land where applied, e.g., steep slopes, soil texture changes, adjacent surface waters, open tile inlets, sinkholes, waterways, terraces, etc.

54/9/99
Crop Nutrient Planning andManure Management
I. Plan Development InformationII. Crop Nutrient RequirementsIII. Manure Management

64/9/99
Setting Realistic Yield GoalsFactors that can have a major affect on yield goals:
Soil and climate factors• Drainage• Soil water holding capacity• Precipitation• Length of growing season• Soil productivity level• Subsoil condition• Soil compaction• Soil pH
Management factors• Soil fertility level• Crop variety• Crop rotation• Insect and weed problems• Tillage• Plant population
Crop yields are highly variable from year to year, farm to farm, and field to field. They are a result of the interaction between the natural environment (soil and climate) and management factors.
Source: Anderson J. L., P. C. Robert, and R. H. Rust. 1992. Productivity Factors and Crop Equivalent Ratings for Soils of Minnesota, University of Minnesota Extension Service, BU-2199.
Yield goals have an economical and environmental impact on the farm and on the surrounding area:
•If goals are too high, money will be wasted on crop inputs. Excess crop nutrients may leach through the soil or move across the surface,contaminating ground or surface waters.•If yield goals are too low, inputs are not sufficient for the most profitable yield.
Establishing realistic yield goals for each field matches the potential productivity of the soils with the level of crop management that is being practiced.

74/9/99
Setting Realistic Yield GoalsIdeal procedure for setting field specific yield goals• Most recent 5 years of yield information for a particular crop
– Exclude the lowest yielding year and average the remaining 4 years
Alternatives• Less than 5 years of yield information
– Most recent 3-year average X 1.05 or 1.10• Less than 3 years or no yield information available
– Consider local averages for similar soil types and management levels
Recommended procedure for setting realistic yield goals:•Obtain yield information from accurate farm records.•Using the most recent 5-year yield information takes into account advances in technology and improvements in management practices.•Excluding the lowest yielding year helps keep a single disaster year from lowering the yield goal (e.g., drought, storm damage, poor growing conditions).•Yield goals are estimates of yield potential for a particular situation. Changes in management practices may cause changes in the yield potential. Use common sense when determining yield potential and establishing realistic yield goals.
Source: Randall, G. W. and M. A. Schmitt. 1993. Best Management Practices for Nitrogen Use in Statewide Minnesota. University of Minnesota Extension Service. FO-6125.
Alternative methods for setting realistic yield goals if 5-year yield information is not available:
•Use 3-year average and then multiply by an adjustment factor (1.05 or 1.10).•If the variation in yield among the 3 years is large (for example greater than 30 to 40 bu. difference in corn yield), use the larger adjustment factor; otherwise use the 1.05 factor.
•If little or no yield information is available, use local averages for the specific soil type and make adjustments for the level of management.

84/9/99
Setting Realistic Yield GoalsField specific yield goal example for corn
Year Crop Yield1992 corn 140 Bu/A1993 corn 1351994 corn 1151995 beans 451996 corn 1351997 corn 150
Average the yields from 1992 (140 Bu), 1993 (135 Bu), 1996 (135 Bu)and 1997 (150 Bu) … dropping the yield from 1994 (115 Bu)
Realistic corn yield goal for this field is 140 Bu/A
The realistic yield goal for corn in the example situation using the desired method is 140 bushel/acre. The 115 bu yield that occurred during 1994 was dropped because it was the lowest of the 5 years.
If yield information were only available from 1994 through 1997, a 3-year average [(150 + 135 + 115) divided by 3] = 133 bu./acre can be used.
Multiply 133 bu/A by the 1.05 factor = 140 bu./acre.or
Multiply 133 bu/A by the 1.10 factor = 146 bu./acre.
All three methods for calculating yield goal in this example provide the same fertility recommendations if using the University of Minnesota table values for N, P2O5 and K2O.

94/9/99
Measuring Soil Nutrient Availability
Soil sampling objectives• Determine the average nutrient
status in the sampled area• Obtain a measure of nutrient
variability• Adjust nutrient applications to
more closely meet the needs of the crop
Economic fertility recommendations can only be developed using a soil test to determine nutrient availability in the soil.
Soil testing uses scientific procedures to analyze a representative soil sample and to determine an index of the amounts of specific nutrients available for plant growth.

104/9/99
Soil SamplingWhen to test?
• At least once every 3 years for– Organic matter, pH, Phosphorus, Potassium– Secondary and micronutrients are optional
• Every year for nitrogen– If crediting for residual soil nitrate nitrogen– In the spring before planting, or for western Minnesota, in the spring or
during the fall if soil temperatures are < 50O F
Organic matter, soil pH, phosphorus and potassium are essential components of the basic soil testing procedure for Minnesota.
•Organic matter, soil pH, and the presence of phosphorus and potassium are relatively slow to change, so annual tests are not necessary.•Organic matter is the slowest component to change. Soil pH changes the fastest.•Secondary and micronutrients are optional components of a soil test. In exceptional cases soil conditions may warrant testing for these nutrients.
Nitrogen in the soil in nitrate form is a mobile nutrient. Test for residual nitrate nitrogen yearly.
•Need for testing depends on crop rotation, manure applications, and rainfall.•Low rainfall areas ( e.g., Western Minnesota) have a greater chance of having residual nitrate nitrogen in the root zone and can be sampled either late fall, after soil temperatures drop below 50O F, or in the spring before planting.

114/9/99
Soil SamplingA sampling unit should be uniform in…
• Soil type/texture• Slope/degree of erosion• Cropping history• Manure history• Past yield• Fertility management
Dissimilar areas of a field should be avoided or sampled separately• Old livestock lots and lanes, old fence lines, field borders, along gravel roads,
eroded or silted areas, etc.• Avoid sampling directly in previous fertilizer application bands
Soil test results are no better than the sample taken.•If the soil sample is not representative of the field from which it was taken, recommendations based on that sample can be misleading.•The sampling area needs to have uniform characteristics and pastmanagement practices in order for the soil sample to be reliable and representative.
Avoid sampling odd or dissimilar areas of a field. Mixing soil from these areas with soil from uniform areas leads to a high degree of variability in the test results.Sample dissimilar areas separately if necessary.
•Manure deposits from old lots or lanes probably will have an abnormally high fertility level.•Maintain a 300 ft. sampling distance from gravel roads containing limestone because of potential for higher pH levels.•Avoid sampling where the starter fertilizer band was placed.
•Sample between the rows for most row crops except for ridge-till planting.•For ridge-till systems, take a 6-inch deep sample from the shoulder of the ridge, avoiding the starter fertilizer band.

124/9/99
Soil Sampling Methods (Ideal)Random sampling
• One composite sample made up of 15 to 30 subsamples
• No more than 20 acres if from level uniform landscapes
• Every 5 acres if from hilly or rolling ground
• Sample to 6 inch depth for pH, organic matter, P and K
• Sample to 24 inch depth for nitrate nitrogen
Grid sampling, GPS, etc.• Intensive sampling method
X
X
X
X
X
X
X
X
X
X
X
XX
XX
X
X
Example of random collection of soil subsamples
20 acre field
After dividing the field into uniform land areas:•Randomly collect the subsamples or soil cores in a zig-zag pattern across the designated field area. Normally 15 to 30 subsamples are adequate.•Ideally, a representative area should be no more than 20 acres.
•With hilly or rolling fields, sample every 5 acres.•The more variable the soil, the more subsamples should be combined per area sampled. The greater the number of subsamples in the sample, the less effect a single unrepresentative core or subsample will have on the final test results.
1. Scrape off surface residue at the point where the soil core is taken. 2. Sample to a 6-inch depth (plow or tillage layer) for cultivated crops for organic matter, pH, P and K.3. Mix the cores or subsamples in a clean plastic pail.
•Sample to 24-inch depth for residual nitrate nitrogen.Grid sampling methods provide more intensive sampling and measurement of nutrient availability, but are more expensive because more samples are being taken and tested.

134/9/99
Soil Sampling Methods (Minimum)
• Sample every 3-4 years• One sample for every 40 acres or management unit
– Uniform area with the same past management– 10 to 15 subsamples at a minimum– Take more subsamples if soils are variable
• Sample to 6 inch depth for pH, organic matter, P and K• Sample to 24 inch depth for nitrate nitrogen
– 6 to 8 subsamples– Taken every year
The basic or minimum acceptable soil sampling method:•One sample per management unit (being careful that it meets the criteria for uniform land area).
•Take more subsamples or cores to get a better representative sample.•Sample to a 6-inch depth.
•Take 6 to 8 subsamples to a 24-inch depth annually to measure residual nitrate nitrogen availability.

144/9/99
Understanding Your Soil Test Report
1 Medium 3.7
OOOOO
6.3 14 110
HHH
PPPPPP
KKKKKK
John FarmerAnywhere, MN
The soil test report is a record of the analysis of the soil samples that were sent to the laboratory.Use a reputable laboratory to provide the analysis.
•Minnesota Department of Agricultural (MDA) Soil Testing Certification Program.
•Labs participating in the program have their analytical procedures checked for accuracy.•The accuracy reduces variability of soil testing results from lab to lab.•Certified labs use the same reporting units (standardized reporting).
Understand the meaning of the reporting units on the soil test.•ppm - parts per million.
•Can be converted to lbs. per acre by multiplying ppm by 2 for a 6-inch soil sampling depth.•An acre of soil (6-7 inches deep) weighs approximately 2,000,000 lbs.
•Crop fertility recommendations on commercial laboratory reports may not correspond to University of Minnesota recommendations.•Use the actual soil test information from the report and determine the recommendation using U•niversity of Minnesota publications.

154/9/99
Soil Test InterpretationSoil pH and Buffer Index
• Used to determine lime needsOrganic matter (O.M. - %)
• To determine the nitrogen recommendation categoryNitrate-nitrogen (ppm or lbs./acre)
• Used to determine residual soil nitrogen creditPhosphorus (ppm)
• Bray-1 test - use if soil pH is less than 7.4• Olsen test - use if soil pH is 7.4 or greater
Potassium (ppm)Secondary and micronutrients (ppm)
Proper pH (acidity and alkalinity) levels for a cropping system affect soil structure and availability of many soil nutrients.
•Soil pH is the measurement of soil acidity in solution (soil/water mixture).•Buffer pH (potential acidity) determines the amount of lime needed if the soil pH is less than 6.0.
Organic matter is a source of available nitrogen (along with other nutrients) during the decomposition process (mineralization).Results for soil test phosphorus may contain the results from the Bray-1 test, Olsen test, or both.
•Use the results that match the soil pH conditions.•Occasionally, the Bray test results will be higher than the Olsen results with pH levels above 7.4; therefore, use the test that gives the highest phosphate (P2O5) recommendation.
Testing for other nutrients is optional.•Sulfur - appropriate for sandy soils only.•Zinc - only micronutrient sometimes needed by corn in Minnesota.

164/9/99
Soil pH for Optimum Crop Growth
Lime to a soilpH of 6.5
Lime to a soil pH of 6.0 No limeneeded
Alfalfa Barley Peas Blueberries Alsike clover Birdsfoot trefoil Red clover Grass sod Apples Buckwheat Rye Potatoes Asparagus Canola Sorghum sudan Wild rice
Corn Soybeans Edible beans Sugar beets Grass hay Sunflowers Oats Wheat
Using lime to increase soil pH is a beneficial and profitable practice when acidic soil conditions are not suitable for optimum crop growth. Crops, however, differ in their response to pH. Some crops thrive when growing in acidic conditions, whereas others need near neutral pH conditions. Low pH soils need the addition of liming materials to provide optimum growth for crops sensitive to low pH.
For a growing crop, pH affects:•The availability of many nutrients in the soil such as the availability of phosphorus.•The microbial activity within the soil which can aid in the release of nitrogen from organic matter. •The presence of some crop diseases, such as potato scab.
•Source: Rehm, G. W., R. C. Munter, C. J. Rosen, and M. A. Schmitt. 1992. Lime Needs in Minnesota. University of Minnesota Extension Service. FO-5956.

174/9/99
Crop Nutrient Planning andManure Management
I. Plan Development InformationII. Crop Nutrient RequirementsIII. Manure Management

184/9/99
Crop Nutrient Recommendations
Nutrient recommendations are based on soil test information and University of Minnesota Extension Service publication “Fertilizer Recommendations for Agronomic Crops in Minnesota” (BU-06240-S)
U of MN recommendations are research based.•Recommendations have been fine-tuned over approximately 50 years of individual laboratory and field studies across the state of Minnesota.•U of MN recommendations are based on the use of soil chemical tests that have been shown through research to be suitable for Minnesota soils.
U of MN recommendations are similar but not identical to recommendations from nearby states.
•The U of MN belongs to the NCR-13 Soil Testing Group that brings together the resources and research from Upper Midwest land grant universities for discussion and comparison of results and recommendations.• States do not always share identical fertilization “philosophies,” hence recommendations may be different.
•Build-up vs. maintenance: Buildup refers to building up the soil test level; maintenance refers to maintaining soil test levels. The problem: It may take large amounts of fertilizer to raise soil test levels significantly, especially phosphorus in high pH soils. Another term for the maintenance philosophy is the “crop removal philosophy.”•Feed the soil: Feeding the soil uses a combination of soil build-up and maintenance systems.•Feed the crop: U of MN fertilizer recommendations are based on feeding the crop, developed through a correlation and calibration system.

194/9/99
Nutrient RecommendationsExample:
Corn yield goal = 140 bu./acreSoil organic matter = 3.7% Previous crop = cornSoil test phosphorus = 14 ppm Bray-1Soil test potassium = 110 ppm
What are the nitrogen, phosphate and potash recommendations?
Organic matter, phosphorus, and potassium in this example are all considered medium by the U of MN soil test laboratory. A yield goal of 140 bushel/acre is typical for southern Minnesota soils.

204/9/99
Nitrogen Recommendation for CornMethods• Table rates based on:
– Yield goal– Previous crop– Low ( < 3.0% ) vs. medium and high ( > 3.0% ) organic matter
• Equation– Use only in western Minnesota when testing for residual nitrate nitrogen– Subtract amount of nitrate-N measured by soil nitrate test and amount of N
credit from previous crop
TABLE RATES•University of Minnesota nitrogen recommendation tables are based on yield goal, previous crop, and organic matter level.•Previous crop and organic matter level affect fertilization because both are sources of nitrogen. Unless stated otherwise, the tables assume that the harvestable crop was removed from the field, not plowed under as green manure.
EQUATIONS•The traditional nitrate test and its equation is only suitable for the relatively dry western Minnesota region. A spring nitrate test, to be discussed later, has been developed for medium and fine textured soils in eastern Minnesota.•The equation results in a recommendation that is less than the value from the tables because it accounts for residual nitrate.

214/9/99
Nitrogen RecommendationTable rates for corn following corn Yield goal
Previous crop1
Organic matter level2 100 - 124 125 - 149 150 - 174
N to apply (lbs/acre)
Group 2 crops low 130 160 190
medium and high 100 130 160
1 Group 2 crops are corn, grass hay, potatoes, sugar beets, sunflowers, etc2 Organic matter levels less than 3% are considered low
To use the nitrogen recommendation tables, match last year’s crop with organic matter level and yield goal.
The table separates legumes and non-legumes into Group 1 Crops and Group 2 Crops. Corn is a Group 2 Crop. In the example, where corn is grown following corn in medium organic matter soil, and with a yield goal of 140 bushels, 120 lbs. of N per acre is recommended.
•Soil organic matter is a major source of N used by crops. Decomposition of organic forms of N from organic matter can release about 20 lbs of N/acre/year for each percent of organic matter, although the rate of decomposition is relatively slow, occurring over the growing season.
Source: Rehm, G. W., M. A. Schmitt, and R. C. Munter. 1995. Fertilizer Recommendations for Agronomic Crops in Minnesota. University of Minnesota Extension Service. BU-6240.
Rehm, G. W., M. A. Schmitt, and R. C. Munter. 1994. Fertilizing Corn in Minnesota. University of Minnesota Extension Service. FO-3790.

224/9/99
Nitrogen RecommendationTable rates for corn following soybeans or a
poor alfalfa stand Yield goal
Previous crop
Organic matter level1 100 -124 125 - 149 150 -174
N to apply (lbs/acre)
Soybeans, small grains,
low 90 120 150
alfalfa (less than 1 plant per sq. ft)
medium and high 60 90 120
1 Organic matter levels less than 3% are considered low
The University of Minnesota has a separate nitrogen recommendation for situations where corn follows a legume in a cropping sequence. Different legume crops contribute different amounts of nitrogen to succeeding crops. These contributions, called credits, influence the recommendations.
On this table, where corn follows soybeans, organic matter is medium, and yield goal is 140 bu./acre, the recommended nitrogen application is 80 lb./acre.
Source: Rehm, G. W., M. A. Schmitt, and R. C. Munter. 1995. Fertilizer Recommendations for Agronomic Crops in Minnesota. University of Minnesota Extension Service. BU-6240.
Rehm, G. W., M. A. Schmitt, and R. C. Munter. 1994. Fertilizing Corn in Minnesota. University of Minnesota Extension Service. FO-3790.

234/9/99
First-year nitrogen credit provided by legumes for a corn crop
Legume Crop 1st Yr N Credit
lbs/acreSoybeans 40
Edible beans, field peas, 20 Harvested alfalfa 4 or more plants/sq ft 150-160 2-3 plants 100 1 or less plants 40 Red clover 75
Legumes can leave substantial nitrogen for succeeding crops of corn. Plowdown of an excellent stand of alfalfa can leave up to 150 lbs. of nitrogen for corn planted the first year after plowdown.
•Evaluating the alfalfa stand during the year prior to rotating to a different crop is critical to determining the amount of N credit that can be given to the succeeding crop.•A nitrogen recommendation for corn that is based on table rates from the previous slide already takes into account the first-year nitrogen credit provided by a legume crop.
Results from a Minnesota Department of Agriculture survey indicate that insufficient nitrogen crediting for legumes in the rotation can be a major factor in over fertilization of nitrogen on some Minnesota field crops.

244/9/99
Nitrogen RecommendationEquation for Western MN
Nrecommendation = (1.2 x YG) - STN(0-24 in) - NPC
YG = Realistic corn yield goalSTN(0-24 in) = Soil nitrate test, lb/acreNPC = Previous crop N credit, lb/acre
The equation used for N recommendations in western Minnesota when the nitrate test is used is 1.2 times yield goal minus soil test nitrogen and previous crop N credit.
Previous crop N credits for specific crops are set out in corresponding tables in BU-6240, “Fertilizer Recommendations for Agronomic Crops in Minnesota”.
Source: Rehm, G. W., M. A. Schmitt, and R. C. Munter. 1995. Fertilizer Recommendations for Agronomic Crops in Minnesota. University of Minnesota Extension Service. BU-6240.
Rehm, G. W., M. A. Schmitt, and R. C. Munter. 1994. Fertilizing Corn in Minnesota. University of Minnesota Extension Service. FO-3790.

254/9/99
Determining nitrogen recommendations using soil N testing
Shaded area of westernMinnesota where soil Ntesting can be usedas an annual management tool
The shaded area in this map generally can use the nitrate test with reliability. The limited rainfall in western Minnesota allows the nitrate test to predict N availability to the crop.
Samples for the nitrate test can be taken in the spring or in the fall after the temperature of the plow layer falls below 50 degrees F, usually about mid-October.
The University of Minnesota Soil Testing Laboratory asks that soils sampled for the nitrate test be air-dried immediately and delivered to the laboratory within 24 hours of sampling.
Nitrates are mobile and move easily with water in the soil. Because water moves freely through coarse-textured soils, the nitrate test does not work well in sandy soils in any region of the state.
Fall sampling for nitrate-nitrogen is not recommended for wetter areas such as eastern Minnesota. Later, we will discuss a spring nitrate test that is useful in eastern Minnesota.

264/9/99
P2O5 and K2O Recommendations• Methods for determining recommendations
– Table rates– Equations can be used when using a high level of management
• Determine management practices– fertilizing for one year or for the rotation– broadcast vs. row rates– application timing– nutrient placement
Methods for determining recommendations•Table rates are adequate for determining P and K recommendations. •The use of equations where recommendations are determined to the pound may lend a false sense of accuracy. Use the equations given in BU-6240, Fertilizer Recommendations.
Determine management practices•Applying P and K once for a crop rotation can be a cost-effective practice for many situations.•For considerable savings, fertilize in the row, rather than using broadcast applications. Row application puts phosphate and potash fertilizer close to the seed. Banding P and K is efficient because these two nutrients do not readily move in the soil.•Even where P and K levels are high, banding a small amount of P and K, (10 to 15lbs. per acre of each) as starter fertilizer near the seed at planting has been shown to improve corn yields in cool, wet soil. Use low rates of starter fertilizer until the Bray P test reaches 20 ppm and the K test is 175 ppm. For corn production in East Central Minnesota regardless of soil test level use a band application of 15-20 lbsP205 per acre.

274/9/99
Phosphate RecommendationBroadcast Rates for Corn
Soil Test Phosphorus (ppm)
v. low low med. high v. high
Yield Bray 0-5 6-10 11-15 16-20 21+
Goal Olsen 0-3 4-7 8-11 12-15 16+
Bu./acre lb. P2O5/acre to apply
<100 60 40 25 10 0
100-124 75 50 30 10 0
125-149 85 60 35 10 0
150-174 100 70 40 15 0
175-199 110 75 45 15 0
200+ 120 85 50 15 0
Referring to the example of a 140 bushel yield goal with a 14 ppm Bray phosphorus soil test result, the table illustrates 35 lbs of P2O5 per acre for broadcast application or 25 lb per acre if row-applied.
•Another option is using the equation [0.700 - (0.035)(Bray P, ppm)](Yield goal) to calculate the recommendation. If this equation were used, 29 lbs. per acre P2O5 broadcast applied would be the recommended amount.•A different equation is calculated for a P2O5 recommendation if the Olsen soil P test were used.
The Bray Test is used for soils that are neutral to acid in pH, while the Olsen Test for phosphorus is used for higher pH soil. The higher pH soils usually occur in drier regions such as western Minnesota. Remember that the two tests extract different amounts of phosphorus and require different recommendation tables.
Source: Rehm, G. W., M. A. Schmitt, and R. C. Munter. 1995. Fertilizer Recommendations for Agronomic Crops in Minnesota. University of Minnesota Extension Service. BU-6240.
Rehm, G. W., M. A. Schmitt, and R. C. Munter. 1994. Fertilizing Corn in Minnesota. University of Minnesota Extension Service. FO-3790.

284/9/99
Potash RecommendationBroadcast Rates for Corn
Soil Test Potassium (ppm)
Yield v. low low med. high v. high
Goal 0-40 41-80 81-120 121-160 161+
bu./acre lb. K2O/acre to apply
<100 100 75 45 15 0
100-124 120 90 50 20 0
125-149 145 105 60 20 0
150-174 165 120 70 25 0
175-199 185 135 80 25 0
200+ 205 160 90 30 0
Returning to the example, the yield goal is 140 bushels and soil test potassium is 110 lbs. The table recommendation is 60 lbs. per acre of potash broadcast applied, or 40 lbs per acre row-applied.
•If using the equation [1.166 - (0.0073)(K soil test, ppm)](Yield goal) to calculate the potash recommendation, 51 lbs. per acre broadcast applied would be the recommended amount.
Source: Rehm, G. W., M. A. Schmitt, and R. C. Munter. 1995. Fertilizer Recommendations for Agronomic Crops in Minnesota. University of Minnesota Extension Service. BU-6240.
Rehm, G. W., M. A. Schmitt, and R. C. Munter. 1994. Fertilizing Corn in Minnesota. University of Minnesota Extension Service. FO-3790.

294/9/99
Probability of Corn Yield Response to P2O5Fertilization Across a Glacial Till Landscape
Relative Soil Test Level
Probability of Response
Bray-1 P Olsen P
(%) (ppm) (ppm)
Very low NA 0-5 0-3
Low 80 6-10 4-7
Medium 60 11-15 8-11
High 25 16-20 12-15
Very high 7 21+ 16+
NA = Information not availableSource: John Lamb, University of Minnesota, 1998
In a study measuring corn yield response to P2O5 fertilization across three Minnesota locations, the probability of grain yield response to fertilization decreased as the soil test values increased. This small plot research found similarly that soil testing can predict crop response to nutrient applications.
For example, with a medium Bray P soil test of 14 ppm, we can expect a 60% chance of yield response to added phosphorus. Because of variability in soil sampling, climate effects and other factors, it is best described as the probability of a fertilizer response.

304/9/99
Crop Nutrient NeedsUniversity of Minnesota nutrient recommendations based on the soil
test example and table rates for 140 bushel corn following corn.130 lbs. N/acre
35 lbs. P2O5/acre broadcast60 lbs. K2O/acre broadcast
Subtract other available nutrient credits– Second year N credit from a legume crop– Credit from previous manure applications
OR– N credit based on a soil nitrate test
In this example, with a yield goal of 140 bushels, Bray P test of 14 ppm, and K test of 110 ppm, the resulting recommendations are to apply 120 lbs N/acre plus 35 lbs P2O5 per acre broadcast and 60 lbs K2O per acre broadcast.
What is missing?
What about a second year legume credit? Credits for a past manure application? OR, a credit from a spring nitrate test?
Subtract the second year legume credit and credits for previous manure applications, if any, from the recommendation, or use a spring nitrate test and then subtract that credit from the recommendation.

314/9/99
Second-year nitrogen credit provided by legumes for a corn cropLegume Crop 2nd Yr
N Credit
lbs/acreSoybeans 0 Harvested alfalfa 4 or more plants/sq ft 75 2-3 plants 50 1 or less plants 0 Red clover 35
Nitrogen credits from alfalfa can be substantial. These second-year legume credits are for growing corn and not for other crops.
Source: Rehm, G. W., M. A. Schmitt, and R. C. Munter. 1995. Fertilizer Recommendations for Agronomic Crops in Minnesota. University of Minnesota Extension Service. BU-6240.
Rehm, G. W., M. A. Schmitt, and R. C. Munter. 1994. Fertilizing Corn in Minnesota. University of Minnesota Extension Service. FO-3790.

324/9/99
Nitrogen Crediting using the Spring Nitrate-N Test
South-central, southeastern and east-central Minnesota• Determine N recommendation using U of MN table values• Determine if conditions for residual soil nitrate-N exist• If warranted, collect a representative 0-2 ft soil sample• Determine residual N credit by converting ppm nitrate-N to lbs.
N/acre• Subtract N credit from N recommendation
Don’t confuse this test with the nitrate test for western Minnesota. This particular test is useful when growing corn under specific climatic and management conditions.
1. First determine the N recommendation from the tables.
2. Next, determine if conditions exist for residual, or carryover nitrogen. Don’t use this test if commercial fertilizer was applied the previous fall.
3. After that determination, collect a 0-2 ft. sample. From the test analyses, convert ppm nitrate-nitrogen to an N credit (lbs N per acre).
4. Subtract the N credit form the N table recommendation.
Source: Schmitt, M. A., G. W. Randall, and G. W. Rehm. 1998. A Soil Nitrogen Test Option for N Recommendations with Corn. University of Minnesota Extension Service. FO-6514.

334/9/99
Will there be residual soil nitrogen?
No
Alfalfa
Yes
Yes
No
No
Manured
Soybean
Yes
Yes
Yes
Low
No
High
Precipitation
No
Manured
Corn
Crop
If the field has a history of manure application and corn is planted following corn, then the spring nitrate test will be useful.
•Fall manure applications made before October 1 of the prior year will have most of the N from manure measured by the test. However, nitrogen from manure applied after October 1 may not be reflected in a spring nitrate test because the manure N has not had time to convert to the nitrate form.
•The amount of N available will depend on soil temperature and moisture between the time of manure application and soil sampling.
•Take the spring nitrate soil test before any spring manure applications.The soil nitrate test works best for medium or fine textured soils derived from loess or glacial till.The spring soil nitrate test is useful where continuous corn is planted and precipitation the previous year has been low.
Source: Schmitt, M. A., G. W. Randall, and G. W. Rehm. 1998. A Soil Nitrogen Test Option for N Recommendations with Corn. University of Minnesota Extension Service. FO-6514.Source: Rehm, G. W., M. A. Schmitt, and R. D. Eliason. 1999. Using the Soil Nitrogen Test in Minnesota. University of Minnesota Extension Service. FO-7130.

344/9/99
Soil nitrogen credit based on a0-2 ft preplant soil nitrate-N test
Nitrate-N(ppm)
N Credit(lb./acre)
0-6.0 0
6.1-9.0 35
9.1-12.0 65
12.1-15.0 95
15.1-18.0 125
18.1+ 155
Conversion between the soil nitrate-N concentrations measured from a spring soil test to a nitrogen credit for a growing crop.
Determine the final nitrogen recommendation by subtracting the residual N credit from the previously determined N recommendation.
Source: Schmitt, M. A., G. W. Randall, and G. W. Rehm. 1998. A Soil Nitrogen Test Option for N Recommendations with Corn. University of Minnesota Extension Service. FO-6514.

354/9/99
Nutrient Applications for the Planning Year
1. Manure applications– on farm resource
2. Commercial fertilizer applications– off farm purchase
After a crop nutrient plan has been developed from nutrient recommendations based on crop and soil conditions, managing the nutrients in the amount, form, placement and timing of application is the next process to better utilizing nutrients for crop production and reducing the potential of nutrients in becoming pollutants of our water.
•Manure is an on-farm source of organic fertilizer that has benefits for crops•Essential minerals for crop growth•Addition of organic matter
•Commercial fertilizers are an off-farm source of many of the same minerals that can be found in manure.

364/9/99
Crop Nutrient Planning andManure Management
I. Plan Development InformationII. Crop Nutrient RequirementsIII. Manure Management

374/9/99
Determining Manure Credits
Critical Information• Application rate• Manure nutrient content• Nutrient availability to the crop after application
In order to determine first, second, and third year manure credits, you need to know the manure application rate, manure nutrient content, and manure application method.

384/9/99
Spreader CalibrationsCalculating tons or gallons per load
Methods• Known volumes - if the volume of the manure spreader is known, it
may not have to weighed. (i.e. 4,000 gallon tank)– Use 90% of listed volume as average hauling load
• Load cells - when volume is unknown, it can be determined by weighing with load cells
In order to determine manure application rates, the spreader must be calibrated. The first step in calibrating spreaders is to determine the manure spreader’s capacity (tons or gallons) per load. There are two common methods for determining manure spreader weights or volumes.
Method 1 - Known Volume: Many liquid manure spreaders have their hauling capacities listed on the side of the tank. If so, assume that actual volume is approximately 90% of listed volume with the remaining 10% of the volume lost because of foaming.
Method 2 - Load Cells: If the manure spreader capacity is unknown, use load cells should to accurately calculate manure spreader capacities.

394/9/99
Spreader CalibrationsLoad Cells
By placing a load cell under each of the spreader tires and one under the hitch, the weight of the manure spreader can be determined
Load Cells
1. Place load cells in front of every tire on the manure spreader.2. Pull the spreader up onto the load cells making sure that the entire weight of the wheel is resting on the weigh pad and not partially resting on the ground.3. Place a load cell beneath the tongue of the spreader; place a jack on the load cell and jack up the tongue until it no longer is resting on the tractor hitch - do not unhook the spreader from the tractor.4. Add the weights displayed on each load cell to determine the total weight.
Repeat Steps 1 - 4 for the empty and the full spreader. Subtract the empty weight from the full weight to determine the net weight of manure.

404/9/99
Spreader Calibrations
Determining the Area Covered
Use a measuring wheel or tape to measure the width and length of manure application
Length X Width43,560 sq. ft/acre
= Acres covered
When determining the area covered, adjust spread width for overlap associated with broadcast manure application. One way to determine spread width is to measure from the left wheel track of current pass to the left wheel track of the previous pass.1. With a measuring wheel or tape, measure the length and the width of manure application.2. Multiply the length x width to determine total square feet.3. Divide by 43,560 feet to determine acres.

414/9/99
Manure SamplingNutrient Content of Manure Varies Greatly• Animal species• Size and number• Diet• Handling• Storage
Livestock picture
The nutrient content of manure varies greatly, depending on:•Animal species: Different species of animals require different levels of nutrients like N, P, and K in their diets. These differences also are reflected in the amount of nutrients they excrete.•Diet: Not all rations are the same. The amounts of N, P, and K excreted depends on the diet of the animal. Because water is a major constituent of an animal’s ration, how it is supplied to animals impacts on manure nutrient content. Wet feeders, for example, reduce the amount of water wasted in a hog barn. Because less water is wasted, less seeps into the storage facility and there is less dilution of manure nutrients.•Handling: Manure handling has an impact on manure nutrient content. Forexample, manure from a dairy free stall barn can be flushed or scraped to outside pits. Scraped manure has higher nutrient concentrations because it is not diluted with flush water.•Storage: The manure storage system used by livestock facilities affects manure nutrient content. Beneath-barn pits have higher nutrient concentrations than manure stored in outside basins. Because there is no dilution by rainfall.

424/9/99
Variability of Nutrients in Liquid Dairy and Swine Manure in SE MN, 1990-92
Specie Nutrient Average Range
lbs/1000 gal
N 29 10 – 47
Dairy P2O5 15 6 – 28
K2O 24 11 – 38
N 48 7 – 107
Swine P2O5 28 3 – 64
K2O 21 7 – 51
This slide illustrates the variability of nutrients in dairy and swine manure due to such factors as diet, species, manure handling, and manure storage. This variability makes sampling is necessary.
Source: Wagar, T. L., M. A. Schmitt, C. J. Clanton, and F. G. Bergsrud. 1998. Livestock Manure Sampling and Testing,, University of Minnesota Extension Service. FO-6423.

434/9/99
Manure SamplingNumber of Samples Needed• Agitated liquid slurries 1• Unagitated liquid slurries 3 or more• Lagoon liquids 1• Stored solids 3 or more
stacking slabs, piles, bedded packs• Scrape and haul 3 or more
Agitated liquid slurries and lagoon liquid manure storage systems need only one sample to determine nutrients in manure. With good agitation in emptying the manure storage structure there will be little variability in manure nutrient content. However, to sample unagitated liquid slurries or stored solids, variability requires more than one sample.
Source: Jarman, J. 1997. Manure Sampling and Analysis. USDA-Natural Resources Conservation Service. MN-NUTR6.

444/9/99
Manure Sampling ProcedureLiquid Manure• Retrieve samples from the top of the spreader using a plastic pail or
coffee can attached to a pole• Sampling should be done immediately after filling the spreaderSolid Manure• Collect manure from application equipment using a pitchfork, shovel
or plastic glove• Try to avoid large pieces or chunks of bedding
Sampling manure from application equipment is the most effective way to obtain a good sample.
For liquid manure, retrieve samples from the top of spreader using a plastic pail or coffee can attached to a pole.
For solid manure, collect manure from application equipment using a pitchfork, shovel, or plastic bucket.
Source: Jarman, J. 1997. Manure Sampling and Analysis. USDA-Natural Resources Conservation Service. MN-NUTR6.
454/9/99
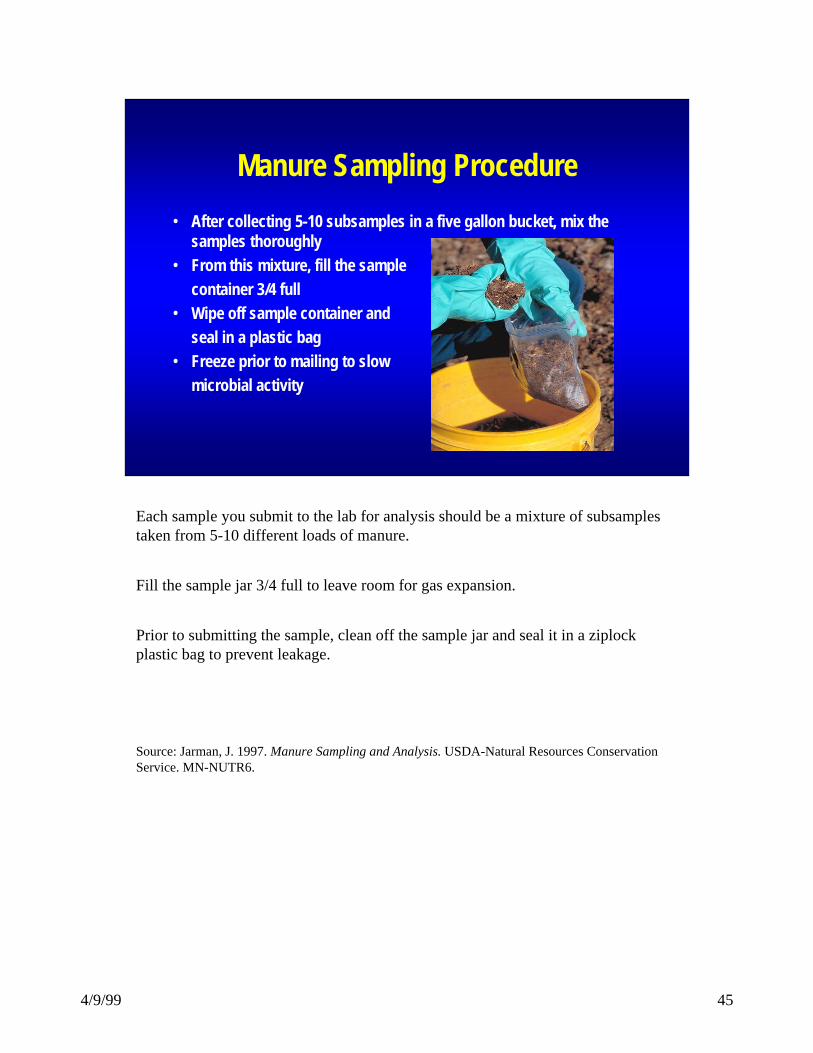
Manure Sampling Procedure• After collecting 5-10 subsamples in a five gallon bucket, mix the
samples thoroughly• From this mixture, fill the sample
container 3/4 full• Wipe off sample container and
seal in a plastic bag• Freeze prior to mailing to slow
microbial activity
Each sample you submit to the lab for analysis should be a mixture of subsamples taken from 5-10 different loads of manure.
Fill the sample jar 3/4 full to leave room for gas expansion.
Prior to submitting the sample, clean off the sample jar and seal it in a ziplockplastic bag to prevent leakage.
Source: Jarman, J. 1997. Manure Sampling and Analysis. USDA-Natural Resources Conservation Service. MN-NUTR6.

464/9/99
Manure Sampling Procedure• Mail samples early in the week• Send to a certified manure testing laboratory• Analyze manure for:
– Total nitrogen– Phosphorus– Potassium
Mail samples early in the week so that they do not sit in the post office over the weekend. Freeze the samples to slow down microbial activity.
Contact the Minnesota Department of Agriculture for a list of manure test labs. The Minnesota Department of Agriculture is the certifying agency for manure testing laboratories in Minnesota.
Typical manure test options include percent moisture, nitrogen, P2O 5 and K2O along with N, P2O5 and K2O in pounds/ton or pounds/1,000 gallons. At a minimum, test manure for total N, Phosphate and Potash. For an additional fee, manure can also be analyzed for inorganic N (ammonium). This is an optional test used only for swine manure from a covered pit with possible high levels of inorganic N.

474/9/99
Manure Sampling FrequencyOutdoor Storage Structures• Sample every time pit is emptied• Sample until a farm specific average can be established• Nutrient contents may vary greatly with management changes in the
operation or rainfall differences between years Indoor/Covered Storage Structures• Sample until a farm specific average can be established• Take new manure samples if a management change was made that
could affect nutrient content
Manure from outdoor storage structures should be sampled every time the pit is emptied. Because temperature and precipitation will vary between years, there will be changes in manure nutrient content from dilution, evaporation, leaching, and volatilization.
Manure stored in beneath barn pits or in covered above ground tanks will not vary as much between applications unless there are changes in animal species, size, feed, bedding, or handling. However, sample manure annually to establish a base line. After the base line is established, sample manure every three years unless you change your operation.

484/9/99
Manure Test Results• Use results reported on an “As Is Basis”… not on a dry basis• Work in the same units as those used to calibrate spreading
equipment– lbs./ton– lbs./1000 gallons
• Use results reported for phosphate (P2O5) and potash (K2O) not phosphorus and potassium– P x 2.29 = P2O5
– K x 1.2 = K2O
Manure test results are given either on an “as is” basis or on a dry basis. Always use the “as is” basis. Also, make sure that the manure test results are reported in the same units as were used to describe the manure application rate.
For Example: Rate Content20 Tons/acre - 60 Pounds/ton
NOT 20 Tons/acre - 60 Pounds/1,000 gallons
Manure test results often will list P and P2O5 as well as K and K2O. Always use P2O5 and K2O when crediting manure applications because the crop nutrient tables used to recommend agronomic rates require these forms.

494/9/99
Nutrient Availability• Nitrogen availability is affected by:
– Application method– Incorporation timing– Number of crop years following application
• Phosphate and potash– First-year credit only– P2O5 => 80% available – K2O => 90% available
Not all nitrogen applied is available for crop production. Some is lost to the atmosphere through volatilization or denitrification. Of the remaining N, somewill be available to crops immediately, buy the organic N (proteins, amino acids) must be broken down by soil microorganisms over a period of years. How one applies manure has the largest impact on nitrogen loss and mineralization rates.For Example:Broadcast without incorporation - Manure is applied to the soil surface and not incorporated.
•Increased N loss: Large amounts of N are lost through volatilization when manure is not incorporated. Ammonium ==> Ammonia.•Decreased mineralization: Mineralization of nitrogen is reduced if manure is not incorporated
Broadcast Incorporation/Injection - Manure is incorporated after application or injected with sweeps or knives
•Decreased N volatilization: Ammonium is not lost as ammonia because manure is incorporated or injected into the soil.•Increased mineralization: Good soil manure contact converts organic nitrogen to nitrate and enhancing microbial activity
Unlike nitrogen, the manure application does not affect phosphate and potash. In the first year, approximately 80% of phosphate and 90% of potash is available to crops.

504/9/99
Nitrogen AvailabilityPercent of nitrogen available the first year
Application Method Beef Dairy Poultry Swine
Broadcast
incorporated <12 hrs 60 55 70 75
incorporated <4 days 45 40 55 55
no incorporation 25 20 45 35
Injection
knife 50 50 70
sweep 60 55 80
The first0year nitrogen availability values are based on average values, which are dependent upon application method and animal species. Solid manure type systems, especially swine, that utilize large quantities of bedding may have lower N availability values for the first year than the values in the table. Large quantities of bedding in the manure increases the slowly released organic portion over that of the readily available ammonium portion.
Note the greatest first year availability is obtained with sweep injection or broadcast with immediate incorporation because they limit N loss and promote N mineralization.
Source: Schmitt, M. A. 1999. Manure Management in Minnesota. University of Minnesota Extension Service. FO-3553.
514/9/99
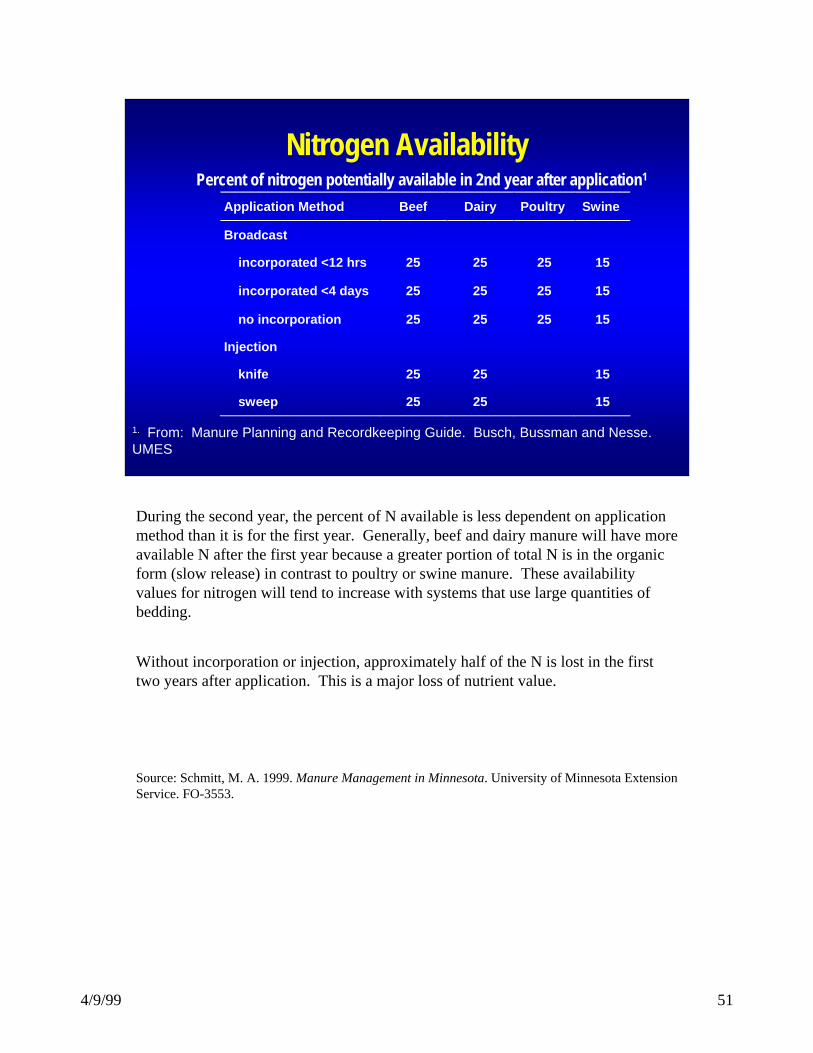
Nitrogen Availability
Application Method Beef Dairy Poultry Swine
Broadcast
incorporated <12 hrs 25 25 25 15
incorporated <4 days 25 25 25 15
no incorporation 25 25 25 15
Injection
knife 25 25 15
sweep 25 25 15
Percent of nitrogen potentially available in 2nd year after application1
1. From: Manure Planning and Recordkeeping Guide. Busch, Bussman and Nesse. UMES
During the second year, the percent of N available is less dependent on application method than it is for the first year. Generally, beef and dairy manure will have more available N after the first year because a greater portion of total N is in the organic form (slow release) in contrast to poultry or swine manure. These availability values for nitrogen will tend to increase with systems that use large quantities of bedding.
Without incorporation or injection, approximately half of the N is lost in the first two years after application. This is a major loss of nutrient value.
Source: Schmitt, M. A. 1999. Manure Management in Minnesota. University of Minnesota Extension Service. FO-3553.

524/9/99
Calculate Manure Application RateWhat nutrient?
What are the crop nutrient needs?
Rate = Nutrient needs / (Analysis x Availability)
To calculate a manure application rate:•First - Determine what crop nutrient to balance with the needs of the crop given the specific soil conditions.Example: For corn, the nutrient typically used to base a manure application is nitrogen because of the high nitrogen needs of a corn crop. In other situations, other nutrients like phosphorus may need to be used as a base for manure applications because of environmental considerations.•Second - Determine the crop nutrient needs based on soil tests, previous crop, and credits from past legume crops and/or past manure applications
Application rate is the result of crop nutrient needs divided by nutrient content in the manure analysis times the nutrient availability of the manure to the crop.

534/9/99
Manure ApplicationsExample:
Liquid dairy manureCalibrated application rate of 6000 gallons/acre (knifed in)
Manure analysis Application rate Nutrient applied(per 1000 gal)
31 lbs. N x 6 = 186 lbs. N17 lbs. P2O5 x 6 = 108 lbs. P2O5
27 lbs. K2O x 6 = 162 lbs. K2O
Example: Manure application:In order to make better use of the available nutrients, a dairy operation has calibrated its manure application equipment and has taken the necessary manure samples.•The liquid dairy manure was knifed into the soil at a known (calibrated) rate of 6,000 gallons per acre.•The manure test report stated that the manure contains 31 lbs. of nitrogen, 17 lbs. of P2O5, and 27 lbs. of K2O for every 1000 gallons.•The result is 186 lbs. of nitrogen, 108 lbs. of P2O5, and 162 lbs. of K2O applied to the soil.

544/9/99
Manure ApplicationsExample:
Nutrients applied Availability factor Nutrient availability1st-yr. After 1st-yr.
186 lbs. N x 0.5 (0.4) = 93 lbs. (74 lbs.)108 lbs. P2O5 x 0.8 = 86 lbs.162 lbs. K2O x 0.9 = 146 lbs.
Nutrients in manure that are applied to the soil are not all available for crop uptake•Some nutrients are lost to the environment.•Some nutrients exist in an unavailable form (organic fraction) and released during mineralization.
In the dairy manure example, 50% of the N will be available the first crop year after a knife injected manure application with 40% will be available in subsequent years. This results in 93 lbs. of available nitrogen per acre for the next corn crop and 74 lbs. per acre of available nitrogen remaining.
Phosphate and potash are more readily available (approximately 80% and 90% respectively) to the following crop with no subsequent amounts available in following years.

554/9/99
Example SummaryCrop Needs Nutrients Available From Manure Difference
(140 bu/acre corn) (6000 gallon rate)130 lbs. N 93 lbs. N - 37
35 lbs. P2O5 86 lbs. P2O5 + 5160 lbs. K2O 146 lbs. K2O + 86
• Approximately 40 lbs. of additional N is needed from commercial fertilizer
• P2O5 and K2O needs have been met– Soil test levels will be raised from nutrients applied above crop needs
Nutrients being supplied by manure for a 140 bushel yield goal corn crop with corn as the previous crop and a soil organic matter content of medium to high.
At the 6000 gallon manure application rate, additional nitrogen from other sources will be required.Nearly 2.5 times more P2O5 and K2O were applied to the soil than needed by the corn crop.
•Soil test levels for P2O5 and K2O will increase
To meet all the nitrogen needs of this corn crop, an 8000 gallon rate could be applied which would result in 124 lbs of nitrogen per acre available for a corn crop the first year and 99 lbs per acre for the second. However, the 8000 gallon rate would supply 109 lbs P2O5 and 194 lbs K2O per acre for the corn crop or 3 times more than is needed. Soil test levels started out in the medium category for P2O5 and K2O but these levels will increase quickly if manure is applied on a yearly basis.
A recommended plan of action is to apply manure to this field situation every two to three years to slow the climb in P2O5 soil test levels, especially once the soil test level reaches the very-high category.

564/9/99
Nitrogen vs. Phosphorus
for determining manure applications
Applying nutrients beyond what a crop needs can have a detrimental impact on profitability and on the environment
We learn from the previous example that selecting nitrogen or phosphorus as a basis for manure application rates requires a balance between meeting crop needs for nitrogen and avoiding a buildup of phosphorus to excessive levels in the soil which might pollute runoff water.

574/9/99
Nitrogen Cycle
Nitrogen cycleRegardless of source (plant residue, animal waste, biological fixation, commercial fertilizer or precipitation) nitrogen goes through a cycle in the soil.Plants use N either as the ammonium(NH4
+) or the nitrate(NO3-) form
•Ammonium attaches to soil particles and can be lost with soil erosion. It also can be volatized into the atmosphere as ammonia(NH3) if left on the soil surface.•Ammonium is quickly converted to the nitrate form through the nitrification process. When soil temperatures are above 50 degrees F.•Nitrate does not attach to any soil component and is easily moved with water through soil.
•Nitrate leaches to groundwater and can cause nitrate toxicity ofdrinking water •Nitrate leaches to tile lines and enters surface waters and can cause nitrate toxicity of drinking water or oxygen depletion in marineecosystems such as the Gulf of Mexico
•Nitrate can be lost to the atmosphere as nitrogen gas during water-logged soil conditions (denitrification).
Some nitrogen is contained within the soil organic matter and soil micro-organisms and is released during decomposition.

584/9/99
Nitrogen Loss Potential for MNApplication Soil texture
Zone method Coarse Medium Fine
A, B Fall VH M-H1 M
Spring preplant H M M
Sidedress or split M L L
C, D Fall VH L L
Spring preplant H L L
Sidedress or split M L L
E, F Fall M-H2 L L
Spring preplant L-M2 L L
Sidedress or split L-M2 L L
Potential ratings: VH=Very high, H=High, M=Moderate, L=Low1 Higher values are specific to zone A2 Higher values are specific to zone F
Nitrogen Loss Zones
•A
ABC
D
E F
Nitrogen loss is related to soil texture, N application timing, and location (generally related to rainfall). This chart helps make management decisions that can lower potential nitrogen loss.
Soil texture: Coarse soil texture = sandy soil conditionsMedium soil texture = loamy soil conditionsFine soil texture = high clay soil conditions
Eliminating fall N applications in the karst region of Southeast Minnesota and in all coarse textured soils statewide is important for reducing groundwater nitrate contamination.
Sidedress or split applications appear to have the lowest potential for N loss•If the application timing is early enough for the crop to use the nitrogen (generally by the time the corn plant reaches 12 inches in height).•Late application and/or low rainfall can lead to greater residual N after crop use and could leach to tile or groundwater.
Source: USDA-Natural Resources Conservation Service. 1998. Nutrient Management Conservation Practice Standard. NRCS-Minnesota. Code 590.

594/9/99
Phosphorus Cycle
There is an equilibrium between the solution P (available form for plant uptake), active P in the organic and inorganic forms that replenish the solution P, and fixed P contained in the insoluble compounds.
Phosphorus is much less mobile in the soil than nitrate N. Most P, with the exception of solution P, is contained in particles of soil or organic matter, which are transported during soil erosion.
Phosphorus usually is the limiting nutrient for algae growth in lakes and rivers. Small increases in available P will lead to rapid increases in algae growth in surface waters.
Source: Busman, L. M., J. A. Lamb, G. W. Randall, G. W. Rehm, and M. A. Schmitt. 1997. The Nature of Phosphorus in Soils. University of Minnesota Extension Service. FO-6795.Source: Rehm, G. W., J. A. Lamb, M. A. Schmitt, G. W. Randall, and. L. M. Busman. 1997. Agronomic and Environmental Management of Phosphorus. University of Minnesota Extension Service. FO-6797.

604/9/99
Phosphorus Loss Potential• Soil erosion• Runoff• Soil P test level• Inorganic P fertilizer rate• Organic P fertilizer rate• Fertilizer application method and timing
Soil erosion and runoff are the two main factors that affect the transport of phosphorus to surface waters.
•Particulate P is attached to particles such as soil or organic matter.•Soluble or dissolved P is in solution with runoff water.•Other factors like soil particle size (soil texture), slope, and rainfall are important in determining P loss potential with erosion and runoff.
Long-term P2O5 fertilizationat rates above crop needs have resulted in widespread increases in soil test P levels.
•Accumulation of high phosphorus levels near the soil surface increases the probability of P to be lost with erosion.•When surface soil test P levels are excessive, P enters runoff water in solution, and immediately is available for algae growth.
Potential for loss of P in runoff is directly influenced by the rate, method, and time of P application.
•Loss potential is greatest shortly after application, especially if rainfall occurs soon after surface applications.•Applications below the soil surface or incorporating the fertilizer after application reduce the potential for P loss.
Source: Randall, G. W., D. J. Mulla, G. W. Rehm, L. M. Busman, J. A. Lamb, and M. A. Schmitt. 1997. Phosphorus: Transport to and Availability in Surface Waters. University of Minnesota Extension Service. FO-6796.

614/9/99
“Best Management Practices”BMP’s
• Economically sound, voluntary practices that help protect the environment
• Research based• Specific to particular regions, farms or fields• Specific to the nutrient or chemical being used
“Best Management Practices” (BMP’s) are agricultural practices that minimize nutrient contamination of surface and groundwater while maximizing profitability.
Developing a nutrient management plan is one step toward providing for a specific crop needs while reducing the potential for water quality problems.
Research conducted by the University of Minnesota and other land-grant universities provide a sound basis for the BMP’s
Many BMP’s are broad-based and can be adopted into production systems across the state of Minnesota. Some specific regions of the state, however, may have unique problems (i.e. karst topography in Southeast Minnesota) and specific BMP’s are recommended for those areas.

624/9/99
Best Management Practices for Applying Nitrogen
• Avoid fall applications on sandy soils• Spring applications before planting or after the crop emerges is
highly recommended• Use a nitrification inhibitor with fall or early spring applications if
soils are poorly drained• Delay fall applications until soil temperatures reach 50o F• Additional BMP’s for specific regions
Because of the special characteristics of sandy soils (low water-holding capacity and low organic matter), nitrogen easily leaches below the rooting zone of plants producing nitrogen-starved crops. Timing nitrogen applications to when the crop will best utilize the nutrient is recommended for all situations but especially for sandy soil situations. This practice is environmetally and agronomically sound.
Delaying the conversion from the ammonium form of nitrogen to the nitrate form of nitrogen is another way to reduce nitrogen loss.
•Use nitrification inhibitors at application time to inhibit bacteria that convert ammonium to nitrate.•Delay application until soils cool in the fall and the conversion process slows.
Here are University of Minnesota nitrogen BMP’s for specific regions of the state:BMP’s for Nitrogen Use in Southeastern Minnesota, AG-FO-6126, 1993BMP’s for Nitrogen Use in South-Central Minnesota, AG-FO-6127, 1993BMP’s for Nitrogen Use in Southwestern and West-Central Minnesota, AG-FO-6128, 1993BMP’s for Nitrogen Use in East-Central and Central Minnesota, AG-FO-6129, 1998BMP’s for Nitrogen Use in Northwestern Minnesota, AG-FO-6130, 1995BMP’s for Nitrogen Use on Irrigated, Coarse-Textured Soils, AG-FO-6131, 1993

634/9/99
Land Application Guidelines for Manure
• Incorporate broadcast applications • Avoid fall applications on sandy soils• Avoid applications to sloping, frozen soils• Adjacent to surface waters and tile inlets (within 300 ft)
– Incorporate within 24 hours (no filter strip)– No application on frozen or snow-covered soil
• Limit applications to P crop removal rates once soil test P levels are very high
Because manure contains several crop nutrients, take care to avoid loss of these nutrients from a field site. The focus of manure application is on nitrogen, a mobile nutrient in the soil and on phosphorus, a less mobile nutrient.
Incorporating manure at application or shortly thereafter allowa greater nutrient attachment to soil particles and minimizes loss due to surface runoff. Placing thenutrient below the soil surface also minimizes loss.
Avoid application timings and situations that present the greatest risk of nutrient loss:•Fall applications on sandy soils where the greatest potential for nitrate N leaching takes place.•Frozen soils where manure moves easily with snow melt can affect both nitrogen and phosphorus losses from the field.•Field areas adjacent and up slope from any surface water or tile inlet offer potential nutrient loss•Limit the buildup of soil test P levels above crop requirements for the crop or for the crop rotation once soil levels become very high. This is especially critical in areas adjacent to sensitive land features such as surface waters, open tile inlets and sink holes that can result in greater movement of P off the field.

644/9/99
Land Application Guidelines for Manure
• No applications on grassed waterways• Flood-prone soils
– Incorporate within 24 hours if frequently flooded– Incorporate within 72 hours if occasionally flooded– Apply at times of low flood probability
• Avoid applications to shallow soils– Less than 15 inches from bottom of incorporated manure to fractured bedrock
or water table
Additional situations that present high risk of nutrient movement:•Grassed waterways are direct channels for water movement off the field during runoff events, which can carry away nutrients placed in its path.•Soils that are prone to flooding have a greater potential of nutrient loss with receding water if the manure was on the surface at the time of flooding.
•“Frequently flooded” means a field where a flood occurs 50 to 100 times in 100 years (Soil Survey, USDA)•“Occasionally flooded” is a field situation where a flood occurs 5 to 50 times in 100 years (Soil Survey, USDA)•Apply manure to flood-prone soils during times of low flood probability and incorporate the manure
•Fractured bedrock may have large channels for water movement through the rock and nutrients (especially nitrogen) can move into the groundwater.

654/9/99
The Planning Processfor Nutrient Management
Record keeping• Starts with an inventory of farm information• Requires yearly maintenance of records
Plan Development• Field-specific information• Comprehensive nutrient budget
Management• Crop rotations• Planned manure applications• Commercial fertilizer use
1. Record-keeping•Determine source of all nutrients (from on-farm and off-farm sources) Start with estimates if actual records are not available.•Field-specific farm records allow:
•Development of field-specific plans•Continued monitoring of plan results•Adjustments to the plan made with confidence
2. Plan Development•Develop a comprehensive nutrient budget that considers all nutrient sources•Base the plan on University of Minnesota recommendations for crop production
3. Management•Economically optimize nutrients in a cropping system•Manage the amount, form, placement, and timing of:
•Manure applications•Commercial fertilizer applications
•Reduce movement of nutrients from the soil surface or from the root zone into surface or groundwater

664/9/99
The Crop Nutrient Management PlanFarm Record Components
• Field map• Soil and manure tests• Crop sequence• Description of livestock operation and manure system
Plan Development Components• Realistic yield• Nutrient sources and forms• Crop nutrient budget
Management Components• Recommended rates, timing and methods of application• Sensitive areas and appropriate practices• Operation and maintenance guidance
The basic nutrient management plan is comprised of several components that guide the producer in making decisions on location, rate, timing, form and method of nutrient applications.
Farm record components such as field maps (including field size and location,soil types, and location of sensitive areas), test analysis (including soil, manure, plant and water sample results), crop history, and a description of the livestock operation and manure system (including land area for manure application) will provide the base for the rest of the plan.
Plan development components determine the nutrients from all sources and compares this in a nutrient budget to the amount of nutrients required to meet a realistic yield goal for a crop.
Management components give the specifications for implementing a nutrient plan such as a recommended rate, timing and method of application, any additional practices that may need to be implemented for sensitive areas, and any operation and maintenance guidance (including plan review and update, equipment calibration and maintenance, record keeping, and safety considerations).

674/9/99
Credits
• Authors– Kevin Blanchet, Extension Educator, Environment and Natural
Resources – Dennis Busch, Extension Educator, Manure Utilization– Philip Nesse, Extension Educator, Manure Utilization– Jeff King, USDA-NRCS
• Project Manager– Don Breneman, Communication and Educational Technology
Services

684/9/99
Regents of the University ofMinnesota