Crop Monitoring and Food Security: the JRC action and … · Crop Monitoring and Food Security: the...
22
"Open Session on “Space for Agriculture and Food Security” Rome, 09 March 2012 World Food Program Auditorium Consultative - Crop Monitoring and Food Security: the JRC action and prospect Thierry Nègre European Commission Joint Research Centre - IES MARS Unit FAO - ESA [email protected]; [email protected] http://www.jrc.ec.europa.eu/
Transcript of Crop Monitoring and Food Security: the JRC action and … · Crop Monitoring and Food Security: the...

"Open Session on “Space for Agriculture and Food Security” Rome, 09 March 2012
World Food Program Auditorium
Consultative -
Crop Monitoring and Food Security: the JRC action and prospect
Thierry Nègre
European Commission Joint Research Centre - IES MARS Unit FAO - ESA
[email protected]; [email protected] http://www.jrc.ec.europa.eu/

MARS Unit activities
JRC : The European Commission's in-house science service
MARS (Monitoring Agricultural ResourceS) Unit: 60 staff in 4 actions:
- GEOCAP: Geomatics for the CAPcontrol
- CID: Community Image Data portal
- AGRI4CAST: crop production forecast in Europe; extension under development - FOODSEC (Food Security Assessment): crop monitoring & food security information mainly in sub-Saharan Africa

2 types of methods (choice of MS) based on Computer-Aided Photo Interp. [1] “standard” scenario: VHR+HR: 1 VHR image + n current year HR images [2] “VHR only” scenario: 1 VHR + rapid field visits
1 2
GeoCAP: Controls with Remote Sensing
Control of crop with 3 HR dates
Control of area with VHR image
Other use easily detected on imagery
Measurement time of this parcel (3 km perimeter) on image < time with GPS

Control of Good Agri-Environmental Conditions
Example of GAEC control: maintenance of landscape element (hedge, pond, isolated trees, trees in line or group of trees)
Images VHR (1m)
Reference year vs
Current year
Control by CAPI

General frame of the MARS crop monitoring system
MARS Crop monitoring system 30 staff Global data infrastructure
FOOD SEC AGRI4CAST
GEO Community of
Practice
Research Services Support
MARS OP (1-2-3) ALTERRA, VITO, MeteoConsult, GISAT Near real time Acquisition & processing
10-15 staff
1.5 M € / an
Earth observation
Meteo (observations & forecast)
Crop simulation
Visualization tools / DB
EFSA
EUROSTAT
DG TRADE
DG AGRI
DG DEVCO
EEAS
ECHO
DG ENTR GMES
Crop monitoring
Yield forecast
Crop area estimation
Climate change impact
Early warning
Partners:
-FAO, WFP
-USAID, FEWSNET
Collaboration agreements:
- USA, Brasil, Argentina, China, Kazakhstan, African Union, Agrhymet, RCMRD…
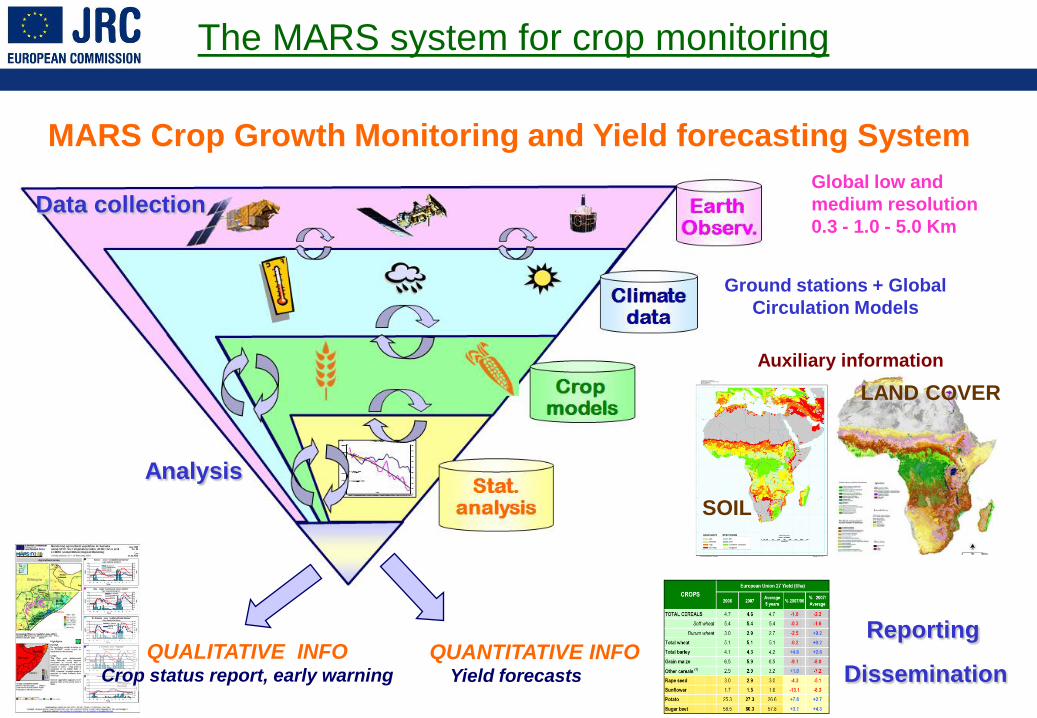
Global low and medium resolution 0.3 - 1.0 - 5.0 Km
Ground stations + Global Circulation Models
QUALITATIVE INFO Crop status report, early warning
QUANTITATIVE INFO Yield forecasts
MARS Crop Growth Monitoring and Yield forecasting System
LAND COVER
SOIL
Auxiliary information
Reporting
Dissemination
Data collection
Analysis
The MARS system for crop monitoring
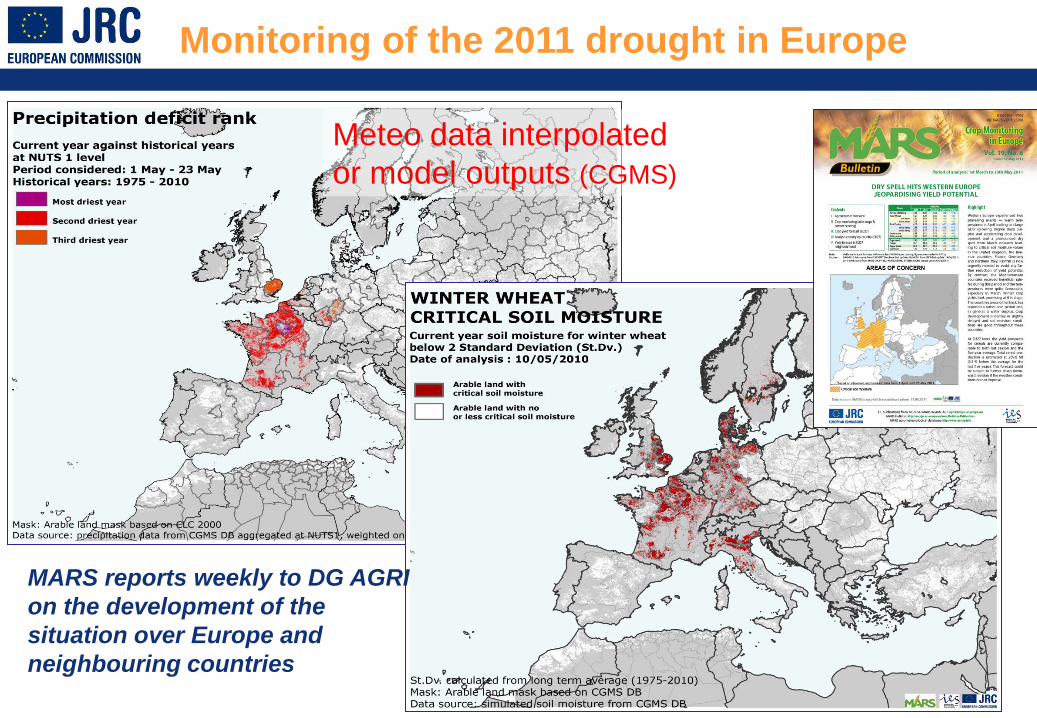
Monitoring of the 2011 drought in Europe
MARS reports weekly to DG AGRI on the development of the situation over Europe and neighbouring countries
Meteo data interpolated or model outputs (CGMS)

Spot VGT data at 1km -> NDVI, fAPAR 1st dekad of June NDVI anomaly (%) = (NDVI 2011 – NDVI mean 99-2010) / NDVI mean 99-2010
Monitoring of the 2011 drought in Europe
9 WFP - Rome, 05 December 2011 - Consultative Group on Food Security Analysis
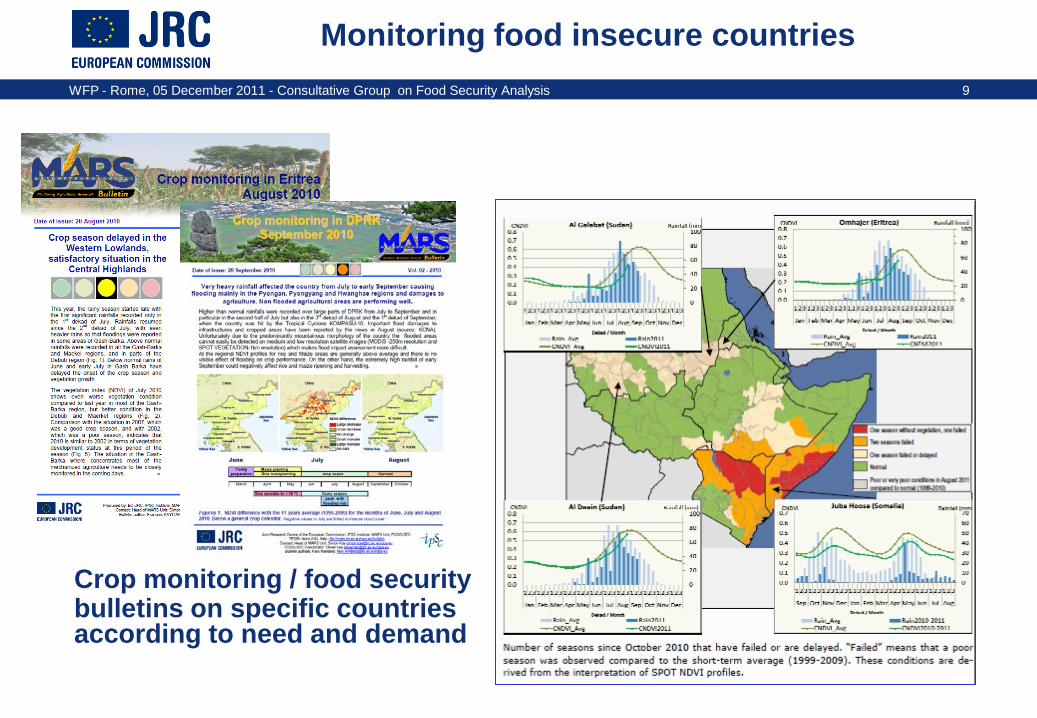
Crop monitoring / food security bulletins on specific countries according to need and demand
Monitoring food insecure countries

Qualitative monitoring and early warning
Need to focus on the right area and time (crop season)
Ex: Somalia 2009 vs 2008 & mean 99-08

2011 drought in Ethiopia
RFE
NDVI

Table Correlation Matrix of maize yield and the independent variablesWSI WEXt WDEFt ETAi ETAv ETAf ETAr ETAt Rain CNDVIc CNDVIx CNDVIa NDVIc NDVIx NDVIa
WSI 1WEXt 0.13 1WDEFt 0.92 0.28 1ETAi 0.30 -0.28 0.16 1ETAv -0.40 -0.14 -0.38 0.11 1ETAf 0.85 0.27 0.79 0.31 -0.28 1ETAr 0.82 0.34 0.81 0.33 -0.28 0.76 1ETAt 0.86 0.27 0.81 0.39 -0.17 0.98 0.86 1Rain 0.38 0.95 0.49 -0.13 -0.22 0.50 0.55 0.52 1CNDVIc 0.24 0.29 0.12 0.59 0.14 0.52 0.41 0.56 0.41 1CNDVIx 0.39 0.32 0.36 0.61 0.15 0.43 0.51 0.52 0.42 0.70 1CNDVIa 0.38 0.27 0.34 0.61 0.08 0.38 0.46 0.46 0.36 0.67 0.95 1NDVIc 0.18 0.31 0.06 0.58 0.13 0.44 0.34 0.48 0.40 0.98 0.70 0.67 1NDVIx 0.19 0.25 0.16 0.56 0.09 0.17 0.28 0.24 0.29 0.58 0.90 0.87 0.66 1NDVIa 0.22 0.21 0.19 0.54 -0.01 0.14 0.25 0.20 0.24 0.51 0.83 0.83 0.60 0.96 1Yield 0.51 0.35 0.46 0.57 0.06 0.66 0.65 0.73 0.52 0.87 0.78 0.77 0.82 0.59 0.52
-0.5
0
0.5
1
1.5
2
2.5
3
3.5
0.00 0.50 1.00 1.50 2.00 2.50 3.00 3.50
Observed maize yield (t/ha)
Estim
ated
mai
ze y
ield
(t/h
a)
R2 = 0.81RMSE=0.359 t/ha
CV= 23%
Estimation quantitative des rendements
• Similarity analysis • Regression analysis
– simple CNDVI yield regression – multiple regression with bio-climatic
indicators
Plus recherche qu’application opérationnelle
13 WFP - Rome, 05 December 2011 - Consultative Group on Food Security Analysis
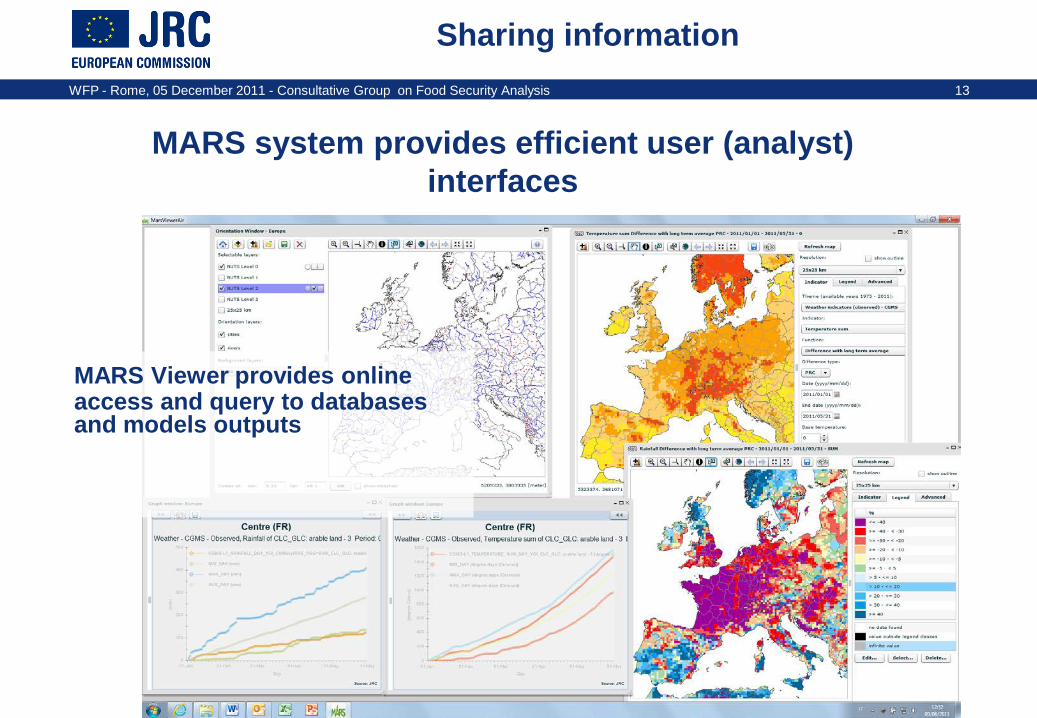
MARS Viewer provides online access and query to databases and models outputs
Sharing information
MARS system provides efficient user (analyst) interfaces

14 WFP - Rome, 05 December 2011 - Consultative Group on Food Security Analysis
Capacity building
• Customized methods, tools • IPC • National and regional bodies
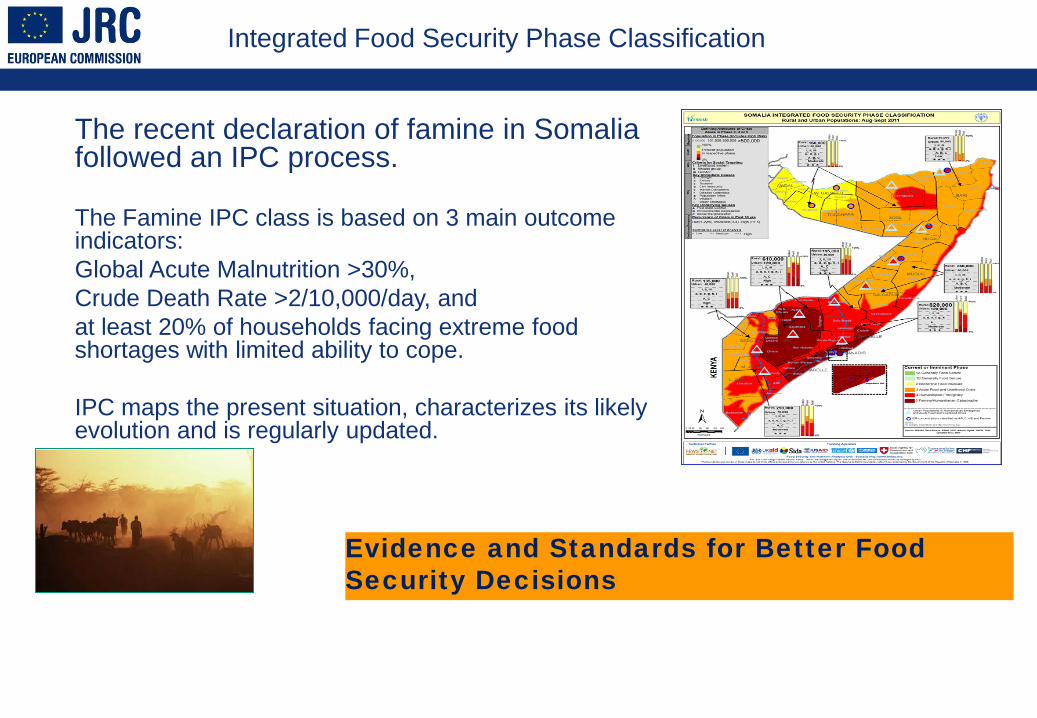
Integrated Food Security Phase Classification
The recent declaration of famine in Somalia followed an IPC process.
The Famine IPC class is based on 3 main outcome indicators: Global Acute Malnutrition >30%, Crude Death Rate >2/10,000/day, and at least 20% of households facing extreme food shortages with limited ability to cope. IPC maps the present situation, characterizes its likely evolution and is regularly updated.
Evidence and Standards for Better Food Security Decisions

JRC GLOBCAST Project
Feasibility study to cover the globe
• Monitor the impact of weather in the main grain producing areas
• Produce short-term forecasts
4 zones of the world main crops of interest: wheat, barley, rice, maize, rape seed, soybean, sugar cane
GLOBCAST is a feasibility study currently conducted for DG AGRICULTURE
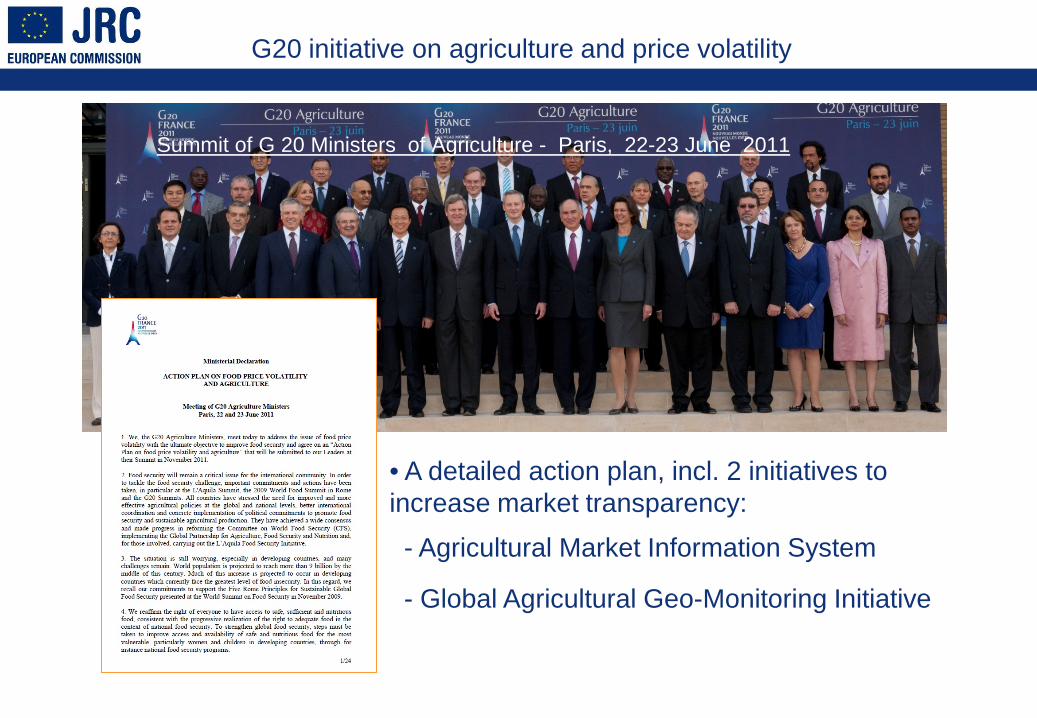
G20 initiative on agriculture and price volatility
Summit of G 20 Ministers of Agriculture - Paris, 22-23 June 2011
• A detailed action plan, incl. 2 initiatives to increase market transparency:
- Agricultural Market Information System
- Global Agricultural Geo-Monitoring Initiative

To reinforce the international community’s capacity to produce and disseminate relevant, timely and accurate forecasts of agricultural production at national, regional and global scales.
© GEO Secretariat
IKONOS
QuickBird
SPIN-2SPOT 4, 5
EROS A1
EnvisatEnvisatAura/Aqua/TerraAura/Aqua/Terra
GraceGrace
QuikScatQuikScatSageSage
SeaWindsSeaWindsTRMMTRMM
Toms-EP
UARSUARSLandsat 7Landsat 7
SORCESORCE
ACRIMSAT
CBERS
SeaWiFSSeaWiFS
ERBSERBS
JasonJason
Orbview 2, 3
Radarsat ALOS
DMC
EarthObservation
EarthObservation
MeteorologyMeteorologyMeteorology
Agronomy
Agro-economy
Agronomy
Agro-economy
Agronomy
Agro-economy
Cereal grain production per hectare (Source: SAGE, Univ. of Wisconsin, Madison, Wisc., USA)
Cultivated area / crop type area
Crop yield forecast
1. The GEO-GLAM Initiative : objectives
18

Action 1. Strengthening national capacities for agric. monitoring capacity development for the use of EO, experience sharing, research
Action 2. Global and regional agricultural monitoring Systems Harmonizing, connecting, strengthening inter-comparing existing systems, disseminating information.
Action 3. At risk regions and countries agricultural monitoring Improving monitoring methods, tools and systems for vulnerable agricultural systems
Action 4. Global Earth observation system of systems for agricult. Developing an operational system : coordinated satellite and in-situ Earth Observation and weather forecasting;
Long term commitment. Full and open data policy.
2. The GEO-GLAM Initiative : actions
19

Trade
Demand
Stocks
Price
Supply
Policies
Finance
GEOGLAM
AMIS
20
International effort to increase information availability,
quality and transparency
3. Linking and
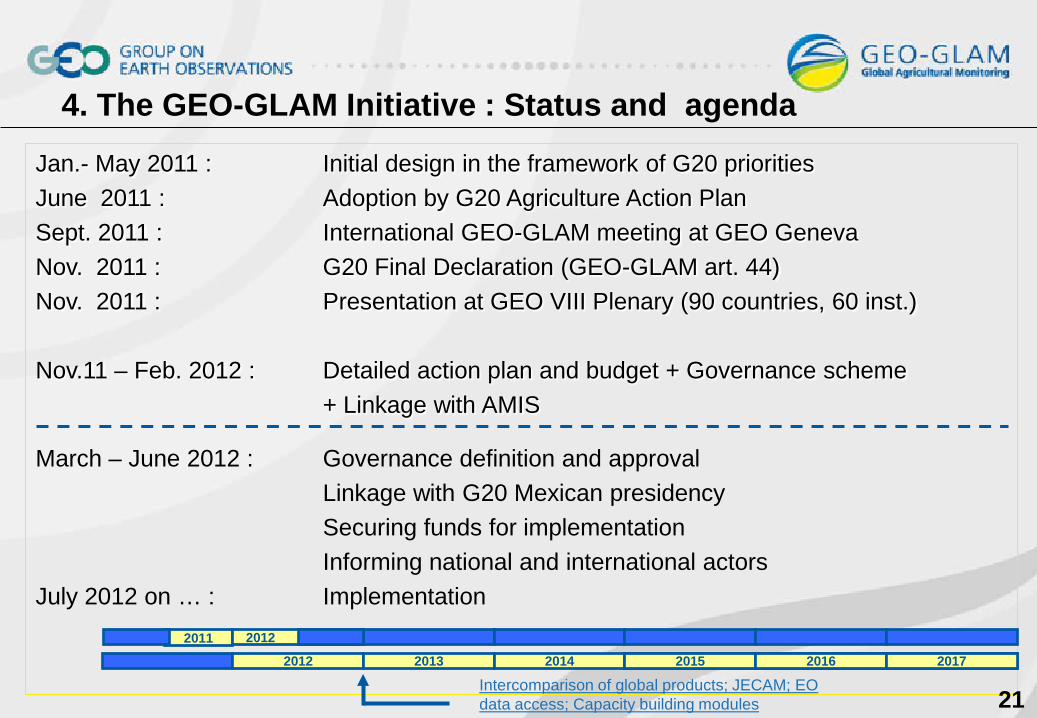
Jan.- May 2011 : Initial design in the framework of G20 priorities June 2011 : Adoption by G20 Agriculture Action Plan Sept. 2011 : International GEO-GLAM meeting at GEO Geneva Nov. 2011 : G20 Final Declaration (GEO-GLAM art. 44) Nov. 2011 : Presentation at GEO VIII Plenary (90 countries, 60 inst.) Nov.11 – Feb. 2012 : Detailed action plan and budget + Governance scheme + Linkage with AMIS
March – June 2012 : Governance definition and approval Linkage with G20 Mexican presidency Securing funds for implementation Informing national and international actors July 2012 on … : Implementation
4. The GEO-GLAM Initiative : Status and agenda
21
2012 2013 2014 2015 2016 2017
2011 2012
Intercomparison of global products; JECAM; EO data access; Capacity building modules
Consultative -
"Open Session on “Space for Agriculture and Food Security” Rome, 09 March 2012
World Food Program Auditorium
Thanks for your attention !
[email protected],[email protected] http://www.jrc.ec.europa.eu/ To know more about … Visit the MARS site http://mars.jrc.it/mars/About-us