Crop Insurance Quality Adjustment and Sampling Grading for ...
25
1 CROP INSURANCE: QUALITY ADJUSTMENT AND SAMPLING/GRADING FOR SOYBEAN RUST Risk Management Agency
Transcript of Crop Insurance Quality Adjustment and Sampling Grading for ...

1
CROP INSURANCE: QUALITY ADJUSTMENT AND
SAMPLING/GRADING FOR SOYBEAN RUST
Risk Management Agency

Production to Count (PTC)
¹PTC is calculated for crop insurance indemnity purposes using: ¾Appraised production and ¾Harvested production
¹For indemnity calculations, PTC is used along with actual production history (APH), acres planted, insurance level of coverage, crop share, quality adjustments, and uninsured causes of loss
2

Calculating coverage
¹Example of coverage calculation: ¾Producer has APH of 50 bu/acre ¾Producer plants 100 acres ¾Producer elects 60 percent coverage ¾Producer has 100% share in the crop ¾50 bu/acre X 100 acre X 60% X 100% = 3,000
bu coverage
3

Calculating indemnity for APH-based plans of insurance
¹Example with no quality adjustment and no uninsured causes of loss: ¾Producer harvested 100% of the 100 acre crop ¾Producer harvested 2,000 bu PTC ¾3,000 bu coverage – 2,000 bu PTC = ¾1,000 bu shortfall ¿Indemnity based upon 1,000 bu X price election X
100 % share
4

Quality adjustment
¹ Some policies provide for a reduction in the PTC when the quality of the appraised or harvested production is reduced due to insurable causes
¹ The quantity of mature production is reduced when it meets certain requirements
¹ This adjusted PTC is used for indemnity and APH purposes
5

Calculating indemnity for APH-based plans of insurance
¹Example with quality adjustment but no uninsured causes of loss: ¾Producer harvested 100% of the 100 acre crop ¾Producer harvested 2,000 bu ¾Production is quality adjusted from 2,000 bu to
1,000 bu PTC ¾3,000 bu coverage – 1,000 bu PTC = ¾2,000 bu shortfall ¿ Indemnity based upon 2,000 bu X price election X
100 % share 6

Uninsured causes of loss
¹Crop insurance does not cover losses due to uninsured causes ¹Examples include: ¾Failure to follow good farming practices (GFP) such as: ¿Not spraying for Asiatic soybean rust (ASR) when advised by
an Agriculture Expert or ¿Inadequate seeding rate
¾Inappropriate chemical usage such as: ¿Wrong chemicals, ¿Too much or too little, or ¿Poor timing
7

Determining production lost due to uninsured causes
¹Discuss with: ¾Producer to determine what did happen ¾Agricultural Experts to determine GFP,
chemical recommendations, and what should have happened
¹Compare to similar fields in the area where producers followed GFP and obtain: ¾Production data ¾Spray program information 8
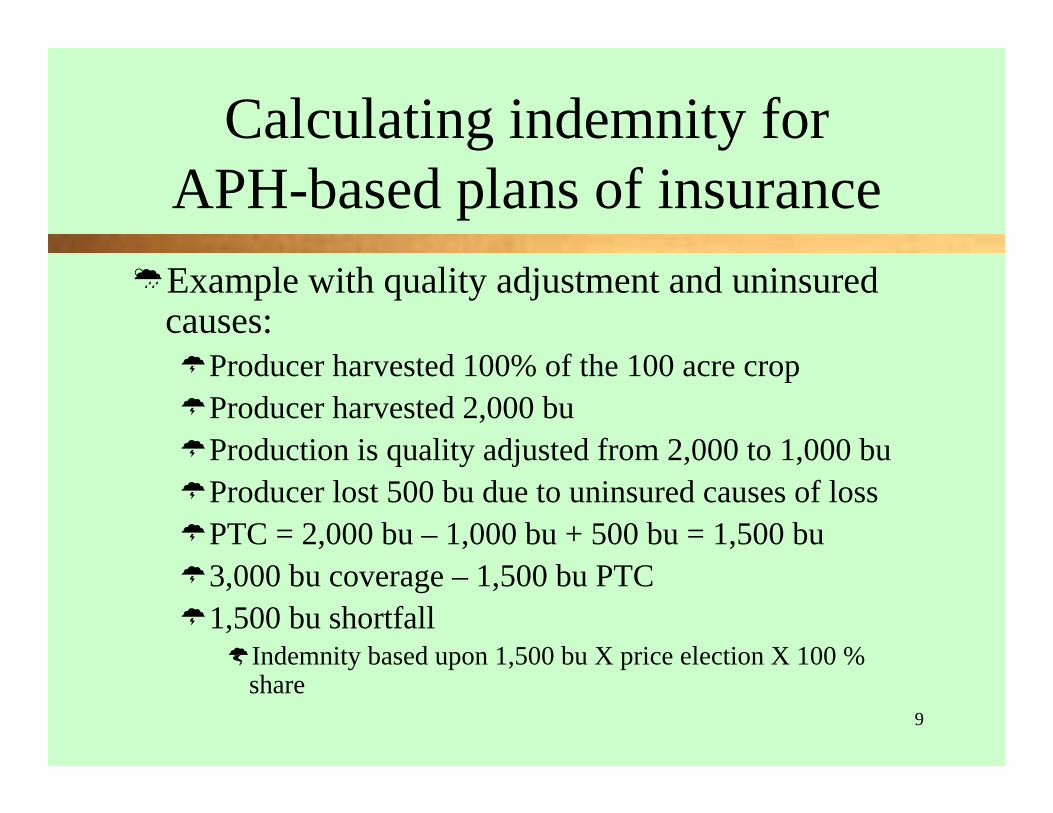
Calculating indemnity for APH-based plans of insurance
¹Example with quality adjustment and uninsured causes: ¾Producer harvested 100% of the 100 acre crop ¾Producer harvested 2,000 bu ¾Production is quality adjusted from 2,000 to 1,000 bu ¾Producer lost 500 bu due to uninsured causes of loss ¾PTC = 2,000 bu – 1,000 bu + 500 bu = 1,500 bu ¾3,000 bu coverage – 1,500 bu PTC ¾1,500 bu shortfall ¿Indemnity based upon 1,500 bu X price election X 100 %
share 9

Special Provisions of Insurance (SPOIs)
¹SPOIs: ¾Are part of the insurance contract ¾Modify the crop provisions ¾Exist on a county crop basis
¹Soybeans have quality adjustment discount factor (DF) charts ¾These charts are located in the SPOIs
10

Developing the charts
¾ Risk Management Agency (RMA) uses Farm Service Agency (FSA) loan discount data and national average loan rates for the past 10 years
¾ This data is compiled and the average of the last 10 years is used to construct the DFs
11

Who can grade production (excluding mycotoxins)?
¹ Grader licensed under the United States Grain Standards Act or the United States Warehouse Act (USWA)
¹ Grader licensed under State law and employed by a warehouse operator who has a storage agreement with the Commodity Credit Corporation (CCC)
¹ Grader not licensed under State law, but who is employed by a warehouse operator who has a commodity storage agreement with the CCC and is in compliance with State law regarding warehouses
12

2007 SPOI soybean charts
¾ Discounts for sample grade ¾ Discounts for low test weight from 48 pounds to 44.99
pounds ¿Test weight below 44 pounds is “off the chart”
¾ Discounts for excessive kernel damage (excluding heat damage) from 8.01 % to 35% ¿Damage greater than 35% is “off the chart”
¾ Discounts for sample grade factors ¿Musty Odor ¿Sour Odor ¿Commercially Objectionable Foreign Order (COFO)
13

1995 – 2006 quality adjustment procedure
¹Use chart values for most quality adjustment determinations ¾Called “on the chart”
¹Use bid or offer value of production based upon Reductions In Values (RIVs) for insured causes of loss during the insurance period ÷ local market price (LMP) = QAF for production of extremely poor quality or for production with conditions injurious to human or animal health ¾Called “off the chart”
14

2007 – present quality adjustment procedure
¹For “on the chart” production, use chart values as has been done since 1995
¹For “off the chart” production, use either: ¾Actual sale price (as opposed to bid or offer
value) based upon RIVs for insured causes of loss during the insurance period ÷ LMP = DF -or¾DF of .500
15

Determining the Quality Adjustment Factors (QAFs)
¹ The QAF is determined by subtracting from 1.000, the sum of all applicable pre-established DFs listed in the SPOIs or DFs derived from RIVs of the damaged production.
¹ The QAF is multiplied by the number of applicable bushels or pounds remaining after any reduction due to excessive moisture or foreign material (FM), in accordance with the crop provisions.
16

Determining QAF based on DFs (“on the charts”)
¹ 1,000 bushels of soybeans with 25% kernel damage and 48 pound test weight is designated as U.S. Sample Grade. (a) .175 (DF for kernel damage)
.007 (DF for test weight) +.111 (DF for Sample Grade)
.293 Total DF’s (b)1.000 - .293 = .707 QAF (c)1,000 bushels X .707 = 707 bushels to count
17

Not using the DFs on the SPOI (“off the chart”)
¹ If there are no pre-established DFs -or
¹ There are pre-established DFs on the SPOI, and there is at least one type/level of damage which exceeds the pre-established DFs (amount is off the chart), the pre-established DFs are not used to determine the QA factor
18

2007 - present Determining QAF based on RIVs
(“off the chart”) ¹ Assuming the production is sold prior to 60 days after the calendar date for the end
of the insurance period ¹ 1,000 bushels of soybeans with 45% kernel damage and 48 pounds test weight is
designated as U.S. Sample Grade. However, since the 45% kernel damage is off thechart, the producer may elect to sell their production and use the RIVs to determinethe DF
¹ Two examples: a) $3.50 (RIV for kernel damage) a) $1.00 (RIV for kernel damage)
+$ .85 (RIV for test weight) +$ .85 (RIV for test weight) $4.35 Total RIV $1.85 Total RIV
b) $4.35 Total RIV ÷ $5.50 (LMP) = b) $1.85 Total RIV ÷ $5.50 (LMP) = .791 (DF) .336 (DF)
c) 1.000 - .791 = .209 QAF c) 1.000 - .791 = .664 QAF d) 1,000 bu X .209 = 209 bu PTC d) 1,000 bu X .664 = 664 bu PTC
19

2007 - present Determining QAF based on RIVs
(“off the chart”) ¹ Assuming the production is not sold prior to 60 days after
the calendar date for the end of the insurance period ¹ 1,000 bushels of soybeans with 45% kernel damage and
48 pounds test weight is designated as U.S. Sample Grade. However, since the 45% kernel damage is off the chart, the producer may elect to use a DF of .500 at any time prior to 60 days after the calendar date for the end of the insurance date or feed or use the production and receive a DF of .500. a) Producer elects a .500 DF b) 1.000 - .500 = .500 QAF c) 1,000 bu X .500 = 500 bushels to count
20

2007 - present Determining QAF not based on RIVs
(“off the chart”) ¹Sold production will be quality adjusted based on the
dollar value amount received if sold prior to 60 days afterthe calendar date for the end of the insurance period (usingRIVs for insured causes of loss during the insuranceperiod)
¹Fed production that is fed prior to 60 days after thecalendar date for the end of the insurance period will beadjusted based on the .500 DF
¹Unsold and unfed production that remains unsold andunfed 60 days after the calendar date for the end of theinsurance period will be adjusted based on the .500 DF
¹The producer may choose to have their unsold and unfedproduction adjusted based on the .500 DF prior to 60 daysafter the calendar date for the end of the insurance period
21

2007 - present Determining QAF not based on RIVs
(“off the chart”) ¹Example (for 2007 and succeeding crop years): ¾Producer harvests soybeans on September 15 ¾According to the Coarse Grains Crop Provisions, the
calendar date of the end of the insurance period is December 10 ¾Producer has from September 15 until February 8 (60
days after the calendar date of the end of the insurance period) to sell, use, or destroy their production or elect to use the .500 DF ¾If the producer has not sold, used, destroyed or elected
to use the .500 DF in the 146 days, then the production22
will be adjusted with the .500 DF

Field sampling for unharvested appraised production
¹Requirements for minimum number of samples: ¾Minimum number of samples are based upon the acreage being sampled.
Acres in Field or Subfield Minimum No. of Samples 0.1 – 10.0 3
10.1 – 40.0 4 Add one additional sample for each 40.0 acres (or fraction thereof) ¿Examples: ¼ 3 samples for a 10 acre field ¼ 4 samples for a 40 acre field (3 for first 10 +1) ¼ 16 samples for a 500 acre field (3 for first 10 + (490/40 = 12.25 or) 13)
¹RMA requires several samples: ¾ FGIS pulls one sample from each 50,000 bushel barge. Assume 1,000 acres at
50 bu/acre. This 1,000 acres produces 50,000 bushels. For 1,000 acres RMA requires 28 samples
¾ The AIP and insured can agree to take as many additional samples (over the minimum) as necessary 23

ASR affects production
¹ ASR affects production only ¹ However fields affected by ASR
may qualify for quality adjustment ¹ Uninsured causes may also apply if
the producer does not follow the advise of Agricultural Experts or use GFP 24

Questions
Please direct questions concerning
the interrelationship of crop insurance and ASR to:
Dave Bell 816.926.2397 or [email protected]
25