Crop failure rates in a geoengineered climate: impact of ... · Crop failure rates in a...
8
Crop failure rates in a geoengineered climate: impact of climate change and marine cloud brightening Ben Parkes, A. Challinor, K. Nicklin To cite this version: Ben Parkes, A. Challinor, K. Nicklin. Crop failure rates in a geoengineered climate: impact of climate change and marine cloud brightening. Environmental Research Letters, IOP Publishing, 2015, 10 (8), pp.084003. <10.1088/1748-9326/10/8/084003>. <hal-01257809> HAL Id: hal-01257809 http://hal.upmc.fr/hal-01257809 Submitted on 18 Jan 2016 HAL is a multi-disciplinary open access archive for the deposit and dissemination of sci- entific research documents, whether they are pub- lished or not. The documents may come from teaching and research institutions in France or abroad, or from public or private research centers. L’archive ouverte pluridisciplinaire HAL, est destin´ ee au d´ epˆ ot et ` a la diffusion de documents scientifiques de niveau recherche, publi´ es ou non, ´ emanant des ´ etablissements d’enseignement et de recherche fran¸cais ou ´ etrangers, des laboratoires publics ou priv´ es. Distributed under a Creative Commons Attribution 4.0 International License
Transcript of Crop failure rates in a geoengineered climate: impact of ... · Crop failure rates in a...

Crop failure rates in a geoengineered climate: impact of
climate change and marine cloud brightening
Ben Parkes, A. Challinor, K. Nicklin
To cite this version:
Ben Parkes, A. Challinor, K. Nicklin. Crop failure rates in a geoengineered climate: impact ofclimate change and marine cloud brightening. Environmental Research Letters, IOP Publishing,2015, 10 (8), pp.084003. <10.1088/1748-9326/10/8/084003>. <hal-01257809>
HAL Id: hal-01257809
http://hal.upmc.fr/hal-01257809
Submitted on 18 Jan 2016
HAL is a multi-disciplinary open accessarchive for the deposit and dissemination of sci-entific research documents, whether they are pub-lished or not. The documents may come fromteaching and research institutions in France orabroad, or from public or private research centers.
L’archive ouverte pluridisciplinaire HAL, estdestinee au depot et a la diffusion de documentsscientifiques de niveau recherche, publies ou non,emanant des etablissements d’enseignement et derecherche francais ou etrangers, des laboratoirespublics ou prives.
Distributed under a Creative Commons Attribution 4.0 International License

This content has been downloaded from IOPscience. Please scroll down to see the full text.
Download details:
IP Address: 134.157.80.136
This content was downloaded on 18/01/2016 at 11:01
Please note that terms and conditions apply.
Crop failure rates in a geoengineered climate: impact of climate change and marine cloud
brightening
View the table of contents for this issue, or go to the journal homepage for more
2015 Environ. Res. Lett. 10 084003
(http://iopscience.iop.org/1748-9326/10/8/084003)
Home Search Collections Journals About Contact us My IOPscience

Environ. Res. Lett. 10 (2015) 084003 doi:10.1088/1748-9326/10/8/084003
LETTER
Crop failure rates in a geoengineered climate: impact of climatechange andmarine cloud brightening
BParkes1,2, AChallinor2 andKNicklin2
1 UPMC, LOCEAN IPSL, F-75252 Paris 05, France2 ICAS, University of Leeds, Leeds, LS2 9JT,UK
E-mail: [email protected]
Keywords: geoengineering, crop failures, China,West Africa, climate change
Supplementarymaterial for this article is available online
AbstractThe impact of geoengineering on crops has to date been studied by examiningmean yields.We presentthefirst work focusing on the rate of crop failures under a geoengineered climate.We investigate theimpact of a future climate and a potential geoengineering scheme on the number of crop failures intwo regions, NortheasternChina andWest Africa. Climate change associatedwith a doubling ofatmospheric carbon dioxide increases the number of crop failures inNortheasternChinawhilereducing the number of crop failures inWest Africa. In both regionsmarine cloud brightening is likelyto reduce the number crop failures, although it ismore effective at reducingmild crop failure thansevere crop failure.Wefind that water stress, rather than heat stress, is themain cause of crop failure incurrent, future and geoengineered climates. This demonstrates the importance of irrigation andbreeding for tolerance towater stress as adaptationmethods in all futures. Analysis of global rainfallundermarine cloud brightening has the potential to significantly reduce the impact of climate changeon global wheat and groundnut production.
1. Introduction
Climate change as a result of anthropogenic influ-ences, such as burning fossil fuels and altering landuse, is having an impact across the world (Stockeret al 2013). There have been severalmethods suggestedto ameliorate some of the effects of climate change, viaeither mitigation or explicit geoengineered modifica-tions. One such geoengineering method is marinecloud brightening, which was originally suggestednearly 25 years ago (Latham 1990). Marine cloudbrightening, which is a solar radiation management(SRM) method of geoengineering, has the aim ofpreventing adverse temperature changes (Shepherd2009, Jones et al 2009, 2011, Latham et al 2012a) andhas been suggested as a method of restoring polar seaice coverage (Latham et al 2012a, Parkes et al 2012)and reducing coral bleaching (Latham et al 2013). Itinvolves seeding unpolluted marine stratocumulusclouds in an effort to increase the cloud dropletnumber and thus reflectivity (Twomey 1977). Marinecloud brightening alters the water cycle of the planet
and therefore modifies the global precipitation dis-tribution (Jones et al 2009, 2011, Latham et al 2012a).
The impact of geoengineering schemes such asmarine cloud brightening on vegetation and crops hasnot received much attention. Changes in primary pro-ductivity have been investigated in Jones et al(2009, 2011), where it was found that the combinationof climate change and marine cloud brightening leadto a reduction in primary productivity in the Amazonand a smaller increase in primary productivity inAfrica. An investigation into bio-geoengineering,where crops were simulated with an increased albedoshowed a positive feedback loop where coolingreduced evaporation and therefore increased primaryproductivity (Singarayer et al 2009). Changes in pri-mary productivity were investigated in Kravitz et al(2013) where a top of atmosphere radiation balancewas used to calibrate a solar radiation reductiongeoengineering scheme, the increased carbon dioxidefraction lead to an increase in primary productivityacross much of the tropics. The impacts of both cli-mate change and geoengineering on food production
OPEN ACCESS
RECEIVED
30March 2015
REVISED
9 June 2015
ACCEPTED FOR PUBLICATION
1 July 2015
PUBLISHED
3August 2015
Content from this workmay be used under theterms of theCreativeCommonsAttribution 3.0licence.
Any further distribution ofthis workmustmaintainattribution to theauthor(s) and the title ofthework, journal citationandDOI.
© 2015 IOPPublishing Ltd

so far have been investigated in Pongratz et al (2012),Xia et al (2014). In Pongratz et al (2012) a climatechange scenario increases global wheat and rice yieldbut decreases maize yield. With the deployment ofstratospheric sulphate aerosol, another proposed SRMscheme, global yields of maize, rice and wheatincrease. In Xia et al (2014) an ensemble of climatemodels were used to simulate maize and rice yields inDSSAT and found that geoengineering via SRM in anatmosphere with increasing carbon dioxide con-centrations leads to an increase in maize yield but adecrease in rice yield. However, neither Pongratz et al(2012) nor Xia et al (2014) assessed changes in thevariability of crop yields or the frequency of cropfailure.
2.Method
2.1. Climatemodel simulationsThe HadGEM1 climate model (Martin et al 2006) wasused to perform a control, a climate change, and amarine cloud brightening simulation (Lathamet al 2012a), which are referred to hereafter as C440,F560 and F560G respectively, these simulations havebeen known as control (Con), changed (Car), andbrightening (MCB) in previous publications (Lathamet al 2012a, 2012b, Parkes et al 2012, Lathamet al 2013, 2014). The climate model was run in aN96L38 configuration, with a horizontal resolution of1.875° × 1.25° and 38 vertical levels extending up to39 km. The C440 simulation has a projected 2020 levelof carbon dioxide, which was defined as 440 ppm. TheF560 andF560G runs have carbon dioxide levels whichincrease by 1%/year until reaching double preindus-trial levels at 560 ppm. The carbon dioxide levels arethen held static at the double preindustrial levels.Within the model F560G is simulated by setting thecloud droplet number concentration to 375 cm−3
within the three regions shown in figure 1(a) ofLatham et al (2012b). The total area of the threeregions is 3.3% of the world surface, this is made up ofthe North Pacific region 0.7%, South Pacific 1.5% andSouth Atlantic 1.1%. Each simulation is run for 70years to allow the model to reach equilibrium with thefinal 20 years used for input into the crop model.Within the climate model the only greenhouse gasmodified to simulate the future climate was carbondioxide, therefore the impacts of other gases are notassessed. This may result in less significant climatechange than found in a RCP4.5 simulation whichincludes methane, CFCs, HCFCs and oxides of nitro-genMeinshausen et al (2011).
2.2. Cropmodel simulationsThe three climate model simulations were used todrive a cropmodel in order to simulate yields of springwheat in Northeastern China and groundnut in WestAfrica. The crop model used was the General LargeArea Model (GLAM) for annual crops, which is aprocess-based model specifically designed for regionalscale modelling (Challinor et al 2004). The coupling ofthe models is one directional with GLAM using theoutput from the climate model but not feeding anydata back. Full details of the crop model simulationsare given in the supplementary information and aresummarized here.
GLAM is driven using daily weather data, specifi-callyminimumandmaximum temperature, precipita-tion and downwelling shortwave radiation. It was runon the climatemodel grid, using the daily weather dataproduced by the climate model. GLAM also requiressoil data, a planting window, and a set of parametervalues suitable for the crop and location in question.These input data and parameter sets follow Challinoret al (2010) for the simulation of spring wheat inNortheastern China and Vermeulen et al (2013) for
Figure 1.Relative crop yield for the three climate simulations for (a) wheat inNortheastern China, (b) groundnut inWest Africa. Thebox andwhisker plots show the range of responses across different calibrations of theGLAMcropmodel and, in the F560 and F560Gcases, different transpiration efficiencies. Themedian value is shown as a red linewith the box edges showing the 25th and the 75thpercentile. Thewhiskers on the plot show themost extreme datawhich are not considered outliers. The remaining outlier values areplotted individually outside thewhiskers. The relative yieldwas calculated by dividing the yield from each simulation by the yield inthe equivalent C440 simulation.
2
Environ. Res. Lett. 10 (2015) 084003 B Parkes et al.
the simulation of groundnut in West Africa. Theseregions were selected as GLAMhas been used to simu-late crops in these regions before and gives us con-fidence in the results. However, two changes weremade for this study. Firstly, the albedo of the land sur-face was changed to 0.15 for both locations in order tobe consistent with the vegetation field in the climatemodel. Secondly, the normalized transpiration effi-ciency (Pa) and the maximum transpiration efficiency(kg ha−1) were increased when simulating yields in theF560 and F560G climates to account for the carbondioxide fertilization effect. In order to account foruncertainty in the magnitude of this effect, three dif-ferent pairs of values (low, moderate, high) were used,see SI table 2 and SI table 3.
For each of the three climates, the impact of waterstress and of high temperatures during flowering wasassessed by performing a sensitivity experiment simu-lating crops adapted to each of these stresses in turn.Adaptation to water stress was simulated by removingany water limitation on leaf growth or biomass accu-mulation. This represents a plant that can continuegrowing during periods of drought or a fully irrigatedcrop. Adaptation to high temperatures during flower-ing was simulated by turning off the high temperaturestress during flowering routine (described in Challi-nor et al (2005)).
GLAM simulates the response of crops to weatherand uses a single calibration parameter, the ‘yield gapparameter’ (YGP), to account for reductions in yielddue to non-climatic factors (Challinor et al 2004) ,these factors include pests, diseases and nutrient defi-ciency. The YGP reduces yields by reducing the crop’sleaf area index. Crop yields were simulated using thefull range of values for the YGP (0.01 to 1 in steps of0.01). The impact of a F560 or F560G climate on cropyields was analysed for each YGP separately. There-fore, a consistent response across YGPs indicates thatthe results of the study are independent of the cropmodel calibration procedure.
The impact of a F560 climate and a F560G climateon crop yields was assessed by examining both changesin mean yields and changes in the crop failure rate.Two levels of crop failure were considered: mild andsevere. The thresholds for crop failure were calculatedusing the C440 simulation and were defined as 1 and1.5 standard deviations below the mean for mild andsevere crop failure respectively. The thresholds werecalculated for each grid cell and for each value of YGPseparately.
3. Results
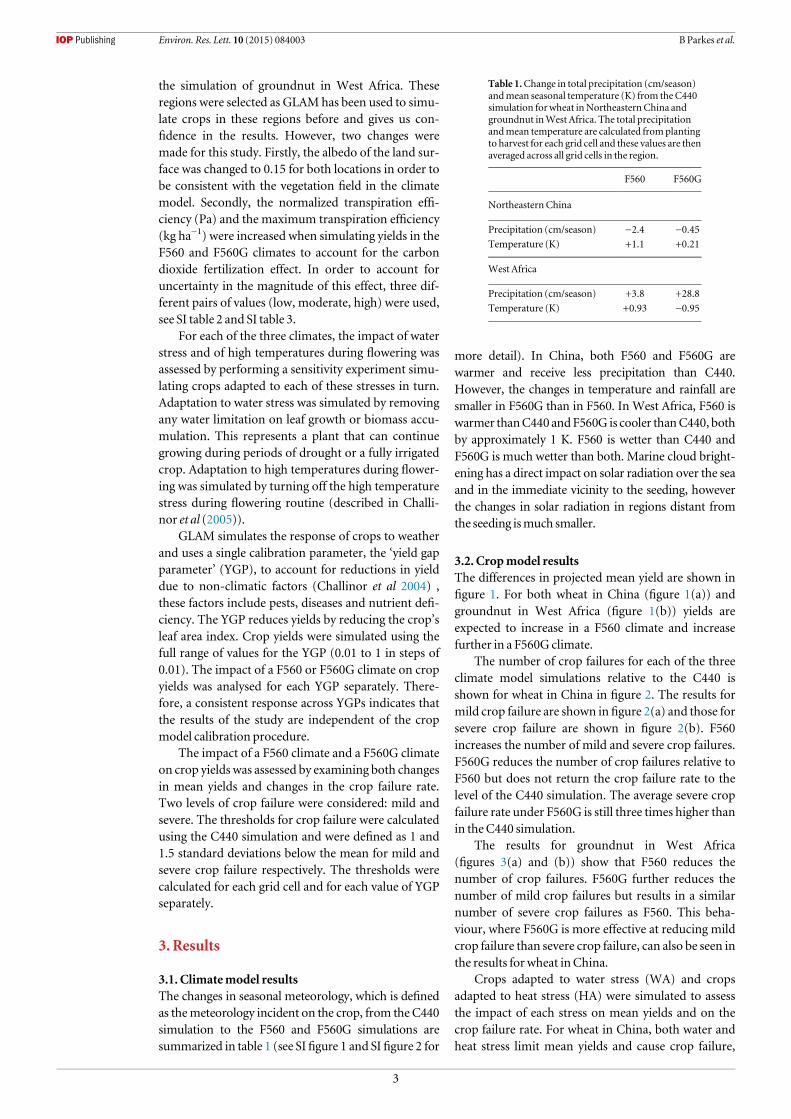
3.1. Climatemodel resultsThe changes in seasonal meteorology, which is definedas themeteorology incident on the crop, from the C440simulation to the F560 and F560G simulations aresummarized in table 1 (see SIfigure 1 and SI figure 2 for
more detail). In China, both F560 and F560G arewarmer and receive less precipitation than C440.However, the changes in temperature and rainfall aresmaller in F560G than in F560. In West Africa, F560 iswarmer thanC440 andF560G is cooler thanC440, bothby approximately 1 K. F560 is wetter than C440 andF560G is much wetter than both. Marine cloud bright-ening has a direct impact on solar radiation over the seaand in the immediate vicinity to the seeding, howeverthe changes in solar radiation in regions distant fromthe seeding ismuch smaller.
3.2. Cropmodel resultsThe differences in projected mean yield are shown infigure 1. For both wheat in China (figure 1(a)) andgroundnut in West Africa (figure 1(b)) yields areexpected to increase in a F560 climate and increasefurther in a F560G climate.
The number of crop failures for each of the threeclimate model simulations relative to the C440 isshown for wheat in China in figure 2. The results formild crop failure are shown in figure 2(a) and those forsevere crop failure are shown in figure 2(b). F560increases the number of mild and severe crop failures.F560G reduces the number of crop failures relative toF560 but does not return the crop failure rate to thelevel of the C440 simulation. The average severe cropfailure rate under F560G is still three times higher thanin theC440 simulation.
The results for groundnut in West Africa(figures 3(a) and (b)) show that F560 reduces thenumber of crop failures. F560G further reduces thenumber of mild crop failures but results in a similarnumber of severe crop failures as F560. This beha-viour, where F560G is more effective at reducing mildcrop failure than severe crop failure, can also be seen inthe results for wheat inChina.
Crops adapted to water stress (WA) and cropsadapted to heat stress (HA) were simulated to assessthe impact of each stress on mean yields and on thecrop failure rate. For wheat in China, both water andheat stress limit mean yields and cause crop failure,
Table 1.Change in total precipitation (cm/season)andmean seasonal temperature (K) from theC440simulation forwheat inNortheasternChina andgroundnut inWest Africa. The total precipitationandmean temperature are calculated fromplantingto harvest for each grid cell and these values are thenaveraged across all grid cells in the region.
F560 F560G
Northeastern China
Precipitation (cm/season) −2.4 −0.45
Temperature (K) +1.1 +0.21
West Africa
Precipitation (cm/season) +3.8 +28.8
Temperature (K) +0.93 −0.95
3
Environ. Res. Lett. 10 (2015) 084003 B Parkes et al.

with water stress having the biggest impact (e.g.figure 4(a), see SI figure 3(a) and SI figure 4 for fullresults). Therefore, in China, F560G reduces the
number of crop failures relative to F560 because of thelower temperatures and increased rainfall. Forgroundnut inWest Africa, water stress is the dominant
Figure 2.Relative number of (a)mild, (b) severe crop failures for wheat inNortheastern China for three climate simulations. The boxandwhisker plots show the range of responses across different calibrations of theGLAMcropmodel and, in the F560 and F560G cases,different transpiration efficiencies. The relative number of crop failures was calculated by dividing the number of crop failures fromeach simulation by the number of failures in the equivalent C440 simulation.
Figure 3.As figure 2 except for groundnut inWest Africa.
Figure 4.Relative number ofmild crop failures for all climatemodel and adaptation simulations for (a) wheat inNortheastern China(b) groundnut inWest Africa. The box andwhisker plots show the range of responses across different calibrations of theGLAMcropmodel and, in the F560 and F560G cases, different transpiration efficiencies. The relative number of crop failures was calculated bydividing the number of crop failures from each simulation by the number of failures in the equivalent C440 simulation.WA indicatescrops adapted towater stress andHA indicates crops adapted to heat stress.
4
Environ. Res. Lett. 10 (2015) 084003 B Parkes et al.

limitation on mean yields and cause of crop failure,with heat stress having no effect (e.g. figure 4(b), see SIfigure 3(b) and SI figure 5 for full results). Here,F560G reduces the number of crop failures because ofthe increased rainfall. In both cases the increase inrainfall in F560G is complimented by a decrease inincident solar radiation which inhibits evaporationand further increases available water.
4.Discussion
We find that in this case climate change will increasemean yields for both wheat in Northeastern China andgroundnut in West Africa. This projected increase inyields is in part due to the carbon dioxide fertilizationeffect, and for West Africa is also due to increasedseasonal rainfall. The climate change projected by theinput simulations is however moderate, and has alower impact than RCP4.5. The increase in meanyields is accompanied by a decrease in the crop failurerate in West Africa. However, climate change ispredicted to increase the crop failure rate in China,which is consistent with previous studies (Challinoret al 2010). If climate change is more severe than in theinput simulations then it is possible that the cropsfailures will increase in both regions.
The increase in yield variability is likely to be pro-blematic for both subsistence farmers and for con-sumers, who will see larger fluctuations in prices(Gilbert and Morgan 2010). In particular, studiescommonly use variability in yield as a metric foruncertainty, rather than using it to assess changes inthe stability of production. We recommend that allcrop impact studies assess and report changes in yieldvariability in addition tomean yield, see also Challinoret al (2014). The changes in crop failure rate were aresult of the increasing temperatures and the increas-ing variability in temperatures which leads to seasonswith significantly higher or lower yields.
While the simulations conducted here were fortwo regions only, some indicative conclusions can bemade for other regions by referring to the precipita-tion changed in the global MCB simulations used todrive the crop model. The top five wheat producingcountries are China, India, USA, Russia and France,these five nations make up approximately half of glo-bal production (FAOSTAT 2014). All of these experi-ence an increase in precipitation under MCB Lathamet al (2012a). This suggests that MCB has the potentialto significantly reduce the impact of climate change onglobal wheat production. The top five groundnut pro-ducing nations are China, India, USA, Nigeria andSudan (former borders) (FAOSTAT 2014), whichaccount for over 70% of global production. China,India and the USA have been discussed above andNigeria is part of this study, the precipitation in Sudanis also expected to increase under MCB (Lathamet al 2012a).
This work has been performed using a single cli-mate model and a single crop model. The uncertaintyin the response of climate to increased carbon dioxidelevels, particularly in the response of precipitation, hasbeen highlighted in several studies including the IPCCFifth Assessment Report (see figure 12.10 of Collinset al 2013). The mean results from the CMIP5 inter-comparison project show similar results to the F560scenario with increases in temperature in both. Pre-cipitation changes are similar in West Africa, while inChina an increase in rainfall in found, in contrast tothe simulation used here (see box TS.6, figure 1Stocker et al 2013). Differences in the climaticresponse will impact the projections of crop yield, aswill the use of different crop models. These resultscontrast with several studies which have reportedreductions in mean crop yield in West Africa with cli-mate change, in Challinor et al (2007), Lobell et al(2008). This is likely a result of the increase in pre-cipitation in our input simulations compared with adecrease in precipitation in these other studies. Thenext step would be to use an ensemble of both climatemodels and crop models, such as combining the Geo-MIP and AgMIP projects, this has been started in thework byXia et al (2014).
5. Conclusion
In both China and West Africa, marine cloud bright-ening is expected to increase yields and reduce the cropfailure rate compared to a climate change scenario.Marine cloud brightening may therefore be beneficialfor food production in these two regions, furthermoreincreases in precipitation over the growing areas forthese crops indicate that marine cloud brighteningmay improve wheat and groundnut yields globally.Further work is required to investigate the impact onother crops and in different regions.
Acknowledgments
The research leading to these results has receivedfunding from the European Union Seventh Frame-work Programme FP7/2007–2013 under grant agree-ment no 603864. This work was supported by theNatural Environment Research Council grant numberNE/H003525/1. The study was financially supportedby the NERC EQUIP programme http://www.equip.leeds.ac.uk and the CGIAR Research Program onClimate Change, Agriculture and Food Security(CCAFS), with thefinancial assistance of the EuropeanUnion, Canadian International Development Agency,World Bank, New ZealandMinistry of Foreign Affairsand Trade and Danida and with the technical supportof IFAD. S. This work made use of the facilities ofHECToR, the UK’s national high-performance com-puting service, which is provided by UoE HPCx Ltd atthe University of Edinburgh, Cray Inc. and NAG Ltd,
5
Environ. Res. Lett. 10 (2015) 084003 B Parkes et al.

and funded by the Office of Science and Technologythrough EPSRC’sHigh EndComputing Programme.
References
Challinor A J,Watson J, Lobell DB,Howden SM, SmithDR andChhetri N 2014Ameta-analysis of crop yield under climatechange and adaptationNat. Clim. Change 4 287–91
Challinor A J,Wheeler TR, Craufurd PQ, Slingo JM andGrimesD I F 2004Design and optimisation of a large-areaprocess-basedmodel for annual cropsAgric. ForestMeteorol.124 99–120
Challinor A J,Wheeler TR, Craufurd PQand Slingo JM2005Simulation of the impact of high temperature stress onannual crop yieldsAgric. ForestMeteorol. 135 180–9
Challinor A,Wheeler T, GarforthC, Craufurd P andKassamA2007Assessing the vulnerability of food crop systems inAfrica toclimate changeClim. Change 83 381–99
Challinor A J, Simelton E S, Fraser EDG,HemmingD andCollinsM2010 Increased crop failure due to climate change:assessing adaptation options usingmodels and socio-economic data for wheat in china Environ. Res. Lett. 5 3
CollinsM et al 2013 Long-term climate change: projections,commitments and irreversibilityClimate Change 2013: ThePhysical Science Basis, Contribution ofWorkingGroup I to theFifth Assessment Report of the Intergovernmental Panel onClimate Change (Cambridge: CambridgeUniversity Press)
FAOSTAT (2014) Food andAgricultureOrganization of theUnitedNations: FAOSTATDatabase, online resource (http://data.fao.org/database?entryId=262b79ca-279c-4517-93de-ee3b7c7cb553)
Gilbert C L andMorganCW2010 Food price volatility Phil. Trans.R. Soc.B 365 3023–34
Jones A,Haywood J andBoucherO 2009Climate impacts ofgeoengineeringmarine stratocumulus clouds J. Geophys. Res.114D10106
Jones A,Haywood J andBoucherO 2011A comparison of theclimate impacts of geoengineering by stratospheric so2injection and by brightening ofmarine stratocumulus cloudAtmos. Sci. Lett. 12 176–83
Kravitz B et al 2013Climatemodel response from thegeoengineeringmodel intercomparison project (geomip)J. Geophys. Res.: Atmos. 118 8320–32
Latham J 1990Control of global warmingNature 347 339–40Latham J et al 2012aMarine cloud brightening Phil. Trans. R. Soc.A
370 4217–62Latham J, GadianA, Fournier J, Parkes B,Wadhams P andChen J
2014Marine cloud brightening: regional applications Phil.Trans. R. Soc.A 372
Latham J, Kleypas J, Hauser R, Parkes B andGadianA 2013Canmarine cloud brightening reduce coral bleachingAtmos. Sci.Lett. 14 214–9
Latham J, Parkes B, GadianA and Salter S 2012bWeakening ofhurricanes viamarine cloud brightening (mcb)Atmos. Sci.Lett. 13 231–7
Lobell DB, BurkeMB, Tebaldi C,MastrandreaMD,FalconWP andNaylor R L 2008 Prioritizing climate changeadaptation needs for food security in 2030 Science 319 607–10
MartinGM,RingerMA, PopeVD, Jones A,DeardenC andHintonT J 2006The physical properties of the atmosphere intheNewHadley CentreGlobal EnvironmentalModel(HadGEM1): I.Model description and global climatologyJ. Clim. 19 1274–301
MeinshausenM et al 2011The rcp greenhouse gas concentrationsand their extensions from1765 to 2300Clim. Change 109213–41
Parkes B, GadianA and Latham J 2012The effects ofmarine cloudbrightening on seasonal polar temperatures and themeridional heat flux ISRNGeophys. 2012 2012
Pongratz J, Lobell D B, Cao L andCaldeira K 2012Crop yields in ageoengineered climateNat. Clim. Change 2 101–5
Shepherd JG 2009Geoengineering the Climate: Science, GovernanceandUncertainty (London: TheRoyal Society)
Singarayer J S, Ridgwell A and Irvine P 2009Assessing the benefits ofcrop albedo bio-geoengineering Environ. Res. Lett. 4 045110
Stocker T F et al 2013Technical summaryClimate Change 2013: ThePhysical Science Basis, Contribution ofWorkingGroup I to theFifth Assessment Report of the Intergovernmental Panel onClimate Change (Cambridge: CambridgeUniversity Press)
Twomey S 1977The influence of pollution on the shortwave albedoof clouds J. Atmos. Sci. 34 1149–52
Vermeulen S J et al 2013Addressing uncertainty in adaptationplanning for agriculture Proc. Natl Acad. Sci. 110 8357–62
Xia L et al 2014 Solar radiationmanagement impacts on agriculturein china: a case study in the geoengineeringmodelintercomparison project (geomip) J. Geophys. Res.: Atmos.119 8695–711
6
Environ. Res. Lett. 10 (2015) 084003 B Parkes et al.