Cronyism in Malaysia
41
August 20, 2001 Cronyism and Capital Controls: Evidence from Malaysia Simon Johnson and Todd Mitton* * Johnson: MIT and NBER ([email protected]); Mitton: Brigham Young University ([email protected]). Simon Johnson thanks the MIT Entrepreneurship Center for support. For helpful comments we thank Daron Acemoglu, Olivier Blanchard, Jim Brau, Ricardo Caballero, Ray Fisman, Tarun Khanna, Grant McQueen, Randall Morck, Sendhil Mullainathan, Raghuram Rajan, Dani Rodrik, David Scharfstein, Andrei Shleifer, Jeremy Stein, Keith Vorkink, and participants at the MIT Macroeconomics lunch, the NBER conference on the Malaysian Currency Crisis, the NBER corporate finance program spring 2001 meeting, and Brigham Young University. We also thank several Malaysian colleagues for sharing their insights off the record.
description
cronyism in Malaysia
Transcript of Cronyism in Malaysia

August 20, 2001
Cronyism and Capital Controls:
Evidence from Malaysia
Simon Johnson and Todd Mitton*
* Johnson: MIT and NBER ([email protected]); Mitton: Brigham Young University([email protected]). Simon Johnson thanks the MIT Entrepreneurship Center forsupport. For helpful comments we thank Daron Acemoglu, Olivier Blanchard, Jim Brau,Ricardo Caballero, Ray Fisman, Tarun Khanna, Grant McQueen, Randall Morck, SendhilMullainathan, Raghuram Rajan, Dani Rodrik, David Scharfstein, Andrei Shleifer, JeremyStein, Keith Vorkink, and participants at the MIT Macroeconomics lunch, the NBERconference on the Malaysian Currency Crisis, the NBER corporate finance programspring 2001 meeting, and Brigham Young University. We also thank several Malaysiancolleagues for sharing their insights off the record.

Cronyism and Capital Controls:
Evidence from Malaysia
Abstract
The initial impact of the Asian financial crisis in Malaysia reduced the expected
value of government subsidies to politically favored firms. Of the estimated $60 billion
loss in market value for politically connected firms from July 1997 to August 1998,
roughly 9% can be attributed to the fall in the value of their connections. Firing the
Deputy Prime Minister and imposing capital controls in September 1998 primarily
benefited firms with strong ties to Prime Minister Mahathir. Of the estimated $5 billion
gain in market value for Mahathir-connected firms during September 1998,
approximately 32% was due to the increase in the value of their connections. The
evidence suggests Malaysian capital controls provided a screen behind which favored
firms could be supported.

1
1. Introduction
Until the late 1970s, capital controls were widely used to prevent the free flow of
finance. A cautious relaxation of such controls during the 1980s proved consistent with
greater economic integration in Europe and strengthened the case for capital market
opening more generally. By the time the IMF and World Bank encouraged a further
wave of liberalization for “emerging markets” in the early 1990s, capital controls
appeared to be finished as a serious policy tool for relatively open economies (Bhagwati
1998a). Today, however, capital controls are again being taken seriously. Malaysia
reimposed capital controls in September 1998, China and Chile maintain effective capital
account restrictions, and there is debate regarding the value of free capital flows in a
number of crisis-prone countries, including Korea, Russia, and Turkey. Capital controls
have also just begun to be mentioned as a possibility for Japan (Dornbusch 2001b).
There are two main views on the causes and effects of capital controls. The more
established view emphasizes macroeconomics. If a country faces a severe external crisis,
particularly one caused by pure panic, and if standard measures have failed, Krugman
(1998) argues that imposing capital controls may be an effective way to stabilize the
economy. More generally, Bhagwati (1998a and 1998b) and Rodrik (2000) oppose the
conventional wisdom that free capital flows help countries benefit from trade
liberalization, and argue instead that capital market liberalization invites speculative
attacks. The recent performance of Malaysia has been interpreted as demonstrating that
capital controls can have positive macroeconomic effects (Kaplan and Rodrik 2001),
although this claim is controversial (Dornbusch 2001a).
While not denying the importance of macroeconomic issues, the second view puts
greater emphasis on institutions (i.e., the rules, practices and organizations that govern an
economy). Rajan and Zingales (1998) argue that capital controls are an essential part of
the package of policies that allows “relationship-based” capitalism to function. In this
system, informal relationships between politicians and banks channel lending towards
approved firms, and this is easier to sustain when a country is relatively isolated from
international capital flows. If capital controls are relaxed, as in some parts of Asia in the
early 1990s, the result may be overborrowing and financial collapse (Rajan and Zingales
2
1998).1 In this context, Rajan and Zingales (2001) suggest that reimposing capital
controls may be attractive if it enables politicians to support the financing of particular
firms (sometimes known as “cronyism”). At the same time, directed lending behind
capital controls may store up problems in the form of bad loans and distorted incentives.2
Recent experience in Malaysia offers an opportunity to assess the extent to which
capital controls are linked with cronyism. There are two testable implications at the firm
level from the Rajan and Zingales view. Firms with stronger political connections should
(1) suffer more when a macroeconomic shock reduces the government’s ability to
provide privileges and subsidies and (2) benefit more when the imposition of capital
controls allows a higher level of subsidies.
Using data from Malaysia before and after the imposition of capital controls, this
paper reports strong support for both hypotheses. In the initial phase of the crisis, from
July 1997 to August 1998, of the estimated $60 billion loss in market value for politically
connected firms, roughly 9% can be attributed to the fall in the expected value of their
connections. With the imposition of capital controls in September 1998, of the estimated
$5 billion gain in market value for firms connected to Prime Minister Mahathir, about
32% can be attributed to the increase in the value of their connections. For connected
firms, the value of political connections was approximately 16% of their total market
value at the end of September 1998.
Malaysia is an appealing case for several reasons. Researchers identified
important relationships between politicians and firms before capital controls were
imposed (Gomez and Jomo 1997). Politically connected firms may generally differ in
unobservable ways relative to unconnected firms, but in the Malaysian data it is possible
also to examine variation in performance within the set of politically connected firms.
1 Theoretically, relaxing capital controls may lead to financial distress in at least three ways.First, local financial institutions may respond by taking on more risk. Second, local firms mayborrow directly from international lenders who are either unable to assess risks appropriately orbelieve that there is an implicit sovereign guarantee. Third, after they lose their monopolies, localbanks may be less willing to bail out firms that encounter problems, as in Petersen and Rajan(1995).2 Leading proponents of the macroeconomic perspective on capital controls are aware thatinstitutional issues may be important as well. For example, Kaplan and Rodrik (2001) clearlystate their concerns that capital controls may distort incentives and undermine future performancein Malaysia. However, their emphasis is on macroeconomic effects (i.e., for all firms), ratherthan the differential benefits for just some firms.

3
The connection of firms to individual politicians appears to have been based primarily on
chance personal histories, i.e., who knew whom early in their careers. Therefore, because
imposition of capital controls in September 1998 coincided with a major political
realignment, with Prime Minister Mahathir Mohamad winning and Deputy Prime
Minister Anwar Ibrahim losing, any “excess” gain for firms connected to the winner
should provide a good measure of cronyism-with-capital controls.
In addition, throughout the Asian financial crisis that began in July 1997,
Malaysia maintained a large and liquid stock market, so examining how stock prices
varied across firms is a reasonable way to measure the effects of policy changes.3
Anecdotal evidence suggests financial markets understood the crisis as threatening to
politically favored firms and believed that the imposition of capital controls represented
an opportunity for strong politicians to support some firms. The available information
also indicates that these expectations have subsequently been met – for example, there
have been numerous press reports of government support for well-connected firms after
September 1998.
We find that firms’ stock price performance in Malaysia is broadly supportive of
the view that capital controls create a screen for cronyism. Firms with political
connections had worse stock returns in the early phase of the Asian financial crisis, but
once capital controls were imposed, these firms did better on average. One way to
evaluate the size of this effect is to compare having a political connection with the
consequences of being more indebted when the crisis hit. Malaysian firms with more
debt suffered larger falls in stock price in the first phase of the crisis (through August
1998). Having political connections had a similar effect (in the sense of inducing a
similar fall in stock price) to that of increasing a firm’s debt-asset ratio by 50-60
percentage points, e.g., from the median of 23.3% to around 75% (roughly equivalent to a
3-standard deviation increase in the debt ratio). These results hold when we control for
other measurable characteristics of the firms, such as debt, size, and sector. The results
also hold when we control for whether a firm has the status of being “Bumiputera,”
3 Analyzing stock prices has several advantages compared with looking at published financialstatements. Financial statements appear only with a considerable lag and after many other eventshave taken place. Reported earnings do not always reflect actual performance, depending on
4
meaning that it is largely owned by Malays and qualifies for some official government
support.
Consistent with the view that cronyism increases behind capital controls we find
only firms previously connected to Prime Minister Mahathir experienced a
disproportionate increase in stock price in September 1998. The stock market’s reaction
appears to have been confirmed by subsequent events – over the following year, Anwar-
connected firms were either taken over by Mahathir-connected firms or their owners
switched allegiance to Mahathir.
As a check on the plausibility of our results, we examine stock price variation
within the group of Mahathir-connected firms, differentiating between those that
previously had access to international capital markets and those that did not. All other
things equal, if capital controls affect firms’ access to funds and relationships with
investors, we would expect a smaller increase in value for firms that had previously
reduced their cost of capital by listing overseas. This is what we find in the data.
Mahathir-connected firms with prior access to international capital markets experienced a
small (and not statistically significant) increase in stock price following the imposition of
capital controls. The main beneficiaries were Mahathir-connected firms that had not
previously listed overseas.
The paper closest to our approach is Fisman (2001), who estimates the value of
political connections in Indonesia, through looking at how stock prices moved when
former President Suharto’s health was reported to change. Fisman (2001) measures the
direct effect of health shocks to a dictator, which is presumably quite specific to
authoritarian systems, during a period of relative economic stability. The Malaysian
experience lets us examine the interaction of cronyism and capital controls in a
democracy. In addition, we are able to use variation between firms connected to winning
and losing politicians. This helps ensure political connections rather than some other
unobservable characteristics of firms drive our results.
Our paper is part of a growing literature that examines the performance of
relatively privileged firms. Morck, Strangeland, and Yeung (2000) show that established,
accounting practices. If there were any room for maneuver in an accounting system, we wouldexpect politically well-connected firms to be more able to take advantage of it.
5
well-connected firms in Canada (as measured by family inheritance of control) are less
efficient and had negative abnormal stock returns when the 1988 Canada-U.S. free trade
agreement reduced barriers to foreign capital. La Porta, Lopez-de-Silanes and Zamarippa
(2001) show that well-connected Mexican banks engaged in a considerable amount of
irresponsible lending before the 1995 crisis, and this presumably contributed to the
severity of the crisis when it came. To our knowledge, no previous papers have tried to
measure the combined effects of cronyism and capital controls.
Our work is also related to the recent literature that shows important links
between institutions and economic outcomes. Johnson, Boone, Breach and Friedman
(2000) present evidence that the Asian financial crisis had more severe effects in
countries with weaker institutions in general and weaker investor protection in particular
(as measured by La Porta, Lopez-de-Silanes, Shleifer and Vishny 1997 and 1998).
Mitton (2001) finds firm-level evidence that weaker corporate governance was associated
with worse stock price performance in the Asian crisis, and Lemmon and Lins (2001)
confirm these results using different definitions of governance and outcomes. More
broadly, Morck, Yeung, and Yu (2000) argue that in countries with weak property rights
protection, stock price movements are predominantly driven by political shocks.
Section 2 reviews the nature of political connections in Malaysia. Section 3
explains our data and methodology in more detail. Section 4 reports descriptive statistics
for connected and non-connected firms. Section 5 presents our main results and
robustness checks. Section 6 reports the available direct evidence on what happened to
firm subsidies after the imposition of capital controls. Section 7 concludes.
2. Political Favoritism in Malaysia4
Two forms of political favoritism exist in Malaysia today (Gomez and Jomo
1997). The first is the official status awarded to firms that are run by ethnic Malays. The
second consists of much more informal ties that exist between leading politicians and
firms that are run by both Malay and Chinese business people.
4 Much of this information is taken from Gomez and Jomo (1997), whose research was completedbefore the Asian financial crisis broke out in July 1997.
6
Although ethnic Malays (known as Bumiputeras, literally “sons of the soil”)
account for some 60% of the population, business in Malaysia has historically been
dominated by ethnic Chinese. With an eye toward correcting this imbalance, and partly
in response to ethnic rioting in 1969, the government instituted the New Economic Policy
(NEP) in 1970. Since that time Bumiputeras have been given, among other privileges,
priority for government contracts, increased access to capital, opportunities to buy assets
that are privatized, and other subsidies. The ruling coalition in Malaysia for the past 30
years has been the Barisan Nasional, which is dominated by the United Malays’ National
Organisation (UMNO). Dr. Mahathir Mohamad, president of UMNO and Prime Minister
of Malaysia since 1981, has consistently promoted Bumiputera capitalism (Gomez and
Jomo 1997).
The increased state intervention required for implementation of the NEP has
opened the door to greater political involvement in the financing of firms in Malaysia.5
As the government has more actively handed out favors to firms, businessmen have
increasingly used personal connections to influence the allocation of those favors.
During Mahathir’s tenure as Prime Minister, three government officials, along with their
associated protégés, concentrated the power to help business in Malaysia. The first is
Mahathir himself. The second is Daim Zainuddin, who was finance minister early in
Mahathir’s term and who was brought back into government in 1998. He has been
perhaps the most powerful person in corporate Malaysia and is generally considered to
have been consistently close to Mahathir (at least until summer 2001). The third is
Anwar Ibrahim, who, before his downfall in September 1998, was second in power to
Mahathir and had numerous corporate connections. While Anwar was closely allied with
Mahathir before the crisis, in 1998 he came to be regarded as a potential rival. Although
other officials in Malaysia may have provided valuable connections for businessmen,
Mahathir, Daim, and Anwar have clearly been the most dominant figures. This is
illustrated in Appendix Table 1, which lists politically connected Malaysian companies
5 For example, when Mahathir was minister for trade and industry in 1980 he helped set up theHeavy Industries Corporation of Malaysia (known as Hicom). Hicom subsequently invested inthe auto industry, steel and cement. This kind of investment involved the government in pickingwhich private sector firms received access to investment resources (Perkins and Woo 2000).

7
and to whom they were connected before the Asian financial crisis began in summer
1997.
Note that there is no evidence that the allocation of firms to Anwar rather than
Mahathir was the result of anything other than chance personal relationships. Before the
Asian financial crisis, affiliation to either politician was a close substitute, and we have
found no evidence that being close to one was preferable to being close to the other. We
therefore have no reason to believe that unobserved characteristics of these firms
determined their political affiliations. Any systematic differences in the performance of
those firms should therefore be due to the changing relative value of their political
connections.
3. Data and Methodology
In this section we describe our sample of firms, define the crisis period, and
describe the variables used and how they were constructed.
Sample
The sample consists of all Malaysian firms with at least a minimal amount of data
in the Worldscope database as of October 1999. Although all firm characteristics are
measured on a pre-crisis basis, we use this later version of the Worldscope database
because Worldscope has substantially increased the number of firms that it covers over
time.6 The 424 firms in our sample are representative of the firms that are listed on the
main board of the Kuala Lumpur Stock Exchange. Firms not represented in the sample
include smaller unlisted Malaysian firms and multinationals with no local listing.
Crisis and Rebound Periods
Figure 1 shows an index of stock returns of Malaysian firms in Worldscope for
1990 to 1999, measured in both U.S. dollars and Malaysian ringgit. Lines on the chart
delineate the “crisis period” as defined in this paper. The beginning of the crisis period
corresponds to the devaluation of the Thai baht on July 2, 1997, a date generally
considered to be the starting point of the Asian financial crisis. The end of the crisis
8
period and start of the “rebound period” corresponds to the imposition of capital controls
on September 2, 1998 when the stock index began a sustained upward trend.7
Other studies have focused on September 1998 as a key date in the Malaysian
crisis. Kaplan and Rodrik (2001) explain the nature of Malaysian capital controls in
detail, and assess how economic performance differed after September 1998. The most
detailed account of Malaysia’s economic crisis, Jomo (2001, chapter 7), also identifies
the beginning of September 1998 as the critical turning point.
Political Connections
To identify which firms have political connections with government officials, we
rely on the analysis of Gomez and Jomo (1997). We code as “politically connected” any
firm which Gomez and Jomo (1997) identify as having officers or controlling
shareholders with close relationships with key government officials – primarily Mahathir,
Daim, and Anwar. Appendix Table 1 lists each firm identified as connected and the
nature of the connection.
Using the analysis of Gomez and Jomo (1997) to identify connections has two
limitations. First, these authors do not claim to have exhaustively identified every firm
with political connections in Malaysia. This limitation is not too troublesome, because if
they likely focussed on the subset of firms with the strongest connections or the subset of
the largest firms with connections. Because larger firms generally had better stock price
performance during the crisis, this would make it harder for us to find that (larger)
connected firms performed worse during the crisis. The second limitation is that, while
all connections identified by Gomez and Jomo (1997) are from before the crisis, some are
identified from earlier in the 1990s, creating the possibility that a connection could have
disappeared prior to the beginning of the crisis.8 However, given the relative stability of
6 All the firms included in Worldscope prior to the crisis were still included in October 1999, sothere is no sample selection bias due to firms dropping out of the data set.7 Capital controls were announced on September 1 and the ringgit-dollar rate was fixed in theearly afternoon of September 2, 1998.8 In the second edition of their book, which was prepared in late 1997 and which appeared in1998, Gomez and Jomo (1998) updated their list of political connections. We have used thisrevised list as a robustness check and find that it does not affect any of our main results.However, we prefer to use their pre-crisis list, as this was complete before there was any sign ofeconomic trouble.

9
the government over this period, this limitation is also not too worrying. The variable we
call “Politically Connected”, then, is a dummy variable that is set equal to one if the firm
has a connection as listed in Appendix Table 1, and zero otherwise.
We use the same source, as reported in Appendix Table 1, to create another
dummy variable called “Anwar Connected” which is set equal to one for politically
connected firms whose connections depended primarily upon Anwar (based on the data
presented in Appendix Table 1; 14 firms in total). We code a firm as “Mahathir
Connected” if the connection in Appendix Table 1 is to Mahathir, Daim (Mahathir’s
consistently close political ally), UMNO (the ruling party controlled by Mahathir), or to
another politician. Note that some firms are associated with both camps and that a few
firms are politically connected but the precise nature of the connection is not identified.9
Description of Other Variables
To measure firm performance we use dividend-inclusive monthly stock returns
expressed in Malaysian ringgit. We do not calculate abnormal returns using historical
betas because data limitations prevent calculation of pre-crisis betas for many of the firms
in the sample.10 Instead, we control for factors that could affect expected returns by
including leverage, size, book-to-market ratios (Fama and French 1992), and industry in
the regressions.
Firm size is measured as the logarithm of total firm assets.11 As a measure of
leverage we use the firm’s debt ratio, measured as the book value of total debt divided by
total assets. We include dummy variables for 12 of 13 industries, where industries are
defined broadly, as in Campbell (1996), and correspond with the firm’s primary SIC
9 If a firm is indicated in Gomez and Jomo (1997) as being connected to both Anwar andMahathir (a total of 5 firms), then it is coded as a 1 for Politically Connected, but as a 0 forAnwar Connected and as a 1 for Mahathir Connected. This seems the best way to identify thosefirms that a priori we would expect to suffer from Anwar's downfall.10 Even requiring a price history of just 24 months, we can calculate betas for only 65% of thefirms in our sample. In this subsample, all of our key results are robust to including beta in theregressions.11 Because politically connected firms, on average, are larger than non-connected firms, we repeatour regressions using nonlinear measures of firm size to ensure that size effects do not drive ourresults. Our results are robust to including variables for total assets, total assets squared, and totalassets cubed, as well as the logarithms of these measures, either separately or in combinations.

10
code. The book-to-market ratio is defined as the book value per share divided by the
stock price. All of these variables are constructed using data from Worldscope, and they
are measured using the last available information prior to the beginning of the crisis.
Return on assets is defined as net income (before interest and after taxes) divided
by beginning-of-year total assets. Profit margin is defined as net income divided by net
sales. The current ratio is defined as current assets divided by current liabilities, and the
quick ratio is current assets minus inventory divided by current liabilities. Asset turnover
is defined as net sales divided by total assets, and inventory turnover is cost of goods sold
divided by inventory. Finally, we assume short-term debt is anything with maturity less
than a year.
As a reasonable proxy for access to international capital markets, we look at
where firms’ stocks were traded before the Asian crisis started in summer 1997.12 A
significant number of Malay firms are traded in countries other than Malaysia, including
Singapore (the so-called Central Limit Order Book, CLOB), the U.S. (either a direct
listing or an ADR), London, and (in a few cases) Seoul or another foreign exchange.
Other firms trade only on the Malaysian market. Of Mahathir-connected firms, 40%
trade overseas and 60% trade only in Malaysia.
To identify whether firms are ethnically favored, we use data from the Kuala
Lumpur Stock Exchange Annual Companies Handbook. For each firm, the handbook
identifies how much of its ownership falls into the following categories: Bumiputera,
non-Bumiputera, foreign, or government. The Handbook does not provide an exhaustive
listing of all firms, so we are able to identify the ethnicity of ownership for only 74% of
the firms. To categorize firms as Bumiputera-controlled, we focus on a definition given
by the Corporate Affairs Unit of Malaysia’s Securities Commission (press release,
8/27/96) that states that a Bumiputera-controlled company is one in which 50% or more
of the equity is held by Bumiputera shareholders or institutions.13 We assume that
Our results are also robust to using net sales instead of total assets in all of these specifications.In short, there is no evidence that size effects are driving our results.12 Reese and Weisbach (2001) show that non-U.S. firms that list in the U.S. do this in part toimprove their access to equity capital.13 A secondary definition from the same source notes that a firm may qualify as “Bumiputera-controlled” if 35% of the equity is held by Bumiputeras and 51% or more of the officers of the
11
shareholdings by government agencies contribute toward this percentage. Thus, the
“Ethnically Favored” variable is a dummy variable that is set equal to one if the
Bumiputera shareholdings are above this threshold and zero otherwise.
4. Descriptive Statistics
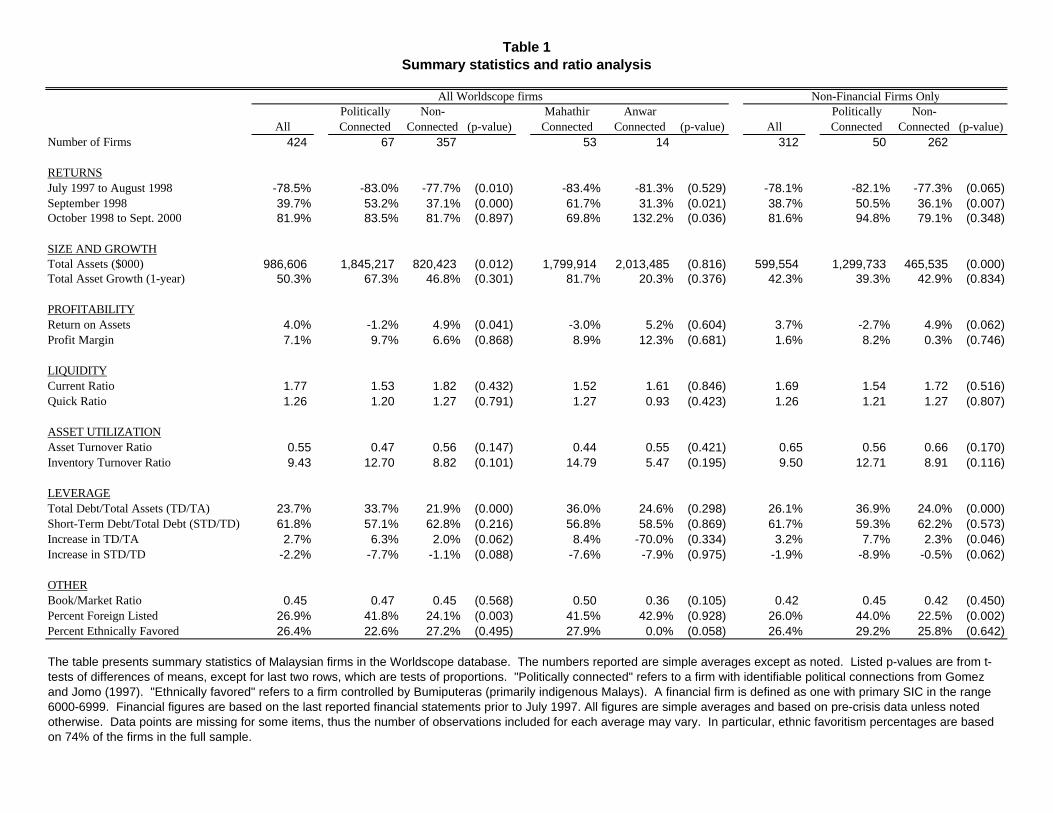
Table 1 reports the basic descriptive data for these firms. The first row reports the
number of firms in each category of our sample, breaking it down by politically
connected versus non-connected and then by Mahathir connected versus Anwar
connected. We also look at non-financial firms separately, as a robustness check.
The second row shows that politically connected firms had significantly worse
returns from July 1997 to August 1998, although there was no significant difference
between Mahathir- and Anwar-connected firms. The third row shows that politically
connected firms had significantly better returns in September 1998, and that Mahathir-
connected firms performed much better than Anwar-connected firms. The fourth row
shows no significant differences between politically connected and unconnected firms in
returns after September 1998. Anwar-connected firms outperformed Mahathir-connected
firms over this later period, although as we explain below this is probably because most
were forced into the Mahathir camp after September 1998.
The fifth row of Table 1 shows that, in terms of total assets, politically connected
firms were significantly larger (about twice the size on average) compared with non-
connected firms, although asset growth immediately before the crisis was not
significantly greater in connected firms (row 6). There is no evidence that Mahathir-
connected firms had more assets on average than Anwar-connected firms.
The seventh row of Table 1 suggests that politically connected firms were less
profitable than non-connected firms (in terms of return on assets) before the crisis. We
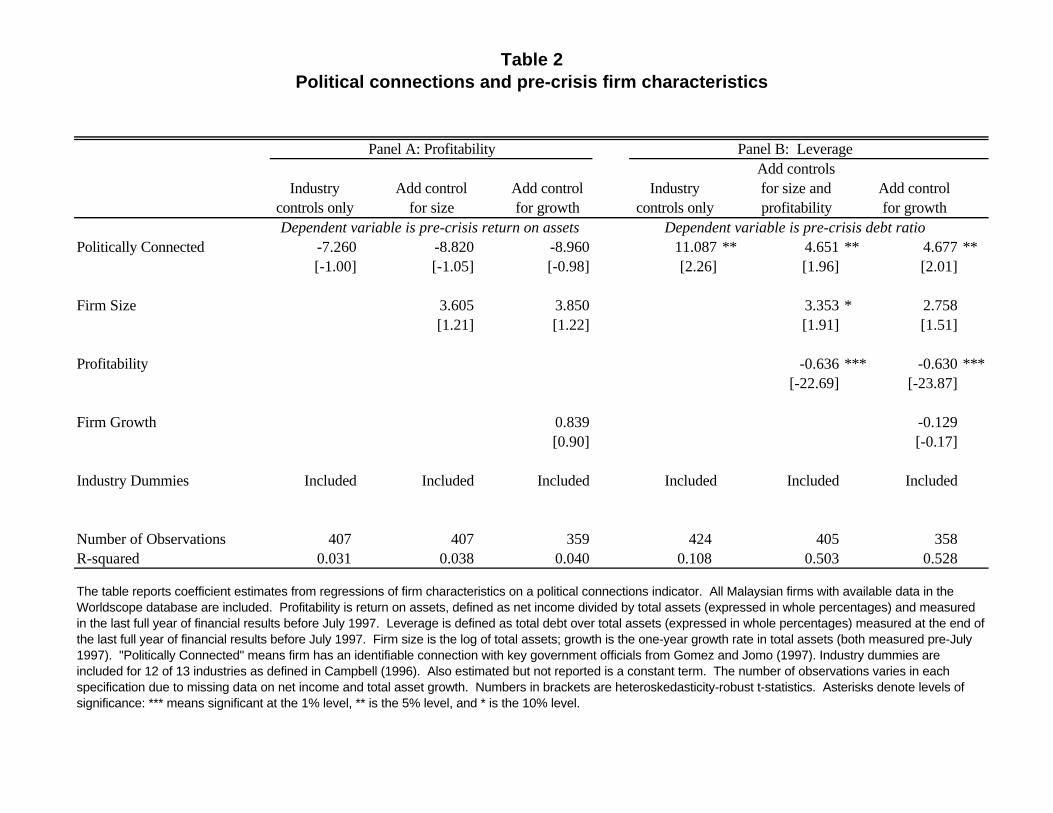
investigate the profitability of firms further in Table 2. Panel A of Table 2 shows that
once we control for other firm characteristics, there is no evidence that politically
connected firms had lower profitability before the crisis.14 With return on assets (in the
firm are Bumiputera. This definition is not useful for our purposes because the ethnicity ofofficers cannot always be inferred from their names.14 Using data through 1995, fewer firms and a different specification, Samad (n.d.) finds thatpolitically connected firms have higher profitability but no difference in investment behavior.
12
last full year of financial results prior to July 1997) as the dependent variable, the dummy
variable for being politically connected is consistently insignificant. The separate
dummies for being Mahathir-connected and Anwar-connected are also not significant in a
regression with profitability as the dependent variable (not reported here).
Table 1 reports very little other difference in the operational efficiency of favored
and non-favored firms.15 The ratios for profitability (profit margin in row 8), liquidity
(current ratio and quick ratio), and asset utilization (asset turnover ratio and inventory
turnover ratio) show no significant differences across the dimensions of political
connections (in terms of t-tests of the means). The book-to-market ratio is one way to
examine whether investors perceive there is expropriation of assets by managers or
controlling shareholders. These ratios are not significantly different for any group of
firms before the crisis. Overall, we find no evidence suggesting that favored firms
performed differently during the crisis because they were better or worse run before the
crisis.
Corporate Indebtedness
If politically connected firms had greater leverage prior to the crisis, then this
could explain some or all of the performance differences. A firm with higher debt would
naturally be expected to perform worse in a crisis both because of the effect of leverage
on a firm’s covariation with the market and also because the depreciation of the local
currency will hurt a firm if any of its debt is denominated in foreign currency.16 The data
on leverage in Table 1 shows that firms with political connections had debt-asset ratios
some eleven-percentage points higher, on average, than non-connected firms prior to the
crisis. However, politically connected firms had less short-term debt and while total debt
to assets before the crisis was rising faster in politically connected firms, the opposite was
true for short-term debt. These differences are only rough measures, however, in that
they do not account for differences in industry or other characteristics.
15 In related work, Pomerleano (1998) uses ratio analysis to study the East Asian crisis, butfocuses on differences across countries rather than differences among firms within a country.16 In addition, if the government responds to the crisis by raising interest rates – as in Malaysiaearly in the crisis – this will raise the cost of servicing corporate debt.

13
Panel B of Table 2 presents the results of regressions intended to measure the
effect of political favoritism on levels of debt more carefully. We estimate the following
model:
Debt ratio = a + b1(Political Connections) + b2(Size) + b3(Profitability)
+b4(Growth) + b5(Industry Dummies) + e,
where the inclusion of size, profitability, and growth follows the lead of Lee, Lee, and
Lee (2001).
Panel B of Table 2 confirms that politically connected firms had more debt before
the crisis. For the full sample, using only industry controls, politically connected firms
had debt ratios eleven percentage points higher (with the coefficient is significant at the
5% level). Restricting the sample to non-financial firms does not eliminate the effect of
politically connections on indebtedness, although it does reduce significance to the 10%
level (result not reported in the table).
Controlling for size, profitability, growth, and industry accounts for part of the
difference in leverage between favored and non-favored firms. Specifically, larger firms
had higher debt ratios (columns 5 and 6), as predicted by Titman and Wessels (1988), and
more profitable firms had lower debt ratios (columns 5 and 6), as would be suggested by
Myers (1977). Firms with higher growth had lower debt ratios (column 6). Only the
coefficient on profitability is consistently significant at standard levels, however. After
controlling for these factors, firms with political connections still had significantly higher
debt ratios than those that were not connected, although the coefficient is halved (to 4.7).
We control for levels of debt in all of our subsequent empirical analysis.
5. Results
This section presents our main results and robustness checks. To assess the
impact of political connections on stock price performance during various periods we
estimate the following model:
Stock Return = a + b1(Political Connection Variables) + b2(Size) + b3(Book-to-
Market Ratio) +b4(Debt Ratio) + b5(Industry Dummies) + e,
14
where the stock return is measured over the indicated period and the political connection
variables change according to the specification.
We take two testable hypotheses directly from Rajan and Zingales, and we add a
third as a plausibility check.
1) The stock price of politically connected firms should have fallen more in the early
crisis period.
2) The stock price of politically connected firms should have risen more once capital
controls were imposed. Within the set of politically connected firms, the benefits of
capital controls should be concentrated in firms that were linked to Mahathir rather
than Anwar in September 1998.
3) Within the set of firms linked to Mahathir, those with prior direct access to
international capital markets should have gained less from capital controls than those
that had always relied just on the Malaysian capital markets.
We examine the evidence for each of these hypotheses in turn.
The Early Crisis: July 1997-August 1998
Table 3 presents the results from these regressions for the period from July 1997
to August 1998.17 In the first three specifications, the Politically Connected dummy
variable is included. The coefficient on the Politically Connected dummy ranges from
–5% to –9%, indicating that a political connection is associated with a greater stock price
decline of 5% to 9%, on average, during the crisis period of July 1997 through August
1998. These coefficients are significant at the 1% level of confidence. The control
variables for size and leverage are also significant in these regressions, with larger size
being associated with higher returns during the crisis, and higher leverage with lower
returns.
17 We use heteroskedasticity-robust standard errors. The significance of our results is not alteredif we adjust the standard errors of the coefficients to account for clustering of observations amongfirms with the same connected entrepreneur. Additionally, multicollinearity does not seem to bea problem in the model, as the average variance inflation factor of the coefficients is about 1.5with September 1998 returns or crisis-period returns as the dependent variable (with maximumvariance inflation factors no greater than 2.8). Also, errors-in-variables regressions indicated thatour results are not particularly sensitive to measurement error.
15
In the final specification we include separate dummies for being connected to
Mahathir or Anwar. Both types of politically connected firms had worse stock price
performance than did unconnected firms: Mahathir-connected firms had an 8.3% greater
decline and Anwar-connected firms had a 6% larger fall. The difference in performance
between Mahathir- and Anwar-connected firms is not significant in this time period.
Note that depending on the precise specification, as many as 6 of the 12 industry
dummies are significant in our "crisis period" regressions. The agricultural sector does
relatively well, presumably because the demand for agricultural products is less
susceptible to downturns. The other sector dummies that are usually significant are
industrial (i.e., manufacturing, which is positive), utilities (also positive), and service
firms (also positive). Most important for our analysis, we find that including industry
dummies does not weaken the coefficients on the political connection variables, in fact
they usually increase in size and always remain significant.
In the first phase of the financial crisis, therefore, favoritism based on personal
relationships had a strongly negative effect on the stock price performance of Malaysian
firms. This is broadly consistent with the Rajan and Zingales (1998) view that firms with
strong political connections may suffer more in a financial crisis, presumably because the
expected value of subsidies declines. It is hard to know exactly what the Malaysian
government was doing with regard to such subsidies in 1997-98, but Anwar’s policy was
to follow tight budget discipline along the lines of a de facto IMF program (although
Malaysia did not sign up for official IMF conditionality). There was also a certain
amount of political rhetoric regarding the need to reduce “cronyism” (and various
statements from both Anwar and Mahathir about who was or was not a “crony”). Our
results indicate that the market interpreted the policies of July 1997 to August 1998 as
squeezing politically connected firms.
The Effects of Capital Controls
If politically connected firms performed poorly during the first phase of the crisis
because the connections themselves decreased in value, then the Rajan and Zingales view
predicts that connected firms would rebound more than non-connected firms when capital
controls were imposed.

16
In general, it could be difficult to differentiate a rebound based on political
connections from a rebound based on operating characteristics of firms. But Malaysian
political events allow for a cleaner test. September 1998 marked both the imposition of
capital controls and also the downfall of the second-most-powerful political figure in
Malaysia, Deputy Prime Minister (and Finance Minister) Anwar. Once considered
Mahathir’s certain successor, Anwar was fired on September 2, 1998, and then jailed on
charges of corruption and sodomy on September 20, 1998. Clearly, over the course of
September 1998, these events reduced the value of political connections for firms with
strong ties to Anwar. To the extent that politically connected firms enjoyed a rebound in
September due to the increased value of their connections, we would not expect the same
increase in value to be enjoyed by Anwar-connected firms. As we argued above, the
allocation of firms to Mahathir rather than Anwar before the crisis was essentially
random, i.e., it did not make any difference in terms of access to resources and was the
result of historical accident rather than some systematic unobserved characteristic of
firms.
The first four columns of Table 4 present the results of regressions of stock
returns for September 1998 on the same variables as in Table 3.18 Politically connected
firms as a whole enjoyed a rebound in September 1998. A higher return of some 18.3%,
significant at the 1% level, can be attributed to political connections, falling only slightly
to 16.3% when we also control for firm size and book-to-market ratio.
The fourth column shows that while there is a large and significant positive
coefficient on being Mahathir-connected in this month (19.9%), the coefficient for the
Anwar-connected dummy is insignificant and actually negative. This result suggests that
the value of political connections themselves was an important determinant of the
fortunes of Malaysian firms during the crisis.
18 One econometric issue is that errors across firms may not be independent because returns arecorrelated in calendar time. As a diagnostic measure to address this issue, we run simulatedregressions of the actual return data on a wide variety of randomly generated hypotheticalvariables. In 10,000 repetitions using September 1998 returns, we find that the coefficients on thehypothetical variables are significant at the 1% level in 1.07% of the repetitions, at the 5% levelin 5.27% of the repetitions, and at the 10% level in 9.97% of the repetitions. (The correspondingpercentages using crisis-period returns are 8.50%, 4.87%, and 9.61% respectively.) The lack ofspuriously significant coefficients indicates that correlation of the errors is probably not a seriousproblem in this data.

17
The last two columns of Table 4 show that, in contrast, from October 1998 to
September 2000, there was no differential stock price return across firms with various
types of political connections. Other regressions on some key sub-periods of this later
period (not reported in the tables) also showed no significant effect of political
connections. The imposition of capital controls appears to have been an unusually
powerful political and market event.
Variation within Mahathir-Connected Firms
If capital controls constrain financial flows across borders, we would expect to
see smaller gains for Mahathir-connected firms having access to international capital
markets compared with Mahathir-connected firms without such access. Table 5 repeats
our basic regressions, breaking down Mahathir- and Anwar-connected firms according to
whether or not they were foreign listed.
Column 4 of Table 5 shows that the only significant gains for politically
connected firms in September 1998 were actually for Mahathir-connected firms that were
not listed on foreign exchanges before the crisis. This subgroup rose 26.6% relative to
independent firms. Foreign listed Mahathir-connected firms also rose relative to the base,
but this increase was not significant. Neither of the Anwar subgroups differed
significantly from the base group.
To assess these results, in columns 1 and 2 of Table 5 we present the same
regressions for the eighteen months before the crisis (January 1996 to June 1997) and for
the crisis period. In both cases the pattern is much more even across the subgroups of
politically connected firms, i.e., being foreign listed does not appear to have been
associated with significant differences in performance prior to September 1998. The
coefficient on the interaction of Anwar-Connected and foreign listed is positive and
significant in the last column, but this should be viewed in light of the fact that most
Anwar firms were forced to switch allegiance to Mahathir in the year that followed the
imposition of capital controls.
In addition, column 3 of Table 5 shows what happened in the market upturn of
February 1998. In this month the market rose 38%, apparently just on improved
expectations of the macroeconomy and not because of any political event or shift of
18
power between Mahathir and Anwar. In this episode we see no significant difference in
performance between any of the politically connected subgroups and the set of
independent firms.
The evidence from Mahathir-connected firms is therefore consistent with the idea
that capital controls affected Malaysian firms’ access to foreign finance. Presumably all
Mahathir-connected firms gained some subsidies or access to local capital when capital
controls were imposed. But some also lost their previous access to international capital.
Economic Significance of Political Connections
Our estimated coefficients indicate that the “political connections” effect is large
relative to one of the most important characteristics of firms – their leverage. From
column 3 of Table 3, the coefficient on the debt ratio is -0.0015. Leverage (the debt
ratio) is expressed in percentage points, i.e., for a firm with total debt to total assets
(TD/TA) of 55%, the variable would be 55.0. So an increase in the debt ratio of 10
percentage points (e.g., from the median debt ratio of 23.3 to 33.3) would correspond to a
lower crisis-period return of 1.5%. The coefficient on the Politically Connected dummy
is -0.078 when we also control for debt, meaning that politically connected firms had a
lower crisis period return of 7.8% compared to non-connected firms. Put together, this
means that having political connections had a similar effect to increasing the debt ratio by
52.0 percentage points (e.g., from the median of 23.3% to around 75%). The standard
deviation of TD/TA is 22.48, so having political connections is roughly equivalent to a 3-
standard deviation increase in the debt ratio during the “crisis period”.
For September 1998, the magnitude is similar. The coefficient of 0.0033 on the
debt-asset ratio (from column 3 in Table 4) corresponds to a higher return of 0.33% for
each percentage point increase in the debt ratio. So the higher return of 14.2% for
politically connected firms is equivalent to the effect of increasing the debt ratio by 43
percentage points (e.g., from the median debt ratio of 23.3% to 66.3%). In sum, for both
periods, the leverage effect is strong, but the political connections effect is arguably much
stronger.
For an alternative measure of economic significance, we use our regression
coefficients to estimate the impact of connections on the total market value of firms. We
19
find that during the crisis period, roughly $5.7 billion of the market value lost by
connected firms is attributable to their political connections. When capital controls were
imposed in September 1998, although market valuations were then on a smaller scale,
political connections accounted for an incremental gain of roughly $1.3 billion in market
value for connected firms.19
By looking at the outcomes for Anwar- and Mahathir-connected firms separately
in September 1998, we can obtain an estimate of the value of political connections as a
percentage of total firm value after capital controls were imposed. If we assume that the
events of September 1998 destroyed all remaining value of Anwar connections and
restored the full value of Mahathir connections, then the loss due to Anwar connections
added to the gain due to Mahathir connections should roughly equal the total percentage
of firm value attributable to political connections. Our regression coefficients from
column 4 of Table 4 show that Mahathir connections account for a 19.9% increase in firm
value in September 1998, while Anwar connections are associated with a 5.1% decrease
in firm value. In terms of (higher) valuations at the end of September 1998, these
percentages would be about 12% and 4% respectively. Summed together, these estimates
suggest that political connections accounted for about 16% of the total market value of
connected firms after the events of September 1998. While only a rough estimate, this
figure is within the 12% to 23% range estimated by Fisman (2001) for connected firms in
Indonesia.
Robustness Checks
We have performed a number of tests in order to check the robustness of the
central result that favored firms performed differently during the initial crisis and after
the imposition of capital controls compared with non-favored firms. Our results do not
appear to be dominated by outliers. All of our key results are robust to truncating the
data at the 1st and 99th percentiles of observations on stock returns, firm size, or debt
ratios.
19 The estimates of the effects of political connections on market value are based on our estimatedregression coefficients, monthly stock prices, and available data on the number of sharesoutstanding for each firm. Because the number of shares outstanding is not known for every

20
Table 6 repeats the regressions of Tables 4 and 5 just for financial firms (as
identified by a primary SIC code in the range 6000 to 6999 in Worldscope). The results
are quite similar. Politically connected financial firms suffered a larger stock price fall
than the average from July 1997 to August 1998, although those with connections to
Anwar did not do as badly. In September 1998, the stock price of financial firms with
political connections surged, but Anwar-connected firms on average did no better than
independent firms.20 Again, when we break the politically connected firms into
subgroups, it is only the Mahathir-connected firms that were not foreign listed that
showed a significant improvement in stock price (57.8%) relative to independent firms.
After October 1998 there was no significant difference in stock returns between Anwar-
connected and other politically connected firms (not reported in the table).
Table 7 provides further robustness checks by adding control variables to our
basic regressions. As discussed in Section 2, some Malaysian firms have advantages
because they are officially ethnically favored. Note that the government publicly states
its support for Bumiputera businesses and has implied that any direct measures to support
firms were primarily designed to help Bumiputeras (Mahathir 2000).21 Perkins and Woo
(2000) also argue that the government helped Bumiputera firms after the imposition of
capital controls. In Panel A of Table 7, we find that whether a firm is officially
Ethnically Favored is not significant and including it does not have a large effect on our
political connections coefficients (in fact, the Mahathir-connected coefficient increases
slightly).
In Panel B of Table 7 we use the log of net sales as an alternative measure of firm
size. Again the results are essentially unchanged. As mentioned previously, alternative
firm size measures also had little effect on the results. Panel C presents the results of
regressions with the sample restricted to firms included in the International Finance
month and is missing for three of the connected firms, the estimated figures are not exactcalculations, but reasonable estimates.20 Anwar-connected financial firms that were foreign-listed did experience a significant increasein stock price, but there are only two such firms, so it is hard to interpret this result. For example,investors may have anticipated that a takeover by Mahathir-connected firms would benefit smallshareholders.21 For example, on p. 20, Prime Minister Mahathir writes, “Recovery must be accompanied by theequitable distribution of the economic pie between Bumiputeras and non-Bumiputeras. Failure todo so could result in the kind of race riots that broke out in May 1969” (Mahathir 2000).
21
Corporation (IFC) Global Index only. The motivation for using this subsample is to
address concerns that some Malaysian stocks in our base sample may not be very liquid,
and thus we may be using uninformative stock prices. The IFC includes stocks in its
Global Index only if they are among the largest and most liquid stocks in the country. In
addition, the quality of data reported to Worldscope is often better for IFC Global Index
firms. In the IFC Global Index subsample, the coefficients on the Politically Connected
and Mahathir-connected dummies change slightly, but retain their significance and
expected sign.
In regressions not reported here, we have also restricted the sample to non-
financial firms only. That is, we have excluded all firms that have primary SIC in the
range 6000 to 6999. The motivation for doing this is that financial data may not be
entirely comparable between financial firms and non-financial firms. For this restricted
sample, the coefficients on the Politically Connected dummy are significant for the crisis
period and for September 1998, and the coefficient on Mahathir-connected remains
positive and significant for September 1998. In other regressions not reported, we use
data from Claessens, Djankov and Lang (2000) and verify that our results are robust to
controlling for whether firms have a family group affiliation.
A potential alternative interpretation of our results is that politically connected
firms may have done relatively well in September 1998 simply because the market
rebounded in that month. Perhaps these firms would have done well in any market
recovery irrespective of whether that upturn involved the imposition of capital controls?
The data do not support this alternative interpretation. As mentioned previously,
February 1998 was a strong upturn month in the middle of the "crisis period" (see Figure
1). In regressions with stock returns for this month only, the coefficient on the Politically
Connected dummy is negative and insignificant, i.e., politically connected firms did not
do well just because there was an upturn in the market. We have run similar regressions
for returns in April 1999 and November 1998, the two other largest percentage jumps in
the index through the end of 2000. In neither case are the political connection variables
significant, or even close to being significant. (Results for these months are not reported
in the tables to save space; they are available from the authors.) These findings support

22
the hypothesis that in September 1998 the relatively good performance of well-connected
firms was due to the political events of that month.
6. Support for Favored Firms after the Imposition of Capital Controls
What did the Malaysian government do once capital controls were imposed?
Some general reflationary measures were taken, including cutting interest rates and
making credit more readily available to consumers and firms (Kaplan and Rodrik 2001,
Mahathir 2000, Chapter 8). Mahathir and Daim also encouraged banks to lend more, and
announced bailouts for troubled firms (Perkins and Woo 2000). A new expansionary
budget was introduced in October 1998 (Perkins and Woo 2000).
There also appears to have been both increased subsidies for some pro-Mahathir
firms and punishments for firms that were allied with Anwar. The anecdotal evidence
strongly supports the idea that the government used the economy’s isolation from short-
term capital flows to restore implicit subsidies for some favored firms. The precise
distribution of subsidies is hard to measure, as they are usually not reported publicly.
However, we can discern the three main forms of these subsidies from high profile
incidents that have been reported in the international media.
First, the state-owned oil company, Petroliam Nasional Bhd. (known as Petronas),
has been called upon to provide bailouts to particular distressed firms (Jayasankaran
1999a). In the most prominent case, Petronas injected cash into the national car company
Perusahaan Otomobil Nasional (known as Proton) (Restall 2000a).22 In mid-1998,
Petronas also acquired the shipping assets of the Prime Minister’s son, Mahathir Mirzan,
who was facing financial difficulties (Lopez 2001).
Second, a number of companies have received advantageous deals directly from
the government. In December 2000, the government bought back the 29% stake held by
Tajudin Ramli in Malaysian Air System (MAS), the operator of Malaysian Airlines. The
price was reported to be about twice the market price, effectively bailing out Mr. Tajudin
22 Petronas is not the only government-controlled institution used to save firms. KhazanahNasional Bhd., the powerful state-owned investment fund, has proved to be an alternative vehiclefor providing financial support. For example, in 2000 it purchased shares in Renong’s telecomunit (Jayasankaran 2000).
23
at the same time as putting MAS on a firmer financial footing.23 There has also been
serious discussion of the government buying back the assets of two unprofitable
privatized light-rail projects in Kuala Lumpur. This would benefit primarily Renong
Bhd., controlled by Halim Saad who is reported to be close to the ruling party (Prystay
2000).
Third, arguably the most significant changes have occurred within the banking
system. The government has supervised a process of consolidation, including instructing
58 financial institutions to merge, creating 10 “superbanks”. The final picture is not yet
settled, but it is clear that bankers who were connected to Anwar are likely to do
relatively badly and those with connections to Daim will do relatively better
(Jayasankaran 1999b). At the same time, large companies, such as Renong and the Lion
group, have been allowed to repeatedly roll over their debts (Dhume, Crispin,
Jayasankaran and Larkin 2001).
All three forms of subsidies may benefit minority shareholders, for example
because they put the supported firms on a stronger financial basis and reduce the
incentives to transfer resources out of the firms (Johnson, Boone, Breach and Friedman
2000). In addition, however, the government has permitted companies to carry out
actions that might otherwise be considered violations of laws protecting minority
shareholders. The most prominent case involves Renong, which is financially distressed
but has a “well-connected” chairman (Restall 2000b). In November 1997, a subsidiary of
Renong, United Engineers Malaysia, received a waiver of stock market rules, in order to
provide a bailout to its parent. The stock market fell sharply on this news, and some
observers interpreted this reaction as indicating that the government would have
difficulties if it provided further support to favored firms. However, in October 1998
after capital controls were in place, the government took over and paid off some of
Renong’s debts (Perkins and Woo 2000).24 Again in late 2000, United Engineers
23 Mr. Tajudin has a great deal of debt: $263bn personally and 900m ringgit borrowed by Naluri,the listed company in which Mr. Tajudin owns 44% and which in turn holds the stake in MAS(Asian Wall Street Journal weekly edition, July 31-August 6, 2000). There has been difficultyservicing these loans.24 Halim Saad, chairman of Renong, is quoted as saying “Yes, the government helped. But ourcreditors will get paid 100% with interest and with no haircuts. What’s wrong withthat?”(Jayasankaran 2000).
24
Malaysia agreed to purchase $1.8bn of problem assets from Renong. Shareholders have
protested these actions.
While it is impossible to measure the size and nature of Malaysian subsidies
precisely, the weight of anecdotal evidence supports the notion that well-connected firms
received direct and indirect financial support from the government after the imposition of
capital controls. This suggests that the market reaction to the imposition of capital
controls in September 1998 was correct in anticipating that particular well-connected
firms would receive greater subsidies.
In addition, we have checked the fate of all the firms in Appendix 1 that are listed
as affiliated primarily to Anwar. As far as we can ascertain, all of these firms have either
been taken over by pro-Mahathir management or the owners have switched allegiance to
Mahathir. In many cases there have been asset transfers out of these firms and into firms
more closely aligned with Mahathir. Again, it seems that the stock market in September
1998 correctly anticipated what would happen.
Assessment
Malaysia’s macroeconomic performance after the imposition of capital controls
was good. Growth was 4.7% in 1999, although there remains a controversy about
whether it would have been higher or lower without capital controls (Kaplan and Rodrik
2001, Dornbusch 2001a). At the same time, there is clear evidence of some government
support for favored firms, both directly and – more commonly – through various forms of
indirect subsidies.
Weak institutions in Malaysia mean that the allocation of government favoritism
is of first-order importance for firm-level outcomes. As a result, when hit by the initial
Asian crisis, favored firms suffered large falls in expected subsidies. The imposition of
capital controls, on the other hand, allowed the government to channel greater resources
(and provide other advantages) to firms with strong political connections to the Prime
Minister. The interaction of shocks and institutions therefore had a large impact on the
distribution of outcomes at the firm level.
25
7. Conclusion
The evidence from Malaysia strongly supports the idea that firms with political
connections were expected to lose subsidies in the first phase of the Asian crisis.
Conversely, firms connected to the Prime Minister were expected to gain subsidies when
capital controls were imposed in September 1998. The main beneficiaries of capital
controls were apparently well-connected firms that did not previously have access to
international capital markets.
The presence of political connections in East Asian economies does not mean that
“cronyism” caused the crisis or even that “relationship-based capitalism” was necessarily
a suboptimal system for these countries. While politically connected firms were hit
harder during the crisis, the evidence presented here does not suggest that this was a
punishment for past misdeeds and deficiencies. The evidence suggests rather that the
crisis implied previously favored firms would lose valuable subsidies, and the imposition
of capital controls indicated that these subsidies would be restored for some firms.
Our Malaysian results offer empirical evidence that is consistent with the general
idea of Blanchard (2000), who argues that macroeconomic dynamics depend on
institutional structures: “Institutions also matter for short-run fluctuations, with different
mechanisms across countries” (p.1404). There is growing evidence that institutions
matter for long-term growth (e.g., Acemoglu, Johnson and Robinson 2001.) A great
remains to be done, however, to understand precisely how institutions affect short- and
medium-run outcomes.
26
Bibliography
Acemoglu, Daron, Simon Johnson, and James Robinson, 2001, “The Colonial Origins ofComparative Development: An Empirical Investigation,” American EconomicReview, forthcoming.
Annual Companies Handbook, 1996-1998, Kuala Lumpur: Kuala Lumpur StockExchange.
Bhagwati, Jagdish 1998a, “The Capital Myth,” Foreign Affairs, May.
Bhagwati, Jagdish, 1998b, “Why Free Capital Mobility may be Hazardous to YourHealth: Lessons from the Latest Financial Crisis,” NBER Conference on CapitalControls, November 7.
Blanchard, Olivier, 2000, “What Do We Know about Macroeconomics that Fisher andWicksell Did Not?” Quarterly Journal of Economics, CXV, November, 1375-1410.
Campbell, John, 1996, “Understanding Risk and Return,” Journal of Political Economy104, 298-345.
Claessens, Stijn, Simeon Djankov, and Larry H. P. Lang, 2000, “The Separation ofOwnership and Control in East Asian Corporations,” Journal of FinancialEconomics 58, 81-112.
Dhume, Sahanand, Shawn W. Crispin, S. Jayasankaran and John Larkin, 2001,“Economic Reform – Running Out of Steam,” Far Eastern Economic Review,January 18.
Dornbusch, Rudi, 2001a, “Malaysia: Was It Different?” NBER working paper 8325.
Dornbusch, Rudi, 2001b, “Amazing, But True: Japan is Bust,” manuscript, MIT, April.
Fama, Eugene F., and Kenneth R. French, 1992, “The Cross-Section of ExpectedStock Returns,” Journal of Finance 47, 427-465.
Fisman, Raymond, 2001, “It’s Not What You Know . . . Estimating the Value of PoliticalConnections,” American Economic Review, forthcoming.
Gomez, Edmund Terence, and Jomo K.S., 1997, Malaysia’s Political Economy: Politics,Patronage and Profits, Cambridge University Press, First Edition.
Gomez, Edmund Terence, and Jomo K.S., 1998, Malaysia’s Political Economy: Politics,Patronage and Profits, Cambridge University Press, Second Edition
27
Jayasankaran, S., 1999a, “Saviour Complex,” Far Eastern Economic Review, August 12.
Jayasankaran, S., 1999b, “Merger by Decree,” Far Eastern Economic Review, September9.
Jayasankaran, S., 2000, “Entrepreneurs – A Question of Honour: Renong GroupChairman Halim Saad wins a postponement of a purchase of shares he iscommitted to buy; the markets are appalled,” Far Eastern Economic Review,December 21.
Johnson, Simon, Peter Boone, Alasdair Breach, and Eric Friedman, 2000, “CorporateGovernance in the Asian Financial Crisis, 1997-98,” Journal of FinancialEconomics 58, 141-186.
Jomo, K.S., 2001, Malaysian Eclipse: Economic Crisis and Recovery, Zed Books Ltd,London and New York.
Kaplan, Ethan, and Dani Rodrik, 2001, “Did the Malaysian Capital Controls Work?”NBER working paper 8142.
Krugman, Paul, 1998, “Saving Asia: It’s Time to Get Radical,” Fortune, September 7.
La Porta, Rafael, Florencio Lopez-de-Silanes and G. Zamarippa, 2001, “RelatedLending,” manuscript, Harvard University, April 3.
La Porta, Rafael, Florencio Lopez-de-Silanes, Andrei Shleifer, and Robert W. Vishny,1997, “Legal Determinants of External Finance,” Journal of Finance 52, 1131-1150.
La Porta, Rafael, Florencio Lopez-de-Silanes, Andrei Shleifer, and Robert W. Vishny,1998, “Law and Finance,” Journal of Political Economy 106, 1115-1155.
Lee, Jong-Wha, Young Soo Lee, and Byung-Sun Lee, 2001, “The Determination ofCorporate Debt in Korea,” Asian Economic Journal, forthcoming.
Lemmon, Michael L. and Karl V. Lins, 2001, “Ownership Structure, CorporateGovernance, and Firm Value: Evidence from the East Asian Financial Crisis,”manuscript, University of Utah.
Lopez, Leslie, 2001, “Mokhzani Mahathir Exits Two Firms – Prime Minister’s Son SaysHe Wants to Put to Rest Accusations of Nepotism,” The Asian Wall StreetJournal, April 30.
Mahathir Mohamad, 2000, The Malaysian Currency Crisis: How and Why it Happened,Pelanduk Publications.
28
Mitton, Todd, 2001, “A Cross-Firm Analysis of the Impact of Corporate Governance onthe East Asian Financial Crisis,” Journal of Financial Economics, forthcoming.
Morck, Randall, David Strangeland and Bernard Yeung, 2000, “Inherited Wealth,Corporate Control and Economic Growth: The Canadian Disease?” In Morck, R.(ed.), Concentrated Corporate Ownership. National Bureau of EconomicResearch and the University of Chicago Press.
Morck, Randall, Bernard Yeung and Wayne Yu, 2000, “The Information Content ofStock Markets: Why Do Emerging Markets Have Synchronous Stock PriceMovements?” Journal of Financial Economics 58, 215-260.
Myers, Stewart, 1977, “The Determinants of Corporate Borrowing,” Journal of FinancialEconomics 5, 147-175.
Perkins, Dwight Heald and Wing Thye Woo, 2000, “Malaysia: Adjusting to DeepIntegration with the World Economy,” in Wing Thye Woo, Jeffrey D. Sachs, andKlaus Schwab (ed.), The Asian Financial Crisis: Lessons for a Resilient Asia,MIT Press, 2000.
Petersen, Mitchell and Raghuram G. Rajan 1995, "The Effect of Credit MarketCompetition on Lending Relationships," Quarterly Journal of Economics, 1995,vol. 110, 407-443.
Pomerleano, Michael, 1998, “East Asian Crisis and Corporate Finances: The UntoldStory,” Emerging Markets Quarterly 2:4, 14-27.
Prystay, Cris, 2000, “Malaysia Reverses Course in Privatization Program – GovernmentNationalizes 2 Light-Rail Projects,” The Asian Wall Street Journal, December 27.
Rajan, Raghuram G., and Luigi Zingales, 1998, “Which Capitalism? Lessons from theEast Asian Crisis,” Journal of Applied Corporate Finance 11, 40-48.
Rajan, Raghuram G., and Luigi Zingales, 2001, “The Great Reversals: The Politics ofFinancial Development in the 20th Century,” manuscript MIT and Chicago,February.
Reese, William A. Jr. and Michael S. Weisbach, 2001, “Protection of MinorityShareholder Interests, Cross-Listings in the United States, and Subsequent EquityOfferings,” NBER working paper 8164, March.
Restall, Hugo, 2000a, “Malaysia’s National Car Hurts Malaysians,” Asian Wall StreetJournal weekly edition, August 28-September 3, p.17.
29
Restall, Hugo, 2000b, “Reading Malaysia’s Rorschach Test,” Asian Wall Street Journalweekly edition, December 11-17.
Rodrik, Dani, 2000, “Exchange Rate Regimes and Institutional Arrangements in theShadow of Capital Flows,” manuscript, Harvard University, September.
Samad, M. Fazilah Binti Abdul, no date, “Performance of Politically-AffiliatedBusinesses in Malaysia: A Summary of Principal Findings,” manuscript,University of Malaya.
Titman, Sheridan, and R. Wessels, 1988, “The Determinants of Capital StructureChoice,” Journal of Finance 43, 1-19.
AllPoliticallyConnected
Non-Connected (p-value)
Mahathir Connected
Anwar Connected (p-value) All
PoliticallyConnected
Non-Connected (p-value)
Number of Firms 424 67 357 53 14 312 50 262
RETURNSJuly 1997 to August 1998 -78.5% -83.0% -77.7% (0.010) -83.4% -81.3% (0.529) -78.1% -82.1% -77.3% (0.065)September 1998 39.7% 53.2% 37.1% (0.000) 61.7% 31.3% (0.021) 38.7% 50.5% 36.1% (0.007)October 1998 to Sept. 2000 81.9% 83.5% 81.7% (0.897) 69.8% 132.2% (0.036) 81.6% 94.8% 79.1% (0.348)
SIZE AND GROWTHTotal Assets ($000) 986,606 1,845,217 820,423 (0.012) 1,799,914 2,013,485 (0.816) 599,554 1,299,733 465,535 (0.000)Total Asset Growth (1-year) 50.3% 67.3% 46.8% (0.301) 81.7% 20.3% (0.376) 42.3% 39.3% 42.9% (0.834)
PROFITABILITYReturn on Assets 4.0% -1.2% 4.9% (0.041) -3.0% 5.2% (0.604) 3.7% -2.7% 4.9% (0.062)Profit Margin 7.1% 9.7% 6.6% (0.868) 8.9% 12.3% (0.681) 1.6% 8.2% 0.3% (0.746)
LIQUIDITYCurrent Ratio 1.77 1.53 1.82 (0.432) 1.52 1.61 (0.846) 1.69 1.54 1.72 (0.516)Quick Ratio 1.26 1.20 1.27 (0.791) 1.27 0.93 (0.423) 1.26 1.21 1.27 (0.807)
ASSET UTILIZATIONAsset Turnover Ratio 0.55 0.47 0.56 (0.147) 0.44 0.55 (0.421) 0.65 0.56 0.66 (0.170)Inventory Turnover Ratio 9.43 12.70 8.82 (0.101) 14.79 5.47 (0.195) 9.50 12.71 8.91 (0.116)
LEVERAGETotal Debt/Total Assets (TD/TA) 23.7% 33.7% 21.9% (0.000) 36.0% 24.6% (0.298) 26.1% 36.9% 24.0% (0.000)Short-Term Debt/Total Debt (STD/TD) 61.8% 57.1% 62.8% (0.216) 56.8% 58.5% (0.869) 61.7% 59.3% 62.2% (0.573)Increase in TD/TA 2.7% 6.3% 2.0% (0.062) 8.4% -70.0% (0.334) 3.2% 7.7% 2.3% (0.046)Increase in STD/TD -2.2% -7.7% -1.1% (0.088) -7.6% -7.9% (0.975) -1.9% -8.9% -0.5% (0.062)
OTHERBook/Market Ratio 0.45 0.47 0.45 (0.568) 0.50 0.36 (0.105) 0.42 0.45 0.42 (0.450)Percent Foreign Listed 26.9% 41.8% 24.1% (0.003) 41.5% 42.9% (0.928) 26.0% 44.0% 22.5% (0.002)Percent Ethnically Favored 26.4% 22.6% 27.2% (0.495) 27.9% 0.0% (0.058) 26.4% 29.2% 25.8% (0.642)
The table presents summary statistics of Malaysian firms in the Worldscope database. The numbers reported are simple averages except as noted. Listed p-values are from t-tests of differences of means, except for last two rows, which are tests of proportions. "Politically connected" refers to a firm with identifiable political connections from Gomez and Jomo (1997). "Ethnically favored" refers to a firm controlled by Bumiputeras (primarily indigenous Malays). A financial firm is defined as one with primary SIC in the range 6000-6999. Financial figures are based on the last reported financial statements prior to July 1997. All figures are simple averages and based on pre-crisis data unless noted otherwise. Data points are missing for some items, thus the number of observations included for each average may vary. In particular, ethnic favoritism percentages are based on 74% of the firms in the full sample.
Non-Financial Firms OnlyAll Worldscope firms
Table 1Summary statistics and ratio analysis
Industry controls only
Add control for size
Add controlfor growth
Industry controls only
Add controls for size and profitability
Add control for growth
Dependent variable is pre-crisis return on assets Dependent variable is pre-crisis debt ratioPolitically Connected -7.260 -8.820 -8.960 11.087 ** 4.651 ** 4.677 **
[-1.00] [-1.05] [-0.98] [2.26] [1.96] [2.01]
Firm Size 3.605 3.850 3.353 * 2.758[1.21] [1.22] [1.91] [1.51]
Profitability -0.636 *** -0.630 ***[-22.69] [-23.87]
Firm Growth 0.839 -0.129[0.90] [-0.17]
Industry Dummies Included Included Included Included Included Included
Number of Observations 407 407 359 424 405 358R-squared 0.031 0.038 0.040 0.108 0.503 0.528
The table reports coefficient estimates from regressions of firm characteristics on a political connections indicator. All Malaysian firms with available data in the Worldscope database are included. Profitability is return on assets, defined as net income divided by total assets (expressed in whole percentages) and measured in the last full year of financial results before July 1997. Leverage is defined as total debt over total assets (expressed in whole percentages) measured at the end of the last full year of financial results before July 1997. Firm size is the log of total assets; growth is the one-year growth rate in total assets (both measured pre-July 1997). "Politically Connected" means firm has an identifiable connection with key government officials from Gomez and Jomo (1997). Industry dummies are included for 12 of 13 industries as defined in Campbell (1996). Also estimated but not reported is a constant term. The number of observations varies in each specification due to missing data on net income and total asset growth. Numbers in brackets are heteroskedasticity-robust t-statistics. Asterisks denote levels of significance: *** means significant at the 1% level, ** is the 5% level, and * is the 10% level.
Table 2Political connections and pre-crisis firm characteristics
Panel A: Profitability Panel B: Leverage

Political connections,
without controls
Political connections,
with controls, no leverage
Political connections,
with controls, incl. leverage
Mahathir and Anwar
connectionsDependent variable is stock return from July 1997 to August 1998
Politically Connected -0.053 *** -0.092 *** -0.078 ***[-3.32] [-4.56] [-3.90]
Mahathir Connected -0.083 ***[-3.65]
Anwar Connected -0.060 **[-2.14]
Firm Size 0.070 *** 0.077 *** 0.076 ***[4.82] [5.25] [5.24]
Book/Market Ratio -0.010 -0.032 -0.031[-0.30] [-0.98] [-0.94]
Debt Ratio -0.0015 ** -0.0015 **[-2.27] [-2.24]
Industry Dummies No Included Included Included
Number of Observations 424 424 424 424R-squared 0.016 0.198 0.238 0.239
The table reports coefficient estimates from regressions of stock returns on political connection variables and control variables over the Asian crisis period of July 1997 to August 1998. All Malaysian firms with available data in the Worldscope database are included. Numbers in brackets are heteroskedasticity-robust t-statistics. Asterisks denote levels of significance: *** means significant at the 1% level, ** is the 5% level, and * is the 10% level. "Politically Connected" means the firm has an identifiable connection with key government officials from Gomez and Jomo (1997). "Mahathir Connected" and "Anwar Connected" indicate the source of the political connection as in Gomez and Jomo (1997) . Firm size is measured as the log of total assets; the debt ratio is measured as total debt over total assets. Industry dummies are included for 12 of 13 industries as defined in Campbell (1996), with the industry corresponding to the primary SIC code of each firm. Also estimated but not reported is a constant term.
Political connections and crisis-period stock returnsTable 3
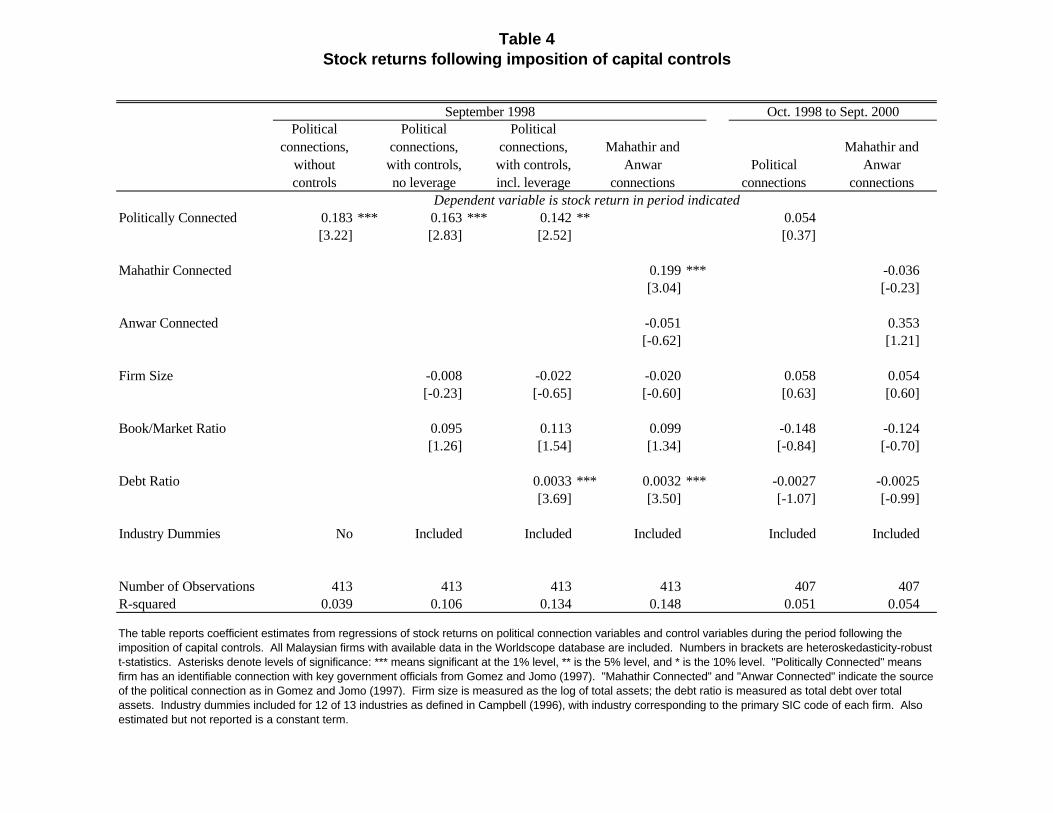
Political connections,
without controls
Political connections,
with controls, no leverage
Political connections,
with controls, incl. leverage
Mahathir and Anwar
connectionsPolitical
connections
Mahathir and Anwar
connectionsDependent variable is stock return in period indicated
Politically Connected 0.183 *** 0.163 *** 0.142 ** 0.054[3.22] [2.83] [2.52] [0.37]
Mahathir Connected 0.199 *** -0.036[3.04] [-0.23]
Anwar Connected -0.051 0.353[-0.62] [1.21]
Firm Size -0.008 -0.022 -0.020 0.058 0.054[-0.23] [-0.65] [-0.60] [0.63] [0.60]
Book/Market Ratio 0.095 0.113 0.099 -0.148 -0.124[1.26] [1.54] [1.34] [-0.84] [-0.70]
Debt Ratio 0.0033 *** 0.0032 *** -0.0027 -0.0025[3.69] [3.50] [-1.07] [-0.99]
Industry Dummies No Included Included Included Included Included
Number of Observations 413 413 413 413 407 407R-squared 0.039 0.106 0.134 0.148 0.051 0.054
Table 4
The table reports coefficient estimates from regressions of stock returns on political connection variables and control variables during the period following the imposition of capital controls. All Malaysian firms with available data in the Worldscope database are included. Numbers in brackets are heteroskedasticity-robust t-statistics. Asterisks denote levels of significance: *** means significant at the 1% level, ** is the 5% level, and * is the 10% level. "Politically Connected" means firm has an identifiable connection with key government officials from Gomez and Jomo (1997). "Mahathir Connected" and "Anwar Connected" indicate the source of the political connection as in Gomez and Jomo (1997). Firm size is measured as the log of total assets; the debt ratio is measured as total debt over total assets. Industry dummies included for 12 of 13 industries as defined in Campbell (1996), with industry corresponding to the primary SIC code of each firm. Also estimated but not reported is a constant term.
September 1998 Oct. 1998 to Sept. 2000
Stock returns following imposition of capital controls

Before crisis: Jan 1996 to June 1997
Crisis period: July 1997 to Aug 1998
Early market upturn:
Feb 1998
Capital controls imposed:Sept 1998
Later period: Oct 1998 to Sept 2000
Dependent variable is stock return in period indicatedMahathir Connected*Foreign Listed -0.159 * -0.089 *** 0.017 0.101 -0.152
[-1.95] [-2.89] [0.19] [1.29] [-0.84]
Mahathir Connected*Not Foreign Listed -0.026 -0.080 *** -0.082 0.266 *** 0.044[-0.28] [-3.01] [-0.98] [3.05] [0.21]
Anwar Connected*Foreign Listed 0.082 -0.131 *** 0.152 0.013 0.802 *[0.64] [-3.20] [1.01] [0.10] [1.86]
Anwar Connected*Not Foreign Listed 0.688 -0.005 -0.101 -0.099 0.009[1.08] [-0.23] [-0.94] [-0.99] [0.03]
Firm Size 0.066 0.077 *** -0.045 -0.019 0.053[1.19] [5.27] [-1.09] [-0.56] [0.58]
Book/Market Ratio -0.074 -0.030 -0.040 0.102 -0.125[-0.51] [-0.91] [-0.47] [1.39] [-0.70]
Debt Ratio -0.0013 -0.0015 ** 0.0000 0.0032 *** -0.0025[-1.62] [-2.26] [-0.01] [3.42] [-0.99]
Industry Dummies Included Included Included Included Included
Number of Observations 375 424 422 413 407R-squared 0.052 0.244 0.025 0.155 0.060
Table 5
The table reports coefficient estimates from regressions of stock returns on political connection variables interacted with foreign trading status and control variables. Stock return periods are as noted in each column. All Malaysian firms with available data in the Worldscope database are included. Numbers in brackets are heteroskedasticity-robust t-statistics. Asterisks denote levels of significance: *** means significant at the 1% level, ** is the 5% level, and * is the 10% level. "Politically Connected" means firm has an identifiable connection with key government officials from Gomez and Jomo (1997). "Mahathir Connected" and "Anwar Connected" indicate the source of the political connection as in Gomez and Jomo (1997). "Foreign Listed" indicates that the firm's stock is traded in a foreign market in addition to Malaysia. Firm size is measured as the log of total assets; the debt ratio is measured as total debt over total assets. Industry dummies included for 12 of 13 industries as defined in Campbell (1996), with industry corresponding to the primary SIC code of each firm. Also estimated but not reported is a constant term.
Capital controls and the interaction of political connections and foreign listings
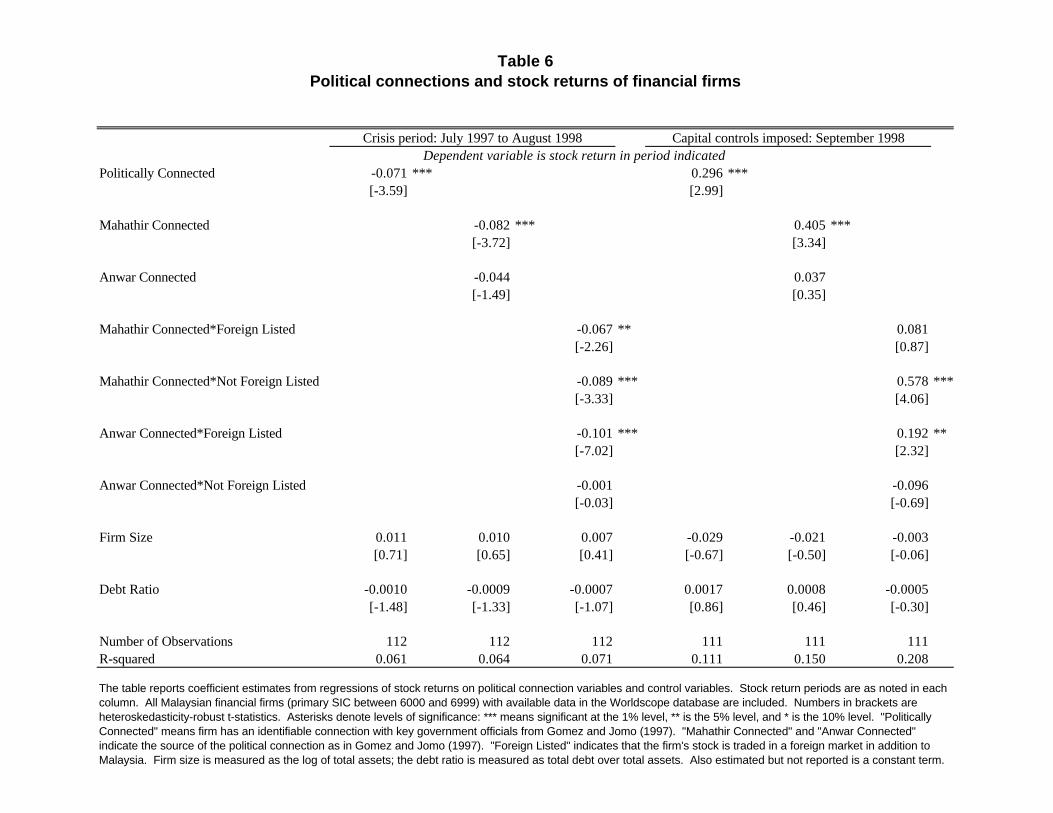
Dependent variable is stock return in period indicatedPolitically Connected -0.071 *** 0.296 ***
[-3.59] [2.99]
Mahathir Connected -0.082 *** 0.405 ***[-3.72] [3.34]
Anwar Connected -0.044 0.037[-1.49] [0.35]
Mahathir Connected*Foreign Listed -0.067 ** 0.081[-2.26] [0.87]
Mahathir Connected*Not Foreign Listed -0.089 *** 0.578 ***[-3.33] [4.06]
Anwar Connected*Foreign Listed -0.101 *** 0.192 **[-7.02] [2.32]
Anwar Connected*Not Foreign Listed -0.001 -0.096[-0.03] [-0.69]
Firm Size 0.011 0.010 0.007 -0.029 -0.021 -0.003[0.71] [0.65] [0.41] [-0.67] [-0.50] [-0.06]
Debt Ratio -0.0010 -0.0009 -0.0007 0.0017 0.0008 -0.0005[-1.48] [-1.33] [-1.07] [0.86] [0.46] [-0.30]
Number of Observations 112 112 112 111 111 111R-squared 0.061 0.064 0.071 0.111 0.150 0.208
The table reports coefficient estimates from regressions of stock returns on political connection variables and control variables. Stock return periods are as noted in each column. All Malaysian financial firms (primary SIC between 6000 and 6999) with available data in the Worldscope database are included. Numbers in brackets are heteroskedasticity-robust t-statistics. Asterisks denote levels of significance: *** means significant at the 1% level, ** is the 5% level, and * is the 10% level. "Politically Connected" means firm has an identifiable connection with key government officials from Gomez and Jomo (1997). "Mahathir Connected" and "Anwar Connected" indicate the source of the political connection as in Gomez and Jomo (1997). "Foreign Listed" indicates that the firm's stock is traded in a foreign market in addition to Malaysia. Firm size is measured as the log of total assets; the debt ratio is measured as total debt over total assets. Also estimated but not reported is a constant term.
Political connections and stock returns of financial firmsTable 6
Crisis period: July 1997 to August 1998 Capital controls imposed: September 1998

Crisis period: July 1997 to Aug 1998
Capital controls:
Sept 1998
Crisis period: July 1997 to Aug 1998
Capital controls:
Sept 1998
Crisis period: July 1997 to Aug 1998
Capital controls:
Sept 1998Dependent variable is stock return in period indicated
Mahathir Connected -0.071 *** 0.2129 *** -0.079 *** 0.2202 *** -0.066 ** 0.1951 *[-2.96] [2.78] [-3.52] [3.39] [-2.55] [1.97]
Anwar Connected -0.019 -0.153 -0.057 ** -0.030 -0.061 * -0.151[-0.72] [-1.49] [-2.06] [-0.37] [-1.72] [-1.40]
Ethnically Favored 0.014 -0.004[0.95] [-0.10]
Firm Size 0.059 *** 0.013 0.026 *** -0.023 ** 0.111 *** -0.133 **[3.69] [0.33] [4.56] [-2.14] [5.56] [-2.24]
Book/Market Ratio 0.022 0.067 0.015 0.081 -0.124 *** 0.192[0.64] [0.67] [0.49] [1.24] [-2.72] [1.20]
Debt Ratio -0.0025 ** 0.0034 *** -0.0014 ** 0.0037 *** -0.0008 0.0028[-6.60] [3.09] [-2.11] [3.94] [-1.33] [1.56]
Industry Dummies Included Included Included Included Included Included
Number of Observations 318 308 408 397 156 149Adjusted R-squared 0.311 0.164 0.256 0.171 0.420 0.321
The table reports coefficient estimates from regressions of stock returns on political connection variables and control variables during the periods indicated. All Malaysian firms with available data in the Worldscope database are included, except in Panel C where only firms included in International Finance Corporation indexes are included. Numbers in brackets are heteroskedasticity-robust t-statistics. Asterisks denote levels of significance: *** means significant at the 1% level, ** is the 5% level, and * is the 10% level. "Ethnically Favored" indicates that the firm is controlled by Bumiputera (primarily ethnic Malay) interests. Number of observations is smaller in Panel A because ethnicity is not identifiable for all firms. "Mahathir Connected" and "Anwar Connected" indicate the source of the political connections of Malaysian firms as in Gomez and Jomo (1997). Firm size is measured as the log of total assets, except in Panel B where it is measured as the log of net sales (sales data is missing for 16 firms). The debt ratio is measured as total debt over total assets. Industry dummies included for 12 of 13 industries as defined in Campbell (1996), with industry corresponding to the primary SIC code of each firm. Also estimated but not reported is a constant term.
Table 7
A: Control for Ethnicity C: IFC Firms Only
Robustness checks
B: Alternative Firm Size Measure
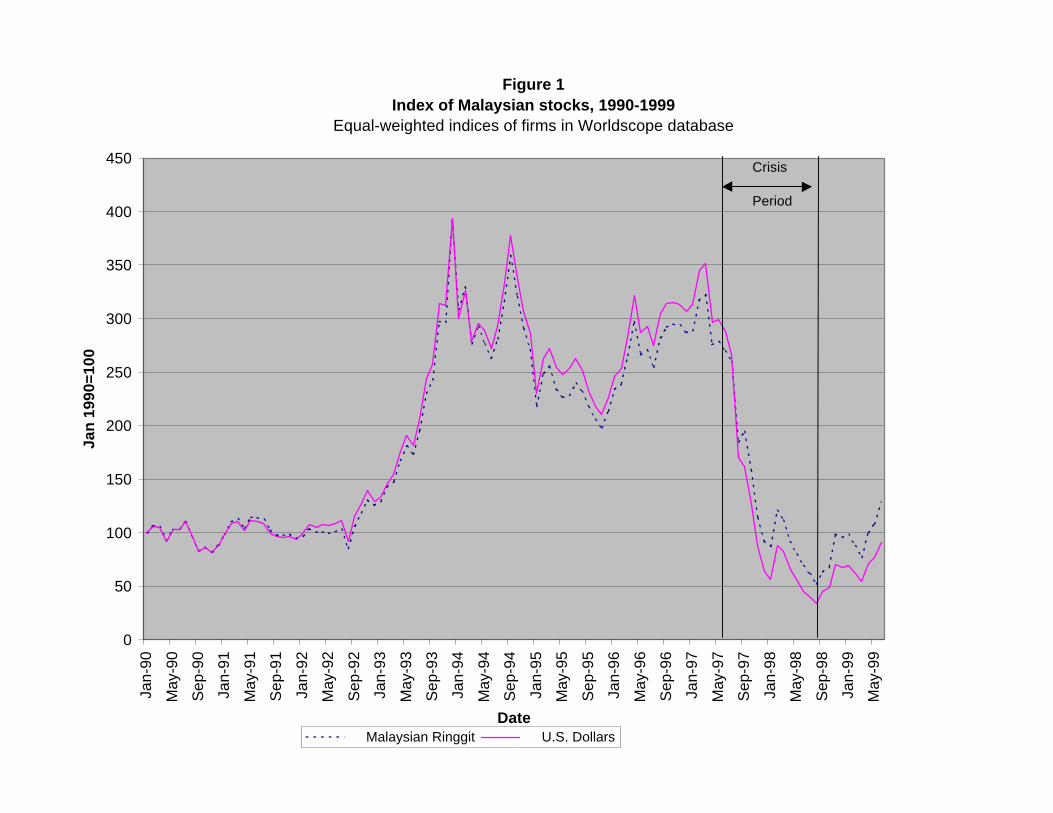
Figure 1Index of Malaysian stocks, 1990-1999
Equal-weighted indices of firms in Worldscope database
0
50
100
150
200
250
300
350
400
450Ja
n-9
0
May
-90
Se
p-9
0
Jan
-91
May
-91
Se
p-9
1
Jan
-92
May
-92
Se
p-9
2
Jan
-93
May
-93
Se
p-9
3
Jan
-94
May
-94
Se
p-9
4
Jan
-95
May
-95
Se
p-9
5
Jan
-96
May
-96
Se
p-9
6
Jan
-97
May
-97
Se
p-9
7
Jan
-98
May
-98
Se
p-9
8
Jan
-99
May
-99
Date
Jan
199
0=10
0
Malaysian Ringgit U.S. Dollars
Crisis
Period

COMPANY NAME Primary Connected Major Shareholder/Director Primary Political ConnectionADVANCE SYNERGY BHD Ahmad Sebi Abu Bakar Daim, AnwarANTAH HOLDINGS BHD Negeri Sembilan royalty MahathirAOKAM PERDANA BHD Samsudin Abu Hassan DaimARAB MALAYSIAN CORPORATION BHD Azman Hashim UMNOAUSTRAL AMALGAMATED BHD Samsudin Abu Hassan DaimBAN HIN LEE BANK BHD Quek Leng Chan AnwarBANDAR RAYA DEVELOPMENTS BHD MCA MCABERJAYA GROUP BHD Vincent Tan Chee Yioun DaimBERJAYA SPORTS TOTO BHD Vincent Tan Chee Yioun DaimCOLD STORAGE (MALAYSIA) BHD Basir Ismail, Samsudin Abu Hassan DaimCONSTRUCTION AND SUPPLIES HOUSE Joseph Ambrose Lee, Abdul Mulok Awang Damit DaimCYCLE & CARRIAGE BINTANG BHD Basir Ismail DaimDAMANSARA REALTY BHD Koperasi Usaha Bersatu Bhd UMNODATUK KERAMAT HOLDINGS BHD Koperasi Usaha Bersatu Bhd UMNODIVERSIFIED RESOURCES BHD Yahya Ahmad, Nasaruddin Jalil Anwar, MahathirEKRAN BHD Ting Pek Khiing Daim, Mahathir, Abdul Taib MahmudFABER GROUP BHD UMNO UMNOGADEK (MALAYSIA) BHD Yahya Ahmad, Nasaruddin Jalil Anwar, MahathirGEORGE TOWN HOLDINGS BHD Tunku Abdullah MahathirGOLDEN PLUS HOLDINGS BHD Ishak Ismail, Mohamed Sarit Haji Yusoh AnwarGRANITE INDUSTRIES BHD Samsudin Abu Hassan DaimHICOM HOLDINGS BHD Yahya Ahmad Anwar, MahathirHO HUP CONSTRUCTION COMPANY BHD Halim Saad DaimHONG LEONG BANK BHD Quek Leng Chan AnwarHONG LEONG CREDIT BHD Quek Leng Chan AnwarHONG LEONG INDUSTRIES BHD Quek Leng Chan AnwarHONG LEONG PROPERTIES BHD Quek Leng Chan AnwarHUME INDUSTRIES (MALAYSIA) BHD Quek Leng Chan AnwarIDRIS HYDRAULIC (MALAYSIA) BHD Ishak Ismail AnwarKAMUNTING CORPORATION BHD T.K. Lim DaimKFC HOLDINGS (MALAYSIA) BHD Ishak Ismail AnwarKINTA KELLAS PUBLIC LIMITED CO Halim Saad DaimKRETAM HOLDINGS BHD UMNO Youth, Wan Azmi Wan Hamzah DaimKUMPULAN FIMA BHD Basir Ismail DaimLAND & GENERAL BHD Wan Azmi Wan Hamzah DaimLANDMARKS BHD Samsudin Abu Hassan Daim
(Continued on next page)
Appendix Table 1Politically connected Malaysian firms
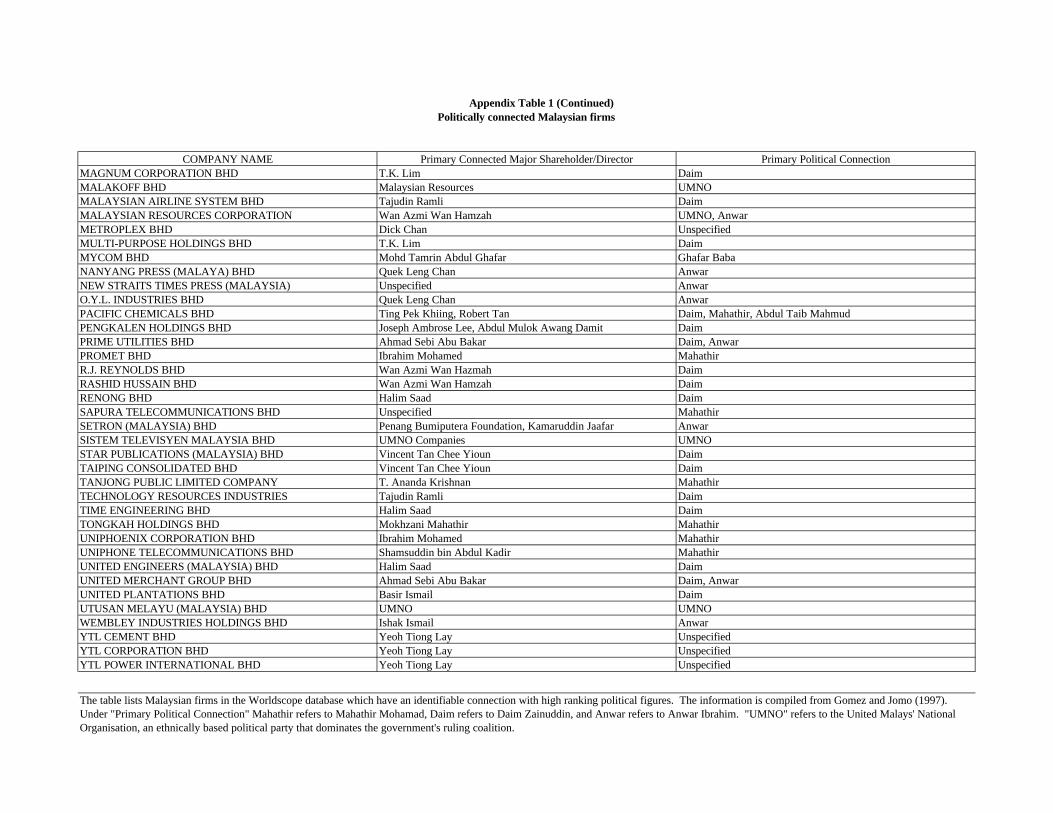
COMPANY NAME Primary Connected Major Shareholder/Director Primary Political ConnectionMAGNUM CORPORATION BHD T.K. Lim DaimMALAKOFF BHD Malaysian Resources UMNOMALAYSIAN AIRLINE SYSTEM BHD Tajudin Ramli DaimMALAYSIAN RESOURCES CORPORATION Wan Azmi Wan Hamzah UMNO, AnwarMETROPLEX BHD Dick Chan UnspecifiedMULTI-PURPOSE HOLDINGS BHD T.K. Lim DaimMYCOM BHD Mohd Tamrin Abdul Ghafar Ghafar BabaNANYANG PRESS (MALAYA) BHD Quek Leng Chan AnwarNEW STRAITS TIMES PRESS (MALAYSIA) Unspecified AnwarO.Y.L. INDUSTRIES BHD Quek Leng Chan AnwarPACIFIC CHEMICALS BHD Ting Pek Khiing, Robert Tan Daim, Mahathir, Abdul Taib MahmudPENGKALEN HOLDINGS BHD Joseph Ambrose Lee, Abdul Mulok Awang Damit DaimPRIME UTILITIES BHD Ahmad Sebi Abu Bakar Daim, AnwarPROMET BHD Ibrahim Mohamed MahathirR.J. REYNOLDS BHD Wan Azmi Wan Hazmah DaimRASHID HUSSAIN BHD Wan Azmi Wan Hamzah DaimRENONG BHD Halim Saad DaimSAPURA TELECOMMUNICATIONS BHD Unspecified MahathirSETRON (MALAYSIA) BHD Penang Bumiputera Foundation, Kamaruddin Jaafar AnwarSISTEM TELEVISYEN MALAYSIA BHD UMNO Companies UMNOSTAR PUBLICATIONS (MALAYSIA) BHD Vincent Tan Chee Yioun DaimTAIPING CONSOLIDATED BHD Vincent Tan Chee Yioun DaimTANJONG PUBLIC LIMITED COMPANY T. Ananda Krishnan MahathirTECHNOLOGY RESOURCES INDUSTRIES Tajudin Ramli DaimTIME ENGINEERING BHD Halim Saad DaimTONGKAH HOLDINGS BHD Mokhzani Mahathir MahathirUNIPHOENIX CORPORATION BHD Ibrahim Mohamed MahathirUNIPHONE TELECOMMUNICATIONS BHD Shamsuddin bin Abdul Kadir MahathirUNITED ENGINEERS (MALAYSIA) BHD Halim Saad DaimUNITED MERCHANT GROUP BHD Ahmad Sebi Abu Bakar Daim, AnwarUNITED PLANTATIONS BHD Basir Ismail DaimUTUSAN MELAYU (MALAYSIA) BHD UMNO UMNOWEMBLEY INDUSTRIES HOLDINGS BHD Ishak Ismail AnwarYTL CEMENT BHD Yeoh Tiong Lay UnspecifiedYTL CORPORATION BHD Yeoh Tiong Lay UnspecifiedYTL POWER INTERNATIONAL BHD Yeoh Tiong Lay Unspecified
Appendix Table 1 (Continued)Politically connected Malaysian firms
The table lists Malaysian firms in the Worldscope database which have an identifiable connection with high ranking political figures. The information is compiled from Gomez and Jomo (1997). Under "Primary Political Connection" Mahathir refers to Mahathir Mohamad, Daim refers to Daim Zainuddin, and Anwar refers to Anwar Ibrahim. "UMNO" refers to the United Malays' National Organisation, an ethnically based political party that dominates the government's ruling coalition.