CROATIAN TOURISM AND HOSPITALITY INDUSTRY: CURRENT …
13
Slobodan Ivanovic, Ace Milenkovski, and Vedran Milojica. 2015. Croatian Tourism and Hospitality Industry: Current State and Future Developmental prespectives. UTMS Journal of Economics 6 (2): 293–305. 293 CROATIAN TOURISM AND HOSPITALITY INDUSTRY: CURRENT STATE AND FUTURE DEVELOPMENTAL PERSPECTIVES Slobodan Ivanovic 1 Ace Milenkovski Vedran Milojica Abstract The economic crisis had a significant influence on the world economy, as well as on tourism and hospitality industry. Despite minor oscillations, European and world tourism turnover is registering a significant growth. Contemporary European tourists possess high purchasing power, as well as the tendency of undertaking travels, which is witnessed by the fact that Europe continues to be the leader in world tourism flows. As an EU member, Croatia needs to use this as a stimulation in further development of its tourism and hospitality industry. The purpose of the paper was to stress the importance of tourism development for the European and Croatian economy, while the goal of the paper was to present the state of European tourism and hospitality industry, to determine its positive trends, present the state of Croatian tourism and hospitality industry, and to propose future developmental guidelines in function of achieving competitive advantages. Keywords: Economic crisis, tourist turnover growth, Croatia, Europe, competitive advantages. Jel Classification: L83 INTRODUCTION Tourism is the most important industry in the world in terms of the numbers of employees and its effect on the social and economical development of a region or country. It is an industry that will help developing countries solve their problems of unemployment and poverty by turning the potentials of these countries-i.e. natural and cultural heritage-into a profit. It is a clean industry, which will coincide with the "green trend" of the future that aims to preserve and conserve nature for future generations. This will be the great return to nature-the "green wave" (Avelini Holjevac 2003). 1 Slobodan Ivanovic, PhD, Full Professor, University of Rijeka, Croatia; Ace Milenkovski, PhD Full Professor, University of Tourism and Management in Skopje, Macedonia; Vedran Milojica, PhD Student, University of Rijeka, Croatia. Preliminary communication (accepted October 25, 2015)
Transcript of CROATIAN TOURISM AND HOSPITALITY INDUSTRY: CURRENT …

Slobodan Ivanovic, Ace Milenkovski, and Vedran Milojica. 2015. Croatian Tourism and Hospitality Industry: Current State and Future Developmental prespectives. UTMS Journal of Economics 6 (2): 293–305.
293
CROATIAN TOURISM AND HOSPITALITY INDUSTRY: CURRENT STATE AND FUTURE DEVELOPMENTAL PERSPECTIVES
Slobodan Ivanovic1 Ace Milenkovski Vedran Milojica
Abstract The economic crisis had a significant influence on the world economy, as well as on tourism and hospitality
industry. Despite minor oscillations, European and world tourism turnover is registering a significant growth. Contemporary European tourists possess high purchasing power, as well as the tendency of undertaking travels,
which is witnessed by the fact that Europe continues to be the leader in world tourism flows. As an EU member,
Croatia needs to use this as a stimulation in further development of its tourism and hospitality industry. The purpose of the paper was to stress the importance of tourism development for the European and Croatian
economy, while the goal of the paper was to present the state of European tourism and hospitality industry, to
determine its positive trends, present the state of Croatian tourism and hospitality industry, and to propose future developmental guidelines in function of achieving competitive advantages.
Keywords: Economic crisis, tourist turnover growth, Croatia, Europe, competitive advantages.
Jel Classification: L83
INTRODUCTION
Tourism is the most important industry in the world in terms of the numbers of employees
and its effect on the social and economical development of a region or country. It is an
industry that will help developing countries solve their problems of unemployment and
poverty by turning the potentials of these countries-i.e. natural and cultural heritage-into
a profit. It is a clean industry, which will coincide with the "green trend" of the future
that aims to preserve and conserve nature for future generations. This will be the great
return to nature-the "green wave" (Avelini Holjevac 2003).
1 Slobodan Ivanovic, PhD, Full Professor, University of Rijeka, Croatia; Ace Milenkovski, PhD Full Professor,
University of Tourism and Management in Skopje, Macedonia; Vedran Milojica, PhD Student, University of Rijeka,
Croatia.
Preliminary communication (accepted October 25, 2015)

Slobodan Ivanovic, Ace Milenkovski, and Vedran Milojica. 2015. Croatian Tourism and Hospitality Industry: Current State and Future Developmental prespectives. UTMS Journal of Economics 6 (2): 293–305.
294
Today, strategic orientation of tourist companies and tourist destinations is focused
on developing relationships with potential travelers. Globalization of markets and
increased competition in international tourism is the reason why the quality of product is
becoming increasingly present category (Authors´ adaptation according to Grzinic
2014). Monitoring socio-economic trends, respectively, interpreting recorded changes in
a form of a demographic picture of the society, better education and higher life standard,
change in structure of demand for products and services is noticed. It comes to transition
from the economics of services to the economics of experiences, and more frequent
shopping for things and services is being replaced by shopping for experiences. Such
shopping represents specific exchanges of value for money which is characteristic for
traditional understanding of the economy of experience. Development of tourist products
based on the experience as a key exchange value demands an interdisciplinary approach
which, along with applied marketing activities and competitive positioning by identity
affirmation brings to positioning of the tourist offer from the point of view of economy
of experience. Contemporary tourist and hotel product which is adapted to the needs of
new tourists does not imply partner role anymore but individualization and
personalization of the experience itself (Authors´ adaptation according to Vitasovic
2014). In today’s dynamic and competitive global environment, planning and developing
tourism attractions is only half the battle faced by destination managers, considering the
fact that so many destinations globally offer similar attractions, services and experiences.
Destination managers also have to plan and strategize the marketing aspect of destination
management. A well-planned and -developed tourism product and/or destination will be
useless unless it attracts and retains its target market. Therefore, it is vital for managers
to understand what makes customers loyal to a destination and what their expectations
are so that destinations can modify their offerings, service delivery and communication
strategies to meet and exceed customers’ expectations (Gursoy et al. 2014). Tourism and
hospitality industry offers intangible products and services to its customers. For this
reason, the most crucial strategies in the industry involve how to offer better people-
oriented services and how to encourage repeat business (Authors´ adaptation according
to Yang 2012).
As the tourism and hotel industry continue to prosper in the global economy,
competition—whether it be international or domestic among members of the
industries—becomes fiercer. Possessing competitive advantages could be key to success
for those members (Tsai et al. 2009). In order to achieve success on the tourist market,
offer carriers constantly need to be up to date with the newest changes on the tourist
market, respectively, they need to monitor changes in preferences of tourists, and manage
the development of their tourist offer in order to provide them maximum satisfaction,
diversity, uniqueness. Strategic approach accompanied by continuous marketing
activities is an imperative for achieving competitiveness. Crick and Spencer (2011) point
out that hotel organization needs to understand with as much precision as possible what
the guests want from the service experience. Doing so allows them to minimize wasted
resources. Being precise becomes difficult, however, because of the heterogeneity of
customers. A number of writers have attempted to answer the very important question:
what type of service do hotel guests value the most?
The impact of European Union tourism and hospitality industry is achieving positive
effects on international tourism flows. Over the years Europe developed its tourist offer
base on numerous unique natural particularities and cultural-historical heritage and many
others. They have shown great capability in development of a competitive tourist offer

Slobodan Ivanovic, Ace Milenkovski, and Vedran Milojica. 2015. Croatian Tourism and Hospitality Industry: Current State and Future Developmental prespectives. UTMS Journal of Economics 6 (2): 293–305.
295
while upholding sustainable development principles, which also significantly contributed
to the development of numerous selective forms of tourism, whose importance is rising on
daily basis. Following, numerous investments were made in development of
accommodation capacities (hotels and similar accommodation, accommodation for short
stays for tourists who prefer to plan their itinerary on the road, etc.).
When discussing hotels, particular accent is given on hotel chains which conduct
business according to strict standards, offering tourists top quality in every aspect, and
enable them to achieve value and experience for money. This was confirmed by Whitla
et al. (2007) which point out that hotel chains need to balance the provision of a
standardized level of service and amenities with customers’ interest in some degree of
local adaptation. The feedback affirmed that guests, especially business travelers,
expected a similar range of services. Thus in-room international direct dialling (IDD),
internet services, a business center, 24-hour room service and a gymnasium, are seen as
‘minimum entry standards’ for an international business hotel.
In terms of tourist offer development and achieving competitiveness on the European
and international tourist market, all European countries are continuously undertaking
activities such as market research (to determine the newest profile and tendencies of
today’s tourists due to its change on daily basis), continuous education of high quality
tourism and hospitality professionals which are they key factor in development and
offering the best service possible (Brunner-Sperdin and Peters 2009) confirm this in their
paper stating that the strongest emphasis should be laid on human resource management,
which plays the major role in creating successful experience-oriented service
encounters), introduction of newest innovations, etc. Croatia is a European country, and
an EU member with a huge potential for development of even more competitive tourist
offer in relation to its current state. In the last ten years it registered some positive
movements in terms of its tourist offer development. However, in comparison with some
competitive European destinations, it is evident that still lots needs to be done. Bearing
this in mind, following, the authors will present current state of European and Croatian
tourism and hospitality industry, as well as propose some developmental directions for
Croatia.
1. AN INSIGHT IN THE STATE OF THE EUROPEAN TOURISM AND HOSPITALITY INDUSTRY
Oil crisis, disorders on financial markets, banking crises, currency crises, all of this is
comprised in the term «global economic crisis», which marked the end of the first decade
of the 21st century. Its consequences are reflected in stagnation and decline of economic
activity in certain countries, of employment, of GDPpc, and finally, reduction of the
share of personal consumption of the population allocated for secondary needs, such as
tourist travels. Such trends are also reflected on the number of tourist arrivals in the world
(Alkier Radnic 2014).
According to the following graph, 928 million of international tourist arrivals were
registered in 2008, while the year 2009 registered 891 million, respectively, a decrease
of 3,99% in relation to the previous year. From 2010 onwards there was a positive trend
of growth. In 2013 international tourist arrivals achieved growth of 19% in relation to
the year 2007 (Authors´ adaptation according to UNWTO Tourism Highlights 2015).

Slobodan Ivanovic, Ace Milenkovski, and Vedran Milojica. 2015. Croatian Tourism and Hospitality Industry: Current State and Future Developmental prespectives. UTMS Journal of Economics 6 (2): 293–305.
296
Figure 1. International Tourist Arrivals 2007–2013
Tourism and hospitality industry is registering a positive growth on world level. In
2014 the number of total international tourist arrivals (overnight visitors) was 1.133
million, respectively 46 million more in relation to 2013 when 1.087 million arrivals
were registered. Growth of 46 million (+4.3%) in 2014 marked the fifth consecutive year
of robust growth above the long-term average (+3.3% a year) since the financial crisis of
2009 (Authors´ adaptation according to UNWTO Tourism Highlights 2015).
Figure below indicates that Europe continues to be a leader in the world tourist flows
by participating with 51% of achieved tourist arrivals in total international arrivals,
followed by Asia and the Pacific (23%), Americas (16%), Africa (5%) and Middle East
(5%) (Authors´ adaptation according to UNWTO tourism Highlights 2015).
Figure 2. International Tourist Arrivals in 2014 by regions
The data in the following graph indicates that there was an oscillation in total tourist
overnights in the period 2005–2009. It can justifiably be assumed that the reason was the
financial crisis. From 2009 onwards Europe registers a positive growth in overnights,
with a particular accent on foreign overnights which were the highest (Authors´
adaptation according to Eurostat Statistics explained. 2015).
911
928
891
949
997
1.038
1.087
0
200
400
600
800
1.000
1.200
2007. 2008. 2009. 2010. 2011. 2012. 2013.
Axi
s Ti
tle
Europe51%
Asia and the Pacific
23%
Americas16%
Africa5%
Middle East5%
Slobodan Ivanovic, Ace Milenkovski, and Vedran Milojica. 2015. Croatian Tourism and Hospitality Industry: Current State and Future Developmental prespectives. UTMS Journal of Economics 6 (2): 293–305.
297
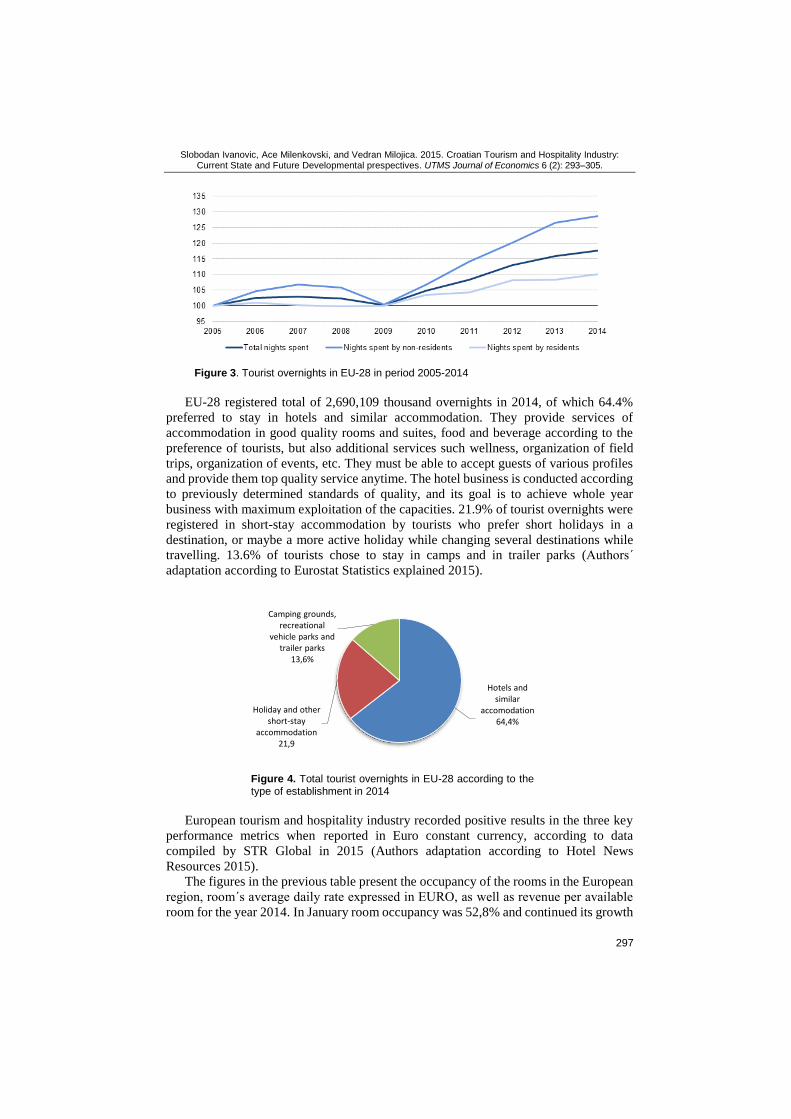
Figure 3. Tourist overnights in EU-28 in period 2005-2014
EU-28 registered total of 2,690,109 thousand overnights in 2014, of which 64.4%
preferred to stay in hotels and similar accommodation. They provide services of
accommodation in good quality rooms and suites, food and beverage according to the
preference of tourists, but also additional services such wellness, organization of field
trips, organization of events, etc. They must be able to accept guests of various profiles
and provide them top quality service anytime. The hotel business is conducted according
to previously determined standards of quality, and its goal is to achieve whole year
business with maximum exploitation of the capacities. 21.9% of tourist overnights were
registered in short-stay accommodation by tourists who prefer short holidays in a
destination, or maybe a more active holiday while changing several destinations while
travelling. 13.6% of tourists chose to stay in camps and in trailer parks (Authors´
adaptation according to Eurostat Statistics explained 2015).
Figure 4. Total tourist overnights in EU-28 according to the type of establishment in 2014
European tourism and hospitality industry recorded positive results in the three key
performance metrics when reported in Euro constant currency, according to data
compiled by STR Global in 2015 (Authors adaptation according to Hotel News
Resources 2015).
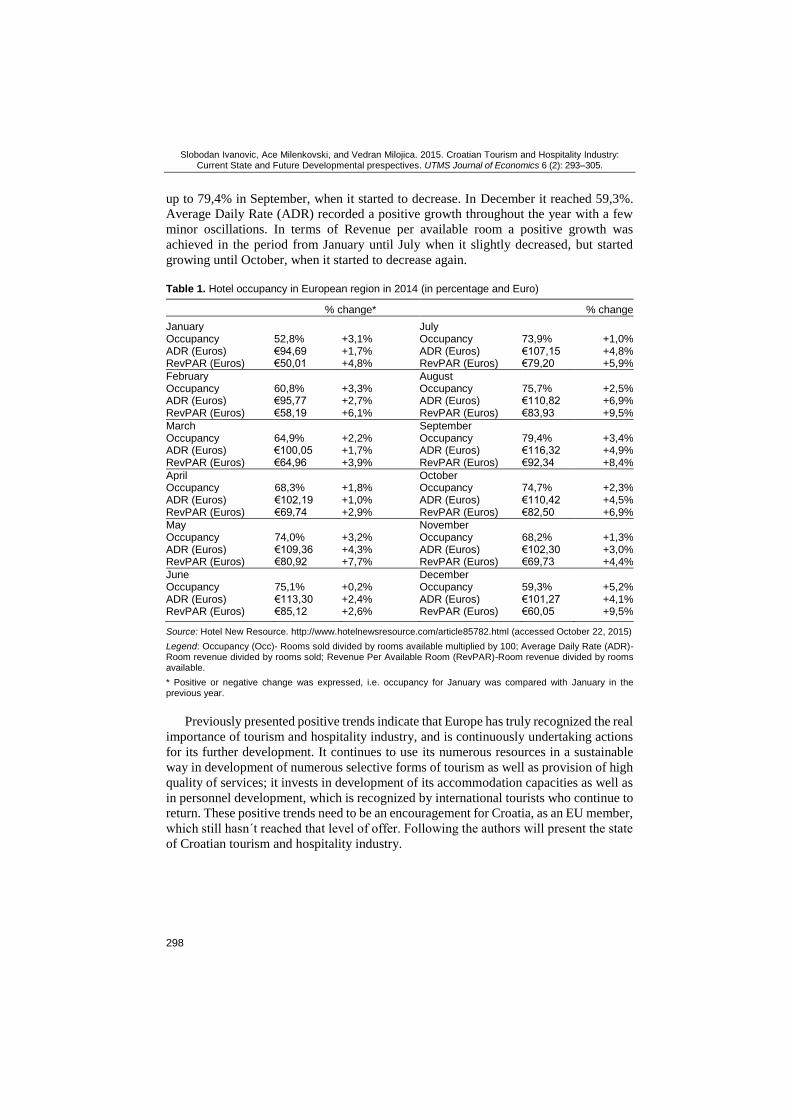
The figures in the previous table present the occupancy of the rooms in the European
region, room´s average daily rate expressed in EURO, as well as revenue per available
room for the year 2014. In January room occupancy was 52,8% and continued its growth
Hotels and similar
accomodation64,4%
Holiday and other short-stay
accommodation21,9
Camping grounds, recreational
vehicle parks and trailer parks
13,6%
Slobodan Ivanovic, Ace Milenkovski, and Vedran Milojica. 2015. Croatian Tourism and Hospitality Industry: Current State and Future Developmental prespectives. UTMS Journal of Economics 6 (2): 293–305.
298
up to 79,4% in September, when it started to decrease. In December it reached 59,3%.
Average Daily Rate (ADR) recorded a positive growth throughout the year with a few
minor oscillations. In terms of Revenue per available room a positive growth was
achieved in the period from January until July when it slightly decreased, but started
growing until October, when it started to decrease again.
Table 1. Hotel occupancy in European region in 2014 (in percentage and Euro)
% change* % change
January July Occupancy 52,8% +3,1% Occupancy 73,9% +1,0% ADR (Euros) €94,69 +1,7% ADR (Euros) €107,15 +4,8% RevPAR (Euros) €50,01 +4,8% RevPAR (Euros) €79,20 +5,9%
February August Occupancy 60,8% +3,3% Occupancy 75,7% +2,5% ADR (Euros) €95,77 +2,7% ADR (Euros) €110,82 +6,9% RevPAR (Euros) €58,19 +6,1% RevPAR (Euros) €83,93 +9,5%
March September Occupancy 64,9% +2,2% Occupancy 79,4% +3,4% ADR (Euros) €100,05 +1,7% ADR (Euros) €116,32 +4,9% RevPAR (Euros) €64,96 +3,9% RevPAR (Euros) €92,34 +8,4%
April October Occupancy 68,3% +1,8% Occupancy 74,7% +2,3% ADR (Euros) €102,19 +1,0% ADR (Euros) €110,42 +4,5% RevPAR (Euros) €69,74 +2,9% RevPAR (Euros) €82,50 +6,9%
May November Occupancy 74,0% +3,2% Occupancy 68,2% +1,3% ADR (Euros) €109,36 +4,3% ADR (Euros) €102,30 +3,0% RevPAR (Euros) €80,92 +7,7% RevPAR (Euros) €69,73 +4,4%
June December Occupancy 75,1% +0,2% Occupancy 59,3% +5,2% ADR (Euros) €113,30 +2,4% ADR (Euros) €101,27 +4,1% RevPAR (Euros) €85,12 +2,6% RevPAR (Euros) €60,05 +9,5%
Source: Hotel New Resource. http://www.hotelnewsresource.com/article85782.html (accessed October 22, 2015)
Legend: Occupancy (Occ)- Rooms sold divided by rooms available multiplied by 100; Average Daily Rate (ADR)-Room revenue divided by rooms sold; Revenue Per Available Room (RevPAR)-Room revenue divided by rooms available.
* Positive or negative change was expressed, i.e. occupancy for January was compared with January in the previous year.
Previously presented positive trends indicate that Europe has truly recognized the real
importance of tourism and hospitality industry, and is continuously undertaking actions
for its further development. It continues to use its numerous resources in a sustainable
way in development of numerous selective forms of tourism as well as provision of high
quality of services; it invests in development of its accommodation capacities as well as
in personnel development, which is recognized by international tourists who continue to
return. These positive trends need to be an encouragement for Croatia, as an EU member,
which still hasn´t reached that level of offer. Following the authors will present the state
of Croatian tourism and hospitality industry.
Slobodan Ivanovic, Ace Milenkovski, and Vedran Milojica. 2015. Croatian Tourism and Hospitality Industry: Current State and Future Developmental prespectives. UTMS Journal of Economics 6 (2): 293–305.
299
2. AN INSIGHT IN THE STATE OF CROATIAN TOURISM AND HOSPITALITY INDUSTRY
As previously mentioned in the paper, the economic crisis influenced the world and
European economy in total, as well as their tourism and hospitality industry. Croatia was
not bypassed in that period. It experienced some turbulence due to the same, but started
registering positive movements. According to the data from Croatian National Bank, in
2014 Croatia achieved 7.4 billion Euro of income from tourism, respectively, travelling,
which represents annual growth of 2.8%. Last year the share of income of travel
amounted 17.2% in GDP, which is 0.6% more than previous year (Authors´ adaptation
according to the Ministry of Tourism of the Republic of Croatia 2015). This indicates
that tourism and hospitality industry contributes significantly to the Croatian economy,
and needs to be developed in the future. In this chapter the authors will present a review
of state of Croatian Tourism and hospitality industry.
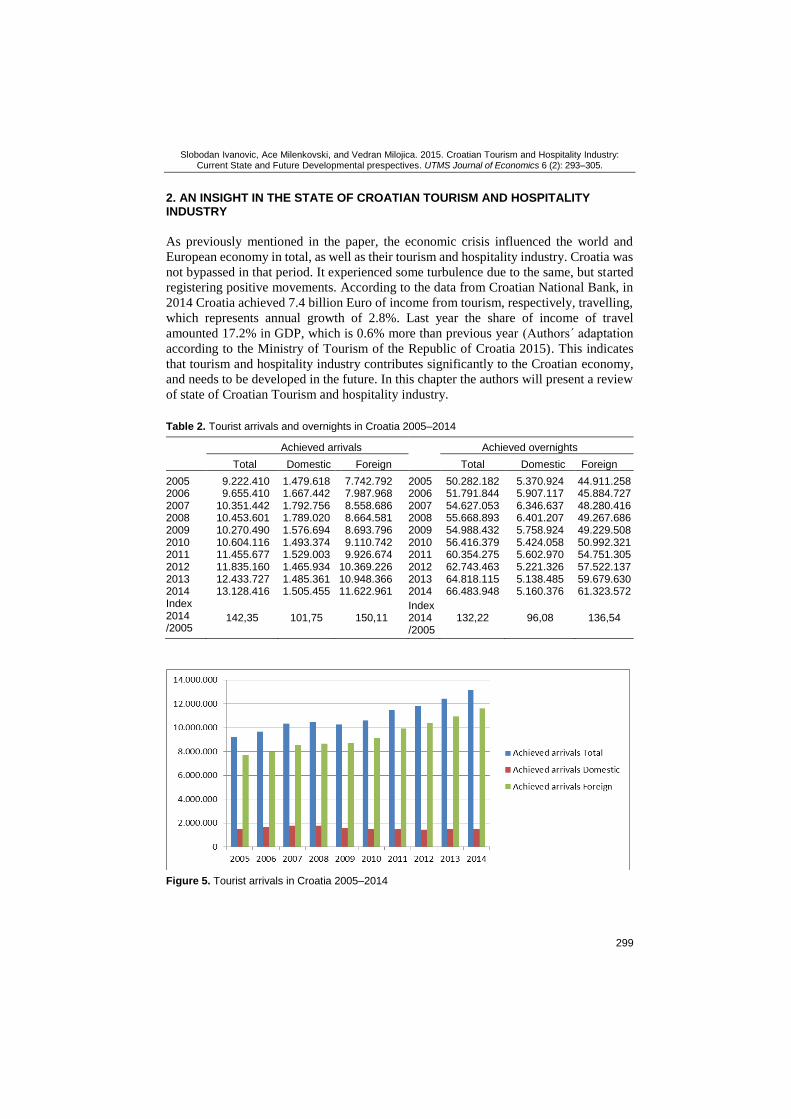
Table 2. Tourist arrivals and overnights in Croatia 2005–2014
Achieved arrivals Achieved overnights
Total Domestic Foreign Total Domestic Foreign
2005 9.222.410 1.479.618 7.742.792 2005 50.282.182 5.370.924 44.911.258 2006 9.655.410 1.667.442 7.987.968 2006 51.791.844 5.907.117 45.884.727 2007 10.351.442 1.792.756 8.558.686 2007 54.627.053 6.346.637 48.280.416 2008 10.453.601 1.789.020 8.664.581 2008 55.668.893 6.401.207 49.267.686 2009 10.270.490 1.576.694 8.693.796 2009 54.988.432 5.758.924 49.229.508 2010 10.604.116 1.493.374 9.110.742 2010 56.416.379 5.424.058 50.992.321 2011 11.455.677 1.529.003 9.926.674 2011 60.354.275 5.602.970 54.751.305 2012 11.835.160 1.465.934 10.369.226 2012 62.743.463 5.221.326 57.522.137 2013 12.433.727 1.485.361 10.948.366 2013 64.818.115 5.138.485 59.679.630 2014 13.128.416 1.505.455 11.622.961 2014 66.483.948 5.160.376 61.323.572 Index 2014 /2005
142,35 101,75 150,11 Index 2014 /2005
132,22 96,08 136,54
Figure 5. Tourist arrivals in Croatia 2005–2014
Slobodan Ivanovic, Ace Milenkovski, and Vedran Milojica. 2015. Croatian Tourism and Hospitality Industry: Current State and Future Developmental prespectives. UTMS Journal of Economics 6 (2): 293–305.
300
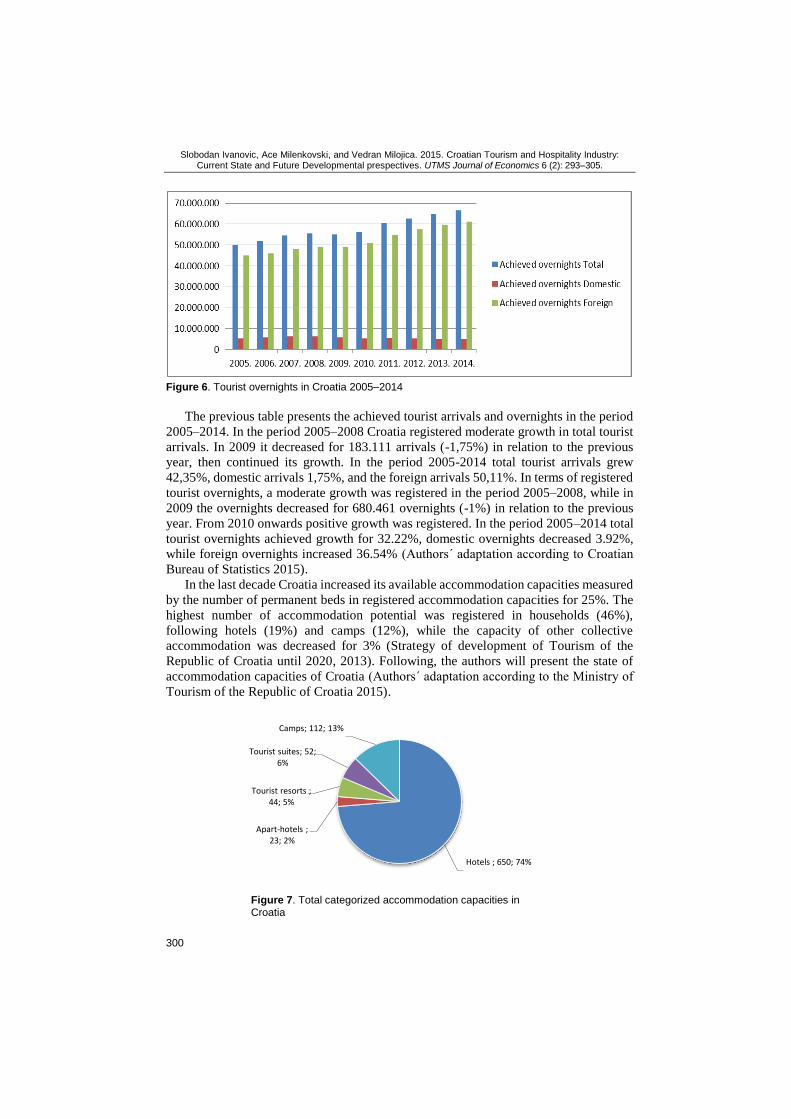
Figure 6. Tourist overnights in Croatia 2005–2014
The previous table presents the achieved tourist arrivals and overnights in the period
2005–2014. In the period 2005–2008 Croatia registered moderate growth in total tourist
arrivals. In 2009 it decreased for 183.111 arrivals (-1,75%) in relation to the previous
year, then continued its growth. In the period 2005-2014 total tourist arrivals grew
42,35%, domestic arrivals 1,75%, and the foreign arrivals 50,11%. In terms of registered
tourist overnights, a moderate growth was registered in the period 2005–2008, while in
2009 the overnights decreased for 680.461 overnights (-1%) in relation to the previous
year. From 2010 onwards positive growth was registered. In the period 2005–2014 total
tourist overnights achieved growth for 32.22%, domestic overnights decreased 3.92%,
while foreign overnights increased 36.54% (Authors´ adaptation according to Croatian
Bureau of Statistics 2015).
In the last decade Croatia increased its available accommodation capacities measured
by the number of permanent beds in registered accommodation capacities for 25%. The
highest number of accommodation potential was registered in households (46%),
following hotels (19%) and camps (12%), while the capacity of other collective
accommodation was decreased for 3% (Strategy of development of Tourism of the
Republic of Croatia until 2020, 2013). Following, the authors will present the state of
accommodation capacities of Croatia (Authors´ adaptation according to the Ministry of
Tourism of the Republic of Croatia 2015).
Figure 7. Total categorized accommodation capacities in Croatia
Hotels ; 650; 74%
Apart-hotels ; 23; 2%
Tourist resorts ; 44; 5%
Tourist suites; 52; 6%
Camps; 112; 13%
Slobodan Ivanovic, Ace Milenkovski, and Vedran Milojica. 2015. Croatian Tourism and Hospitality Industry: Current State and Future Developmental prespectives. UTMS Journal of Economics 6 (2): 293–305.
301
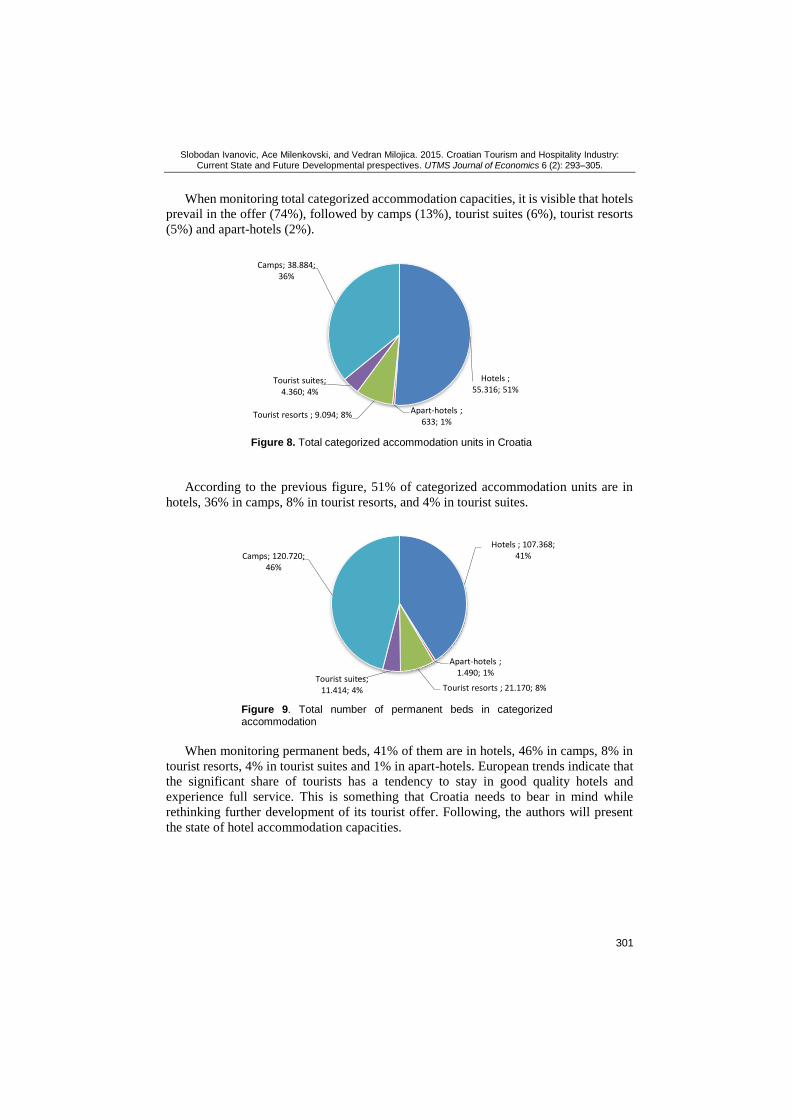
When monitoring total categorized accommodation capacities, it is visible that hotels
prevail in the offer (74%), followed by camps (13%), tourist suites (6%), tourist resorts
(5%) and apart-hotels (2%).
Figure 8. Total categorized accommodation units in Croatia
According to the previous figure, 51% of categorized accommodation units are in
hotels, 36% in camps, 8% in tourist resorts, and 4% in tourist suites.
Figure 9. Total number of permanent beds in categorized accommodation
When monitoring permanent beds, 41% of them are in hotels, 46% in camps, 8% in
tourist resorts, 4% in tourist suites and 1% in apart-hotels. European trends indicate that
the significant share of tourists has a tendency to stay in good quality hotels and
experience full service. This is something that Croatia needs to bear in mind while
rethinking further development of its tourist offer. Following, the authors will present
the state of hotel accommodation capacities.
Hotels ; 55.316; 51%
Apart-hotels ; 633; 1%
Tourist resorts ; 9.094; 8%
Tourist suites; 4.360; 4%
Camps; 38.884; 36%
Hotels ; 107.368; 41%
Apart-hotels ; 1.490; 1%
Tourist resorts ; 21.170; 8%Tourist suites;
11.414; 4%
Camps; 120.720; 46%

Slobodan Ivanovic, Ace Milenkovski, and Vedran Milojica. 2015. Croatian Tourism and Hospitality Industry: Current State and Future Developmental prespectives. UTMS Journal of Economics 6 (2): 293–305.
302
Figure 10. Hotels in Croatia according to the category
The following graph presents the total number of hotels according to the category
and the number. The majority, 313 hotels (48%) have three star category, 225 hotels
(35%) have a four star category, 79 hotels (12%) have a two star quality, while only 33
hotels (5%) have a five star category.
Figure 11. Total number of accommodation facilities according to the category of the hotel
The graph presents the total number of accommodation units according to the
category of hotels. It is visible that 22.417 of accommodation units (40%) belong to four
star hotels, 21.512 of them (39%) belong in three star hotels, 6.653 of them (12%) are in
two star hotels, and 5.034 of them (9%) are in five star hotels.
Figure 12. Total number of permanent beds according to the category of the hotel
5*; 33; 5%
4*; 225; 35%
3*; 313; 48%
2*; 79; 12%
2*; 6.653; 12%
3*; 21.512; 39%4*; 22.117; 40%
5*; 5.034; 9%
2*; 13.317; 12%
3*; 42.570; 40%
4*; 41.624; 39%
5*; 9.857; 9%
Slobodan Ivanovic, Ace Milenkovski, and Vedran Milojica. 2015. Croatian Tourism and Hospitality Industry: Current State and Future Developmental prespectives. UTMS Journal of Economics 6 (2): 293–305.
303
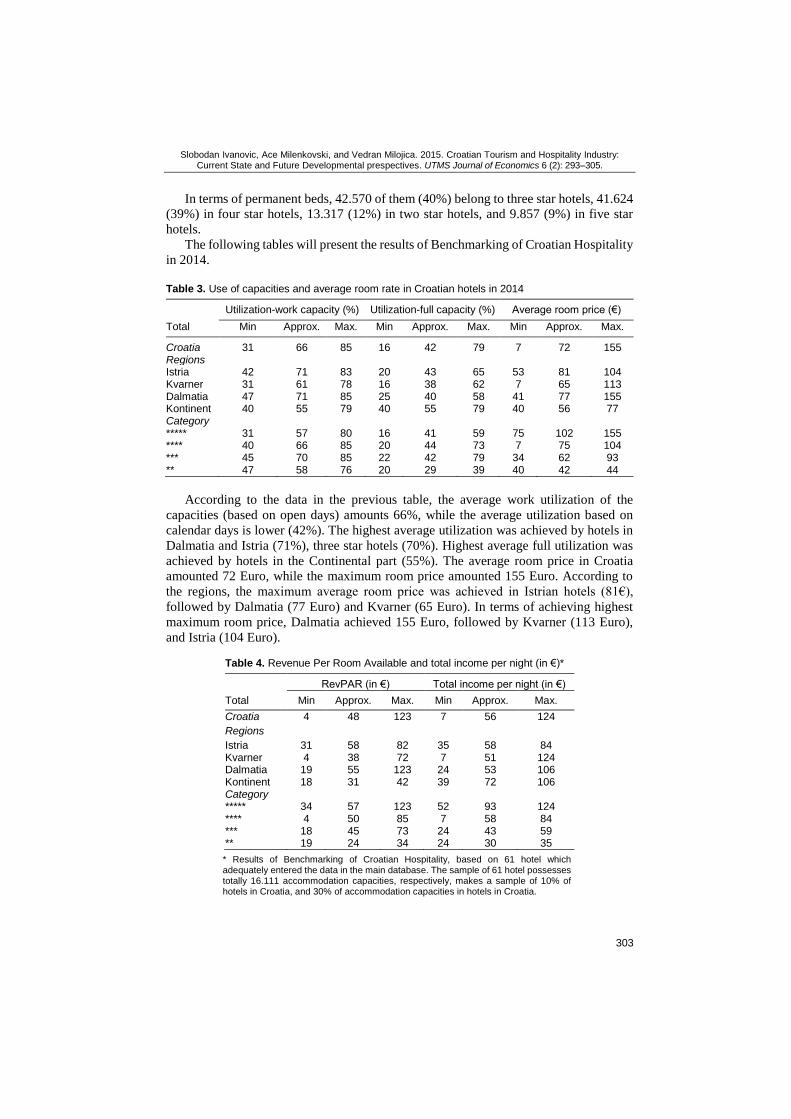
In terms of permanent beds, 42.570 of them (40%) belong to three star hotels, 41.624
(39%) in four star hotels, 13.317 (12%) in two star hotels, and 9.857 (9%) in five star
hotels.
The following tables will present the results of Benchmarking of Croatian Hospitality
in 2014.
Table 3. Use of capacities and average room rate in Croatian hotels in 2014
Utilization-work capacity (%) Utilization-full capacity (%) Average room price (€)
Total Min Approx. Max. Min Approx. Max. Min Approx. Max.
Croatia 31 66 85 16 42 79 7 72 155 Regions Istria 42 71 83 20 43 65 53 81 104 Kvarner 31 61 78 16 38 62 7 65 113 Dalmatia 47 71 85 25 40 58 41 77 155 Kontinent 40 55 79 40 55 79 40 56 77 Category ***** 31 57 80 16 41 59 75 102 155 **** 40 66 85 20 44 73 7 75 104 *** 45 70 85 22 42 79 34 62 93 ** 47 58 76 20 29 39 40 42 44
According to the data in the previous table, the average work utilization of the
capacities (based on open days) amounts 66%, while the average utilization based on
calendar days is lower (42%). The highest average utilization was achieved by hotels in
Dalmatia and Istria (71%), three star hotels (70%). Highest average full utilization was
achieved by hotels in the Continental part (55%). The average room price in Croatia
amounted 72 Euro, while the maximum room price amounted 155 Euro. According to
the regions, the maximum average room price was achieved in Istrian hotels (81€),
followed by Dalmatia (77 Euro) and Kvarner (65 Euro). In terms of achieving highest
maximum room price, Dalmatia achieved 155 Euro, followed by Kvarner (113 Euro),
and Istria (104 Euro).
Table 4. Revenue Per Room Available and total income per night (in €)*
RevPAR (in €) Total income per night (in €)
Total Min Approx. Max. Min Approx. Max.
Croatia 4 48 123 7 56 124
Regions
Istria 31 58 82 35 58 84 Kvarner 4 38 72 7 51 124 Dalmatia 19 55 123 24 53 106 Kontinent 18 31 42 39 72 106 Category ***** 34 57 123 52 93 124 **** 4 50 85 7 58 84 *** 18 45 73 24 43 59 ** 19 24 34 24 30 35
* Results of Benchmarking of Croatian Hospitality, based on 61 hotel which adequately entered the data in the main database. The sample of 61 hotel possesses totally 16.111 accommodation capacities, respectively, makes a sample of 10% of hotels in Croatia, and 30% of accommodation capacities in hotels in Croatia.

Slobodan Ivanovic, Ace Milenkovski, and Vedran Milojica. 2015. Croatian Tourism and Hospitality Industry: Current State and Future Developmental prespectives. UTMS Journal of Economics 6 (2): 293–305.
304
The data in the table indicate that average RevPAR was 48 Euro in Croatia, while the
maximum was 123 Euro. According to the regions, hotels in Istria achieved 58 Euro,
followed by Dalmatia with 55 Euro. The average income achieved per night was 56 Euro
in Croatia, while according to the regions hotels in Istria achieved 58 Euro, followed by
Dalmatia (53 Euro), and Kvarner (51 Euro). Average income per night in Croatia was 56
Euro, while according to the regions the highest average income was 72 Euro in the
Continent, followed by Istria (58 Euro), Dalmatia (53 Euro) and Kvarner (51 Euro).
3. PROPOSITION OF GUIDELINES FOR FURTHER DEVELOPMENT OF CROATIAN TOURISM AND HOSPITALITY INDUSTRY
In the previous chapter the authors have established that in the period 2005-2014 Croatia
achieved positive growth in tourist arrivals and overnights, which indicates that despite
the economic crisis, tourists still have sufficient purchasing power and the desire to
undertake holidays. This was also confirmed by presenting the results of Benchmarking
of Croatian Hospitality, which indicated solid utilization of accommodation capacities,
as well as achieving solid room prices and income per night. However, results need to
be improved and brought to a higher level according to the EU trends. In Croatian
accommodation capacities, hotels are dominating, which is positive since contemporary
trends indicate that in EU-28 64,4% of tourist overnights were achieved in them. The
lack is that the majority of them (313 or 48%) are three star category, while only 33
hotels (5%) are five star category. It is necessary to undertake further investments in
order to increase the number of five star hotels, which will undoubtedly result in
achieving higher tourist arrivals, overnights, and consumption.
In order to continue positive trend of growth in tourist turnover, and to stimulate
tourists to (re-)visit Croatia, the authors propose the following developmental guidelines:
(adapted according to Strategy of development of tourism of the Republic of Croatia
until 2020):
Market research, in order to determine the intensity and frequency of changes in
tourist´s preferences, so our tourist offer could be adapted according to them as soon
as possible;
Continuous introduction of new, diverse, and innovative elements of tourist offer;
Investments in further development of accommodation capacities (with a particular
accent on five star hotels)
Application of sustainable development principles in tourist offer development
(preservation of natural and cultural-historical resources, eco-hotels…)
Achieving higher level of recognizability on the international tourist market through
undertaking marketing activities while applying newest marketing tools, in order to
promote and brand tourist offer;
Achieving whole year business and maximum occupancy of accommodation
capacities;
Equal dispersion of the tourist offer in the whole country;
Raise the awareness of the domestic population about the importance of tourism
and hospitality development.
Previously presented will result in achieving higher level of competitiveness on the
turbulent tourist market.

Slobodan Ivanovic, Ace Milenkovski, and Vedran Milojica. 2015. Croatian Tourism and Hospitality Industry: Current State and Future Developmental prespectives. UTMS Journal of Economics 6 (2): 293–305.
305
CONCLUSION
Tourism is the most important part of Croatian economy, so it is mandatory to focus
further activities in its future development. Over the years Croatia undertook significant
activities in development of its tourist offer, which is witnessed by the growing tourist
turnover. However, in relation to European trends, limitations and shortcomings are still
present. In order to overcome them, Croatia needs to determine the best experiences and
solutions adapted and conducted by the leading European tourist destinations as well as
to implement previously presented developmental guidelines with a goal of achieving
competitive advantages and gaining the leading role on the European tourist market.
REFERENCES
Alkier Radnic, R. Economic Crisis and Recession as a Challenge for future development of tourism in Croatia
and in the European Union. In Proceedings of 20th Biennial International Congress Tourism & Hospitality Industry 2010: New Trends in Tourism and Hospitality Management. May 6-8, 2010, 683–691, Opatija,
Croatia.
Avelini Holjevac, I. 2003. A vision of tourism and the hotel industry in the 21st century. Hospitality Management 22 (2): 129–134.
Brunner-Sperdin, Alexandra, and Mike Peters. 2009. What influences Guests’ Emotions? The Case of High-
quality Hotels. International Journal of Tourism Research 11 (2): 171–183. Crick, Anne P., and Andrew Spencer, A. 2011. Hospitality quality: New directions and new challenges.
International Journal of Contemporary Hospitality Management 23 (4): 463–478.
Croatian Bureau of Statistics. 2015. www.dzs.hr (accessed: October 20, 2015). CrossBench. 2015. Benchmarking of Croatian and Slovenian Hospitality Report for the year 2014
http://www.crossbench.eu/downloads/benchmarking-izvjestaj-za-2014.pdf (accessed: October 21, 2015.)
Eurostat Statistics explained. 2015. http://ec.europa.eu/eurostat/statistics-explained/index.php/Tourism _statistics_-_annual_results_for_the_accommodation_sector (accessed: October 22, 2015)
Grzinic, Jasmina. 2014. New Trends in Croatian Hotel Industry. Contemporary Trends in Tourism. Ed. Jasmina
Grzinic, and Vanja Bevanda, 174–196. Pula: University of Josip Juraj Dobrila in Pula, Faculty of
Economics and Tourism.
Gursoy Dogan, Joseph S. Chen, and Christina G. Chi. 2014. Theoretical examination of destination loyalty
formation. International Journal of Contemporary Hospitality Management 26 (5): 809–827. Hotel New Resource. 2015. http://www.hotelnewsresource.com/article85782.html (accessed: October 22, 2015).
Ministry of Tourism of the Republic of Croatia. 2015. http://www.mint.hr/default.aspx?id=22604 (accessed:
October 21, 2015). Ministry of Tourism of the Republic of Croatia. 2015. http://www.mint.hr/UserDocsImages/130426-Strategija-
turizam-2020.pdf (accessed: October 21, 2015).
Ministry of Tourism of the Republic of Croatia. 2015. http://www.mint.hr/default.aspx?id=371 (accessed: October 21, 2015.)
UNWTO. 2015. Tourism Highlights. http://www.e-unwto.org/doi/pdf/10.18111/9789284416899 (accessed:
October 21, 2015.) Tsai, Henry, Song, Haiyan, and Wong, Kevin K.F. 2009. Tourism and Hotel Competitiveness Research.
Journal of Travel & Tourism Marketing 26 (5-6): 522-546 Vitasovic, A. 2014. Competitive positioning of Tourist offer of the Republic of Croatia. In Contemporary
trends in tourism. Ed. Jasmina Grzinic, and Vanja Bevanda, 116–153. Pula: University of Juraj Dobrila in
Pula, Faculty of Economics and Tourism. Whitla, Paul, Peter G. P. Walters, and Howard Davies. 2007. Global strategies in the international hotel
industry. Hospitality Management 26 (4): 777–792.
Yang, Jen-te. 2012. Identifying the attributes of blue ocean strategies in hospitality. International Journal of
Contemporary Hospitality Management 24 (5): 701–720.