CRITICAL SUCCESS FACTORS FOR BEHAVIOR...
62
CRITICAL SUCCESS FACTORS FOR BEHAVIOR-BASED SAFETY Final Report for Grant # 1 R01 OH03374-01/02 National Institute of Occupational Safety & Health Centers for Disease Control February 1996 – November 1998 E. Scott Geller, Ph.D. Principal Investigator, Professor, & Director Center for Applied Behavior Systems Department of Psychology Virginia Polytechnic Institute & State University Research Assistants: Thomas Boyce, M.S. Senior Research Associate Jason DePasquale, M.S. Senior Research Associate Grant Co-Coordinator Chuck Pettinger, M.S. Senior Research Associate Grant Co-Coordinator Josh Williams, M.S. Senior Research Associate Send all correspondents to: E. Scott Geller, Ph.D. Center For Applied Behavior Systems Department of Psychology Virginia Polytechnic Institute & State University Blacksburg, VA 24061-0436 (540) 231-6223, [email protected]
Transcript of CRITICAL SUCCESS FACTORS FOR BEHAVIOR...

CRITICAL SUCCESS FACTORS FOR BEHAVIOR-BASED SAFETY
Final Report for Grant # 1 R01 OH03374-01/02 National Institute of Occupational Safety & Health
Centers for Disease Control
February 1996 – November 1998
E. Scott Geller, Ph.D. Principal Investigator, Professor, & Director
Center for Applied Behavior Systems
Department of Psychology Virginia Polytechnic Institute & State University
Research Assistants:
Thomas Boyce, M.S. Senior Research Associate Jason DePasquale, M.S. Senior Research Associate Grant Co-Coordinator Chuck Pettinger, M.S. Senior Research Associate Grant Co-Coordinator Josh Williams, M.S. Senior Research Associate Send all correspondents to: E. Scott Geller, Ph.D. Center For Applied Behavior Systems Department of Psychology Virginia Polytechnic Institute & State University Blacksburg, VA 24061-0436 (540) 231-6223, [email protected]

Critical Success Factors for Behavior-Based Safety
TABLE OF CONTENTS
{ TOC \O "1-6" }
{PAGE }
SIGNIFICANT FINDINGS
Overall, the results of this research demonstrated the effectiveness of behavior-based
safety (BBS) interventions for increasing safe work behaviors and reducing injuries. Without
exception, organizations participating in our research realized an improvement in their safety
records after implementing a BBS process. Such success, however, was not always easily
achieved. This helped identify a number of factors critical to the success of an organization’s
BBS efforts.
The effectiveness of BBS was clearly demonstrated in Study 1 and Study 3. In Study 1,
we manipulated level of employee involvement during BBS training and implementation. The
strongest finding was a significant and dramatic decrease in the number of lost work days and
severity of injuries after BBS training and implementation. Lost days decreased from a mean of
10.9 per month prior to the safety process to a low of 1.5 lost days per the 18 months after BBS
was initiated. The results obtained from Study 3 provided additional support for the effectiveness
of BBS interventions. Specifically, using both specific and global feedback to target a number of
safety-related behaviors, the target organization not only increased frequencies of safe behaviors,
but it also enjoyed a drop in injury rate by more than 50% over the 18-month intervention period.
Acknowledging the power of BBS methods for increasing employee safety, the focus of
this research was to identify factors critical to BBS success. Study 1 and Study 5 demonstrated
the crucial roles of personal control, interpersonal trust, management support, and BBS training.
In Study 1, safety facilitators who were involved in making implementation decisions made more
interpersonal audits of hearing protection use, the target behavior they selected than did those
assigned their BBS procedures. For only the empowerment or choice condition, did use of
hearing protection increase significantly as a function of the observation and feedback process.

Critical Success Factors for Behavior-Based Safety
Study 5 revealed that organizations opting to make their BBS process mandatory are not
necessarily sacrificing employee perceptions of empowerment and personal control. In other
words, an organization can build choice into the BBS process that allows employees to
experience control. For example, organizations can empower employees to choose when they
perform observations, how often observations are performed, and who does the observation. In
fact, Study 5 revealed that employees in organization with a mandatory process reported
significantly higher levels of trust in management (both abilities and intentions), trust in
coworkers abilities and intentions, and satisfaction with training.
Study 5 was also informative regarding variables that increase the likelihood of employee
involvement in a BBS process. Five variables were predictive of an employee’s self-reported
involvement in a BBS process: a) perceived effectiveness of the BBS training, b) trust in
management abilities, c) whether safety performance is used in performance appraisals, d)
whether an employee received BBS training, and e) tenure with the organization. These variables
accounted for 41% of the variance in self-reported involvement in a BBS process.
Finally, the current research led to the development of a “Flow of Behavior Change”
model proposed to assist occupational safety and health professionals in designing interventions
within their unique safety environments (see Geller, 1998a). This model hypothesizes three types
of behavior, four stages of behavioral competency, and four intervention categories.
We propose there are three types of behavior: other-directed, self-directed, and automatic
behavior. Whenever people learn new behaviors, these behaviors are initially other-directed. In
other words, contingencies are externally established to director or instruct a new target
behavior. This is considered an instructional intervention. Once the newly acquired behavior is
practiced, the individual no longer requires external direction or even motivation, only peer
{PAGE }
Critical Success Factors for Behavior-Based Safety
support from supportive interventions. When individuals set their own contingencies, the
behavior then becomes self-directed (cf. Watson & Tharp, 1981, 1993?). Thus, self-directed
people use self-management interventions to guide and motivate their own behavior. After a
behavior is successfully repeated over a period of time, it may become automatic (or habitual)
where the behavior is performed without conscience thought.
We also hypothesize that individuals transition through four stages or levels of behavioral
competence (unconsciously incompetent, consciously incompetent, consciously competent, and
unconsciously competent) when moving from an at-risk habit to a safe habit. People in the
unconsciously incompetent stage are hypothesized to not be aware of the risky behavior they are
performing. If individuals are aware they are engaging in a risky behavior and continue
regardless of this knowledge, they are classified in the consciously incompetent stage. Movement
from this stage usually requires motivational intervention.
People are considered consciously competent when they willingly perform the desired
safe behavior, but they still need to consciously think about it. They are not fluent, and need a
supportive or self-management intervention to reach the fluency stage. When individuals no
longer need to consciously think about performing safe behaviors, they are considered
unconsciously competent.
The “Flow of Behavior Change” model (see Figure 1 on the next page), integrates the
four stages of competence with the four types of intervention: instructional, motivational,
supportive, and self-management. When willing learners are first acquiring new behaviors,
teachers typically rely on instructional interventions that use activator strategies (Geller, 1996;
Geller, 1998a) to move people from the unconsciously incompetent stage to the consciously
competent stage. Instructional interventions can be any antecedent event that directs
{PAGE }

Critical Success Factors for Behavior-Based Safety
{PAGE }

Critical Success Factors for Behavior-Based Safety
behavior. In industrial settings, for example, education/training sessions, training videos, or new
safety policies are often used to direct new safety-related behaviors.
Some people might understand the information given during the instructional
intervention, but they may not believe the information pertinent or the behavior worth the effort.
For example, employees take calculated risks or shortcuts to accomplish a job faster (like not
locking-out a piece of machinery). The model refers to this person as consciously incompetent.
To move individuals from conscious incompetence (meaning they know what to do but do not do
it) to conscious competence, the model illustrates the need for motivational intervention. Since
the consciously incompetent individuals know the correct behavior, an activator strategy alone
will have minimal impact (Geller et al., 1990). Using a consequence strategy along with an
activator strategy is presumed to be the intervention method of choice here (Geller, 1996;
1998b).
Once individuals are performing a desired safe behavior (because of either self- or other-
directions), supportive interventions can help people move from the consciously competent stage
to the unconsciously competent stage (i.e., a good habit). Supportive interventions mostly
involve consequence strategies that reinforce and support desired behaviors. Supportive
interventions include behavior-based recognition, interpersonal praise, and peer encouragement.
Furthermore, if a person is consciously competent and self-directed, a self-management
intervention is hypothesized to facilitate movement to a safe-habit (i.e., unconsciously
competent). This proposed “Flow of Behavior Change” model is the only occupational safety
and health model that specifies the type of intervention safety professionals or managers should
use as a function of employee’s competency level with regard to a certain safety-related
behavior.
{PAGE }
Critical Success Factors for Behavior-Based Safety
In sum, our findings provided a wealth of information relevant for the implementation of
BBS in industrial settings. The studies reported here add to both the theoretical and practical
literature in the domain of occupational health and safety. For example, researchers will find the
Flow of Behavior Change model useful in planning intervention strategies and predicting their
impact. And hopefully, this model will both direct and motivate follow-up research. Safety
consultants and practitioners can use the success factors we’ve uncovered to increase the
effectiveness of industry-based BBS process.
USEFULNESS OF FINDINGS
1) A popular perception for industrial safety professionals as well as safety consultants is that
BBS processes should be voluntary. The arguments advanced by proponents of this
perspective is that making such a process mandatory will result in resistance or even
retaliatory behaviors from employees who resent a loss in their perceptions of personal
control. Our research indicates this is not necessarily the case. Employees involved in
mandatory BBS processes reported more participation and greater levels of interpersonal
trust. In addition, these employees reported as much satisfaction with BBS as did individuals
participating in a voluntary process.
2) Effective BBS training as well as perceptions of personal control appear to be critical
variables for positive employee reaction to a BBS process. In particular, mandatory processes
that allow employees opportunities to customize their BBS process are likely to experience
more success than organizations that do not allow for employee control.
3) It is beneficial to pay attention to possible unintended side-effects of a behavior-change
intervention. For example, in Study 2, the organizational interventions targeting safety-belt
use had an unwanted side-effect on turn-signal use. Turn-signal use decreased steadily
{PAGE }

Critical Success Factors for Behavior-Based Safety
throughout the course of the study, ending at a low of 34%, 16 percentage points below the
baseline mean of 50%. These data, in concert with the modest increase in safety-belt use,
support risk compensation theory (Peltzman, 1975).
4) Study 4 documented a wide array of opinions on the topic of BBS, including a lack of
appropriate approaches toward evaluating BBS programs. This implies a need for more
attention to dissemination. Over the two years of this grant, we contributed significantly to
this need by writing several articles, books, and training manuals and presenting numerous
conference presentations, seminars and workshops. Please refer to Appendix A for a list of
professional activities that disseminated the results of this research.
5) The “Flow of Behavior Change” model developed from this research (see Figure 1 on page 4)
can be used to plan intervention strategies and predict success of existing intervention
programs.
BACKGROUND AND SIGNIFICANCE
The leading the causes of death for people under the age of 38 is not heart disease or
cancer, but something as common as injuries. Injuries kill more than 93,000 Americans and
require an estimated 478 billion dollars in total costs each year. This averages to two people dying
and over 370 people sustaining a disabling injury every 10 minutes (National Safety Council,
1998). Of the 96 million visits to the emergency room, 37% were injury related. The most
common cause for people visiting the emergency room is for accidental falls (7.7 million),
followed by motor vehicle crashes(4.4 million), and accidental cuts (3 million). Thus,
unintentional injuries represent a serious public health problem. Cost-effective community,
school, and industry-based injury prevention interventions are urgently needed to reduce injury
rates.
{PAGE }

Critical Success Factors for Behavior-Based Safety
Due to the frequency and severity of injuries, the U.S. Department of Health and Human
Services has identified injury prevention as a priority for attaining the goals outlined in Healthy
People 2000: National Health Promotion and Disease Prevention Objectives (1990). Every day,
an estimated 10,000 to 36,000 U.S. employees are injured and 14 are killed. Moreover, an
estimated 5,000 to 11,000 workers die and 2.5 to 11.3 million employees suffer non-fatal injuries
(Leigh, 1995; Miller, 1997; Nation Institute for Occupational Safety and Health, 1998; National
Safety Council, 1998; U. S. Bureau of Labor Statistics, 1997). In sum, approximately 250,000
potential productive years of life are lost annually because of premature death due to work-
related injuries (Baker et al., 1992).
According to the U. S. Bureau of Labor Statistics (1998), the highest incidence rate of
non-fatal occupational injuries and illnesses among goods-producing industries occur in
manufacturing. The 1997 incidence rate of 12 per 100 full-time employees was followed closely
by incidence rates in the wholesale and retail trades (11.9). Of the nearly two million injuries and
illnesses in 1996 resulting in lost workdays, the majority were caused from overexertion (28%)
and contacts with objects/equipment (26%). Although the overall 1997 rate of 3.7 lost days per
100 full-time employees has dropped since 1990, work-related injuries remain a problem.
SOCIAL AND ECONOMIC RAMIFICATIONS
Over and above the traumatic personal consequences experienced by employees and their
friends and families due to unexpected industrial injuries and mortalities, there are also critical
social and economic consequences to consider. Although pain and suffering caused by these
misfortunes cannot be quantified, the social and economic costs can be estimated. The overall
liability of work-related injuries in 1997 has been estimated at $128 billion (National Safety
Council, 1998). This figure is an increase from the 1989 estimate of $89 billion, and is
{PAGE }

Critical Success Factors for Behavior-Based Safety
dramatically larger than the 1985 estimate of $34.6 billion (Leigh, 1995). These costs include
lost wages, medical expenses, insurance claims, production delays, lost time of coworkers,
equipment damage, fire losses, and indirect costs (Miller, 1997; National Safety Council, 1988).
All of these estimates are staggering and indicate the cost of industrial injuries is
increasing at an alarming rate. Today it is estimated that each year employers pay approximately
$200 billion in direct costs associated with injuries both on and off the job. Occupational injuries
account for two-thirds of this total or nearly $128 billion annually. This amounts to over $28,000
per work-related injury and close to one million dollars per employee death. The majority of
these current costs are in the form of insurance premiums for workers and their families, and
workers’ compensation for days lost from work (Miller, 1997; National Safety Council, 1998). It
is also noteworthy that these estimates may be underestimating the true impact of industrial
injuries due to problems with current surveillance techniques and the fact that many injuries are
not reported (Leigh, 1995; Miller, 1997; National Committee for Injury Prevention and Control,
1989; Weddle, 1996; Wilson, 1985).
Because the manner in which employees are hurt differs so dramatically, prevention
strategies need to address a myriad of different circumstances (Geller, 1996; Heinrich, 1959;
Petersen, 1996; U. S. Bureau of Labor Statistics, 1997). Thus, critically examining and
redefining industrial safety research to improve long-term and broad-based impact has important
implications for reducing morbidity and mortality, and increasing the quality of life among
American workers. As such, relevant theories of behavior analysis and social cognitive
psychology were used in the research reported here to critically evaluate the long-term impact of
interventions designed to improve safety-related behavior.
{PAGE }

Critical Success Factors for Behavior-Based Safety
INJURY CONTROL STRATEGIES
Although the overall injury and morbidity rates in industry are high, many experts believe
techniques are available to prevent most injuries, whether acute or chronic. These techniques
include: a) instituting a drug screening program; b) developing ergonomic and engineering
strategies that decrease the probability of an employee engaging in at-risk behaviors; c)
understanding the characteristics of workers most at risk for unintentional injury; d) educating
and training employees regarding equipment, environmental hazards, and at-risk work practices;
and e) motivating safe work behaviors through behavior-based observation and feedback. We
investigated the latter in this NIOSH-funded research project. A summary of our findings is
provided below in Research Findings, with more complete documentation of each project
included in an appendix as submitted for professional publication.
Applied Behavior Analysis
Applied behavior analysis has made substantial contributions to the domain of health
promotion and injury control by researching the determinants of at-risk behaviors, directing the
development of effective behavior change interventions, and applying these interventions in a
variety of settings like behavioral medicine (Cataldo & Coates, 1986), safety performance
(Geller, 1996; Petersen, 1996), health behavior (Elder, Geller, Hovell, & Mayer, 1994), traffic
safety (Geller, 1998c), environmental protection (Geller, Winett, & Everett, 1982), child safety
(Roberts, Fanurik, & Layfield, 1987), and health psychology (Winett, King, & Altman, 1989).
Behavior-based approaches to injury control have a number of advantages over other
approaches, including: a) they can be administered without extensive professional training; b)
they can reach people in the setting where a problem occurs (e.g., community, school,
workplace); and c) leaders in various settings can be taught the behavioral techniques most likely
{PAGE }

Critical Success Factors for Behavior-Based Safety
to work under relevant circumstances (Baer, Wolf, & Risley, 1968; Daniels, 1989; Geller, 1996,
1998b; d).
In occupational safety and health the application of applied behavior analysis principles
referred to as behavior-based safety (BBS). For the past twenty years, BBS has been used
successfully in the prevention of occupational injuries (e.g., Alavosius & Sulzer-Azaroff, 1986;
Geller, Davis, & Spicer, 1983; Geller, & Hahn, 1984; Komaki, Barwick, & Scott, 1978; Reber,
& Wallin, 1983, 1984; Roberts & Geller, 1995; Smith, Anger, & Ulsan, 1978; Streff, Kalsher, &
Geller, 1993). In fact, Guastello (1993) found by systematically reviewing 53 occupational safety
and health studies since 1977, that BBS had the highest average reduction (59.6%) of injury rate.
Most of these studies, however, were simply demonstrations of techniques that had already been
effective in other settings. Researchers made little procedural comparisons to guide the
improvement of future intervention designs.
The antecedent-behavior-consequence model of applied behavior analysis has been
applied frequently and successfully over recent years to prevent injuries. Behavior analysis has a
great deal to offer the field of injury control by enhancing the understanding of the determinants
of at-risk behavior, and guiding the development of effective behavior change strategies (Elder et
al., 1994; Geller, 1988; Geller et al., 1989; Krause, Hidley, & Hodson, 1996; Petersen, 1989). For
example, scientists have demonstrated the cost-effectiveness of: a) participative education to
increase safety-belt use (Kello, Geller, Rice, & Bryant, 1988), b) incentives/rewards to increase
safety-belt use (Geller, 1984; Geller & Hahn 1984; Roberts et al., 1988), c) behavioral feedback
to increase sanitation behaviors during food preparation (Geller, Eason, Phillips, & Pierson, 1980)
and reduce driving speed (Van Houten & Nau, 1983), and d) pledge-card commitment strategies
to increase use of personal protective equipment (Streff, Kalsher, & Geller, 1993).
{PAGE }

Critical Success Factors for Behavior-Based Safety
Behavior-based approaches to safety focus on systematically studying the effects of
various interventions by first defining the target behavior in a directly observable and recordable
way. The behavior is then observed and recorded in its natural setting. When a stable baseline
measure of the frequency, duration, or rate of behavior is obtained, an intervention is
implemented to change the behavior in beneficial directions. This intervention typically involves
changing the salience of the antecedents and/or consequences of specified target behavior(s). To
determine intervention effectiveness, the frequency, duration, or rate of the target behavior is
recorded during and/or after the intervention and compared to baseline measures of behavior
(Daniels, 1989; Geller, 1996, 1998b). Changes in the desired direction indicate acquisition of the
target behaviors.
Behavioral Feedback
One of the primary tools used to influence behavior in a BBS process is observation and
feedback. Feedback can be based on individual or group performance. It can be given publicly or
privately, and it is often combined with an education or training program (e.g., Zohar, Cohen, &
Azar, 1980). The behavior change literature has shown consistent benefits of posting or
communicating information regarding at-risk behaviors for individuals, groups, and entire
communities.
Van Houten and his colleagues (Van Houten & Nau, 1983; Van Houten, Nau, & Marini,
1980) found decreased speeding following the road display of daily percentages of drivers
exceeding the posted speed limit. Similarly, Jonah (1989) and Geller (1996) reported significant
increases in safety-belt use following the use of roadway signs to post “percentage of drivers
wearing safety belts yesterday.” More recently, Ludwig and Geller (1997) used behavior-based
feedback in conjunction with goal-setting to increase complete stopping at intersections by the
{PAGE }

Critical Success Factors for Behavior-Based Safety
pizza deliverers at two separate pizza stores. Although it is generally agreed that feedback is a
viable method for improving individual as well as group performance, there remains some
controversy regarding the form feedback should take. Specifically, while some argue feedback is
most effective when presented in a global fashion (Bandura, 1986, 1997), others maintain
feedback needs to be behaviorally specific for optimal effectiveness (Frederiksen, Richter,
Johnson, & Solomon 1982).
Those who claim feedback is most effective as a global score presume such a
presentation will result in feedback receivers being more cognizant of all potential behaviors
being targeted. Due to this generalized awareness, they will adjust all behaviors, and demonstrate
greater and longer-lasting improvement (Baer, Wolf, & Risley, 1968, 1987; Boyce & Geller,
1998). In contrast, individuals supportive of specific feedback maintain that individuals cannot
improve their performance unless they are aware of exactly what is being observed (Frederiksen
et al., 1982). Our NIOSH-funded research addressed the global versus specific feedback question
by comparing the relative effects of both in an industrial setting (see Study 3 and Appendix E).
Intrinsic versus Extrinsic Motivation
All complex organizations incorporate some form of external control or accountability
system (Dose & Klimoski, 1995). Some investigators (e.g., Deci & Ryan, 1987; Kohn, 1993;
Lepper, Greene, & Nisbett, 1973) have reported that external control of behavior through either
punishment or reinforcement will undermine an individual’s natural desire (sense of
responsibility) to engage in a particular behavior. These researchers claim individuals will react
against contingencies they perceive as controlling. For example, when people are paid to engage
in a particular behavior, they justify their behavior by focusing on the reward they received for
{PAGE }

Critical Success Factors for Behavior-Based Safety
engaging in that behavior and not on some internal desire (or responsibility) to make the
response.
According to the social psychological principles of discounting and cognitive dissonance
(Festinger, 1957), individuals will perceive the target behavior as being less attractive because of
the external controlling contingencies, especially if the accountability requirements are perceived
as self-serving on the part of management (Dose & Klimoski, 1995). Thus, once the
contingencies have been withdrawn, individuals are less likely to engage in the previously
reinforced behavior. Perceptions of choice within a safety process could prevent the undermining
of intrinsic motivation and thus enhance the probability of behaviors necessary to maintain a
safety intervention program.
Because the behaviors needed to sustain a safety process are often inconvenient and
uncomfortable, they may require support by some type of extrinsic (or external) intervention. The
key is to provide enough external control to support the safety process, but not too much to
undermine the internal desire to maintain a safe work culture. This can be accomplished by
carefully structuring outcome expectations through role clarification and task specification (Dose
& Klimoski, 1995). Such strategies could include participative or mandated goal-setting (Ludwig
& Geller, 1997), commitment strategies (Geller & Lehman, 1991; Streff, Kalsher, & Geller,
1993), or consequence procedures, including both reward and punishment techniques.
In a comprehensive review of 28 employer-based programs to motivate safety-belt use,
Geller, Rudd, Kalsher, Streff, and Lehman (1987) found reward strategies to be more effective
than punishment strategies, and more effective than commitment strategies in the short term.
However, commitment strategies were most effective at maintaining long-term behavior change.
Thus, it could be speculated that these interventions facilitated workers’ sense of responsibility
{PAGE }

Critical Success Factors for Behavior-Based Safety
toward the safety process by enhancing personal control and outcome expectancies through self-
management.
The research we have performed over the past two years has allowed us to make some
comparisons between organizations that mandate some level of performance in their BBS
processes versus organizations that rely solely on voluntary participation. As such we have been
able to investigate various interpersonal and behavioral consequences associated with both
approaches. In addition, our findings have practical implications for individuals or groups
planning to implement an industry-based BBS process.
SPECIFIC AIMS OF THE FUNDED RESEARCH
Our specific aims were prompted by our review of the literature summarized above, and
have both practical and theoretical ramifications. From a practical perspective, we proposed to: a)
develop flexible procedures for implementing an employee-driven BBS process to reduce at-risk
work behaviors and increase safe work practices; b) derive guidelines to increase employee
involvement in a long-term BBS process; c) demonstrate both short and long-term effects of a
BBS process on work practices, attitudes, person states, and injuries; d) study indirect behavioral
effects of a behavioral observation and feedback process (i.e., determine whether targeting certain
work behaviors for an intervention process will influence other safety-related behaviors); and e)
determine the extent to which line workers can implement an objective and reliable behavior-
monitoring process as an integral aspect of their job assignments.
From a theoretical perspective, we proposed to a) compare hypotheses derived from basic
learning theory (i.e., response generalization) with those from danger compensation or risk
homeostasis theory; b) study the role of certain individual factors (i.e., self-esteem, self-efficacy,
personal control, optimism, and belongingness) derived from personality/social theory as
{PAGE }

Critical Success Factors for Behavior-Based Safety
predictors of involvement in a safety process, and as person states hypothesized to change as a
function of involvement in an intervention process; c) compare the validity of intrinsic motivation
theory (from cognitive science) versus extrinsic contingencies (from behavioral science) as
foundations for a long-term intervention process; and d) develop the construct of empowerment
as a feeling state of individuals which is potentially increased by perceptions or expectancies of
self-efficacy, personal control, and optimism. Consequently, the overarching purpose of the
proposed research was not only to develop a set of guidelines for designing a practical long-term
intervention process to reduce the risk of unintentional injury in the workplace, but also to
develop theory and principles for maximizing the cost effectiveness, ecological validity, and
potential for organizational institutionalization of injury prevention countermeasures.
The results documented here demonstrate we have accomplished most of our specific
aims. In addition, we have been able to disseminate much of our findings through presentations,
workshops, and professional publications. A list of our professional activities related to this
NIOSH-funded research is included in Appendix A.
Unfortunately, due to circumstances beyond our control, we were unable to answer some
of our research questions. Specifically, a large portion of our survey data was destroyed by the
organization responsible for scanning them. In other words, we got employees from 16
organizations to compete a variety of individual difference questionnaires but this data could not
be analyzed because of another organizations disastrous error. A letter from this organization
explaining the unfortunate destruction of our data can be found in Appendix B.
RESEARCH FINDINGS
A more detailed report for each of the studies described in this section can be found in the
Appendices as the research was documented for professional dissemination.
{PAGE }

Critical Success Factors for Behavior-Based Safety
STUDY 1: THE POWER OF CHOICE: OPTIMIZING INVOLVEMENT IN A BBS PROCESS
See Appendix C for a complete report as submitted for publication in Journal of Safety
Research.
The literature has demonstrated straightforward and unmistakable benefits of a BBS
approach to reducing injuries in industry (cf. Guastello, 1993). Most of these studies, however,
were simply demonstrations of techniques that had already been effective in other settings. No
significant procedural comparisons were made to guide the improvement of future intervention
designs. Research in the area of BBS needs to ask and answer questions regarding the design of
more effective and longer-term intervention processes (NIOSH, 1998). This was the prime
purpose of Study 1. Specifically, we evaluated the extent that employee involvement increases
the impact of a BBS process. We predicted that involving employees in BBS safety training and
implementation planning would lead to more beneficial impact of the training and greater
participation during the implementation of a BBS process.
Method
Subjects and Setting
Subjects were 476 hourly and salary employees at an engine bearing manufacturing plant
in southwest Virginia. The population of employees ranged in age from 19 to 63 years (M = 42),
and employee tenure at the facility ranged from six months to more than 25 years (M = 16). The
proportion of hourly to salary workers was approximately five to one, and the workforce and
hours worked were stable throughout the course of the study.
Procedure
The BBS process began by training volunteer safety facilitators from representative work
areas on first shift (n=8) and second shift (n=6) in the basic principles and procedures of this
{PAGE }

Critical Success Factors for Behavior-Based Safety
approach. Topics included: a) defining target behaviors, b) developing checklists to record
occurrences of target behaviors, c) designing interventions to improve safety-related behaviors,
d) charting progress in a time-series, and e) giving effective behavioral feedback. Following two
intensive eight-hour education/training sessions for the safety facilitators, the remaining
employees across three shifts received a four-hour version of BBS education/training.
Education/Training Manipulation
The format and style of the education/training sessions were manipulated to investigate
the impact of employee participation during BBS training. The materials for all sessions,
however, were held constant. Four research associates, experienced at conducting safety
seminars, presented the sessions in randomized pairs. The material covered in plant-wide training
paralleled that provided to the safety facilitators, but in abbreviated form.
Choice Condition
Throughout the course of the two eight-hour safety facilitator and four-hour plant-wide
education/training sessions, the safety trainers in the Choice condition asked questions of
participants, requested relevant stories, and facilitated discussions and interpersonal involvement
with group exercises (n=230 on Shift 1). All sessions were held during the regular shift of the
scheduled employees, and concluded with a written test of key safety concepts, principles, and
procedures.
Assigned Condition
The training sessions were identical to the Choice sessions in every way except for the
following manipulated exception. The trainers in the Assigned condition presented the safety
material in a lecture format without asking questions or facilitating participant input (n=246 on
Shifts 2 and 3).
{PAGE }

Critical Success Factors for Behavior-Based Safety
These four-hour training sessions were conducted for 12 Choice groups and 14 Assigned
groups, ranging in size from 7 to 30 individuals (M = 19). To assess the impact of the two
training approaches, three variables were measured: the amount of verbal participation,
participants’ reported satisfaction with the training, and the participants’ retention of key
information presented.
Evaluation Procedures
To assess the impact of the two training approaches, three variables were measured: the
amount of verbal participation, participants’ reported satisfaction with the training, and the
participants’ retention of key information presented. To assess verbal participation, trained
research assistants attended all sessions across both conditions and independently recorded the
frequency of all verbal behaviors from the employees directed to the trainers. The verbal
behaviors included questions asked, sentence questions answered, and reactive statements. These
observations were recorded unobtrusively on a data collection sheet attached to a notebook,
giving the impression the observers were taking notes. Questions or comments which were not
relevant to the training material or directed to individuals other than the trainer presenting
information were not recorded. Interobserver agreement was assessed on a session-by-session
basis by dividing the number agreements by number of agreements plus disagreements and
multiplying that calculation by 100. Over all education/training sessions, the research assistants
agreed on over 90% of their observations. Following the education/training sessions, employees
received a questionnaire assessing their satisfaction, perceptions of participation, and knowledge
retention. The names of the participants did not appear on any test document or session
evaluation.
{PAGE }
Critical Success Factors for Behavior-Based Safety
BBS Implementation
Several involvement manipulations were made to give Shift 1 facilitators (n=8) various
opportunities to make key decisions in their BBS process. Specifically, during separate Shift 1
safety meetings, Shift 1 safety facilitators selected: a) the initial safety-related behavior (hearing
protection) to be observed plant-wide, b) the design of the checklist used to make the
observations of the target behavior, c) the schedule for behavioral observations by facilitator, d)
the target number of behavioral observations per week, e) the design and location of group
feedback charts displaying on-going measures of plant-wide hearing protection use, f) the
protocol for safety slogan contest, and g) the design and color of safety shirts offered plant-wide.
The choices made by Shift 1 safety facilitators were yoked to Shift 2 safety facilitators (n=6), in
that both shifts implemented the same process customized by Shift 1.
For nine weeks the safety facilitators of the Shift 1 workers (n=230) and Shift 2 workers
(n=210) made behavioral observations on hearing protection. These data were graphed and
posted on a safety bulletin board located at the highly traveled entrance to the production areas.
Facilitator involvement was assessed by the number of observations taken on each shift.
Behavioral observations were made on behavioral checklists designed by the Shift 1
facilitators and distributed to Shift 2 facilitators. On each shift, one facilitator was responsible
for collecting completed observation cards. These data were collected two times a month at
facilitator meetings scheduled and led by either the first or third author.
Results
Participation in Training
Analysis of variance (ANOVA) was used to evaluate differences in the mean number of
verbal responses per shift, with Shift 1 in the Choice condition and Shifts 2 and 3 receiving the
{PAGE }

Critical Success Factors for Behavior-Based Safety
Assigned condition. A one-way analysis of variance (ANOVA) on verbal behaviors for training
format (Choice vs. Assigned) indicated that participants in the Choice condition exhibited
significantly more verbal behaviors than participants in the Assigned condition, F (2, 395) =
38.9, p < .001.
Analyses were also conducted on each type of verbal response: questions answered,
reactive statements, and questions asked. A one-way ANOVA of questions answered per Shift
(Shift 1 vs. Shift 2 vs. Shift 3) indicated that participants in the Choice condition answered
significantly more questions than participants in the Assigned condition, F (2, 395)= 40.6, p <
.001. A one-way ANOVA of reactive comments per Shift (Shift 1 vs. Shift 2 vs. Shift 3)
indicated that participants in the Choice condition made significantly more comments than
participants in the Assigned condition, F (2, 395) = 19.1, p < .001. A one-way ANOVA of
questions asked per Shift (Shift 1 vs. Shift 2 vs. Shift 3) indicated no significant difference in the
average number of questions asked by participants in the Choice and Assigned conditions, p >
.05.
The post-session questionnaires included: a) an 18-item knowledge test, b) a 5-item
measure of perceived involvement, and c) a one-item measure of satisfaction with the training.
One-way ANOVAs by Shift (Shift 1 vs. Shift 2 vs. Shift 3) indicated no significant differences
between the knowledge scores of participants in the Choice and Assigned groups, nor the
participants’ perceptions of involvement, p > .05. The ANOVA of participants’ self-reported
satisfaction with the training process revealed that participants in the Choice condition (i.e., Shift
1) were more satisfied with the training process than Shift 3 participants in the Assigned
condition, F (2, 438) = 5.04, p < .05. However, the satisfaction rating of Shift 2 participants in
{PAGE }

Critical Success Factors for Behavior-Based Safety
the Assigned condition was not significantly different from the Shift 1 participants in the Choice
condition, p > .05.
Behavioral Observations
Over a nine-week observation and feedback period, Shift 1 facilitators (n = 8) made
significantly more observations per week than Shift 2 facilitators (n = 6), t (16) = 3.05, p < .05.
An observation was defined as the single occurrence of recording hearing protection as safe
versus at-risk on a critical behavior checklist. Finally, Shift 1 facilitators conducted significantly
more observations per person each week than the Shift 2 facilitators, t (16) = 3.05, p < .05.
Effects on Lost Workdays
Figure 2 depicts a cumulative record of this organization’s lost workdays for 18 months
prior to (n=197) and 18 months following (n=26) the BBS process. The figure shows a marked
decrease in lost days due to injuries following the introduction of BBS education/training,
observation/feedback for
hearing protection, and
several additional
intervention processes. A
mean of 10.9 lost days per
month occurred prior to
BB safety; whereas after
the intervention, a mean
of 1.5 days were lost per
month due to injury.
0
40
80
120
160
200
240
Dec-95
March
May July
Septem
ber
Novem
ber
Dec-96
March
May July
Septem
ber
Novem
ber
Dec-97
March
May July
Septem
ber
Novem
berC
onse
cutiv
e Lo
st W
ork
Day
s D
ue to
Inju
ry F
rom
'95-
'97
Behavior-Based Training Begins
197 Lost Work Days Due to Injury ( 0.9 / month)- 18 Months Prior to BB Training
26 Lost Work Days Due to Injury ( 1.4 / month ) - 18 Months Following BB Trainingz
Figure 2: Cumulative Lost Work Days Due to Injury ’95-‘97
{PAGE }
Critical Success Factors for Behavior-Based Safety
Discussion
Our manipulation of involvement was successful during the education/training sessions
by getting a significantly greater number of employees to answer questions, make comments,
and ask questions. However, results did not support the hypothesis that participative training
would be more effective and appreciated than nonparticipative training. The lack of significant
differences between conditions regarding information retention, satisfaction, and involvement
suggest that: a) group participation may not be directly measurable by verbal behavior alone, b)
the nature of the training material itself may have involved the workers regardless of their verbal
responses, or c) Choice training simply may not be more effective than Assigned training in
terms of information retention and personal satisfaction.
Our results and literature review do suggest, however, it is advantageous to facilitate
employee ownership of the BBS process. This was evident in the current research by the impact
the Choice condition had on employee observations of the targeted safety-related behavior.
Although facilitators in the Choice condition did not report feeling more involved, nor
demonstrated greater knowledge of the training material presented, they did make significantly
more behavioral observations. Thus, the benefit of the involvement manipulation was manifested
during the implementation of a BBS process.
This study manipulated level of employee involvement during BBS education/training
and identified at least one factor that may increase the impact of a BBS process. Specifically,
when employees are given the opportunity to make key choices in the development and
implementation of the safety process, they will contribute more to the process. This would be
predicted by the social psychological principle of consistency (Cialdini, 1993).
{PAGE }

Critical Success Factors for Behavior-Based Safety
The reduction in lost-time injuries plantwide strongly suggests the BBS process did much
more than increase the use of hearing protection. The plantwide safety training and the regular
meetings to discuss the ear protection data probably increased awareness of general safety
concerns throughout the facility. The BBS interventions certainly gave the employees the
impression that management has increased the priority level of safety. Perceptions of
management support, combined with success at performing behavioral observations, may have
increased employees’ general efficacy regarding safety performance.
Thus, consistent with Bandura (1997), as the workers experienced success making
observations on a single target behavior, they stretched the boundaries of their behavioral
routines and incorporated the BBS principles beyond simply using hearing protection.
Specifically, after the plant-wide safety education/training and the increased focus on using
hearing protection, the safety facilitators implemented several other BBS interventions. For
example, all employees participated in a plant-wide safety slogan contest with the winning
slogan (“Bearings in Mind: Safety First!”) being awarded a $50 gift certificate in a public
celebration. The employees printed the slogan on a 3-foot by 8-foot banner and displayed it at
the entrance to the manufacturing areas.
In addition to the slogan contest, employees on both Shifts 1 and 2 performed distinct
interventions in their work areas targeting a behavior they considered critical for improving their
safety. With each intervention, the work area met to define the target behavior, develop
observation checklists and procedures, and decide how to intervene and test the intervention for
impact. This BBS continuous improvement process was a critical aspect of the plant-wide
education/training referred to as the DO IT process (i.e., define, observe, intervene, and test,
Geller, 1996).
{PAGE }
Critical Success Factors for Behavior-Based Safety
Finally, as a result of the education/training process, plant-wide interventions were
implemented to increase safety-belt use. These interventions included written prompts, assigned
goals, safety-belt use feedback, promise-card commitments, and incentives to buckle-up.
Regardless of intervention strategy, all safety-belt promotions were built around the theme of
“Safety is Not Only for the Workplace,” a slogan that grew out of the BBS education/training.
The safety-belt intervention materials were highly visible, and may have served as additional
reminders of the organization’s increased commitment to safety.
It is suggested that many occupational injuries go unreported (Leigh, 1995; Miller, 1997;
Weddle, 1996; Wilson, 1985). Therefore, using a safety metric that is difficult to hide or cover
up, such as lost-time injuries, may provide a better picture of the impact of a safety process. As
such, in the current study there was a dramatic decrease in lost workdays (197 to 26) due to
injury following the introduction of BBS. Additionally, the great reduction in lost workdays was
reported by the organization to save approximately $200,000 in workman’s compensation. This
figure speaks to the impact on the plant’s bottom line of the BBS education/training, subsequent
observation and feedback strategies, and employee-driven BB interventions.
The most successful safety processes motivate “employees themselves to apply the
techniques throughout their workplace” and thus effective procedures and support systems may
vary dramatically across cultures (Geller, 1996, p. 31). This study provides some support for
giving employees involvement (i.e., Choice condition) during the design and implementation of
a BBS process as opposed to traditional top-down safety approaches (i.e., Assigned condition).
Results also support the efficacy of the BBS approach to reducing workplace injuries, and
demonstrates the potential benefits for companies to incorporate involvement strategies in their
{PAGE }

Critical Success Factors for Behavior-Based Safety
BBS processes to increase employee participation, institutionalize BB safety, and make a
difference in the safety of their employees.
STUDY 2: INCREASING SAFETY-BELT USE IN AN INDUSTRIAL SETTING
(see Appendix D for a compete report as currently under review for publication in Journal of
Organizational Behavior Management)
The use of shoulder and lap belts is the single most protective behavior that can be
conveniently taken to reduce the risk of death or injury in a vehicle crash. It is estimated that
vehicle safety belts saved 10,414 lives in 1996 and 90,425 lives since 1975 (National Highway
Traffic Safety Administration, 1998). It is predicted that a one percent increase in safety-belt use
nationwide would save 200 lives per year (Sleet, 1987), and an increase in nationwide belt use
from the current level of 68% to 90% will save 1,500 lives in 1999 (Nichols, 1998). Thus,
increasing the use of vehicle safety belts could also save some of the $54.8 million spent
annually by employers for on- and off-the-job vehicle crashes.
Intervention Effectiveness
Multiple Intervention Levels
Over two decades of behavior change research at corporate and community sites led to
the development of the multiple intervention level (MIL) hierarchy depicted in Figure 3. This
model is used to categorize behavior change approaches and evaluate the cost-effectiveness of
successive intervention strategies to alter the behavioral patterns of large numbers of individuals
(Geller, 1998a, c; Geller et al., 1990).
----------------------------
Insert Figure 3 about here
----------------------------
{PAGE }

Critical Success Factors for Behavior-Based Safety
A MIL approach to public health has critical implications for evaluating the cost-
effectiveness of a behavior-based safety program. According to the MIL, antecedent strategies
such as education, training, written prompts, and assigned goals are lower level interventions
reaching a maximum number of people. Laws, policies or mandates which threaten a
consequence are more intrusive and therefore are higher level interventions. Behavioral goal-
setting and feedback as well as incentive/reward programs are considered at the same level as
disincentive/penalty programs. This research teseted the utility of the MIL as a heuristic to
understand behavior change by sytematically implementing a series of interventions over the
course of two years to increase safety-belt use among industry workers.
Method
Subjects and setting
Subjects were 556 hourly and salary employees at an engine bearing manufacturing plant
in southwest Virginia. The population of employees ranged in age from 19 to 63 years, and
employee tenure at the facility ranged from six months to more than 25 years. The proportion of
hourly to salary workers was approximately five to one.
Data collection
Throughout the regular work week, trained research assistants sat in two distinct parking
lots of the facility during the first shift arrival, second shift arrival/first shift departure times for
hourly workers, and at the arrival and departure times for salary employees. Observers collected
data on driver safety-belt and turn-signal use. To assess inter-observer reliability, a second
independent observer collected data with the primary observer on 30 percent of all observation
sessions. As it was impossible to record data on every vehicle entering or leaving the parking
lots, the primary observer identified vehicles to observe by calling out the make and color of the
{PAGE }

Critical Success Factors for Behavior-Based Safety
vehicle to be observed (e.g., the red pick-up) as it passed an obvious stationary landmark.
Interobserver reliability exceeded 90% for both safety-belt and turn-signal use.
Intervention Techniques
After four weeks of baseline observations, a series of progressively more invasive
interventions was implemented at the facility over a two-year period. The interventions were as
described below and occurred in the order listed.
Written Prompt.
Attached to the paychecks of all wage employees was a flyer displaying the logo of the
industry and a message selected by a safety steering committee of wage workers which read:
“We Buckle-Up Because Safety is Not Only for the Workplace.” Three weeks later the flyer was
attached to the paychecks of all salary employees. After ten weeks of individual prompts, the
same message was displayed plantwide on table tents in the workers’ cafeteria, in bathrooms
above hand dryers, and on doors located in strategic places throughout the plant. Damaged and
missing flyers were replaced throughout the plantwide Prompt condition. The total duration of
the written prompt intervention period was approximately 16 weeks.
Safety Slogan and Celebration
A celebration announcing the winner of a plantwide safety slogan contest was scheduled
near the Christmas Holidays. This celebration consisted of rewarding the winner with a $50 gift
certificate to a store of his or her choice. At this event, Vince and Larry (the famous “Crash Test
Dummies”) made an appearance to distribute posters featuring two prominent Virginia Tech
football players encouraging safety-belt use. To increase involvement, the celebration occurred
after the first workshift and before the second workshift, and included refreshments and
photograph sessions with the dummies. The winning slogan (“Bearings in Mind, Safety First!”)
{PAGE }

Critical Success Factors for Behavior-Based Safety
was printed on a 3 foot by 8 foot banner and displayed for eight weeks above the main exit from
the plant floor.
Assigned Goal
After the Slogan and Celebration intervention and a six-week Withdrawal period, a
specific, difficult but attainable goal for plantwide safety-belt use was set. Flyers displaying the
plant logo, winning safety slogan, and the goal of 80% safety-belt use were posted on table tents
in the cafeteria, in bathrooms above hand dryers, and on doors located in strategic places
throughout the plant. These flyers were inspected weekly by research assistants and the plant
safety manager for damage and loss. Damaged and missing flyers were replaced throughout this
intervention phase. The goal was set approximately 25% above the current percentage of belt
use.
Goal Plus Feedback
Sixteen weeks after the Assigned Goal phase, feedback was included on flyers displayed
weekly along with a reminder of the plant’s belt-use goal. Flyers were posted in the same
locations and fashion as in the Assigned Goal intervention described above with one noteworthy
exception --feedback on the plantwide safety-belt use from the previous week was included on
each flyer. This feedback was updated weekly, and new flyers were posted during the first shift
each Monday as during the Assigned Goal phase. After an initial period of feedback, the flyers
appeared in bright colors which were changed weekly to attract attention. This phase lasted
approximately 16 weeks.
Promise Card
Written buckle-up promise cards (as described in Geller & Lehman, 1991) were
distributed to all employees with their paychecks. The promise cards contained the company
{PAGE }

Critical Success Factors for Behavior-Based Safety
logo, the winning safety slogan, and a formal statement pledging to use a vehicle safety belt
throughout a two-week period. The promise also included a location for the employees to sign,
and a box they could check if they would allow their card to be posted in the plant. After the
second week of the pledge period, the promise cards with this box checked (n = 200, 82% of the
signed promises) were laminated on a 4 foot by 4 foot poster-board and displayed on the plant
safety bulletin board.
Blank pledge cards were distributed next to the posted promise cards and labeled
“Second-Chance Pledges.” The initial pledge period was extended an additional two weeks. New
promises (n = 31) were posted (with approval) at the time they were signed. The flyers
displaying the safety-belt use goal and behavioral feedback were posted as described above
throughout this four-week pledge period.
Promise Plus Incentive/Reward
This intervention was identical to the promise-card commitment described above, except
combined with the promise was an incentive to sign the promise and buckle-up during the four-
week pledge period. Specifically, it was announced on flyers attached to the paychecks of all
employees, on table tents in the workers’ cafeteria, and on signs posted in bathrooms above hand
dryers and on doors located in strategic places throughout the plant that a cash prize would be
awarded to one winner of a random drawing of a signed promise card. The amount of the cash
prize was determined by the increase in mean safety-belt use among all plant employees.
Specifically, $20 was added to the lottery prize for every percentage point increase in safety-belt
use above the pre-promise baseline. The prize was awarded one week following the pledge
period in a public drawing conducted by the first author and the plant safety manager. A member
of the plant’s safety team drew the winning card.
{PAGE }

Critical Success Factors for Behavior-Based Safety
Withdrawal
A withdrawal period marked by removal of all intervention materials occurred after the
plant Safety-Slogan Contest, the Promise Card, and Promise Card plus Incentive/Reward
interventions. Each withdrawal lasted approximately six weeks.
Results
Safety-Belt Use
Overall, our observations revealed remarkable increases from 1982 in baseline safety-belt
use plantwide (52%, n = 1235). Recall that more than a decade earlier, Geller et al. (1983)
reported that baseline belt use among hourly and salary workers at this same facility was 3.4 %
and 17.4%, respectively.
Figure 4 displays the weekly percentage of safety-belt use for all employees throughout
the 24 months of this field study. Vertical lines indicate the introduction of a new intervention or
withdrawal as described above. Horizontal lines depict the mean belt-use percentage for each
specific phase. The number of observations per phase is indicated within each intervention
condition. The month of data collection is provided below the x-axis, and the corresponding year
is noted in the body of the figure.
----------------------------
Insert Figure 4 about here
----------------------------
A visual inspection of the data indicates a lack of marked increases in safety-belt use per
intervention phase, even as the interventions became more intrusive. A noteworthy exception
was the modest increase in plantwide belt use to 68% (n = 1007) as a result of the Promise plus
Incentive/Reward intervention. As shown in Figure 4, this effect continued for up to three weeks
{PAGE }

Critical Success Factors for Behavior-Based Safety
following the termination of the pledge period. Interestingly, only 213 (38%) promise cards were
signed during the Promise plus Incentive/Reward period. Of these, only 88 were signed by
employees who had not signed a promise card during the prior Promise-Only intervention.
A close look at the data indicates that another modestly effective intervention was the
Safety Slogan contest and Celebration. This intervention resulted in an immediate increase in
safety-belt use for six weeks to 53% (n = 601) and a longer-term maintenance of 61% (n =1001)
during a subsequent six-week return to baseline. These increases resulted after three attempts to
prompt the use of safety belts resulted in a decrease in safety-belt use to 47% (n = 635) during
the plantwide Prompt condition.
The only other intervention that had any desired effect was the Promise Card. Two-
hundred and forty-four (44%) of the workers signed the buckle-up promise. This strategy
increased safety-belt use to 64% (n = 1033) during the two-week Promise period. However, upon
posting the promises publicly, use of safety-belts dropped to 57% (n = 632), just below the level
obtained during the second Assigned Goal plus Feedback phase (59%, n = 3675).
Overall, the gain in safety-belt use over the course of two years was approximately 15
percentage points or approximately 30 percent above the initial baseline level of 52% (n = 1235
observations) to 67% (n = 1193) through the first three weeks of the Follow-Up. The six week
follow-up mean was 65% (n = 1407), 25 percent above the baseline two years earlier.
Turn-Signal Use
Figure 5 displays the weekly percentage of turn-signal use for all employees throughout
the 24 months of this field study. Vertical lines indicate the introduction of a new intervention to
increase safety-belt use or a return to baseline, and horizontal lines represent the mean turn-
signal use percentage for each specific phase of the research. The number of observations per
{PAGE }

Critical Success Factors for Behavior-Based Safety
phase is indicated within each intervention condition. The month of data collection is provided
below the x-axis and the corresponding year is noted in the body of the figure.
----------------------------
Insert Figure 5 about here
----------------------------
Although not targeted, turn-signal use decreased steadily throughout the course of the
research. More precisely, visual inspection of the data indicates that turn-signal use did not
deviate markedly in any phase from the baseline mean of 50% (n = 1272), but did trend
downward to a low of 34% (n = 1363) during the Incentive/Reward intervention. A Pearson’s
product moment correlation of turn-signal use with safety-belt use resulted in a significant
negative correlation (r = -.28, p <.05) for observations up to Week 75. The correlation from
Week 75 through Follow-Up was stronger ( r = -.38, p < .05) and is reflected in Figure 5 by an
eight percentage point decrease in turn-signal use and a ten percentage point increase in safety-
belt use from Week 80 through the first half of Follow-Up.
Discussion
Overall, these data support the MIL hierarchy (Geller, 1998a, c; Geller et al., 1990). That
is, one could argue that the antecedent strategies used to motivate safety-belt use in the current
research are all first level interventions, less powerful than Virginia’s BUL. As such it follows
that the hard-core resisters, not influenced by the BUL, would not be influenced by repeated
applications of lower-level interventions. As suggested by the MIL, the modest improvements
seen in the use of safety belts may have been, in part, due to the involvement of belt users as
supportive intervention agents to get some part-time users to buckle-up more consistently.
{PAGE }
Critical Success Factors for Behavior-Based Safety
Modeling appropriate behavior has been shown to increase the likelihood of others
emitting the desired response by: a) demonstrating the ease at which it can be done; b) making
more salient the costs versus benefits of the target behavior; and c) changing cultural norms
regarding the behavior (Bandura, 1997). Indeed, the results of the current research indicate that
the interventions requiring at least minimal individual involvement (i.e., Slogan Contest, Promise
Card, and Promise Card plus Incentive/Reward) were most effective at increasing the use of
safety belts.
Fifteen years ago a similar behavioral intervention at this same facility increased safety-
belt use from 17.4% to 50.6% among salary workers, and from 3.4% to 5.5% for hourly workers.
As there was no safety-belt use law in 1982, the incentive was enough to provide the motivation
to produce some desired behavior change. The baseline level of 52% belt use in the current study
was only slightly higher than the intervention levels obtained in 1982. This suggests that those
workers not motivated to avoid the improbable fine of $25 were not likely to buckle up for the
remote probability of winning the raffle drawing. These individuals need more intrusive and
intensive interventions to motivate them to change. This is as predicted by the MIL hierarchy
proposed by Geller et al. (1990) and refined by Geller (1998c?).
In Conclusion
The failure of the various behavioral interventions to increase vehicle safety-belt use at
an industrial site can be explained by considering the state of those workers not currently
buckling up. The employees at this facility have been informed many times about the value of
safety belts, and they know how to buckle up. In fact, given that a safety-belt use law has been in
effect in Virginia since 1989, vehicle occupants are willfully taking two calculated risks when
{PAGE }

Critical Success Factors for Behavior-Based Safety
they don’t buckle up. They risk a $25 fine and the likelihood of being more seriously injured in a
vehicle crash.
To increase safety-belt use among those who know what to do but don’t, a behavioral
intervention needs to be motivational. And the motivational contingencies need to be more
powerful (soon, certain, and significant) than any other intervention currently in place to increase
the safe behavior. Thus, it can be argued that our various instructional interventions were
irrelevant, and for most non-users of safety belts, the consequences of our motivational
intervention were not significant enough. The incentive/reward program was no more intrusive
than the current BUL in Virginia, and thus did not involve a higher level of the MIL hierarchy
(Geller, 1998c?).
STUDY 3: SPECIFIC VS. GLOBAL FEEDBACK: COMPARING RELATIVE EFFECTIVENESS
(see Appendix __ for a complete report as included in an accepted proposal for a Ph.D.
dissertation)
The beneficial impact of feedback on organizational safety performance is well
established. Improvements in safety-related behaviors following BBS feedback have been
demonstrated in a number of organizational settings including: a plastics manufacturing plant
(Sulzer-Azaroff & De Santamaria, 1980), a metal fabrications plant (Zohar, Cohen & Azar,
1980), a bakery (Komaki, Barwick & Scott, 1978), a public work’s department (Komaki,
Heinzmann & Lawson, 1980), a university chemical laboratory (Sulzer-Azaroff, 1978), and a
university cafeteria (Geller, Eason, Phillips, & Pierson, 1980). As researchers point out,
“Informational feedback on performance has been shown to be a simple, effective, and durable
method for promoting safety” (Fellner & Sulzer-Azaroff, 1984, p. 7).
{PAGE }

Critical Success Factors for Behavior-Based Safety
Two common factors influencing the successful use of behavioral feedback in applied
settings are global and specific feedback. However, the relative impact of global versus specific
feedback has not been addressed in the safety literature. This study represents the first empirical
test of global versus specific safety feedback on safety performance.
Method
Participants were 40 front-line workers at a soft-drink bottling plant in Southeastern
Virginia. The employees were observed by trained behavioral observers from a large
Southeastern University using a critical observation checklist. The observations occurred twice a
day (once per shift) and each observation period lasted approximately one hour. The checklist
included: personal protective gear, lifting, fork truck driving, and general safety (e.g., cutting
away from body). For each behavioral category, trained observers marked either “safe” or “at
risk” for the safety-related behaviors performed by the employees. At the end of each week, an
overall “percent safe” score (total safe observations/total observations X 100) for the week was
tallied for the group. This served as the dependent variable. Reliability estimates for inter-rater
agreement between observers was calculated each week and was above 85% for all behaviors
observed.
For 15 weeks, a baseline period was established to determine percent safe scores for the
targeted behaviors. This baseline period was followed by an intervention period in which
participants were made aware of the specific behaviors that were being observed with the CBC.
They were observed for ten weeks following this ‘awareness intervention.’ After this period, the
first ‘feedback intervention’ was introduced. Shift 1 participants received global feedback
(aggregated across behaviors), whereas Shift 2 received specific behavioral feedback for each
CBC category (with no global feedback).
{PAGE }

Critical Success Factors for Behavior-Based Safety
This CBC feedback was provided in weekly meetings and took the form of graphs that
showed weekly changes in percent safe scores. For the Global Feedback condition, a single
graph was provided each week. For the Specific Feedback condition, four graphs (one for each
behavior) were provided each week. Behavioral observations with the first feedback intervention
lasted six weeks. Following this, the second feedback intervention was introduced.
With the second feedback intervention, Shift 1 participants received specific behavioral
feedback and Shift 2 participants received global behavioral feedback. In other words, the
feedback conditions for the two shifts were reversed for the second feedback intervention. The
second feedback intervention lasted 6 weeks. Next, the Withdrawal phase of the experiment
consisted of 17 weeks in which observations were made following the removal of BBS
performance feedback with both shifts. Finally, after a six month period without observations,
the eight week follow-up phase was implemented.
Analysis
The current study used a 2 Feedback Level (global, specific feedback) X 6 Phase
(baseline, awareness, intervention 1, intervention 2, withdrawal, follow-up) repeated measures
ANOVA to determine the relative impact of global versus specific behavior-based feedback on
safety performance.
Results
Behavior-based safety awareness and feedback lead to more frequent safe behavior
occurrences over baseline for Shift 2, but not Shift 1. For Shift 2, percent safe scores were higher
for the specific versus global feedback condition. No other significant differences were found
and no evidence of response generalization was demonstrated. Descriptive statistics are provided
below.
{PAGE }
Critical Success Factors for Behavior-Based Safety
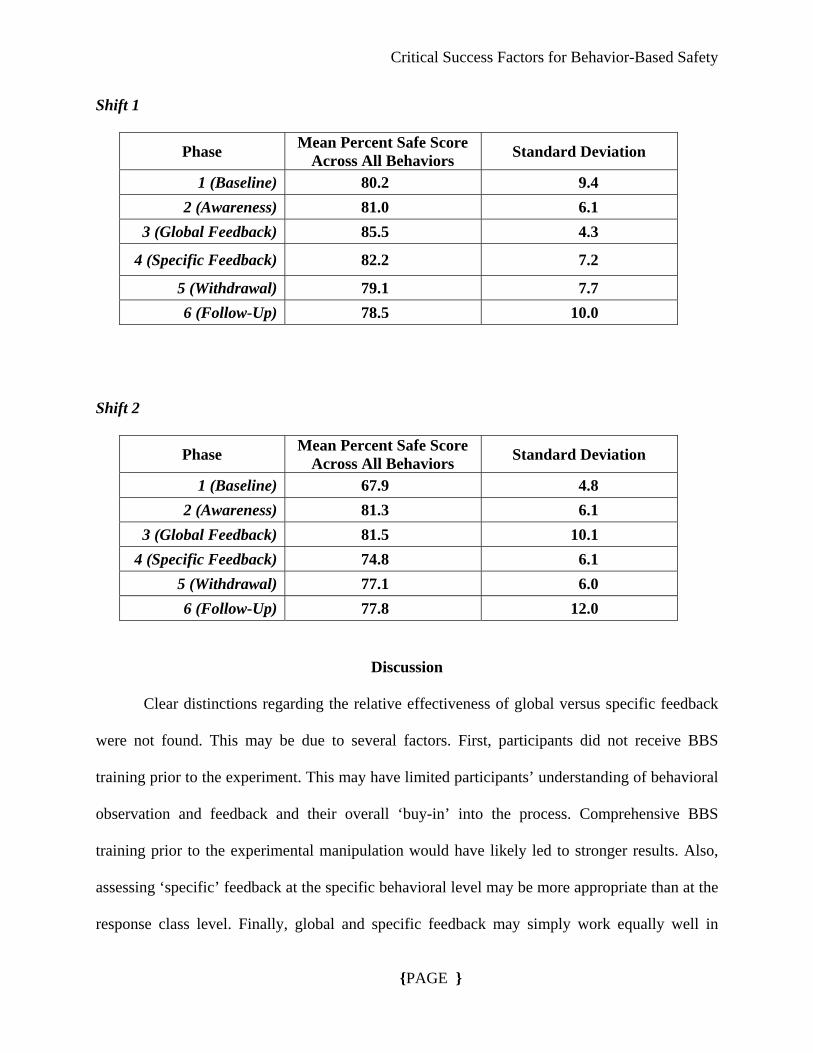
Shift 1
Mean Percent Safe Score Across All Behaviors Phase Standard Deviation
1 (Baseline) 80.2 9.4 2 (Awareness) 81.0 6.1
3 (Global Feedback) 85.5 4.3
4 (Specific Feedback) 82.2 7.2
5 (Withdrawal) 79.1 7.7 6 (Follow-Up) 78.5 10.0
Shift 2
Mean Percent Safe Score Across All Behaviors Phase Standard Deviation
1 (Baseline) 67.9 4.8 2 (Awareness) 81.3 6.1
3 (Global Feedback) 81.5 10.1 4 (Specific Feedback) 74.8 6.1
5 (Withdrawal) 77.1 6.0 6 (Follow-Up) 77.8 12.0
Discussion
Clear distinctions regarding the relative effectiveness of global versus specific feedback
were not found. This may be due to several factors. First, participants did not receive BBS
training prior to the experiment. This may have limited participants’ understanding of behavioral
observation and feedback and their overall ‘buy-in’ into the process. Comprehensive BBS
training prior to the experimental manipulation would have likely led to stronger results. Also,
assessing ‘specific’ feedback at the specific behavioral level may be more appropriate than at the
response class level. Finally, global and specific feedback may simply work equally well in
{PAGE }

Critical Success Factors for Behavior-Based Safety
influencing safety performance. Overall, global and specific feedback worked equally well and
improved performance beyond baseline levels for Shift 2. For 18 months prior to and 18 months
during the study, the overall frequency of recordable injuries at this facility fell by more than
50%.
STUDY 4: A NATIONWIDE SURVEY OF SAFETY PROFESSIONALS
(see Appendix E for a complete report as published in the Proceedings of the Professional
Development Conference of the American Society of Safety Engineers, June 1998.)
Safety professionals were solicited for input through a nationwide survey published in
Industrial Safety and Hygiene News (ISHN), a monthly magazine for safety professionals with
62,000 company subscribers. The survey was designed to assess readers' knowledge and interest
in BBS, and to explore ideas for improving the communication and implementation of BBS
principles and procedures for reducing industrial injuries. The survey also allowed us to begin
constructing a database of organizations currently active in BBS efforts.
A total of 162 completed surveys were returned to us by mail or fax. An appreciation of
the BBS approach was shown by 80% (n=129) of the respondents answering “yes” to the
question “Do you believe behavior-based safety is a viable approach for reducing at-risk work
behaviors and activities?” (Only 3% responded “no” to this question; the rest said they didn’t
know). In addition, more participants responded “no” (48%) than “yes” (34%) to the question,
“Do you think a safety program should put more direct focus on attitudes than on behaviors?”
This is interesting because it not only shows preference for a BBS approach, it reflects a shift
from the traditional educational approach to injury prevention.
The astute reader will note, however, that the sample of surveys we analyzed was not
random and was likely biased toward the BBS approach. The survey was presented within the
{PAGE }

Critical Success Factors for Behavior-Based Safety
context of research aimed at discovering how to make the BBS approach more effective. Thus,
it’s likely most people who took the time to complete and return the survey were at least
interested in this particular approach to industrial safety. In fact, several respondents asked
specifically to be included in our sample of organizations to visit for an on-site evaluation of
factors contributing to the impact of a BBS process. Thus, compared to the average reader of
ISHN, those who answered the questions and returned our survey were probably more informed
about BBS and had higher confidence in the effectiveness of BBS. Even with this positive bias,
however, the survey revealed some misperceptions about BBS which can limit its application for
safety improvement.
What is Behavior-Based Safety?
The first part of the survey asked respondents to give their impression of BBS by
checking all of the items they believe are true from a list of 16 possible characteristics. In
general, the respondents’ selections indicated accurate knowledge of BBS, but there were a few
notable exceptions.
The three items selected most often as representing BBS were: 1) an intervention
approach for increasing safe behavior (selected by 143 respondents); 2) an observation and
feedback process (n=130); and 3) a tool for managing safety (n=114).
Relatively fewer respondents considered other characteristics of BBS to be relevant.
Specifically, only 42 of the 162 respondents considered BBS an approach useful for investigating
injuries. Only 88 respondents (54%) felt BBS is useful for evaluating safety achievement, and 99
respondents (61%) considered BBS an intervention approach for decreasing at-risk behavior.
It is likely people have a rather narrow viewpoint regarding BBS. This limited
perspective is also reflected in numerous safety articles, sales pitches from safety consultants,
{PAGE }

Critical Success Factors for Behavior-Based Safety
and presentations at safety conferences. In fact, BBS is much more than a tool for doing
observation and feedback. It is actually “a general philosophy that can be applied to many
aspects of safety management.” This general definition was actually the most accurate item on
our survey checklist, and was checked by 71% of the respondents.
Principle versus Application
Most survey respondents were aware that BBS focuses on positive consequences to
influence behavior change, since only four individuals indicated that BBS was “an approach
focusing on the use of punishment to decrease unsafe behavior.” However, a different story
emerged when the survey asked respondents to check which techniques were actually used in
their plant “to influence safety-related behaviors in the workplace.”
Activators (or antecedent strategies) were most popular, with policies (n=149), posted
safety signs (n=124), demonstrations (n=108), and lectures (n=102) leading the list. Goal-setting,
feedback, and incentive/reward programs were used frequently, but more companies focused on
outcome (“accidents or injuries”) rather than process (“safety-related behaviors or activities”)
when setting goals (n=95 vs. 48), when giving group feedback (n=83 vs. 60), when giving
individual feedback in coaching sessions (n=96 vs. 74), and when rewarding people for safety
improvement (n=72 vs. 56).
The absence of checks for many techniques was quite revealing, and inconsistent with an
appreciation for BBS principles. For example, the most cost-effective BBS approaches to
improve safety are behavioral goal-setting and feedback for individuals and groups, yet these
intervention approaches were being used at less than half of the sites represented by the survey
respondents. It was encouraging, however, that almost two-thirds of the sample (n=102) use
safety steering committees to manage their safety programs.
{PAGE }

Critical Success Factors for Behavior-Based Safety
Only 15% (n=24) of the respondents indicated they monitor “percent safe behavior” to
assess the success of their safety programs. The traditional outcome measures were most
popular, with 77% (n=125) using OSHA recordables, 75% (n=122) using lost-time accidents,
42% (n=68) using total recordable injury rate, and 44% (n=66) using total recordable rate,
including illness. Interestingly, slightly more respondents reported they use attitude or perception
surveys (17%) than percent safe behaviors (15%).
Implications
The responses of those who completed and returned our BBS survey published in ISHN
reflected appreciation for a BBS approach to injury prevention, but they also demonstrated
substantial misunderstanding and misapplication. A majority of respondents, for example,
perceived BBS as an observation and feedback tool rather than a general approach to improving
the human dynamics of safety, relevant for ergonomics, injury analysis, and the design of
incentive/reward programs.
Even with substantial appreciation for behavioral observation and feedback as a way to
increase safe behavior, relatively few respondents indicated use of a relevant metric for
monitoring the success of a behavior-improvement process. Thus, while safety leaders are
increasing their belief in the power of observation and feedback to improve behavior, companies
are apparently slow to apply appropriate feedback measures to evaluate and improve their safety
programs. This is likely not due to inconsistencies between people’s beliefs and behaviors, but
rather to management system variables that prevent a paradigm shift from an outcome-based and
reactive evaluation process to one focused on up-stream process activities that contribute to the
prevention of workplace illnesses and injuries.
{PAGE }

Critical Success Factors for Behavior-Based Safety
STUDY 5: A NATIONWIDE ANALYSIS OF BBS PROCESSES
(see Appendix __ for a complete report as current under review for publication in Journal of
Safety Research, and an accepted Ph.D. dissertation based on this research).
For this study, it was originally proposed that ten companies reporting exemplary success
implementing a BB safety process and ten companies reporting unsuccessful implementation of a
BB safety process be selected for site visits. We quickly found that distinguishing between an
effective BB safety process and an ineffective BB safety process was not simple. The majority of
organizations returning surveys reported a decrease in incident and injury rate. And companies
with a poor safety record were not apt to volunteer for a safety visit. As an alternative approach,
we decided to approach site visits with the perspective of identifying themes or patterns of
factors related to success vs. failure.
Although BBS methods are consistently effective at increasing the occurrence of safe
behaviors, they can only work if used throughout an organization. In other words, if employees
do not "buy-in" to BBS process, participate actively in observation and feedback sessions, and
help to implement BBS intervention procedures, any research describing the impact of this
approach is academic (pun intended). Therefore, a primary objective of the current research was
to begin the process of identifying organizational and interpersonal variables that inhibit versus
facilitate employee involvement in a BBS process.
Subjects and Setting
Participation was solicited through survey research conducted in a professional safety
journal, as well as through attendance at professional safety conferences and workshops. The
participants were employees working at 20 different industrial sites. From these 20
organizations, 245 employees (221 male, 24 female) participated in 31 focus-group sessions.
{PAGE }
Critical Success Factors for Behavior-Based Safety
About 80% of these participants were male, a male to female ratio that paralleled to workforce.
All 20 of the sites visited were involved in an employee-driven BBS process that was at least one
year old. Each BBS process included interpersonal observation and feedback with a checklist of
specific safe and at-risk behaviors.
Procedures
During scheduled site visits to all 20 participating organizations, data were collected by two
researchers via two distinct methods: focus group discussions and perception surveys. Focus
groups were performed with each site visited. One focus group involved only members of the
safety steering committee the other involved a random selection of hourly employees. While this
should have resulted in 40 focus group sessions, 9 of the sites visited did not have an intact
safety committee. Therefore a total of 31 focus groups were performed (20 with hourly
employees, 11 with safety-committee members). Focus groups ranged in size from four to 22.
The focus group sessions lasted approximately 90 minutes, during which time employees
were asked a series of questions designed to solicit their opinions regarding the necessary
ingredients for an effective employee-driven BBS process. These questions asked of all groups
are listed in the Results Section with a summary of the responses. All responses were
simultaneously recorded on data collection sheets by both researchers.
After completing both focus groups, researchers left a perception survey with each
organization. The contact person at each organization was instructed to get as many employees
as possible to complete the surveys. If it was not possible to survey all employees, the contact
person was asked to obtain a representative sample of every work area. When completed, the
surveys were mailed directly to the researchers for analysis.
{PAGE }

Critical Success Factors for Behavior-Based Safety
Results
Focus Group Results
Two steps were used to analyze information gathered during focus-groups. First
researchers looked at the employee responses for all questions as recorded by both focus-group
facilitators. Only those responses that appeared on both of the data sheets were retained for
analysis. Second, for the first five questions each response was classified as a positive, negative,
or neutral statement by two researchers. Neither researcher was aware of how the other was
classifying any of the responses. Only if a statement was classified as positive, negative, or
neutral by both researchers was it retained. Agreement was very high and only 12 responses were
eliminated as a result of this process.
For questions 6-8 the responses were categorized as a behavior-based factor, a person-
based factor, or an environment-based factor. The classification was performed by two subject-
matter experts and consensus was reached on each item. The results obtained from focus groups
are reported separately for each question.
Question 1
How do you feel about the observation and feedback process used in your behavior-based
safety process? A total of 104 comments (56 positive, 37 negative, 11 neutral) were recorded.
The most frequent positive comments indicated a perception that observation and feedback is
beneficial because it increases one’s awareness of safe and at-risk behaviors (17 comments, 15
focus groups, 14 organizations). The second most frequent response implied the observation and
feedback process facilitated positive attitudes among employees (8 comments, 6 focus groups, 5
organizations). Specifically, employees indicated it has resulted in increases in trust, comfort
{PAGE }

Critical Success Factors for Behavior-Based Safety
with coworkers, and even pride. A smaller number of responses indicated that such a process
increased individual accountability (3 comments, 3 focus groups, 2 organizations).
The most frequent negative comment revealed a perception that ulterior motives are
behind the observation and feedback process (15 comments, 9 focus groups, 8 organizations).
For example some of these comments indicated employees only participate in the process to
“rat” on other employees (7 comments, 5 focus groups, 5 organizations) or as an excuse to give
negative feedback to someone they did not like (4 comments, 4 focus groups, 4 organizations).
This was reflected in statements like “Inappropriate feedback is often given;” “I give permission
to be observed, then I’m made to look bad;” “The observers are looking for negatives.” A few
other negative comments implied employees participating in the process are simply looking for
overtime (2 comments, 2 focus groups, 2 organizations), trips to conferences (1 comment, 1
focus group, 1 organization), or just trying to make themselves look good (1 comment, 1 focus
group, 1 organization). Other negative comments suggested the observation and feedback
process was inconvenient (9 comments, 8 focus groups, 6 organizations). In other words the
observation and feedback process was perceived as just one more thing to do on top of all the
other responsibilities.
Question 2
Is participation in the observation and feedback process mandatory or voluntary? The
workers interviewed at 12 organizations indicated their process was voluntary, whereas those at
8 organizations indicated participation was either "expected" or mandatory. For each
organization, a "positive regard score" was calculated for the observation and feedback process.
This was accomplished by subtracting the total number of negative comments made about
observation and feedback from the number of positive comments given about this BBS process.
{PAGE }

Critical Success Factors for Behavior-Based Safety
The positive regard scores per organization were then correlated with type of process (mandatory
vs. voluntary). The correlation between using voluntary observation processes and positive
regard was -.304. Suggesting a trend toward more positive regard for an observation and
feedback process that is mandated.
Question 3
What role should management play in your behavior-based safety process? There were
50 total responses obtained (23 positive, 15 negative, 12 neutral) for this question. Content
analyses of focus group responses revealed only a few organizations (15%) with more negative
than positive comments regarding management involvement in the BBS process. In other words,
only three organizations expressed a negative reaction toward any amount of management
involvement.
With regard to direct management involvement in the interpersonal observation and
feedback process, reactions were mixed. Six employee groups, from six organizations suggested
the more management is involved the better (as evidenced by the quote “They should to be
involved because a team means everyone.”). Nine employee groups, from 8 organizations felt
direct management involvement was a bad idea, as reflected in a common statement “Less
management involvement is better, support is good if direct involvement is minimal.”. These
groups pointed to issues of trust as crucial in determining their perceptions. Management
involvement should follow successful efforts to build interpersonal trust. It should be noted these
organizations stressed the importance of management's role as supportive rather than directive.
Question 4
How do supervisors influence your behavior-based safety process? This question was
added after the first four site visits had already been completed. As such focus groups from 16 of
{PAGE }

Critical Success Factors for Behavior-Based Safety
the 20 organizations had a chance to respond. From those 16 organizations, only 12 had a
position analogous to a front-line supervisor. From these, the employees participating in the
focus groups for 11 organizations stressed the importance of the front-line supervisors. At each
site it was stated specifically if front-line supervisors do not support the process it will not be
effective.
Question 5
What are your perceptions of the behavior-based safety steering committee? A content
analysis of the 87 responses (33 positive, 36 negative, 18 neutral) revealed focus group
employees at the majority of organizations tended to have overall positive perception of the
safety steering committee (16 comments, 15 focus groups, 12 organizations). While some of
these comments were general commendations such as “I think there doing a good job (9
comments, 9 focus groups, 8 organizations).” Other remarks in this category revealed employees
on the steering committees were viewed as well intentioned and serious about safety (7
comments, 7 focus groups, 7 organizations).
The most common negative responses centered on perceptions that employees on the
steering committees tend to be “out of touch” and spend too much time in meetings (8
comments, 7 focus groups, 6 organizations). Another complaint with the safety steering
committees was that they were composed of safety "spies" or safety "rats" (4 comments, 4 focus
groups, 3 organizations). Finally, it was also commented that employee participation in steering
committee meetings was responsible for morale and production problems (4 comments, 3 focus
groups, 3 organizations).
{PAGE }

Critical Success Factors for Behavior-Based Safety
Question 6
How would you improve your behavior-based safety process? Of the 103 to this question
most were categorized as environment-based side of the triangle (n = 72). The second greatest
number of responses were classified as behavior-based (n = 23), and the fewest were classified as
person-based (n = 8).
The most common environment-based responses indicated that employees would
improve the BBS process by using more and better incentives to motivate participation (11
comments, 11 focus groups, 10 organizations) and making sure everyone had adequate training
(11 comments, 9 focus groups, 6 organizations). Additional remarks indicated a need to improve
the quality of machinery being used (9 comments, 7 focus groups, 6 organizations). Also, the
idea of simplifying the behavioral checklist was given several times (6 comments, 6 focus
groups, 6 organizations).
The most common behavior-based suggestion was a need to increase levels of employee
participation (8 comments, 8 focus groups, 7 organizations). Other recommendations included
increasing the occurrence of positive feedback (2 comments, 2 focus groups, 2 organizations),
and firing any at-risk workers (2 comments, 2 focus groups, 2 organizations). All eight responses
categorized as person-based focused on ensuring proper employee attitudes. Beyond more
effective training, however, employees did not specify how to improve attitudes.
Question 7
What are the biggest obstacles your behavior-based safety process has faced? Of 133
responses recorded, the majority of BBS obstacles were environment-based (n=67). The next
highest number of responses were classified as person-based factors (n=47), and the fewest
number of responses were classified as behavior-based responses (n=19).
{PAGE }

Critical Success Factors for Behavior-Based Safety
The most common environment-based barrier was lack of management support (22
comments, 20 focus groups, 18 organizations). For some, lack of support meant employees were
not given the time to perform observations (8 comments, 8 focus groups, 7 organizations), or
there was not enough money to give the process requisite resources (8 comments, 8 focus
groups, 7 organizations), or even that management did not show they believed in the process (4
comments, 4 focus groups, 2 organizations). Additional remarks indicated that previous
unsuccessful initiatives had made many employees cynical regarding the success of the behavior-
based process (10 comments, 10 focus groups, 10 organizations). Also, there was a fairly
consistent distaste for the extra paperwork involved (6 comments, 6 focus groups, 6
organizations), especially if the behavioral checklists were complex.
Among the person-based factors, the most frequently mentioned obstacle was a lack of
trust (12 comments, 12 focus groups, 12 organizations). According to focus groups at more than
50 percent of the organizations, lack of trust between coworkers, and between line workers and
supervisors was perceived as crucial for many of the set backs experienced relevant to the BBS
process. Another frequent person-based obstacle was discomfort associated with having another
individual observe one’s work practices (8 comments, 8 focus groups, 8 organizations). A
number of comments also indicated that getting employees to buy-in to the process was a
challenge (5 comments, 5 focus groups, 5 organizations). It seems many employees had trouble
seeing what was in it for them.
The smallest number of obstacles was classified as behavior-based responses. The most
common behavior-based barrier was a lack of participation (5 comments, 4 focus groups, 4
organizations). Other responses in this category targeted poor communication (3 comments, 3
{PAGE }

Critical Success Factors for Behavior-Based Safety
focus groups, 3 organizations), and a tendency to focus on negative as opposed to positive
feedback (3 comments, 2 focus groups, 2 organizations).
Question 8
What are the key ingredients for success in a behavior-based safety process?
Categorization of 152 responses revealed a majority of BBS key ingredients were person-based
factors (n=57), followed by environment-based factors (n=53), and then behavior-based factors
(n=42). Individual responses were examined within each of these factors to determine which
were most common.
For person-based factors the most frequent key ingredient was interpersonal trust (13
comments, 13 focus groups, 13 organizations). Other responses to this question indicated a BBS
process would more likely succeed if employees had a positive attitude (5 comments, 5 focus
groups, 5 organizations), and if BBS procedures were approached with an open mind (4
comments, 4 focus groups, 4 organizations).
For behavior-based factors, getting employee participation was the number one response
(11 comments, 11 focus groups, 11 organizations), followed by the notion that teamwork was
needed for success (6 comments, 6 focus groups, 6 organizations), and then open communication
(5 comments, 5 focus groups, 4 organizations).
The most commonly mentioned environment-based factor for success was support (18
comments, 18 focus groups, 18 organizations). Whether time, money, or just a supportive
climate, employees indicated that without management support a behavior-based process will
fail. Other responses which were repeated included a need for everyone to be properly trained (5
comments, 5 focus groups, 5 organizations), and that participation in the observation and
feedback process had to be on a voluntary basis (4 comments, 4 focus groups, 4 organizations).
{PAGE }

Critical Success Factors for Behavior-Based Safety
Three of the latter comments came from organizations with a voluntary process, and one came
from an organization with a mandatory process.
Perception Survey Results
701 perception surveys were returned that were acceptable for analysis. These surveys
were returned from 15 of the 20 participating organizations (The employees at four organizations
failed to complete and return the surveys, and for one organization the returned surveys were
completed incorrectly).
Predicting Involvement in the Behavior-Based Process
A forward entry regression analysis was performed to determine variables most
predictive of involvement in the safety process. Level of involvement for each employee was
determined by summing the three involvement items constructed specifically for this study. Five
variables: a) perceptions of the BBS training received, b) trust in management abilities, c)
perceptions that safety is used in performance appraisals, d) whether or not the employee was
educated in the BBS process, and e) tenure with the organization contributed significantly to
predicting self-reported levels of involvement. These variables accounted for 41% of the
variance in self-reported involvement in the BBS process.
Participation and Satisfaction in a Voluntary Versus a Mandatory BBS Process
Employees in the mandatory processes reported significantly higher rates for giving and
receiving positive behavior-based feedback as well as significantly lower rates for receiving
negative behavior-based feedback. In addition, employees in mandatory BBS processes also
demonstrated significantly greater levels of trust in management (both abilities and intentions),
trust in coworkers (both abilities and intentions), and overall satisfaction with the BBS training
received.
{PAGE }

Critical Success Factors for Behavior-Based Safety
Discussion
The tremendous improvements in safety and performance of the companies who have
implemented BBS processes has given this approach to safety management credibility and status
(Geller, 1998d). Unfortunately, little objective research has been performed to elucidate the
organizational factors that can facilitate successful implementation of a BBS approach. Instead,
many organizations are left to muddle through the unending case-study literature provided by
safety consultants. Although such literature may be enlightening and informative to some degree,
it does not adequately inform readers of the underlying organizational processes that lead to
successful BBS implementation. The current empirical investigation is a first step in
understanding what factors are critical for successful implementation of a BBS process.
Based on the findings of this research we would like to offer a framework for
understanding why some BBS processes succeed and others fail. Analogous to the way in which
we analyzed the focus group discussions, we propose the BBS Safety Success Triad illustrated in
Figure 6. The three sides of this triangle are dynamic and interactive. When one changes the
others are influenced.
----------------------------
Insert Figure 6 about here
----------------------------
The BBS Safety Success Triad is based not only on the results from 40 focus groups, but
also from the analyses of 720 perception surveys (from 17 organizations). On the person side of
the triangle is interpersonal trust; on the environment side of the triangle is management support;
and on the behavior side of the triangle is employee participation/involvement. Training is in the
middle of the triangle because of its critical role in facilitating all three sides of the triangle.
{PAGE }

Critical Success Factors for Behavior-Based Safety
During training all employees receive the principles, procedures, and tools of a BBS process, and
management receives the rationale and the method for supporting BBS. Proper training
convinces participants that the process works and the people can implement it. This is necessary
for self-efficacy (Bandura, 1997), a person state deemed necessary for any positive change
among individuals. A complete description of this study as submitted for publication in the
Journal of Safety Research can be found in Appendix ?.
{PAGE }
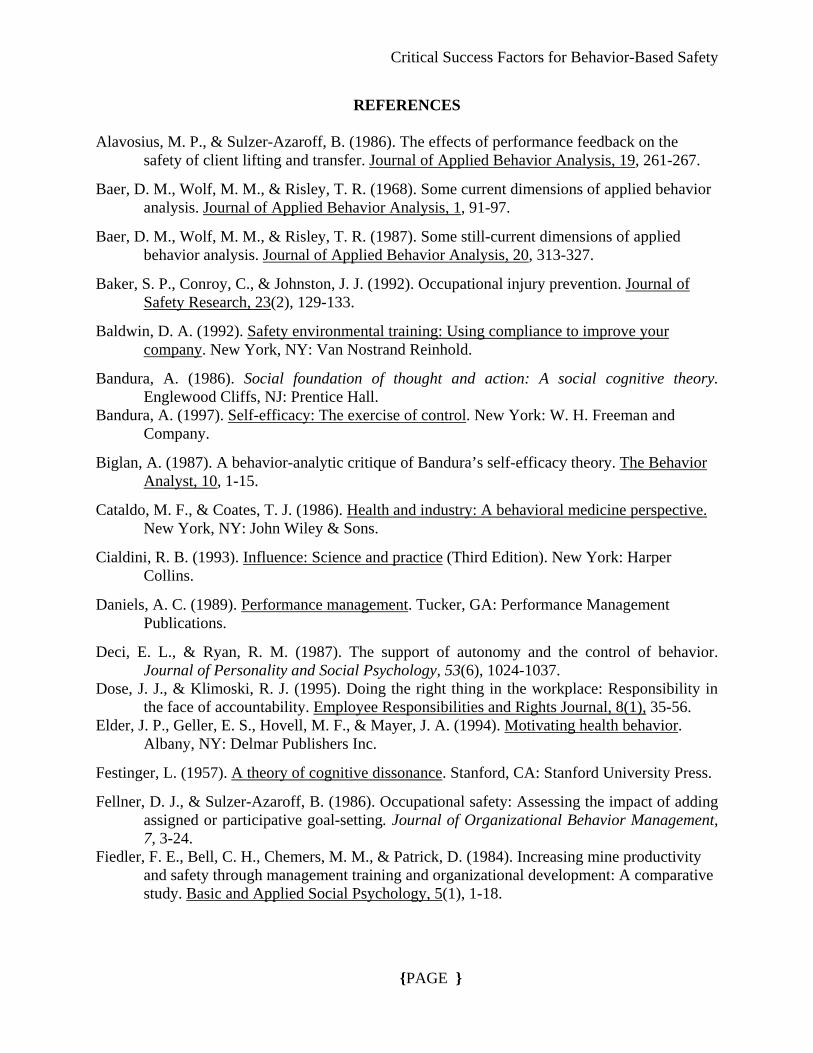
Critical Success Factors for Behavior-Based Safety
REFERENCES
Alavosius, M. P., & Sulzer-Azaroff, B. (1986). The effects of performance feedback on the safety of client lifting and transfer. Journal of Applied Behavior Analysis, 19, 261-267.
Baer, D. M., Wolf, M. M., & Risley, T. R. (1968). Some current dimensions of applied behavior analysis. Journal of Applied Behavior Analysis, 1, 91-97.
Baer, D. M., Wolf, M. M., & Risley, T. R. (1987). Some still-current dimensions of applied behavior analysis. Journal of Applied Behavior Analysis, 20, 313-327.
Baker, S. P., Conroy, C., & Johnston, J. J. (1992). Occupational injury prevention. Journal of Safety Research, 23(2), 129-133.
Baldwin, D. A. (1992). Safety environmental training: Using compliance to improve your company. New York, NY: Van Nostrand Reinhold.
Bandura, A. (1986). Social foundation of thought and action: A social cognitive theory. Englewood Cliffs, NJ: Prentice Hall.
Bandura, A. (1997). Self-efficacy: The exercise of control. New York: W. H. Freeman and Company.
Biglan, A. (1987). A behavior-analytic critique of Bandura’s self-efficacy theory. The Behavior Analyst, 10, 1-15.
Cataldo, M. F., & Coates, T. J. (1986). Health and industry: A behavioral medicine perspective. New York, NY: John Wiley & Sons.
Cialdini, R. B. (1993). Influence: Science and practice (Third Edition). New York: Harper Collins.
Daniels, A. C. (1989). Performance management. Tucker, GA: Performance Management Publications.
Deci, E. L., & Ryan, R. M. (1987). The support of autonomy and the control of behavior. Journal of Personality and Social Psychology, 53(6), 1024-1037.
Dose, J. J., & Klimoski, R. J. (1995). Doing the right thing in the workplace: Responsibility in the face of accountability. Employee Responsibilities and Rights Journal, 8(1), 35-56.
Elder, J. P., Geller, E. S., Hovell, M. F., & Mayer, J. A. (1994). Motivating health behavior. Albany, NY: Delmar Publishers Inc.
Festinger, L. (1957). A theory of cognitive dissonance. Stanford, CA: Stanford University Press.
Fellner, D. J., & Sulzer-Azaroff, B. (1986). Occupational safety: Assessing the impact of adding assigned or participative goal-setting. Journal of Organizational Behavior Management, 7, 3-24.
Fiedler, F. E., Bell, C. H., Chemers, M. M., & Patrick, D. (1984). Increasing mine productivity and safety through management training and organizational development: A comparative study. Basic and Applied Social Psychology, 5(1), 1-18.
{PAGE }

Critical Success Factors for Behavior-Based Safety
Frederiksen, L. W., Richter, W. T., Johnson, R. P., & Solomon, L. J. (1982). Specificity of performance feedback in a professional service delivery setting. Journal of Organizational Behavior Management, 3(4), 41-53.
Geller, E. S. (1984). Motivating safety belt use with incentives: A critical review of the past and a look to the future. In Advances in belt restraint systems: Design, performance and usage, (pp. 127-142). Warrendale, PA: Society of Automotive Engineers.
Geller, E. S. (1988). A behavioral science approach to transportation safety. Bulletin of the New York Academy of Medicine, 64, 632-661.
Geller, E. S. (1996). The psychology of safety: How to improve behaviors and attitudes on the job. Boca Raton, FL: CRC Press.
Geller, E. S. (1998a). How to select behavioral strategies. Industrial Safety and Hygiene News, 32(9), 12-13.
Geller, E. S. (1998b). Understanding behavior-based safety: Step-by-step methods to improve your workplace (2nd Edition). Neenah, WI: J. J. Keller & Associates, Inc.
Geller, E. S. (1998c) Applications of behavior analysis to prevent injuries from vehicle crashes (2nd Edition). Cambridge, MA: Cambridge Center for Behavioral Studies.
Geller, E. S. (1998d). Building successful safety teams: Together Everyone Achieves More. Neenah, WI: J. J. Keller & Associates, Inc.
Geller, E. S., & Hahn, H. A. (1984). Promoting safety belt use at industrial sites: An effective program for blue collar employees. Professional Psychology: Research and Practice, 15(4), 553-564.
Geller, E. S., Berry, T. D., Ludwig, T. D., Evans, R. E., Gilmore, M.R., & Clarke, S. W. (1990). A conceptual framework for developing and evaluating behavior change interventions for injury control. Health Education Research: Theory and Practice, 5(2), 125-137.
Geller, E. S., Davis, L., & Spicer, K. (1983). Industry-based incentives for promoting seat belt use: Differential impact on white-collar versus blue-collar employees. Journal of Organizational Behavior Management, 5(1), 17-29.
Geller, E. S., Eason, S. L., Philips, J. A., & Pierson, M. D. (1980). Interventions to improve sanitation during food preparation. Journal of Organizational Behavior Management, 2(3), 229-240.
Geller, E. S., & Hahn, H. A. (1984). Promoting safety belt use at industrial sites: An effective program for blue collar employees. Professional Psychology: Research and Practice, 15(4), 553-564.
Geller, E. S., & Lehman, G. R. (1991). The buckle-up promise card: A versatile intervention for large-scale behavior change. Journal of Applied Behavior Analysis, 24, 91-94.
Geller, E. S., Lehman, G. R., & Kalsher, M. J. (1989). Behavior analysis training for occupational safety. Newport, VA: Make-A-Difference, Inc.
Geller, E. S., Roberts, D.S., & Gilmore, M.R. (1995). Predicting propensity to actively care for occupational safety. Journal of Safety Research, 27(1), 1-8.
{PAGE }

Critical Success Factors for Behavior-Based Safety
Geller, E. S., Rudd, J. R., Kalsher, M. J., Streff, F. M., & Lehman, G. R. (1987). Employer-based programs to motivate safety-belt use: A review of short and long-term effects. Journal of Safety Research, 18, 1-17.
Geller, E. S., Winett, R. A, & Everett, P. B. (1982). Preserving the environment: New strategies for behavior change. New York: Pergamon Press.
Guastello, S. J. (1993). Do we really know how well our occupational accident prevention programs work? Safety Science, 16, 445-463.
Hale, A. R., & Glendon, A. I. (1987). Individual behaviour in the control of danger. New York, NY: Elsevier Science Publishing Company Inc.
Heinrich, H. W. (1959). Industrial accident prevention: A scientific approach (4th Edition). New York, NY: McGraw-Hill.
Heinrich, H. W., Peterson, D., & Roos, N. (1980). Industrial accident prevention: A safety management approach (fifth Edition). New York, NY: McGraw-Hill.
Hoyos, C. G., & Ruppert, F. (1995). Safety diagnosis in industrial work settings: The Safety Diagnosis Questionnaire. Journal of Safety Research, 26, 107-117.
Jonah, B.A. (1989, November). Occupant restraint use in Canada: Past, present and future. Invited address to the SWOV Institute for Road Safety Research, Leidschendam, The Netherlands.
Jones, R. T., Ollendick, T. H., McLaughlin, K. J., & Williams, C. E. (1998). Elaborative and behavioral reversal in the acquisition of fire emergency skills and the reduction of fear of fire. Behavior Therapy, 20, 93-101.
Kello, J. E., Geller, E. S., Rice, J. C., & Bryant, S. L., (1988). Motivating auto safety belt wearing in industrial settings: From awareness to behavior change. Journal of Organizational Behavior Management, 9(2), 7-21.
Kohn, A. (1993). Punished by rewards. Boston: Houghton Mifflin.
Komaki, J., Barwick, K. D., & Scott, L. R. (1978). A behavioral approach to occupational safety: Pinpointing and reinforcing safe performance in a food manufacturing plant. Journal of Applied Psychology, 63(4), 434-445.
Komaki, J., Heinzmann, A. T., & Lawson, L. (1980). Effect of training and feedback: Component analysis of a behavioral safety program. Journal of Applied Psychology, 65(3), 261-270.
Krause, T. R., Hidley, J. H., & Hodson, S. J. (1996). The behavior-based safety process: Managing involvement for an injury-free culture (Second Edition). New York, NY: Van Nostrand Reinhold.
Leigh, J. (1995). Causes of death in the workplace. Westport, CN: Quorum Books.
Lepper, M. R., Greene, D., & Nisbett, R. E. (1973). Undermining children’s intrinsic interest with extrinsic rewards: A test of the “overjustification hypothesis.” Journal of Personality and Social Psychology, 28, 129-137.
{PAGE }
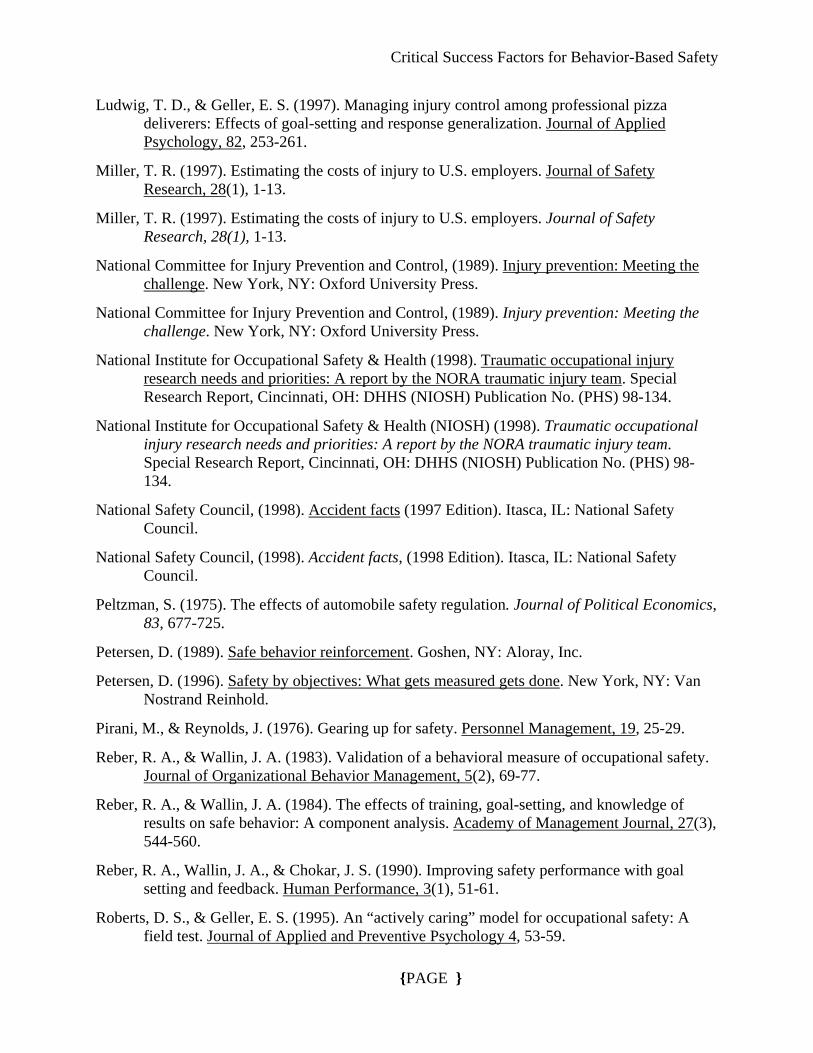
Critical Success Factors for Behavior-Based Safety
Ludwig, T. D., & Geller, E. S. (1997). Managing injury control among professional pizza deliverers: Effects of goal-setting and response generalization. Journal of Applied Psychology, 82, 253-261.
Miller, T. R. (1997). Estimating the costs of injury to U.S. employers. Journal of Safety Research, 28(1), 1-13.
Miller, T. R. (1997). Estimating the costs of injury to U.S. employers. Journal of Safety Research, 28(1), 1-13.
National Committee for Injury Prevention and Control, (1989). Injury prevention: Meeting the challenge. New York, NY: Oxford University Press.
National Committee for Injury Prevention and Control, (1989). Injury prevention: Meeting the challenge. New York, NY: Oxford University Press.
National Institute for Occupational Safety & Health (1998). Traumatic occupational injury research needs and priorities: A report by the NORA traumatic injury team. Special Research Report, Cincinnati, OH: DHHS (NIOSH) Publication No. (PHS) 98-134.
National Institute for Occupational Safety & Health (NIOSH) (1998). Traumatic occupational injury research needs and priorities: A report by the NORA traumatic injury team. Special Research Report, Cincinnati, OH: DHHS (NIOSH) Publication No. (PHS) 98-134.
National Safety Council, (1998). Accident facts (1997 Edition). Itasca, IL: National Safety Council.
National Safety Council, (1998). Accident facts, (1998 Edition). Itasca, IL: National Safety Council.
Peltzman, S. (1975). The effects of automobile safety regulation. Journal of Political Economics, 83, 677-725.
Petersen, D. (1989). Safe behavior reinforcement. Goshen, NY: Aloray, Inc.
Petersen, D. (1996). Safety by objectives: What gets measured gets done. New York, NY: Van Nostrand Reinhold.
Pirani, M., & Reynolds, J. (1976). Gearing up for safety. Personnel Management, 19, 25-29.
Reber, R. A., & Wallin, J. A. (1983). Validation of a behavioral measure of occupational safety. Journal of Organizational Behavior Management, 5(2), 69-77.
Reber, R. A., & Wallin, J. A. (1984). The effects of training, goal-setting, and knowledge of results on safe behavior: A component analysis. Academy of Management Journal, 27(3), 544-560.
Reber, R. A., Wallin, J. A., & Chokar, J. S. (1990). Improving safety performance with goal setting and feedback. Human Performance, 3(1), 51-61.
Roberts, D. S., & Geller, E. S. (1995). An “actively caring” model for occupational safety: A field test. Journal of Applied and Preventive Psychology 4, 53-59.
{PAGE }

Critical Success Factors for Behavior-Based Safety
Roberts, M. C., Fanurik, D., & Layfield, D. A. (1987). Behavioral approaches to prevention of childhood injuries. Journal of Social Issues, 23, 105-118.
Roberts, M., Fanurik, D., & Wilson, D. (1988). A community program to reward children's use of seat belts. American Journal of Community Psychology, 16, 395-407.
Sleet, D. A. (1987). Motor vehicle trauma and safety-belt use in the context of public health priorities. The Journal of Trauma, 27, 695-702.
Smith, M. J., Anger, W. K., & Ulsan, S. S. (1978). Behavior modification applied to occupational safety. Journal of Safety Research, 10, 87-88.
Streff, F. M., Kalsher, M. J., & Geller, E. S. (1993). Developing efficient workplace safety programs: Observations of response covariation. Journal of Organizational Behavior Management, 13(2), 3-15.
Sulzer-Azaroff, B. (1978). Behavioral ecology and accident prevention. Journal of Organizational Behavior Management, 2, 11-44.
Sulzer-Azaroff, B., & De Santamaria, M. C. (1980). Industrial safety hazard reduction through performance feedback. Journal of Applied Behavior Analysis, 13, 287-295.
United States Bureau of Labor Statistics (1997). Safety and health statistics. Occupational Safety and Health Home Page, http:www.bls.gov\stat
United States Department of Health and Human Services & Public Health Services (1990). Healthy People 2000: National health promotion and disease prevention objectives. Special Research Report, Washington, D.C.: DHHS Publication No. (PHS) 91-50212.
Van Houten, R., & Nau, P. A. (1983). Feedback interventions and driving speed: A parametric and comparative analysis. Journal of Applied Behavior Analysis, 16, 253-281.
Van Houten, R., Nau, P. A., & Marini, Z. (1980). An analysis of public posting in reducing speeding behavior on an urban highway. Journal of Applied Behavior Analysis, 13, 383-396.
Waller, J. A. (1987). An overview of where we are and where we need to be. Proceedings of the 1987 Conference on Injury in America, U.S. Department of Health and Human Services, Public Health Service, Public Health Reports, 102, 590-591.
Weddle, M. G. (1996). Reporting occupational injuries: The first step. Journal of Safety Research, 27(4), 217-233.
Wilde, G. J. S. (1998). The concept of target risk and its implications for accident prevention strategies. In Feyer, A. M., & Williamson, A. (Eds.) Occupational Injury: Risk, prevention and intervention. Bristol, PA: Taylor & Francis Inc.
Wilson, J. K. (1985). The politics of safety and health. New York: Oxford University Press.
Winett, R. A. (1995). A framework for health promotion and disease prevention programs. American Psychologist, 50(5), 341-350.
Winett, R. A., King, A. C., & Altman, D. G. (1989). Health psychology and public health: An integrative approach. New York: Pergamon Press.
{PAGE }
Critical Success Factors for Behavior-Based Safety
{PAGE }
Zohar, D., Cohen. A., & Azar, N. (1980). Promoting increased use of ear protectors in noise through information feedback. Human Factors, 22(1), 69-79.