CRITICAL SEISMIC PERFORMANCE ASSESSMENT OF CONCRETE …
157
CRITICAL SEISMIC PERFORMANCE ASSESSMENT OF CONCRETE BRIDGE PIERS DESIGNED FOLLOWING CANADIAN HIGHWAY BRIDGE DESIGN CODE by Md Rashedul Kabir A THESIS SUBMITTED IN PARTIAL FULFILLMENT OF THE REQUIREMENTS FOR THE DEGREE OF MASTER OF APPLIED SCIENCE in THE COLLEGE OF GRADUATE STUDIES (Civil Engineering) THE UNIVERSITY OF BRITISH COLUMBIA (Okanagan) October 2017 © Md Rashedul Kabir, 2017
Transcript of CRITICAL SEISMIC PERFORMANCE ASSESSMENT OF CONCRETE …
CRITICAL SEISMIC PERFORMANCE ASSESSMENT OF CONCRETE BRIDGE
PIERS DESIGNED FOLLOWING CANADIAN HIGHWAY BRIDGE DESIGN CODE
by
Md Rashedul Kabir
A THESIS SUBMITTED IN PARTIAL FULFILLMENT
OF THE REQUIREMENTS FOR THE DEGREE OF
MASTER OF APPLIED SCIENCE
in
THE COLLEGE OF GRADUATE STUDIES
(Civil Engineering)
THE UNIVERSITY OF BRITISH COLUMBIA
(Okanagan)
October 2017
© Md Rashedul Kabir, 2017

ii
The undersigned certify that they have read, and recommended to the College of Graduate Studies
for acceptance, a thesis entitled:
CRITICAL SEISMIC PERFORMANCE ASSESSMENT OF CONCRETE BRIDGE PIERS
DESIGNED FOLLOWING CANADIAN HIGHWAY BRIDGE DESIGN CODE
Submitted by Md Rashedul Kabir in partial fulfillment of the requirements of the degree of Master
of Applied Science
Dr. M. Shahria Alam, Associate Professor, School of Engineering, UBC Supervisor
Dr. Solomon Tesfamariam, Professor, School of Engineering, UBC Supervisory Committee Member
Dr. Kasun Hewage, Professor, School of Engineering, UBC Supervisory Committee Member
Dr. Homayoun Najjaran, Professor, School of Engineering, UBC University Examiner
18 October 2017
(Date Submitted to Grad Studies)

iii
ABSTRACT
Performance-based design (PBD) method is gradually taking over the traditional force-
based design (FBD) for designing bridges in North America. Considering the importance of bridge
structures in the transportation network, quantitative performance criteria were adopted in
Canadian Highway Bridge Design Code (CHBDC) in 2014 and a supplement to CHBDC 2014
was published in 2016. In this study, a lifeline bridge pier is designed following the FBD method
from CHBDC 2010 and PBD approach following CHBDC 2014 and the supplement to CHBDC
2014 to understand the impression of changes in bridge design codes. The dominating performance
criteria in the new supplement to CHBDC 2014 for a lifeline bridge is the maintenance of
repairable damage at a seismic event of 975 years return period. The performances of the designed
bridge piers are assessed using 20 near-fault ground motions through incremental dynamic
analysis. Fragility curves for the bridge piers are plotted to perform the seismic vulnerability
analysis of the bridge piers designed following three different alternatives. A lifeline bridge pier
is also designed following PBD from CHBDC 2014 using different ASTM grade steel of varying
strength and fracture elongation in combination with different concrete strength. Performances of
the designed bridge piers are evaluated for site-specific ground motion suits. Moreover, the impact
of changing reinforcement strength on the designed bridge piers' seismic behavior is checked by
fragility analysis. PBD from the supplement to CHBDC 2014 shows the highest damage
probability. Whereas, the FBD from CHBDC 2010 and the PBD from CHBDC 2014 substantially
reduce the risk of damage and improve the performance of the bridge pier. Practicing high strength
steel reinforcement (HSR) in PBD of bridge piers can reduce the required percentage of
reinforcement by 50% compared to conventionally used Grade 60 reinforcement. Construction
difficulties can be avoided due to less congestion of rebars and cost of construction can be cut
down without compromising the seismic performance. Damage vulnerability related to
longitudinal steel strain reduces remarkably, and the collapse performance decreases when HSR
are practiced in the design of bridge piers. Incorporation of high strength concrete can marginally
improve the collapse performance.

iv
PREFACE
Major portions of this study have been submitted to peer-reviewed technical journals for
publications as listed below. All the analytical studies have been solely conducted, and the author
prepared the initial drafts of all the papers listed below. His research supervisor provided
continuous supervision and guided towards further development of the final versions of the
manuscripts by giving valuable feedback and revisions.
List of Publications Related to this study:
Kabir, M.R., and Alam, M.S. 2017. Seismic performance evaluation of force-based and
performance-based designed lifeline bridge pier following CHBDC. Submitted to Canadian
Journal of Civil Engineering.
Kabir, M.R., and Alam, M.S. 2017. Effect of material strength on the performance-based
design and dynamic performance of bridge piers as per CHBDC. Submitted to Bulletin of
Earthquake Engineering.

v
TABLE OF CONTENTS
ABSTRACT ................................................................................................................................... iii
PREFACE.. .................................................................................................................................... iv
TABLE OF CONTENTS ................................................................................................................ v
LIST OF TABLES .......................................................................................................................... x
LIST OF FIGURES ...................................................................................................................... xii
LIST OF SYMBOLS .................................................................................................................... xv
ACKNOWLEDGMENTS .......................................................................................................... xvii
Chapter 1 : INTRODUCTION........................................................................................................ 1
1.1 General ........................................................................................................................ 1
1.2 Research Significance ................................................................................................. 3
1.3 Objectives of the Study ............................................................................................... 3
1.4 Scope of the Research ................................................................................................. 4
1.5 Outline of the Thesis ................................................................................................... 5
Chapter 2 : LITERATURE REVIEW............................................................................................. 7
2.1 Bridge Design .............................................................................................................. 7
2.1.1 Force-based design (FBD) approach ........................................................................ 7
2.1.2 FBD in Canadian Highway Bridge Design Code ..................................................... 9
2.1.3 Performance-based design approach ......................................................................... 9
2.1.4 Performance-based design in bridges ..................................................................... 11
2.1.5 PBD limit states ...................................................................................................... 11
2.1.6 Seismic hazard ........................................................................................................ 13
2.1.7 Performance assessment guidelines in CHBDC ..................................................... 14
2.1.8 Fragility ................................................................................................................... 20
vi
2.1.9 Incremental Dynamic Analysis (IDA) approach of generating fragility ................ 21
2.2 High Strength Steel ................................................................................................... 23
2.2.1 Limitation on HSR .................................................................................................. 24
2.2.2 Ductility of steel reinforcement .............................................................................. 25
2.2.3 Manufacturing process of HSR ............................................................................... 26
2.2.4 ASTM A1035.......................................................................................................... 27
2.2.4.1 Chemical composition ..................................................................................... 29
2.2.4.2 Previous studies on ASTM A1035 .................................................................. 30
2.2.4.3 Flexure reinforcement ...................................................................................... 30
2.2.4.4 Shear reinforcement ......................................................................................... 31
2.2.4.5 Compression member ...................................................................................... 32
2.2.4.6 Development length ......................................................................................... 33
2.2.4.7 Ductility ........................................................................................................... 34
2.2.4.8 Corrosion performance .................................................................................... 34
2.2.4.9 Application in bridge ....................................................................................... 35
2.2.5 Prospect of HSR ...................................................................................................... 35
2.2.6 Cost and current applications .................................................................................. 37
2.2.7 Benefits of HSR ...................................................................................................... 37
2.2.8 High strength steel design consideration and limitations ....................................... 38
2.3 Summary ................................................................................................................... 38
Chapter 3 : SEISMIC PERFORMANCE COMPARISONS OF FORCE-BASED AND
PERFORMANCE-BASED DESIGNED BRIDGE PIER ........................................ 40
3.1 Background ............................................................................................................... 40
3.2 Validation of model ................................................................................................... 41
3.3 Geometry and Design of Bridge Piers Following CHBDC ...................................... 43

vii
3.4 Seismic Ground Motions ........................................................................................... 50
3.5 Performance Assessment ........................................................................................... 52
3.6 IDA Performance ...................................................................................................... 53
3.6.1 PGA vs. Maximum drift ......................................................................................... 54
3.6.2 Yield displacement.................................................................................................. 56
3.6.3 Crushing displacement ............................................................................................ 57
3.7 EDP and IM Relationship .......................................................................................... 58
3.7.1 Maximum drift % vs. PGA ..................................................................................... 59
3.7.2 Maximum drift % vs. Spectrum Intensity ............................................................... 60
3.8 Summary ................................................................................................................... 61
Chapter 4 : FRAGILITY ANALYSIS .......................................................................................... 63
4.1 Background ............................................................................................................... 63
4.2 Seismic Fragility ........................................................................................................ 63
4.3 Limit States (LSs) ...................................................................................................... 65
4.3.1 FEMA LSs .............................................................................................................. 66
4.3.2 CHBDC LSs............................................................................................................ 68
4.4 Probabilistic Seismic Demand Models ...................................................................... 69
4.5 Fragility Analysis ...................................................................................................... 71
4.5.1 Fragilities for FEMA specified DSs ....................................................................... 71
4.5.2 Fragilities for CHBDC specified DSs ..................................................................... 76
4.6 Summary ................................................................................................................... 77
Chapter 5 : EFFECT OF REINFORCING STEEL STRENGTH ON THE PERFORMANCE-
BASED DESIGN OF BRIDGE PIER ....................................................................... 79
5.1 Background ............................................................................................................... 79
5.2 Bridge Pier Geometry ................................................................................................ 79

viii
5.3 Material Properties .................................................................................................... 80
5.3.1 Steel......................................................................................................................... 81
5.3.2 Concrete .................................................................................................................. 82
5.4 Design of Bridge Pier ................................................................................................ 83
5.5 Analytical Model ....................................................................................................... 84
5.6 Performance-Based Design Following CHBDC 2014 .............................................. 86
5.7 Moment-Curvature Relationship ............................................................................... 89
5.8 Ground Motions ........................................................................................................ 90
5.9 Incremental Dynamic Analysis (IDA) ...................................................................... 91
5.10 Damage States ........................................................................................................... 93
5.10.1 FEMA damage states .............................................................................................. 94
5.10.2 CHBDC damage states ........................................................................................... 96
5.11 PSDMs ....................................................................................................................... 98
5.12 Fragility Analysis .................................................................................................... 100
5.12.1 Fragility curves for FEMA damage states ............................................................ 100
5.12.2 Fragility curves for CHBDC damage states.......................................................... 103
5.13 Effect of Transverse Reinforcement Strength ......................................................... 105
5.14 Summary ................................................................................................................. 109
Chapter 6 : CONCLUSIONS ...................................................................................................... 111
6.1 Summary ................................................................................................................. 111
6.2 Limitations of the Study .......................................................................................... 112
6.3 Conclusions ............................................................................................................. 112
6.4 Recommendation for Future Research .................................................................... 114
REFERENCES ........................................................................................................................... 116
APPENDICES ............................................................................................................................ 135

ix
Appendix A: Longitudinal Reinforcement Design for FBD................................................... 135
Appendix B: Effect of Transverse Reinforcement Strength on Design and Seismic
Performance ....................................................................................................... 138

x
LIST OF TABLES
Table 2.1 Descriptive and quantitative performance limits with engineering parameters ........... 12
Table 2.2 Performance criteria according to CHBDC 2014 and the supplement to
CHBDC 2014 ............................................................................................................... 16
Table 2.3 Performance criteria for a lifeline reinforced concrete highway bridge design ........... 18
Table 2.4 Available reinforcing steel ............................................................................................ 24
Table 2.5 Measures of ASTM A615 and ASTM A1035 steel rebars ........................................... 28
Table 2.6 Chemical composition of ASTM A1035 reinforcing bars............................................ 30
Table 2.7 Corrosion performance of different steel grades (Russell et al., 2011) ........................ 35
Table 3.1 Material properties used in model validation ............................................................... 42
Table 3.2 Performance criteria for reinforced concrete lifeline bridges (CSA, 2014) ................. 48
Table 3.3 Design cases and details ............................................................................................... 48
Table 3.4 Characteristics of the earthquake ground motion histories ........................................... 51
Table 4.1 Comparison of IDA and ISPA performance .................................................................. 67
Table 4.2 Damage states of bridge piers following FEMA .......................................................... 68
Table 4.3 Damage states of bridge piers following CHBDC........................................................ 69
Table 4.4 PSDMs for different design methods ............................................................................ 70
Table 4.5 Summary table I from fragility analysis ....................................................................... 74
Table 4.6 Summary table II from fragility analysis ...................................................................... 75
Table 5.1 Material properties of the steel grades used in analysis ................................................ 82
Table 5.2 Concrete properties used in analysis ............................................................................. 83
Table 5.3 Design details of the bridge pier following the supplement to CHBDC 2014 ............. 89
Table 5.4 Damage states of bridge piers in term of drift following FEMA.................................. 96
xi
Table 5.5 Damage states of bridge piers in term of drift (%) following CHBDC 2014 ............... 98
Table 5.6 PSDMs parameters for the designed bridge piers ....................................................... 100
Table 5.7 PGA at which the damage probability is 50% (FEMA LSs) ....................................... 103
Table 5.8 PGA at which the damage probability is 50% (CHBDC LSs) .................................... 105
Table 5.9 Design details of the bridge pier ................................................................................. 106
Table 5.10 PGA at which the damage probability is 50% (FEMA LSs)..................................... 107
Table 5.11 PGA at which the damage probability is 50% (CHBDC LSs) .................................. 108
Table B.1 LSs of bridge pier following FEMA for Drift% ........................................................ 139
Table B.2 LSs of bridge pier following CHBDC for Drift% ...................................................... 139

xii
LIST OF FIGURES
Figure 1.1 Thesis outline................................................................................................................. 6
Figure 2.1 Flowchart showing the steps in FBD method of bridge pier ......................................... 8
Figure 2.2 Ductility of structure.................................................................................................... 10
Figure 2.3 Graphical presentation of serviceability and limit states ............................................. 13
Figure 2.4 PBD for different types of bridges according to (a) CHBDC 2014 (b) supplement
to CHBDC 2014 ........................................................................................................... 14
Figure 2.5 Typical fragility plot .................................................................................................... 21
Figure 2.6 Generation of fragility plot following NLTHA ............................................................ 22
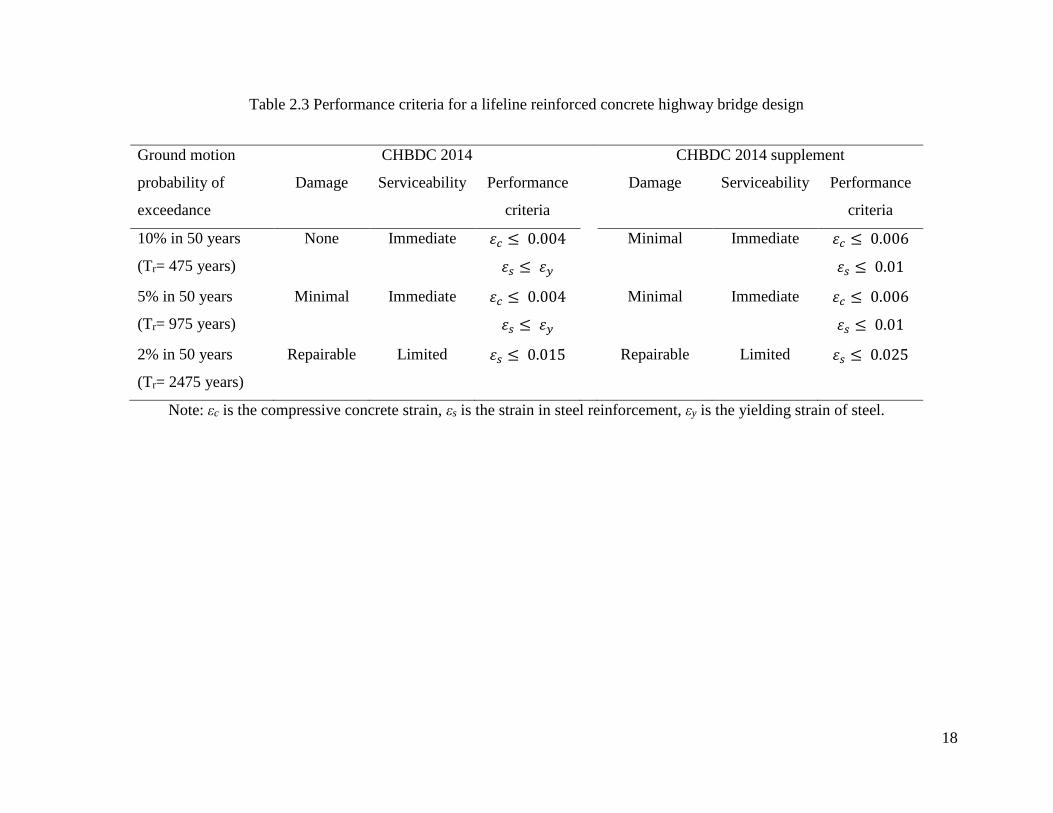
Figure 2.7 Typical stress-strain curve for different grade steel .................................................... 26
Figure 2.8 Final treatment process in manufacturing high strength steel ..................................... 27
Figure 3.1 Comparison of analytical results with experimental results from Correia et al.
(2008); (a) loading protocol (b) analytical validation ................................................. 43
Figure 3.2 Comparison of analytical results with experimental results from Restrepo et al.
(2006); (a) loading protocol (b) analytical validation ................................................. 43
Figure 3.3 Cross-section and elevation of steel reinforced concrete bridge pier .......................... 45
Figure 3.4 Static pushover analysis .............................................................................................. 49
Figure 3.5 Cross sections of designed bridge piers....................................................................... 50
Figure 3.6 Spectral motion records (a) original near-fault motions spectra (b) matched ground
motion spectra ............................................................................................................. 52
Figure 3.7 Maximum steel strain from time history analysis ....................................................... 53
Figure 3.8 IDA curve for maximum drift ...................................................................................... 54
Figure 3.9 IDA curve for yield displacement ................................................................................ 57

xiii
Figure 3.10 IDA curve for crushing displacement ........................................................................ 58
Figure 3.11 IDA performance: Maximum drift % vs PGA ........................................................... 60
Figure 3.12 IDA performance: Maximum drift % vs Acceleration Spectrum Intensity ............... 61
Figure 4.1 Limit states from pushover analysis ............................................................................ 67
Figure 4.2 Probabilistic seismic demand models (PSDMs) .......................................................... 71
Figure 4.3 Fragility curves for FEMA specified limit states (a) FBD pier, (b) PBD pier
following the supplement to CHBDC 2014 (c) PBD pier following CHBDC 2014 .. 73
Figure 4.4 Fragility curves for CHBDC limit states (a) PBD pier following the supplement to
CHBDC 2014 (b) PBD pier following CHBDC 2014 ................................................ 77
Figure 5.1 Elevation and cross-section of the reinforced concrete bridge pier ............................ 80
Figure 5.2 Stress-strain curves for various grades of steel rebar (from Graham and Paulson,
2008) ........................................................................................................................... 81
Figure 5.3 Determination of elastic stiffness ratio for circular section (from Paulay and
Priestley, 1992) ........................................................................................................... 84
Figure 5.4 Steel model under cyclic loading (Manegotto and Pinto, 1973) ................................. 85
Figure 5.5 Finite element modeling of bridge pier (a) 2-D model, (b) 3-D elevation and
(c) section model .......................................................................................................... 86
Figure 5.6 Load-displacement plot for bridge piers designed using different strength steel and
concrete ....................................................................................................................... 88
Figure 5.7 Moment-curvature relationship of designed RC bridge pier sections ......................... 90
Figure 5.8 Ground motion response spectra (a) original ground motions (b) design and
matched mean spectrum .............................................................................................. 91
Figure 5.9 IDA curves of the designed bridge piers...................................................................... 92

xiv
Figure 5.10 FEMA limit states from pushover analysis ............................................................... 95
Figure 5.11 CHBDC limit states from pushover analysis............................................................. 97
Figure 5.12 Probabilistic seismic demand models ........................................................................ 99
Figure 5.13 Fragility plots for FEMA limit states ...................................................................... 102
Figure 5.14 Fragility plots for CHBDC damage states ............................................................... 104
Figure 5.15 Fragility plots for FEMA damage states ................................................................. 107
Figure 5.16 Fragility plots for CHBDC damage states ............................................................... 108
Figure A.1 Column interaction diagram for FBD ....................................................................... 135
Figure B.2 Static pushover analysis curves ................................................................................ 138
Figure B.3 IDA curve for maximum drift ................................................................................... 138
Figure B.4 FEMA limit states ..................................................................................................... 138
Figure B.5 CHBDC limit states .................................................................................................. 139
Figure B.6 Probabilistic seismic demand models ....................................................................... 139

xv
LIST OF SYMBOLS
βEDPǀIM Dispersion Of The Demand
COV Coefficient of Variation
DS Damage State
EDA Elastic Dynamic Analysis
EDP Engineering Demand Parameter
εc Concrete Strain
εcc50 50% of Confined Concrete Strain
εcu Crushing Strain of Concrete
εst Steel Strain
εscr Buckling Strain of Longitudinal Rebar
εsm Steel Strain at Maximum Tensile Stress
εsu Fracture Strain of Steel
εy Yielding Strain of Steel
f’c Compressive Strength of Concrete
fcr Cracking Stress of Concrete
fsy Yield Stress of Steel
fyh Yield Strength of Transverse Steel
I Importance Factor
IDA Incremental Dynamic Analysis
IM Intensity Measure
ISPA Inelastic Static Pushover Analysis
Kcr Cracked Stiffness
LS Limit State
m Effective Mass
NLTHA Non-Linear Time History Analysis
PGA Peak Ground Acceleration
PGV Peak Ground Velocity
PSDM Probabilistic Seismic Demand Model
PSV Pseudo-Spectral Velocity

xvi
R Response Modification Factor
SI Spectral Intensity
S(T) Spectral Acceleration for a Certain Period, T
Ta Fundamental Period of Structure
UHS Uniform Hazard Spectrum
σc Compressive Stress in Concrete
σs Longitudinal Steel Strain
ρs Volumetric Ratio of Transverse Reinforcement

xvii
ACKNOWLEDGMENTS
On the eve of this great milestone of my life, I would like to take this opportunity to express
my unfathomed gratitude to the Almighty Allah for all the blessings to reach the pinnacle of this
achievement. However, this achievement would not be possible without the support of my
supervisor Dr. M. Shahria Alam from day one of this exciting journey of M.A.Sc. at the University
of British Columbia, Okanagan (UBCO). He has been an umbrella over my head through his
mentorship, continuous support, guidance, knowledge and above all his friendship, which have
shaped my research experience to an unforgettable one. He has always motivated me to dig deep
to bring the best out of myself. I cannot express enough my appreciation for his inevitable
contribution to pave me the right way during my research at UBCO.
I would like to express my appreciation for my master’s dissertation committee members,
Dr. Solomon Tesfamariam and Dr. Kasun Hewage for their guidance and support, which helped
me to ameliorate my research quality. I would like to acknowledge the excellent facilities and
support of UBCO to make my graduate experience a fruitful one. Additionally, grant like Queens
Scholarship has played an instrumental role in effectively conducting my research.
I would like to thank all my research group members, especially Dr. A.H.M.M. Muntasir
Billah, Dr. Farshad Hedayati Dezfuli and Mr. Qi Zhang for their guidance, which boosted up my
confidence during the difficult phases of my research. I was fortunate to have some fruitful
discussion and share the technical knowledge of research work with some excellent graduate
students of the research group. Their friendship and critical feedback helped me to a great extent
during this endeavor.
I would like to thank my parents for their unconditional support, which is the fundamental
inspiration for this achievement. Finally, I would like to thank my wife, Ismat Zahan Zerin, whose
spontaneous support, love and encouragement have ignited the spark in me in this journey and
every avenue of my life.

xviii
DEDICATED TO MY PARENTS
Md. Shahjahan Bhuiyan
&
Nargis Jahan

1
Chapter 1 : INTRODUCTION
1.1 General
Earthquake is one of most devastating unforeseen natural catastrophe. The disastrous
behavior of earthquake not only cost lives but also results in severe damage to structure and
economic loss. Transportation network of any country comprises of a substantial portion of
highway bridges. Any major damage to the bridges during seismic events causes breakdown of
transportation links (Chang and Nojima, 2001; Choi et al., 2004; Padgett and DesRoches, 2007),
leading to disruptive post-disaster service management. Extremely high cost and prolonged repair
time of damaged bridges make the situation even more critical causing interruption to the total
traffic system. Every year, billions of dollars are spent worldwide to repair damaged bridges and
to construct new ones. History demonstrates the high susceptibility of highway bridges to
earthquake damage. The 1971 San Fernando earthquake, the 1994 Northridge earthquake, the 1995
Great Hanshin earthquake in Japan, the 1999 Chi-Chi earthquake in Taiwan, the 2010 Chile
earthquake, and the 2010 Haiti earthquake showed the devastating nature of earth movement and
caused massive socioeconomic impact (Hwang et al., 2001). Twenty-five percent of bridges were
damaged during the Northridge Earthquake in Los Angeles, and six of them collapsed (Basöz et
al., 1999). Non-seismic design provision was the main cause of these collapses. Around $190
million was cost to repair the damaged bridges (Caltrans, 1994). The scenario in Canada is nothing
exceptional. Mirza (2007) reported that the municipal infrastructure deficit had reached 123 billion
dollars of which more than 30% is in transportation and transit sector in Canada. The sheer
importance of bridges to the economy of Canada cannot be ignored. So, it is absolutely important
that the bridges stay active even after massive earthquakes (Billah et al., 2013).
Keeping a bridge system functional during and after a seismic event is challenging. To
minimize the adverse effect from an earthquake, maximum drift in the bridge pier needs to be
limited (Billah and Alam, 2014a). Bridge piers experience huge lateral deformation in a traditional
structural system and unrepairable damage at the plastic hinge regions due to excessive
deformation during an earthquake. Predicting and controlling the deformation in bridge piers
following the traditional force-based seismic design (FBD) process is merely possible due to some
limitations (Priestley, 2000). To consider the inelastic response of the structure, R factor is used in
2
FBD approach, which is represented by the displacement ductility. This R factor reduces the elastic
base shear demand to an acceptable design level. However, it does not assure any definite
performance level (Sheikh and Légeron, 2014). The R value is chosen based on the assumed
ductility of a bridge pier, but this R value can vary notably with the geometry of the structure and
target performance level. Employing single R factor for multilevel performance and different
structural elements may not be suitable. Next limitation of FBD is the constant stiffness
presumption of the structure. The stiffness and force distribution varies with the changed
deformation of the structure, and the yielding of structural elements occurs gradually; not at a time.
Lastly, the key shortcoming is that the FBD cannot clearly describe the performance of the bridge
structure to a certain level. To deal with these limitations of FBD approach, engineers have
established alternative seismic design methodologies based on the performance of structural
elements and materials than strength, which is termed as performance-based design (PBD). This
design method reasonably eliminates the performance uncertainties in the traditional FBD method
with specific and quantitative performance criteria. Since the force in not measurable during an
actual seismic event, the PBD approach regards specified performance levels regarding drift ratios
and material strains. Client based approach can also be considered in PBD as long as it explicitly
demonstrates the performance levels to acceptable risks and associated costs (Priestley et al.,
2007). Due to flexible design methodology meeting the performance requirement of structure
regarding damage and serviceability, bridge designers are leaning towards the PBD.
The Canadian highway bridge design code (CHBDC) recently incorporated the PBD (CSA,
2014). Depending on the bridge type, the required serviceability and damage states are defined in
terms of material strain in CBDC 2014. However, very limited information is available on the
comparative performance of bridge piers designed following FBD and PBD. Zhang et al. (2016)
investigated the comparative design and performance of FBD and PBD bridges and concluded that
the PBD is too conservative leading to high reinforcement requirements and cost. However, a new
and improved supplement to CHBDC 2014 (CHBDC, 2016) has recently been published with a
substantial change in performance criteria for the PBD. To date, there is no study has been
conducted on how the performance of bridge changes for the adoption of different design methods
from CHBDC regarding probability-based seismic vulnerability. This study will play a significant
role in giving an idea of the seismic performance of steel reinforced concrete bridge pier designed
following different design guidelines; using a widely used tool, fragility curve, which gives a view

3
on the vulnerability of structural components. How the design changed during past seven years in
CHBDC will also be investigated through the design of a lifeline bridge pier. With the evolution
of PBD, fragility analysis getting the attention to assess the performance and seismic risk of the
bridges to be constructed. An elaborate understanding will also be presented here to show the
importance of high strength longitudinal steel on bridge design process and seismic performance
for near-fault ground motions.
1.2 Research Significance
A Recent report from Natural Resources Canada (NRC) revealed that the western part of
BC is the highly active seismic region with more than 200 seismic tremors a year (NRC, 2017).
On an average 1500 earthquake occurs in Canada per year of which only 6.7% are more than three
magnitudes in Richter scale and felt by humans. The Pacific-North American plate boundary along
the west coast of the United States and Canada consists of the Juan de Fuca subduction fault off
the Vancouver Island and the Cascadia subduction zone “megathrust fault’ along the Northern
Vancouver Island to Cape Mendocino California are pushing against each other creating a
probability of 9 magnitudes of earthquake. Even the small magnitude earthquake can be
devastating if it happens for a longer duration. Considering these facts, necessary precautions and
understanding of current design practice of bridges are indispensable to oblige the saying
“precaution is better than cure”. Moreover, to study the suitability of higher grade reinforcing steel
and high strength concrete in seismic application to avoid congestion during construction and
reduce material demand while maintaining superior performance triggered the motivation behind
this research.
1.3 Objectives of the Study
With the advancement in design methodology and material properties, PBD and choice of high
strength steel as reinforcement in reinforced concrete structures are receiving special attention.
The primary objective of this research is to investigate the design evolution in CHBDC from FBD
method to PBD method in last decade for a lifeline bridge and performance assessment of a bridge
pier designed using different steel alternatives. To thoroughly understand the effect of high
strength steel reinforcements (HSR) on design and seismic performance of bridge pier, different
4
steel grades are combined with varying concrete strength. The specific tasks to achieve these
objectives include:
Comparing the seismic design methodology and the design outcomes of a lifeline bridge
pier designed following CHBDC 2010, CHBDC 2014 and the supplement to CHBDC
2014.
Assessing the performance of the designed bridge piers by conducting incremental
dynamic analyses under near-fault ground motions.
Evaluating the dynamic response of a lifeline bridge pier designed following PBD design
method from CHBDC 2014 using reinforcing steels and concrete of varying strength.
1.4 Scope of the Research
This particular research focuses on the design evolution in CHBDC for a lifeline bridge
pier and introduces the importance of steel strength in design. Unlike before, HSR are presently in
mass production. However, application of HSR are very limited in Canada. Also, the design
philosophy has changed after the adoption of PBD method in CHBDC 2014 (CSA, 2014). It is
important to understand how these changes affect the dynamic response of a bridge pier and what
reinforcing steel strength can offer in improving bridge performance. To accomplish the goals of
this research, literature reviews on PBD of bridge piers and application of HSR are carried out
first. A hypothetical bridge pier is selected to be designed following the FBD specified in CHBDC
2010 (CSA, 2010) and the PBD criteria stated in CHBDC 2014 and the new supplement to
CHBDC 2014 (CHBDC, 2016). Design difference and dynamic response of these bridge piers are
evaluated under near-fault ground motions. Finally, a lifeline bridge pier is designed using
different steel reinforcement having code specified yield and elongation properties according to
the most recent CHBDC guidelines. There have been many studies on bridge fragilities present in
the literature on bridges in Canada that includes Tavares et al. (2012), Siqueiraa et al. (2014),
Dezfuli and Alam (2017), and Parghi and Alam (2017). None of these studies have worked on
fragility analysis and dynamic response assessment of the same bridge pier designed following
different design alternatives and using varying strength steel reinforcements. This study will
address the issues mentioned above, which will direct the design engineers towards the proper
selection of design and reinforcing material.

5
1.5 Outline of the Thesis
This thesis contains six chapters including the present chapter ‘Introduction’. This chapter
outlines the main goals of this research along with the breakdown of steps to achieve the specified
goals. Significance and scope of this study are also presented here. The dissertation contents are
arranged in following chapters.
Chapter 2 portrays an overview of HSR application in bridge and building component
design. History and development of high strength steel rebars, their manufacturing process,
significant properties and application in structural engineering are discussed in light of existing
studies. Philosophy and basics of PBD are also presented in this chapter focusing on bridges only.
The necessity of PBD and importance of high strength steel in designing bridges are concluded in
this chapter.
Chapter 3 explains the force-based and PBD methodology of a bridge pier according to
CHBDC 2010, CHBDC 2014 and the supplement to CHBDC 2014 with design examples. Static
pushover analyses and non-linear time history analyses are performed to assess the responses of
the designed bridge piers. Incremental dynamic analyses (IDA) for twenty near-fault ground
motion are carried out to plot the IDA responses for maximum hazard level, and the results are
compared for the designed bridge piers.
Fragility analysis is a strong tool to evaluate the seismic performance of existing bridges
and bridges to be built. In Chapter 4, analytical fragility analyses of the designed bridge piers are
done by developing probabilistic seismic demand models. Fragilities are plotted in terms of
maximum drift in bridge piers for four different damage states to predict the performance of the
bridge piers under varying ground motion intensities.
Chapter 5 deals with the application of HSR and high strength concrete in PBD of bridge
piers. Performance criteria for bridge piers stated in CHBDC 2014 are utilized in designing a
lifeline bridge pier. Final design outcomes and their comparative performances are also discussed
in this chapter in term of IDA plots and fragility curves.
Lastly, summary and conclusions from this study, discussion on limitations and future
recommendations in this research area are proposed in Chapter 6.

6
Title
Seismic performance evaluation of bridge piers designed
following Canadian Highway Bridge Design Code
Chapter 1: Introduction
Introduction and thesis organization.
Chapter 2: Literature review
Current practice in performance based design of bridges.
Applications and scope of high strength steel reinforcement in structural design.
Chapter 3: Seismic performance comparisons of force-based
and performance-based designed bridge pier
Analytical validation of experimental tests on bridge column.
Design of a lifeline bridge following FBD and PBD method specified in CHBDC.
Numerical study on dynamic performance of the bridge piers.
Chapter 4: Fragility analysis
Probabilistic seismic demand model generation for the bridge piers.
Development of fragility curves in terms of maximum drift.
Chapter 6: Conclusions
Summary and conclusions.
Limitations and future recommendations.
Chapter 5: Effect of concrete and reinforcing steel strength on
the performance-based design of bridge pier
Design a lifeline bridge following PBD method using different strength steel
reinforcements and concrete.
Investigation on the seismic performance of the designed bridge piers.
Figure 1.1 Thesis outline

7
Chapter 2 : LITERATURE REVIEW
2.1 Bridge Design
Bridges are an essential part of transportation network of a country and contribute actively
in the sustainable development process. Disruption in this transportation network due to
undesirable natural calamities can cause serious damages to life and economy. After the
devastating 1971 San Fernando earthquake, researchers put extra effort in investigating the seismic
effect on bridges, which acted as the turning point in the seismic design of structures. Many of the
investigations on previous earthquakes show the deficiency in the design of bridges (Saiidi, 2011).
However, recent post-earthquake field observations reveal that the bridges designed following
modern design practices performed far better than the old bridges (Basöz et al., 1999; Hsu and Fu,
2004). Many of the existing highway bridges in North America were built when the seismic design
was in the early stage of development (Roy et al., 2010). After the Loma Prieta earthquake in 1989,
Northridge in 1994, and Kobe in 1995, engineers and stakeholders perceived the essence of
designing and retrofitting structures to attain performance objectives, ensure life safety and lessen
the damage cost associated with earthquakes. To improve the ductility of structure, the seismic
design evolved from force-based to displacement-based design (Kowalsky et al., 1995;
CALTRANS, 2004; ATC, 2003).
2.1.1 Force-based design (FBD) approach
FBD method was the most common design approach in designing buildings and bridges
traditionally. To find out the demand on structure, load factors are associated with plastic range
capacity of the structure (Allen, 1975). Figure 2.1 portrays a typical flow chart of designing a
bridge pier following the FBD approach.
FBD approach possesses some inherited drawbacks such as the exclusion of varying
stiffness with deformation in calculating time period of structure, uniform force reduction factor
and concurrent yielding of elements (Priestley et al., 2007). Most importantly, FBD cannot
establish a connection between structural performance and design. Ghobarah (2001) showed that
the FBD method was not an effective design procedure to restrict damage in structures during
large-scale earthquakes. Displacement was considered the main factor in designing bridges to

8
avoid the constraints related to FBD method by Priestly et al. (2007). The effective stiffness of the
structure and displacement demand have to be calculated to find out the seismic base shear demand
in displacement-based design. Many researchers found the direct displacement-based design very
efficient and cost-effective in designing bridge structures (Kowalsky, 2002; Ortiz, 2006; Suarez
and Kowalsky, 2006; Bardakis and Fardis, 2010). Reza (2012) studied the differences in FBD and
displacement-based design regarding the design of a bridge with irregular column heights.
However, a study from Reza et al. (2014) found that the FBD designed bridge performs better than
direct-displacement based designed bridges in terms of displacement demand, residual
deformation and cumulative energy dissipation capacity.
Figure 2.1 Flowchart showing the steps in FBD method of bridge pier
9
2.1.2 FBD in Canadian Highway Bridge Design Code
Canadian Highway Bridge Design Code till 2006 was mostly focused on the FBD of
bridges. Elastic force demand from a particular site soil class and design response acceleration are
calculated from the elastic stiffness of the structure. Ductility of the structure is assumed through
incorporating a response modification factor, R based on the bridge configuration and expected
performance level are treated with importance factor, I. Bridges are designed for the modified base
shear demand but do not assure a target performance during a particular level of earthquake. The
value of response modification factor (R) should vary with multiple performance levels, and the
importance factor (I) should be related to the bridge properties and seismicity of the region (Sheikh
and Légeron, 2014). National building code of Canada (NBCC) (NRCC, 2010) announced the
increased seismic hazard levels for some regions in Canada. This initiated the obligation to
evaluate the existing design of bridges and design of the to-be-built bridges. Bridge design codes
such as AASHTO (2007), CHBDC 2010 (CSA, 2010) commonly use the FBD approach; however,
there had been significant changes in terms of design and detailing to ensure ductility in the bridge
structure (Mitchell et al., 2010).
2.1.3 Performance-based design approach
Modern bridges should be designed to satisfy the deformation requirement without any
major damage to the structure. Higher energy dissipation capacity exhibits ductility in structure
and allows them to deform in their inelastic region with a prior warning before failure. Plastic
hinge location experiences the highest material strain under a seismic action and is critically
designed to dissipate energy. Flexure failure is expected over brittle shear failure in structure.
Global ductility of the structure depends on element level ductility and material ductility (Figure
2.2).

10
Figure 2.2 Ductility of structure
Performance-based seismic design of bridges can ensure the targeted performance while
minimizing the economic losses and reducing the post-earthquake service demands (Floren and
Mohammadi, 2001). A major benefit in PBD is that the PBD can minimize the uncertainties in
traditional FBD method with specified performance criteria regarding displacement, drift or
material strain limit. Life safety is the main concern in the FBD, whereas the PBD not only ensures
that but also reduce post-disaster damage by ensuring the desirable performance of the structure.
This widely reviewed design method for bridges is still in development process. Many design
codes are yet to consider and implement the PBD method. The first initiation of PBD was in the
1980s in the United States and the reason behind was to get clear performance indication during
and after a seismic event by the retrofitted buildings as demanded by the investors (Hamburger et
al., 2004). The comparative performance assessment before and after retrofitting of a structure is
critical for the safe investment by the project owners. Since then, PBD framework is being
practiced and researched for several decades by engineers and researchers. Initial developments
were focused on buildings as can be seen in many published documents like ATC 13 (ATC, 1985),
ATC 14 (ATC, 1987) and FEMA-356 (FEMA, 2000c). The design of bridges is somewhat similar
to the design of buildings. Reducing damage by protecting life safety and optimizing the cost are
invariably the core of all structural design. Designers and engineers have taken many attempts to
relate the structural performance to its serviceability. Performance-based assessment of bridge
example was carried out by Forcellini et al. (2012) using the program BridgePBEE (Lu et al.,
2011), which has the capability of running dynamic analysis of bridge structures and predicting
11
probable damage and loss along with the repairing time and cost. Most of the construction and
rehabilitation projects of structures principally depend on the financial feasibility.
2.1.4 Performance-based design in bridges
Performance prediction of bridges has been extensively investigated by researchers in
recent years. Priestley (2000), Floren and Mohammadi (2001), Mackie and Stojadinović, (2007),
Saiidi (2011), Dawood and ElGawady (2013), Billah and Alam (2014b), Khan and Jiang (2015),
Zhang et al. (2016) incorporated the PBD approach in investigating the bridge performance. First
generation PBD of bridges based on drift, ductility and material strain response was summarized
in National Cooperative Highway Research Program (Marsh and Stringer, 2013). There are few
limitations of this first generation PBD specified by Hamburger et al. (2004). The weakest
component dominates the global response leading to an overly conservative design. Damage in the
non-structural members and their associated cost cannot be measured accurately. However, there
may be possibility of higher damage cost in non-structural members than structural components.
Also, it cannot correlate the performance with the coded design procedure, repair cost and time
(Zhang, 2015). The next generation PBD methodology considered the uncertainties as started in
2001 the project ATC-58 (Hamburger et al. 2004) and completed in 2007 to bridge between
engineers and clients. The phase two of the project commenced in 2012 and are expected to be
finished in 2017. Repairing bridges is an important issue since almost fifty percent of the bridges
in the USA were built before 1935 and reaching towards the end of their lifespan (Golabi and
Shepard, 1997). To prioritize the retrofitting based on performance criteria, Gordin (2010) studied
multi-criteria decision making (MCDM) in rehabilitating bridges and presented a decision matrix
considering the damage severity, method of repairing, risk, construction supports and others.
2.1.5 PBD limit states
CHBDC adopted PBD method in 2014. Before that, the performance levels were merely
descriptive in the CHBDC and the design engineers were not required to explicitly check the
seismic performance of the bridge. A clear guideline based on quantitative performance limit was
first introduced in CHBDC 2014 (CSA, 2014). Conflicting design outcomes following two
different design approaches (Zhang et al., 2016) led to further modification in performance criteria
specified in CHBDC 2014. Sheikh and Légeron (2014) showed that the bridge designed following

12
the CHBDC 2006 did not satisfy the performance objectives automatically. They correlated the
engineering parameters with the bridge performances and outlined an implicit seismic design
method to achieve target performance. Correlated engineering parameters with the performance
levels and the limit states (LSs) from Sheikh and Légeron (2014) are shown in Table 2.1 and Figure
2.3 correspondingly.
Table 2.1 Descriptive and quantitative performance limits with engineering parameters
Limit
state
Performance
level
Serviceability Performance description Quantitative
criteria
1A
1B
Fully
functional
Serviceable No or few easily repairable
cracks.
Yielding of main
reinforcement
𝜎𝑐 = 𝑓𝑐𝑟
= 0.4√𝑓𝑐′
𝜎𝑠 = 𝑓𝑠𝑦
2 Delayed
operation
Limited service
only
Concrete starts spalling and
longitudinal cracks develop.
Inelastic deformation initiates
𝜀𝑐 = −0.004
𝜀𝑠 = 0.007
3 Stable Closure Crushing of core concrete with
strength degradation, buckling
of longitudinal reinforcement,
fracture of confinement.
𝜀𝑐 = 𝜀𝑐𝑐50
𝜀𝑠 = 𝜀𝑠𝑐𝑟
𝜀𝑠 = 𝜀𝑠𝑢
= 0.07
Note: f’c= compressive strength of concrete; σc= stress in concrete; fcr= cracking stress of concrete;
σs= longitudinal steel strain; fsy= yield stress of steel; εc= concrete strain; εs= steel strain; εcc50=
50% of confined concrete strain; εscr= buckling strain of main rebar; εsu= fracture strain of steel.

13
Figure 2.3 Graphical presentation of serviceability and limit states
2.1.6 Seismic hazard
The probabilistic approach that presents the maximum probability of exceedance is
considered in various seismic design guidelines (Roy et al., 2010). The design earthquake hazard
level in CHBDC 2000 (CSA, 2000) had the return period of 475 years, but the recurrence period
for the extreme events varied from 1000 (CSA, 2000) to 2500 years (ATC, 2003). Later on,
uniform hazard spectrum (UHS) at 2% in 50 years (2500 year return period) was developed by the
Geological Survey of Canada (Adams and Halchuk, 2003). National Building Code of Canada,
NBCC 2005 (NRCC, 2005) added the new UHS that significantly influenced the seismic design
of structures. To design a bridge, CHBDC 2010 considers the earthquake of 10% probability in 50
years (return period 475 years). However, current CHBDC (CSA, 2014) employs three design
level earthquakes in defining the performance objectives. The return period is commonly used to
define the level of seismic events. A Poisson model described by Wang (2006) as shown in the
Equation 2.1 presents the probability of n earthquakes happening within a time period of t years.
𝑃(𝑛, 𝑡, 𝜏) =𝑒
−𝑡𝜏 (
𝑡
𝜏)𝑛
𝑛! (2.1)
Here, τ is the recurrence interval of an earthquake equal or greater to a specific magnitude.
Probability of design earthquake occurring at least once can be predicted by
𝑃(𝑛 ≥ 1, 𝑡, 𝜏) = 1 − 𝑒−𝑡
𝜏 (2.2)

14
In CHBDC 2014, the lower level earthquake has the return period of 475 years that means
10% probability in 50 years. Eurocode also exercises the similar level of earthquakes for the design
level (Marsh and Stringer, 2013). Most of the bridges like Desmond Bridge, Tacoma Narrows
Bridge were designed for the lower level event where the return period was not more than 100
years (Jones et al., 2013). Later on, the Port Mann Bridge and the Willamette River Transit Bridge
were designed considering lower level design earthquake of return period 475 years. Target
performance for the bridges mentioned above was to ensure elastic behavior with a little inelastic
response. The performance-oriented design protocols as per CHBDC 2014, and the supplement to
CHBDC 2014 for different types of bridges are shown in Figure 2.4.
(a) (b)
Figure 2.4 PBD for different types of bridges according to (a) CHBDC 2014 (b) supplement to
CHBDC 2014
2.1.7 Performance assessment guidelines in CHBDC
CHBDC (CSA, 2014) divides the bridge types into three categories: i) lifeline bridge, ii)
major route bridge and iii) others. Lifeline bridge is the most critical, major and unique bridge,
which possesses significant impact on the economy. Any service disruption in lifeline bridges
during and post-disaster emergency hampers the economic recovery. Usually, this type of bridges
are large in shape and requires a fortune in construction. Repairing a lifeline bridge costs a great
deal of money and time. Port Mann Bridge, Second Narrows Bridges, and Oak Street Bridge are
few examples of lifeline bridges in Canada. Major route bridges serve as post-disaster emergency
response bridges. Emergency routes must be kept open after a seismic event and essential for
15
effective transportation and economy following an earthquake. It has the highest priority in
retrofitting after lifeline bridge. Routes in Vancouver Island and the Lower Mainland can be
considered as the major routes or disaster response routes. Major route bridges are also important
for security and defense purposes. Bridges that are not included in the above two categories and
less important in emergency response and post-disaster rehabilitation, are classified as other types
of bridges.
Performance criteria in different codes are distinct for varying level of design. In most of
the design guidelines, the performance criteria are mainly descriptive. No quantitative performance
limits are set in terms of material strain or drift capacity of the structure. In New Zealand bridge
manual (NZ-Transport, 2014), Chinese Specifications of Earthquake Resistant Design for
Highway Engineering (China-MOC, 2008), LRFD (Load Resistance Factor Design) seismic
analysis and design of bridges reference manual (FHWA-NHI, 2014), performance criteria are in
more generalized form (Chen and Duan, 2013). Performance criteria were described previously in
CHBDC 2010 (CSA, 2010) but quantitative limits were set in 2014 (CSA, 2014). These criteria
vary with design levels and bridge types. CHBDC adopted material strain as the performance
indicator of bridge structures. Usually, a structure is designed for the lower level of seismic event
and checked for higher level events (Zhang, 2015). Life safety, serviceability, and economic
criteria are the basis for the design of bridges for different level earthquakes. A bridge should
remain serviceable when designed for a lower level earthquake, and the life safety should be
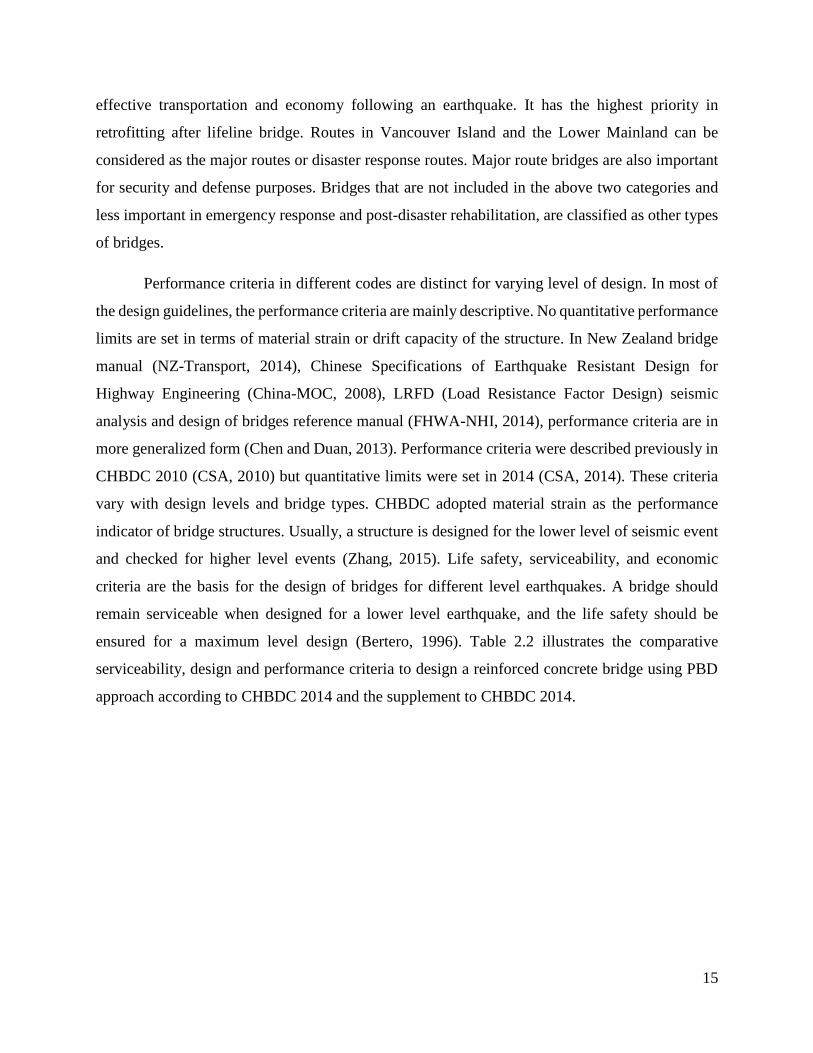
ensured for a maximum level design (Bertero, 1996). Table 2.2 illustrates the comparative
serviceability, design and performance criteria to design a reinforced concrete bridge using PBD
approach according to CHBDC 2014 and the supplement to CHBDC 2014.
16
Table 2.2 Performance criteria according to CHBDC 2014 and the supplement to CHBDC 2014
Damage Serviceability Performance criteria
(CHBDC 2014)
Performance criteria
(CHBDC 2014
supplement)
Minimal
Fully serviceable to regular
traffic. Any repair work does
not hamper the service.
Bridge remains elastic with
minor damage.
Concrete
compressive strain
should be less than
0.004, and
reinforcing bars
should not yield.
Compressive strain
limit in concrete is
0.006, and tensile
strain in steel should
not exceed 0.01
Repairable
Usable to emergency traffic.
Repairing can be done
without bridge closure.
Moderate damage due to
some inelastic behavior. But
repairing can be done in place
without replacing any
primary component.
Tensile strain in
reinforcing steel
cannot exceed 0.015
Maximum tensile
strain in reinforcing
bars must not cross
0.025
Extensive
Bridge closure might require
for repairing purpose and
restricted emergency use.
Visible damage due to
concrete spalling and bar
bucking. Bridge behavior is
in inelastic range.
Confined concrete
should not crush.
Maximum allowable
tensile strain in steel
bar is 0.05
Core concrete strain
should not exceed
80% of the maximum
confined strain limit.
Allowable tensile
strain in steel is 0.05.
Probable
replacement
Bridge is in near collapse
condition but evacuation
should possible to maintain
life safety. The bridge
becomes unusable. Needs
extensive repair work or
replacement in some cases.
No criteria in terms
of material strain are
specified.
Confined concrete
should not crush.
Reinforcement strain
should not exceed
0.075. For 35M or
higher rebar size, the
limit is 0.06.

17
FBD is not permitted for a lifeline bridge in the recent CHBDC 2014 (CSA, 2014) code.
However, before that, a lifeline bridge was used to be designed using FBD method following the
criteria that the bridge has to remain open to traffic for a lower level seismic event (475 years of
return period) (Billah and Alam, 2016a). The minimum performance level specified for a lifeline
bridge has been changed in the new supplement to CHBDC 2014. For ground motion with 10%
probability of exceedance in 50 years, a lifeline bridge should not have any damage (CSA, 2014).
In the supplement to CHBDC 2014, this damage criterion has been relaxed to minimal damage
unless otherwise required by authority (CHBDC, 2016). Major modifications in the highway
bridge design code happened to the performance criteria for different damage and serviceability
conditions. For a ground motion with a return period of 975 years (probability of exceedance is
5% in 50 years), the damage in the lifeline bridge should be minimal, and it should be fully
serviceable to the regular traffic, and no service disruption is expected from repair works (CSA,
2014). In the case of an extreme event with a return period of 2475 years, a lifeline bridge can
offer limited service being accessible for emergency traffic only. Repairing should be done without
any closure to the bridge, and at least one lane must be active during the repairing process. In
designing a reinforced concrete bridge structure following PBD method, performance limits are
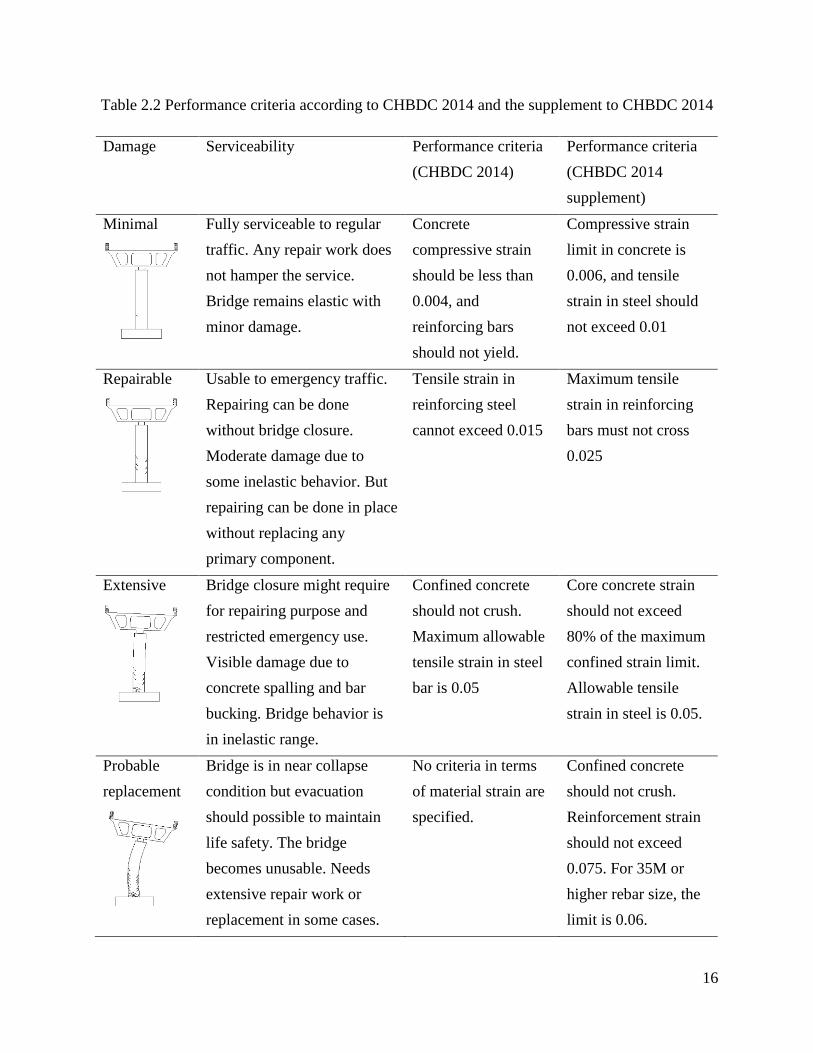
set in term of concrete and reinforcing steel strain to satisfy the serviceability conditions. Table
2.3 displays the comparative performance criteria stated in CHBDC 2014 and the new supplement
that has to be fulfilled in designing a regular lifeline bridge following the PBD approach.
18
Table 2.3 Performance criteria for a lifeline reinforced concrete highway bridge design
Ground motion
probability of
exceedance
CHBDC 2014 CHBDC 2014 supplement
Damage Serviceability Performance
criteria
Damage Serviceability Performance
criteria
10% in 50 years
(Tr= 475 years)
None Immediate 𝜀𝑐 ≤ 0.004
𝜀𝑠 ≤ 𝜀𝑦
Minimal Immediate 𝜀𝑐 ≤ 0.006
𝜀𝑠 ≤ 0.01
5% in 50 years
(Tr= 975 years)
Minimal Immediate 𝜀𝑐 ≤ 0.004
𝜀𝑠 ≤ 𝜀𝑦
Minimal Immediate 𝜀𝑐 ≤ 0.006
𝜀𝑠 ≤ 0.01
2% in 50 years
(Tr= 2475 years)
Repairable Limited 𝜀𝑠 ≤ 0.015 Repairable Limited 𝜀𝑠 ≤ 0.025
Note: εc is the compressive concrete strain, εs is the strain in steel reinforcement, εy is the yielding strain of steel.

19
A seismic performance category is assigned to every bridge based on the fundamental
period of the structure, bridge type and the site-specific spectral acceleration for the high-level
seismic event with 2475 years return period. Lifeline bridges falls in the performance category two
according to CHBDC 2014 (CSA, 2014) when T< 0.5s and S(0.2)< 0.20 or T≥ 0.5s and S(1.0)<
0.10 (here, T is the fundamental period of bridge structure, and S(Ta) is the site-specific spectral
acceleration for a particular period). In the recently published supplement to CHBDC 2014
(CHBDC, 2016), the performance category changed to one for the same criteria for a lifeline bridge
where no analysis for seismic loads is required. For all other scenarios, the lifeline bridge includes
in the performance category three. CHBDC 2014 recommends elastic dynamic analysis (EDA),
inelastic static pushover analysis (ISPA) and non-linear time history analysis (NLTHA) for a
regular lifeline bridge in the seismic events with 2% and 5% exceedance probability in 50 years.
The new supplement to CHBDC 2014 (CHBDC, 2016) only requires the EDA and ISPA for regular
lifeline bridges. The ISPA should account the non-linear response due to the formation of the
plastic hinge in the ductile bridge elements and the soil-structure interaction (SSI), and P-delta
effect need to be considered as applicable.
Roy et al. (2010) studied the retrofitting of a bridge bent using carbon fiber reinforced
polymer (CFRP) following the performance-based approach. A one-third scale model of the bridge
bent was experimentally tested to achieve certain limit states of the bridge with increasing intensity
of loading. They concluded that the CHBDC 2010 performance criteria are very conservative and
less economical. Zhang et al. (2016) investigated the effect on the design of bridge piers due to the
changes in CHBDC code from force-based to PBD. A four span real-life reinforced concrete bridge
with multiple column bridge bent was considered for the analysis. The major route bridge was
designed following CHBDC 2006 (CSA, 2006) and CHBDC 2014 (CSA, 2014) specified FBD
methods and the PBD method. The FBD method in CHBDC 2014 allows designing a major route
bridge for 2475 years return period earthquake. However, before that, the design was restrained to
earthquakes with 475 years return period. PBD permits design for all three levels of hazard. They
found the longitudinal reinforcement requirement almost double in case PBD than that of FBD
following CHBDC 2014 making the design overly conservative. Though the high reinforcement
ratio limits the damage in the structure, it also causes problems in construction due to congestion.
The performance limit states used in their study has now been changed in the new supplement to
CHBDC 2014. Time history analyses were done to assess the performance of the bridge in terms

20
of strain limits. However, the study did not provide any specific solution to this issue related to
high reinforcement ratio requirements. Also, how the dynamic response of bridges and their
seismic vulnerability are affected by using different design alternative were not presented. Study
on the design of lifeline bridges is limited in literature allowing space for possible research. The
performance criteria requirements are also higher and more conservative in lifeline bridges than
major route bridges considering their importance. It is important to understand the design evolution
of lifeline bridge in CHBDC from FBD to PBD and their dynamic response to facilitate decision
making analyzing all the design alternatives. The strength of steel can contribute greatly in design
by reducing congestion. Moreover, employing different strength reinforcing bars in the design will
satisfy the material strain criteria in different stages. Ductility of steel is also an important concern
during the dynamic action to predict the probable performance of the structure. Copious amount
of inspection is required to understand the effect and contribution of reinforcing steel strength in
PBD. This particular study focuses on the design evolution in CHBDC for a lifeline bridge and
impact of reinforcing steel properties on PBD following the supplement to CHBDC 2014
guidelines through extensive dynamic analysis.
2.1.8 Fragility
PBD technique ensures predefined performance during seismic motions, unlike the
conventional design method. The uncertainties in the hazard and structural responses are counted
in the probabilistic method in PBD. With the advancement in PBD, the seismic performance
assessment of structure is gaining attention from both the academic and professionals. Fragility
plots are a very popular seismic assessment tool that presents a conditional probability of demand
exceeding the capacity of a structural component for a given intensity measure (Karamlou and
Bocchini, 2015). The conditional probability is presented in Equation 2.3.
𝐹𝑟𝑎𝑔𝑖𝑙𝑖𝑡𝑦 = 𝑃[𝐿𝑆|𝐼𝑀 = 𝑦] (2.3)
Here, LS is the limit state of the structural component and IM is the intensity measure of
ground motion. For a specific ground motion intensity, fragility plot presents the probability of
particular damage that can happen to the structure. A typical fragility function is shown in Figure
2.5. There are a number of approaches available to define the fragility function of a structure.
Earlier, most of the fragility analysis were based on site survey and opinions from experienced

21
panel members. The evolution of fragility analysis from expert-based to analytical are discussed
elaborately in Billah and Alam (2015a). Among all, the non-linear time history analysis method in
the analytical approach of generating fragility is the most popular one. Probabilistic resilience, life
cycle cost and expected loss related to reconstruction and damage repairing cost can be predicted
from fragility analysis of structural components and structures. To execute the loss assessment of
a structure at a specific region, predicting the seismic vulnerability is the most important
prerequisite (Zelaschi et al., 2015).
Figure 2.5 Typical fragility plot
2.1.9 Incremental Dynamic Analysis (IDA) approach of generating fragility
The incremental dynamic analysis method is a very attractive method of generating
fragility curves when sufficient ground motion data are not available to execute the non-linear time
history analysis (NLTHA) of the structure. The NLTHA requires a high number of numerical
investigations but considered the most reliable method of developing fragilities by researchers
(Shinozuka et al., 2000). In this NLTHA method, the site-specific ground motion suits are selected
firstly. The analytical models of the study structures are prepared considering material and
geometric uncertainties. The ground motions are applied to the structural models to run NLTHA.
Maximum responses based on the engineering demand parameters (EDPs) are taken from the
analyses results, and probabilistic seismic demand models (PSDMs) are generated through
regression analysis. Limit states are defined from expert opinions, experimental investigations or

22
by analytically. Demand and capacity models are combined to plot the fragility considering
lognormal distribution. The methodology is graphically presented in Figure 2.6 with corresponding
equations. It is a very effective analytical method and extensively used by academics (Choi, 2002;
Nielson, 2005; Padget, 2007; Tavares et al., 2012; Billah and Alam, 2014c). IDA is simply a
combination of NLTHA where the ground motions are scaled to cover a range of ground motion
intensity levels to apprehend the dynamic response of the structure with a limited number of
seismic motions available. Due to the reliability of this method, many researchers have accepted
IDA method in plotting fragilities of bridges (Zhang and Huo, 2009; Huo and Zhang, 2013; Billah
and Alam, 2014c; Baker, 2015; Billah and Alam, 2016a).
Figure 2.6 Generation of fragility plot following NLTHA

23
2.2 High Strength Steel
The very first reinforced concrete structure was built in 1884. From 1911 to 1966, Grade
33, Grade 40 and Grade 50 steels were in action to reinforce concrete structures. First high strength
steel was experimentally tested for bridges in the USA in early 60’s (Hognestad et al., 1960). Most
common reinforcing steel used in USA and Canada is the Grade 60 steel conforming to American
Society for Testing and Materials (ASTM), ASTM A615/A615 M. In the past 100 years, steel
strength had enormous improvement that resulted in the present very high strength steel, ASTM
A1035 with Grade 100 and Grade 120 (ASTM, 2007). ASTM included the Grade 80 in ASTM615
in 2009 (ASTM, 2009) and later in 2004, Grade 100, and in 2007 Grade 120 were added to ASTM
A1035. Table 2.4 presents some common types of reinforcements used in construction industry.
Advancement in high strength concrete and high-performance concrete demands an increased
strength in steel reinforcement with the potential to reduce structural member size and cost of
gigantic constructions notably without compromising the overall performance. Concrete strength
as high as 100 MPa known as Ultra High-Performance Concrete requires a large quantity of Grade
40 or Grade 60 steel confinement resulting in congestion and troublesome construction. On the
other hand, lower concrete strength needs a higher number of longitudinal reinforcements to satisfy
the design when lower grade steels are used leading towards the same difficulty. Steel grade of
100 is newly acquainted into ASTM A615 standard. American Concrete Institute (ACI 318-14,
2014) and American Association of State Highway and Transportation Officials (AASHTO, 2014)
now allow the use of 100 ksi steel in specified construction and 75 ksi and 80 ksi to other
constructions. CHBDC permits using reinforcing bars of yield strength between 300 and 500 MPa
(CSA, 2014), which is more conservative than the American Association of State Highway and
Transportation Officials (AASHTO) and the American Concrete Institute (ACI) specifications.
CHBDC 2014 recommends that all the reinforcing steel bar should conform requirements of
Canadian Standard Association, CSA G30.18.

24
Table 2.4 Available reinforcing steel
Designation Type of
reinforcement
Scope
A 615 Carbon steel Deformed and plain carbon steel for concrete
reinforcements in cut length and coils
A 706 Weldable steel Low alloy deformed and plain steel bars with restrictive
mechanical properties and chemical composition to
control the tensile strength and improved weldability.
A 767 Galvanized steel Reinforcing steel coated with protective zinc
A 934 Epoxy coated steel Epoxy coated prefabricated steel reinforcing bars
A 1055 Zinc and Polymer
membrane steel
Dual coated reinforcing steel that provides galvanic
cathodic protection and ensures anode to steel continuity
during the construction process
A 955 Stainless steel Corrosion resistant deformed and plain stainless steel with
controlled magnetic permeability for concrete
reinforcement
A 1035 Low carbon
chromium steel
Low and high corrosion resistive low-carbon, chromium
steel bars for concrete reinforcement
2.2.1 Limitation on HSR
The permissible concrete strain of 0.003 and to control crack width under service loads are
the main reasons behind limiting the yield strength of steel in designing RC members. Steel strain
coupled with steel stress controls the crack width (Nawy, 1968). It is important to limit yield
strength of steel to some extent to prevent cracking and maintain aesthetics of structures. Also, the
maximum stress of 87ksi is usable to produce 0.003 strain considering linear elastic behavior.
Recent developments in concrete strength and properties allow higher limiting strain than 0.003,
making the ACI 318 and AASHTO limit for steel strength (80ksi and 75ksi) needlessly
conservative (Russell et al., 2011). A recent study from Salomon and Moen (2014) found that the
deformability of A1035 steel is in agreement to AASHTO (AASHTO, 2015) requirement with
36% less steel.

25
2.2.2 Ductility of steel reinforcement
The total strain at the point of rupture defines the elongation at fracture. It is an important
measure of ductility. Another parameter to express ductility is the strain hardening of steel. The
ratio of the tensile stress and the yield stress describes the strain hardening, which allows RC
member to deflect more. Elongation at the maximum stress level is also gaining popularity as a
ductility measure recently (Firoze, 2010; ATC, 2014). Other criteria to measure ductility are the
bend and re-bend test of reinforcement where the outer surface and inner surface experience
tension and compression respectively. If the bend diameter is lower than specified, there is a
possibility of rib split up even without fracture of steel. Even though a steel reinforcement satisfies
the tensile and yield strength test, it might fail in the bend or re-bend tests to disclose any
manufacturing defect or brittleness of the material. It is better not to bent HSR unless otherwise
specified cause simple crack on steel surface may lead to corrosion. With the increase in yield
strength in HSR, tensile to yield strength and uniform elongation reduces (ATC, 2014). Most of
the cases with higher grades like 100ksi and 120ksi steel, the yield plateau completely vanishes.
As defended by Federal Emergency Management Agency (FEMA), the ductility of a RC structure
can be improved by providing low flexural reinforcement, adding confinement and compression
reinforcement. Designing reinforcement for gravity loads only required adequate yield strength
without much concern on the elongation of steel. Whereas, the seismic design requires special
attention to the elongation percentage and tensile to yielding stress ratio of steel rebars (ATC,
2014).
Typical stress-strain curves for lower and higher grade steel grades are shown in Figure
2.7. Lower grade reinforcement shows an elastic region followed by a yield plateau and a strain
hardening segment. Whereas, the HSR displays gradual loss in stiffness after an elastic part. 0.2%
offset method is used to define the yield point, and a ‘roundhouse’ curve leads to the tensile
strength (ATC, 2014).
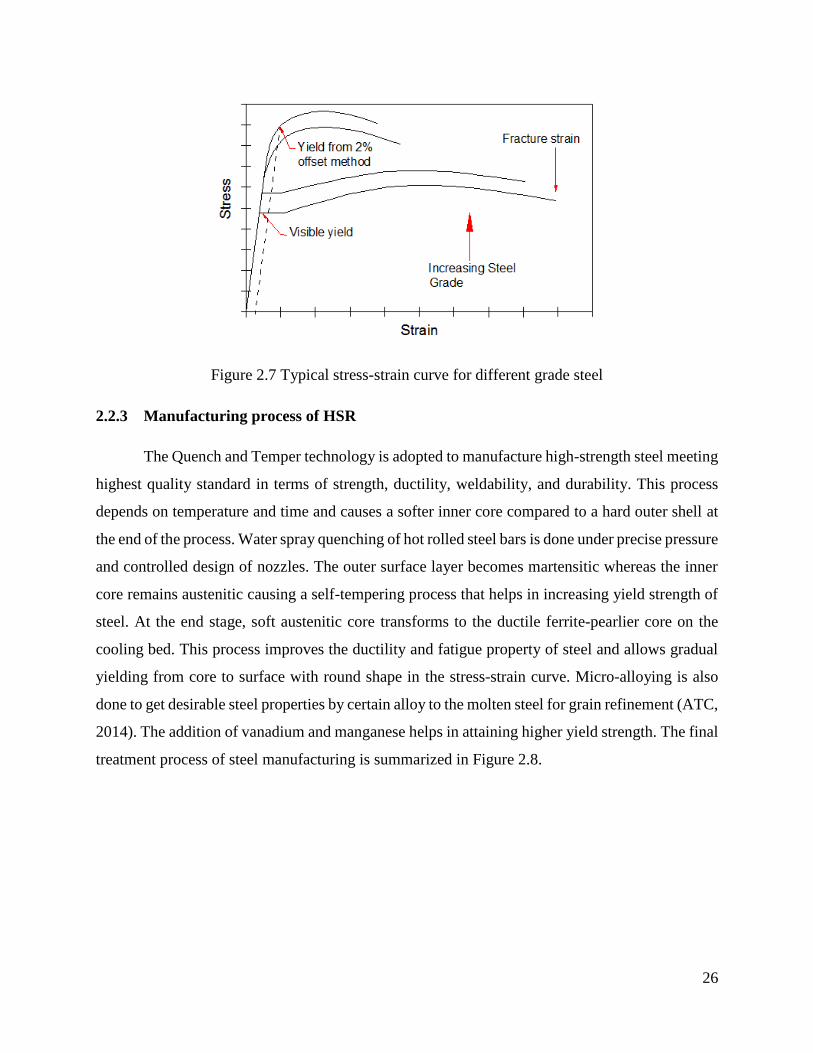
26
Figure 2.7 Typical stress-strain curve for different grade steel
2.2.3 Manufacturing process of HSR
The Quench and Temper technology is adopted to manufacture high-strength steel meeting
highest quality standard in terms of strength, ductility, weldability, and durability. This process
depends on temperature and time and causes a softer inner core compared to a hard outer shell at
the end of the process. Water spray quenching of hot rolled steel bars is done under precise pressure
and controlled design of nozzles. The outer surface layer becomes martensitic whereas the inner
core remains austenitic causing a self-tempering process that helps in increasing yield strength of
steel. At the end stage, soft austenitic core transforms to the ductile ferrite-pearlier core on the
cooling bed. This process improves the ductility and fatigue property of steel and allows gradual
yielding from core to surface with round shape in the stress-strain curve. Micro-alloying is also
done to get desirable steel properties by certain alloy to the molten steel for grain refinement (ATC,
2014). The addition of vanadium and manganese helps in attaining higher yield strength. The final
treatment process of steel manufacturing is summarized in Figure 2.8.

27
Figure 2.8 Final treatment process in manufacturing high strength steel
2.2.4 ASTM A1035
ASTM A1035 reinforcing bars have exceptional corrosion resistance capacity like stainless
steel due to the high chromium content (up to 9%), which makes it a strong contender in RC
structure construction as an alternative to stainless steel and epoxy coated bars (Russell et al.,
2011). The stress-strain plot of A1035 does not show any yield plateau. 2% offset method is used
to find out the yield strength, which is no less than 100ksi. Grade 100 (fymin= 100ksi) and Grade
120 (fymin= 120ksi) are currently producing in the market. However, some codes do not allow more
than Grade 75 (AASHTO) and Grade 80 (ACI 318) in designing longitudinal rebars and Grade
100 in transverse reinforcement limiting the application of A1035 steel. The benefit of this high
yield strength is left unutilized in those cases. El-Hacha and Rizkalla (2002) concluded that the
A1035 has similar tensile and compressive yield with a Poisson ratio of 0.26. 0.2% offset method
is most commonly used to determine the yield point by the researchers (DeJong, 2005; DeJong
and MacDougal, 2006; Russell et al., 2011; Mast et al., 2008; Paulson et al., 2013). To specify the
elongation in steel, NIST (2014) recommended using the uniform elongation at peak stress rather
than total elongation. “Best-fit” model is proposed in some literature to model the behavior of HSR
(Vijay et al., 2002; Rizkalla et al., 2005; Mast et al., 2008). Modulus of elasticity is reported
29,000ksi with a proportional limit of at least 70ksi (Mast et al., 2008). DeJong (2005) and DeJong
and MacDougal (2006) conducted the fatigue test of high strength A1035 steel using #3, #4 and
#5 bars for 1 million cycles and concluded the fatigue strength 45ksi, which was 87.5% higher
than Grade 60 rebars. El-Hacha and Rizkalla (2002) published similar findings in their work. The
yield and tensile strength of A1035 steel are nearly twice of typical Grade 60 rebars, but the
ductility limit depends largely on material compositions. Important measures of ASTM A615 and
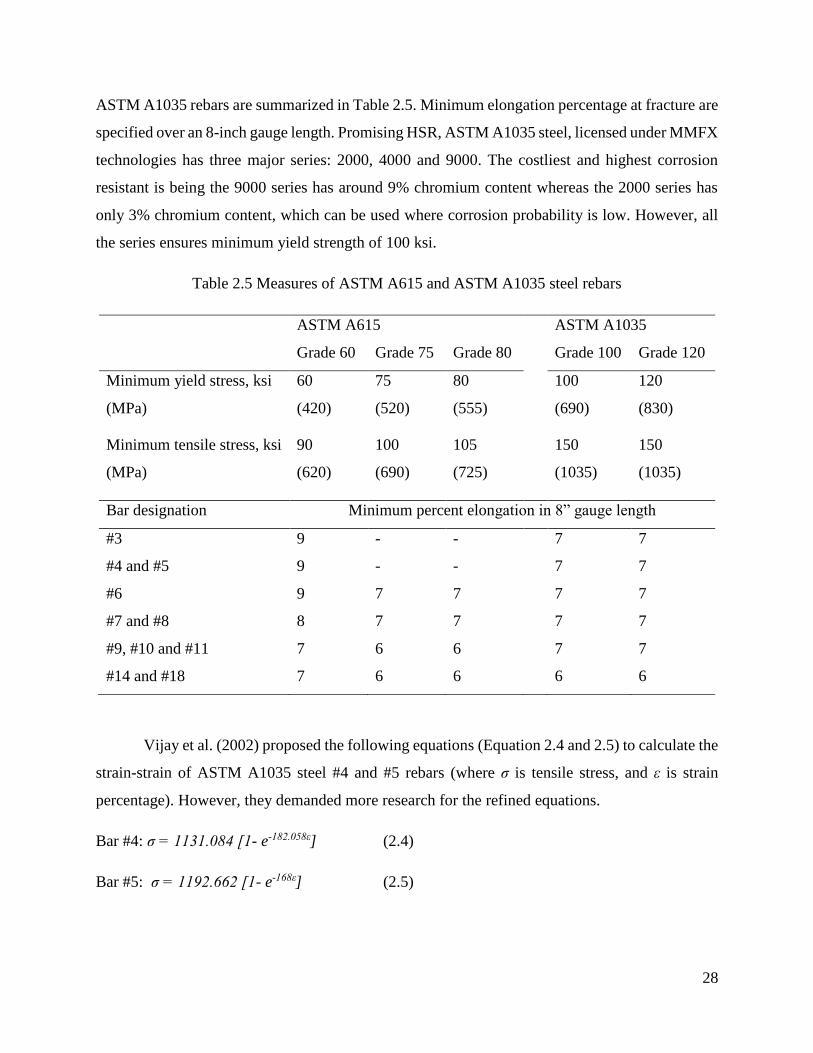
28
ASTM A1035 rebars are summarized in Table 2.5. Minimum elongation percentage at fracture are
specified over an 8-inch gauge length. Promising HSR, ASTM A1035 steel, licensed under MMFX
technologies has three major series: 2000, 4000 and 9000. The costliest and highest corrosion
resistant is being the 9000 series has around 9% chromium content whereas the 2000 series has
only 3% chromium content, which can be used where corrosion probability is low. However, all
the series ensures minimum yield strength of 100 ksi.
Table 2.5 Measures of ASTM A615 and ASTM A1035 steel rebars
ASTM A615 ASTM A1035
Grade 60 Grade 75 Grade 80 Grade 100 Grade 120
Minimum yield stress, ksi
(MPa)
60
(420)
75
(520)
80
(555)
100
(690)
120
(830)
Minimum tensile stress, ksi
(MPa)
90
(620)
100
(690)
105
(725)
150
(1035)
150
(1035)
Bar designation Minimum percent elongation in 8” gauge length
#3 9 - - 7 7
#4 and #5 9 - - 7 7
#6 9 7 7 7 7
#7 and #8 8 7 7 7 7
#9, #10 and #11 7 6 6 7 7
#14 and #18 7 6 6 6 6
Vijay et al. (2002) proposed the following equations (Equation 2.4 and 2.5) to calculate the
strain-strain of ASTM A1035 steel #4 and #5 rebars (where σ is tensile stress, and ε is strain
percentage). However, they demanded more research for the refined equations.
Bar #4: σ = 1131.084 [1- e-182.058ε] (2.4)
Bar #5: σ = 1192.662 [1- e-168ε] (2.5)

29
Yotakhong (2003) provided the formulation to determine #6 ASTM A1035 bar stress-strain
behavior as follows.
Bar #6: σ = 1220.238 [1- e-185ε] (2.6)
Later on, Moran and Lubell (2008) experimented application of HSR for deep beams and
found polynomial equations for ASTM A1035 #4, #6 and #7 rebars.
El-Hacha and Rizkalla (2002) tested the #4, #6 and #8 rebars from ASTM A1035 and found
the elastic modulus 200 GPa. The same experiment displayed the average shear strength of ASTM
A1035 rebars 762 MPa. El-Hacha et al. (2006) further investigated on four beam specimens
reinforced with ASTM A1035 rebars to find out the bond performance and splice length of HSR.
They demonstrated the conservative estimation of boned length in ACI 318-02 and proposed the
following Equation 2.7 to find the splice length required for ASTM A1035 steel rebars.
𝑙𝑑 =
𝑓𝑦
√𝑓𝑐′ −51
4
9(
𝑐min′ +0.5𝑑𝑏+𝑘𝑡𝑟
𝑑𝑏)
𝑑𝑏 (2.7)
Here,
𝑘𝑡𝑟 =𝐴𝑡𝑟𝑓𝑦𝑡
556𝑠𝑛 (2.8)
Csi= ½ clear spacing between splice rebars
Cb= bottom concrete clear cover
Cso= concrete side clear cover
Db= nominal bar diameter
c’min= minimum of Csi and Cb or Cso
2.2.4.1 Chemical composition
Excessive carbon content reduces the weldability capacity of reinforcement. During
welding, the temperature rises to a level more than temper temperature. If the quenching and
tempering process were not controlled properly, this high temperature during welding could lead

30
to lower yield strength of steel rebar. Chromium content plays an important role in resisting
corrosion. ASTM A1035 reinforcing steel has a unique chemical composition that makes it
suitable for the adverse environment and ensures sufficient strength (Faza et al., 2008). Chemical
constituents of ASTM A1035 reinforcing steels of different series are presented in Table 2.6 as
per ASTM (2007) and AASHTO (2015).
Table 2.6 Chemical composition of ASTM A1035 reinforcing bars
Element
(%)
ASTM A1035
Series 9000 Series 4000 Series 2000
Carbon 0.15 0.20 0.30
Chromium 8-10.9 4-7.9 2-3.9
Manganese 1.5 1.5 1.5
Nitrogen 0.05 0.05 0.05
Phosphorus 0.035 0.035 0.035
Sulfur 0.045 0.045 0.045
Silicon 0.50 0.50 0.50
2.2.4.2 Previous studies on ASTM A1035
HSR can be used with regular strength concrete. For pure compression members like short
columns, it is advantageous to use HSR along with high strength concrete. HSR have huge
potential to be used in industrial, commercial, residential and transportation projects. Construction
productivity can be increased by using HSR in several parts of construction phases. Research on
HSR like ASTM A1035 is facing advancement due to its prospect in the construction industry.
2.2.4.3 Flexure reinforcement
A RC member should display large deformation and adequate cracking at ultimate load to
provide ample warning before complete failure. At service loading condition, the deformation
should be small with minimal cracking. Steel strain and stress are the deciding factors in
calculating the deflection and cracking. For lower strength steel, only yielding in tension steel
ensures the high strain whereas, for HSR, yielding is not mandatory (Mast et al., 2008). Through

31
extensive studies on the beams subjected to axial and flexural loading, Mast et al. (2008) proposed
the suitability of ASTM A1035 reinforcement in tension and compression controlled RC members.
They used the concrete compressive strength 6.5ksi and ultimate strain at compression 0.003. The
steel was Grade 100 (fy = 100 ksi) with a modulus of elasticity 29,000ksi. The elastic-plastic stress-
strain model was considered. They concluded that for a section with balance reinforcement less
than 1.75%, an elastic-plastic model of 100ksi steel underestimated the nominal moment capacity
and between 1.75% and 2.7% it overestimated marginally (only 2.5%). Tension controlled strain
limit of 0.0066 for 100ksi HSR showed similar ductility as Grade 60 reinforcement for a simple
beam. Also, the crack widths under service load were very close to the acceptable limit. Recent
research from NIST (2014) suggested that reduced amount of HSR member in place of Grade 60
steel reinforced member subjected to cyclic loading demonstrates equivalent deformation capacity
and flexural strength. Mast et al. (2008) suggested limiting reinforcement yield strength to 80ksi
to match concrete strain 0.003 in the compression face to avoid compression failure. Experimental
studies from Seliem et al. (2006), McNally (2003), Malhas (2002), Vijay et al. (2002) and Florida
DOT (2002) supported the conclusions from Mast et al. (2008) to apply A1035 steel as flexural
reinforcement. McNally (2003) found reduced ductility of structure for A1035 steel whereas
Seliem et al. (2006) and Florida DOT (2002) concluded increased ductility resulting from lower
reinforcement ratio due to the high yield strength of A1035 steel. Russell et al. (2011)
demonstrated that the present limit for fatigue in AASHTO LRFD applies to A1035 steel. Full-
scale experiment on deep beam was carried out by Moran and Lubell (2008) using high strength
steel as reinforcement. Strut and Tie model was employed to find out the capacity of deep beams,
which were in good agreement with the CSA A23.3-04, ACI 318-05 and Eurocode 2 provided
equations. Salomon and Moen (2014) tested one to one replacement of Grade 60 rebars with
ASTM A1035 steel and found 70% higher flexure capacity. Reducing the rebar size resulted in
15% higher capacity. Crack width reduced almost 50% after reducing the clear cover when A1035
was used. It also helped in ductility improvement and gaining flexural rigidity in the section.
2.2.4.4 Shear reinforcement
High stress in steel may result in cracks in concrete and reduce the concrete contribution
in carrying the shear (Brown et al., 2006; Lubell et al., 2004; Tureyen and Frosch, 2003). Reduced
longitudinal reinforcement reduces the compression zone depth, which is the primary shear
32
carrying region (ATC, 2014). Some studies have been performed on the viability of the use of high
strength steel as shear reinforcement (Budek et al., 2002; Munikrishna, 2008; Ou et al., 2012).
National Cooperative Highway Research Program (NCHRP) research project indicated the
feasibility of the use of higher grade steel as shear reinforcement and found a minor difference in
concrete crack width with Grade 60 and Grade 100 rebars (Shahrooz et al., 2011). Sumpter (2007)
examined the feasibility of HSR application as shear reinforcement in concrete members. The
beam tested by Sumpter (2007) had shear span to depth ratio of 3 and both ASTM A615, and
A1035 steel were employed as longitudinal and transverse reinforcement. He tried to maintain
very high stress in steel through overloading and found an ignorable difference in the specimens
at service loading. Specimens reinforced with A1035 shear steel showed marginally higher
capacity than that of A615 steel. Concrete dominated the shear behavior, and the stress in shear
reinforcements never exceeded 80ksi. Thus the high strength of A1035 steel was not fully utilized.
Florida DOT (2002) concluded similar findings on the generated stress in shear reinforcements.
Test result from five RC beam and four prestressed girders by Russell et al. (2011) found the
current AASHTO LRFD specification allowable for A1035 steel of Grade 100. NIST (2014)
concluded that the spacing for high strength transverse reinforcement should be reduced to 5db and
4db for Grade 80, and Grade 100 and Grade 120 longitudinal reinforcements respectively.
2.2.4.5 Compression member
Increasing the strength of transverse reinforcement provides better control on longitudinal
bar buckling than regular strength steel confinement (Muguruma et al., 1991). Cusson and Paultre
(1994) concluded improved ductility and strength under high strength confinement. Nagashima et
al. (1992), Razvi and Saatcioglu (1994), and Nishiyama et al. (1993) had identical conclusions.
Study on HSR also provided improved behavior in axial column reinforced with A1035 transverse
steels (El-Hacha and Rizkalla, 2002; Stephan et al., 2003; Restrepo et al., 2006). Analytical results
from Russell et al. (2011) indicate that for a compression member, AASHTO LRFD design
specifications are applicable for A1035 steel for both longitudinal and transverse reinforcement
design.
33
2.2.4.6 Development length
There have been extensive studies done in last 25 years on the development length of
reinforcement in normal and high strength concrete. Azizinamini et al. (1993), Azizinamini et al.
(1995), Hamad and Itani (1998), Harajli (2004) and Holschemacher et al. (2005) studied the bond
behavior of steel in concrete whereas Esfahani and Kianoush (2005) and Firas et al. (2011)
experimented the bond development of fiber reinforced polymer (FRP) in concrete. High strength
concrete displays very strong bond strength due to its high compressive strength and elastic
modulus (Holschemacher et al., 2005; Azizinamini et al., 1993). The inclusion of steel fibers in
high-performance concrete reduces the crack width and increases the bond resistance leading to
more ductile failure. (Harajli et al., 2002; Chao et al., 2009). To develop high bar stress in HSR,
longer development length is expected. Saleem et al. (2013) investigated the development length
of ASTM A1035 HSR from MMFX Technologies of Irvine, California embedded in ultra-high
performance concrete from pullout and beam tests. Two sizes of high strength rebars, #10 and #22
of 690 MPa yield strength were used in predicting their bond strength. Saleem et al. (2013) found
the development length 12db and 18db for #10 and #22 rebars correspondingly from beam test.
They also concluded that the equation provided by ACI 408R-03 can reasonably predict the
development length for HSR. However, it was observed that pullout test was effective only in case
of small diameter HSR. Some studies revealed that the load-slip relationship of A1035 steel with
concrete is pretty similar to A615 steel (Ahlborn and DenHartigh, 2002; El-Hacha et al., 2006)
and some suggested improved performance due to the rib configuration in A1035 steel (Sumpter,
2007; Zeno, 2009). Peterfreund (2003) studied A1035 steel in bridge deck and found the ACI 318
requirement adequate without the presence of confining reinforcement. However, Seliem et al.
(2009) found that ACI 318 underestimates the development requirement with no confinement and
ACI 408 described the requirement adequately and suggested to use confinement in developing
HSR. #5 and #7 steel rebars without any confining reinforcement were tested by Ciancone et al.
(2008) to determine the hook behavior of A1035 steel. Lower bar size developed the yield capacity
whereas the higher one could not. It is suggested to use confinement and adequate cover for A1035
steel development (Ciancone et al., 2008; Russell et al., 2011). A more detailed investigation was
carried out by Sperry et al. (2015) to determine the important factors affecting the anchorage length
of hooked bars in concrete for high strength steel application. 337 beam-column joint specimens
were tested on varying hook number, concrete compressive strength and cover, hook angle and

34
spacing, embedded length, hook position and bar diameter. Maximum stress of the hooked bar and
concrete were 141 ksi and 16.5 ksi respectively. They found that the ACI 318-14 overestimates
the strength of larger hook bar, the contribution from concrete and transverse confinement. Hooked
bar angle and concrete cover did not affect anchorage length. Increasing bar diameter and far
casting from column core increase the anchorage capacity. Hassan et al. (2012) investigated the
splice length of large diameter high strength steel (yield strength ranged from 730-750 MPa) rebars
from 20 full-scale RC beam test. Their study revealed ACI 318 provision for bond and
development could extend to #20 bars with 25% increase to account for safety. Also, transverse
reinforcement ratio is a crucial parameter for splice strength of large diameter HSR.
2.2.4.7 Ductility
Bridge decks reinforced with HSR can produce AASHTO, and ACI provided ductility at
ultimate loading with an added benefit against corrosion (Salomon and Moen, 2014). Most of the
ASTM A615 Grade 60 rebars have tensile to yield strength ratio of 1.5 (Bournonville et al., 2004).
Though ASTM does not provide any minimum requirement for this, it is expected that the HSR
will have similar ratio to ensure ductile failure of RC members with prior warning. CHBDC 2014
specifies the minimum elongation at rupture in a 200 mm gauge length should be 12% for 25M
bars and smaller and 10% for 30M bars and larger (CSA, 2014). However, these limitations are
for maximum steel strength of 500 MPa.
2.2.4.8 Corrosion performance
High corrosion resistance capacity of A1035 steel has make it an appealing choice in
present construction industry along with other ASTM rebars like A955 (Ji et al., 2005). Though
the chromium content in A1035 steel (up to 9%) is less than stainless steel (greater than 10.5%),
it is sufficient to impart a reasonable degree of protection against corrosion than A615 or A706
steels. The microcomposite Fe-C-Cr- Mn alloy are 2-10 times more effective in resisting corrosion
than black steel (A615 or A706). Relative performances of different grade steels in terms of
corrosion resistance are shown in Table 2.7 from Russell et al. (2011).

35
Table 2.7 Corrosion performance of different steel grades (Russell et al., 2011)
Steel Grade Material Relative performance to A615 steel
A615 Black steel 1
A706 Black steel 0.5-0.8
A955 2101 Duplex stainless steel 2-10
A955 304 Austenitic stainless steel >10
A955 316 Austenitic stainless steel >20
A1035 Microcomposite alloy 2-10
2.2.4.9 Application in bridge
Most of the applications of ASTM A1035 steel are limited to bridge deck as “one-to-one”
replacement of regular steel to fight corrosion (Russell et al., 2011; Salomon and Moen, 2014).
Bridge decks are designed on serviceability criteria, and it is expected that the Grade 60 and the
HSR like A1035 will behave similarly (Rizkalla et al., 2005; Hill et al., 2003). Currently, MMFX
Inc. is the lone supplier of A1035 steel. Russel at al. (2011) listed seventeen projects where more
than 60ksi steel were employed. Most of them were 75ksi (maximum limit in AASHTO) steel that
indicates the gaining popularity of HSR in bridge design and construction in recent years. Salomon
and Moen (2014) investigated the flexural performance of corrosion resistive A1035 steel in
reduced bar size and clear cover replacing Grade 60 rebars in one and two layers in one way slab
over a bridge girder and found higher capacity even with 36% less steel. Fatigue resistance is an
important concern especially in bridge construction rather than buildings. For HSR like Grade 100
and Grade 120, it is recommended to test for fatigue (ATC, 2014). Also, lower reinforcement ratio
for HSR will reduce the flexural stiffness that will affect the drift demand in bridge pier. Ziehl et
al. (1998; 2004) suggested to maintain minimum longitudinal reinforcement requirement even for
HSR to avoid problems related to passive yielding and the cost cutback is not very significant
when less than 1% longitudinal rebars are provided.
2.2.5 Prospect of HSR
HSR show gradual yielding without sudden loss of stiffness, unlike mild steel. Elastic-
plastic assumption yields to a conservative prediction of flexural strength capacity for HSR.
36
Growing interest in high strength A1035 reinforcements started in 2002 with the commercial
production to fight corrosion (Malhas, 2002). Previous studies showed the feasibility of A1035
steel application both in buildings and bridge decks (Yotakhong, 2003; Seliem et al., 2008).
Previously Malhas (2002) showed the possibility of compression zone failure in beams with one
to one replacement of A1035 steel that triggered the motivation to work on strain limit to ensure
the ductile failure of HSR (Mast et al., 2008; Shahrooz et al., 2010).
The report prepared by Russell et al. (2011) evaluated the bridge design specifications
provided by AASHTO LRFD to use high strength reinforcing steel with no well-defined yield
plateau for concrete strength up to 10ksi and 15ksi in some cases. According to them, no major
change is required in AASHTO LRFD bridge design code considering maximum steel yield
strength of 100ksi. To ensure ductility, they recommended strain limit in steel in A1035 Grade 100
rebars minimum 0.008 and maximum 0.004 for tension and compression controlled sections
respectively.
Paultre et al. (2001) studied the potential and effect of high strength steel as transverse
reinforcement in combination with high strength concrete. The column concrete strength varied
between 80 and 120 MPa and the tie strengths were 400MPa and 800MPa with varying spacing.
They found a negative impact of high strength concrete on the displacement ductility and energy
dissipation capacity of the column. On the contrary, HSR as transverse ties in the column provided
similar ductility with reduced confining steel. However, they also concluded that the HSR may not
always be effective for every column configuration.
The project of Applied Technology Council (ATC, 2014) worked on the Building Code
Requirements for Structural Concrete and Commentary (ACI, 2014) to find out whether any
update requires in ACI 318-14 to use Grade 80, Grade 100 and Grade 120 reinforcements to design
for seismic, wind and gravity loads. The nuclear industry has a special interest in using high
strength reinforcement for speedy construction, and reduced congestion as the lower elongation
associated with HSR are not a concern due to very small non-linear deformation demand of the
components. Bridge industry is also showing interest in HSR to pursue the goal (ATC, 2014).

37
2.2.6 Cost and current applications
The cost of ASTM A1035 series 4100 is almost equal to that of ASTM A615 epoxy coated
steel (Tadros, 2017). For a constant member section, replacement of Grade 60 reinforcement with
HSR can be done by using same size bars with higher spacing or by providing smaller size bar at
the same spacing. Larger spacing reduces the congestion and allows easier consolidation of
concrete, but it is difficult to bend higher size HSR. On the other hand, smaller diameter HSR
reduces the cost by decreasing overall reinforcement volume and cost, easy to bend and easy to
construct (ATC, 2014). Replacing Grade 60 reinforcement with Grade 80 rebars reduces 4%
overall cost of concrete structure (NIST, 2014). Price et al. (2014) concluded that if the ACI 318
limit on steel yield stress was avoided, HSR could substantially reduce the reinforcement
requirement with a speedy construction. At present, the Abu Dhabi International Airport Departure
Bridge and the Lesner Bridge in Virginia Beach, Virginia are utilizing ASTM A1035- CS alloy
reinforcement.
2.2.7 Benefits of HSR
HSR has the potential to reduce steel reinforcement requirement up to 50% compared to
regular Grade 60 steel. Fewer bars needed and the spacing increases allowing more space
for concrete placement and easy compaction. Bar diameter can also be reduced.
Concrete volume can be saved by reducing structural member size with appropriate
selection of steel grade resulting in reduced dead load. Usable floor space increases due to
reduced column sizes.
Formwork required for the structural members will be less with light cage weights. Site
storage space requirement will reduce as well.
Steel fabrication will require less labor work. Less material handling will improve the site
safety.
The cost in logistic supports will be less. Carrier costing will reduce to carry less number
of reinforcements through trucks. Jobsite storage, logistics, and transit will improve.
With reduced reinforcements, fewer workers are required to install steel rebars onsite. Also,
it will free up the crane time leading to a speedy construction.
The size of the foundation can be optimized with reduced member sections and loads.

38
Most importantly, overall construction cost can be minimized with reduction of
construction time.
2.2.8 High strength steel design consideration and limitations
HSR does not show well-defined yield plateau (Seliem et al., 2009) and plastic elongation
like Grade 60. This affects the flexural behavior of structural elements such as beam and
columns significantly due to low ductility.
As the flexural reinforcement reduces due to HSR, concrete compressive strength should
be high enough to maintain the neutral axis position in compression zone of the section to
have the complete benefit of HSR with tension controlled behavior.
If the concrete member section size is reduced to utilize the benefit of high strength of steel,
congestion in the member will be similar to that of Grade 60 steel. Moreover, additional
transverse rebars have to be provided to control longitudinal bar buckling (ATC, 2014).
Minimum reinforcement requirement should be checked with design codes to avoid abrupt
tension induced failure.
HSR are not effective in reducing the concrete crack width and member deflection capacity
for improved serviceability when provided in lower numbers (Shiro and Hitoshi, 1996).
Due to the higher yield strength of HSR, larger development requires, which is not practical
for larger diameter bars.
A limited number of experimental investigations on the performance of HSR concrete
members to establish proper design method.
At a very high temperature (5370 Celsius), the relative reduction in yield and tensile
strength of HSR are similar to conventional rebars (Aoyama, 2001).
Designers should be extra cautious to avoid mix up in steel grades to avoid unnecessary
hindrance in construction.
2.3 Summary
Numerous studies from previous research show the growing interest of PBD in structural
engineering. Considering the importance of bridges, enormity and investment in bridge project,
PBD approach is desirable to ensure life safety and reduce loss due to damage after a seismic
event. The performance criteria in CHBDC transformed to more precise quantitative form in 2014

39
from descriptive statements. However, noticeable changes in the performance limits occurred in
the supplement to CHBDC 2014. It is essential for the engineers to understand how the changes in
code affect the dynamic performance of the bridge piers to decide on the proper design method.
For improved constructability and to lessen reinforcement congestion for better concrete
consolidation, high strength steel has no alternative. Moreover, superior corrosion resistance
capacity has made ASTM A1035 steel a very attractive choice for bridge deck applications. The
scope should not be limited and must be extended to the application in bridge pier, which is
considered the most critical element of a bridge structure. Prior dynamic analysis of RC bridge
pier reinforced with high yield strength steels with reasonable ductility needs to be investigated
before field applications.
With the advancement in PBD, strength criteria of material properties are getting attention
to satisfy the required performance limit for design. Criteria set by CHBDC 2014 is highly
conservative. Minimal damage is allowed for a lifeline bridge even at an event of 975 years return
period. To reduce reinforcement percentage without compromising the performance can be
achieved by using high strength steel.

40
Chapter 3 : SEISMIC PERFORMANCE COMPARISONS OF FORCE-BASED AND
PERFORMANCE-BASED DESIGNED BRIDGE PIER
3.1 Background
PBD has been developed by the researchers to overcome the deficiency associated with
FBD, especially for reinforced concrete structures rather than steel structures since steel behavior
is more predictable than reinforced concrete. PBD is a powerful approach that allows the engineers
to design the bridges to have a predictable and dependable behavior during seismic events. After
the first introduction of PBD concept back in the 1980s (Hamburger et al., 2004), most of the
applications were confined to design of buildings (SEAOC, 1995; ATC, 1996; FEMA, 1996).
However, bridges have got the attention due to their importance in the transportation network and
seismic vulnerability during earthquakes. Plentiful studies have been done since the
commencement of 21st century on the improvement of PBD of bridges using deferent materials
(Priestley, 2000; Mackie and Stojadinović, 2007; Marsh and Stringer, 2013; Billah and Alam,
2016a). CHBDC first adopted the PBD in 2014 (CSA, 2014). Though some performance goals
were specified in CHBDC 2006 (CSA, 2006), the traditional design method could not satisfy the
criteria automatically (Sheikh and Légeron, 2014). CHBDC 2014 allows designing a bridge using
both force-based and PBD depending on the type of bridge (CSA, 2014). For a lifeline bridge,
PBD is compulsory in CHBDC 2014.
Designing bridges based on performance goal are not a novel technique, rather it includes
the conventional method of seismic design with necessary advancement (Ghobarah, 2001). A few
bridge projects are already in action in Canada like the Port Mann Bridge, Vancouver (Jones et al.,
2013) and the Vancouver Evergreen Line Rapid Transit Project (Khan and Jiang, 2015). Bridges
designed with conventional force-based approach prevents loss of life, but the loss associated with
the damage and repairing cost can be substantial. Improper design choice and lack of performance
awareness may lead to an inaccurate decision and cost a great deal of money. It is necessary to
design bridges against different hazard level considering the performance objectives to limit the
economic losses. This study will present comparative performance of bridge piers designed
following force-based and performance-based methods that will aid the engineers in decision
making with a clear vision of improvement in current CHBDC design practice.

41
3.2 Validation of model
A finite element program SeismoStruct (SeismoStruct, 2015) is employed in modeling the
bridge piers. The program had been used by researchers to model bridges and bridge components
very efficiently (Alam et al., 2008; Billah and Alam, 2015b; Kabir et al., 2015; Fakharifar et al.,
2015a). However, to verify the efficacy of the program, a steel reinforced square column from
Correia et al. (2008) and a high strength steel reinforced circular bridge column from Restrepo et
al. (2006) are selected. Comparison between two frame element formulation, displacement-based,
and forced-based was done by Correia et al. (2008). For this purpose, a reinforced concrete bridge
column using low-performance material was experimentally tested by Correia et al. (2008). The
control column had 400 mm x 400 mm cross-section with 1850 mm height and 60 mm clear cover.
Main longitudinal reinforcements consisted of 12-D13 bars, and the transverse reinforcements
were D6 bars with 50 mm center to center spacing. An axial load of 160 kN was applied during
application of the loading history. The displacement control cyclic load history as shown in Figure
3.1a was applied at 1450 mm from column base. The details can be found in Correia et al. (2008).
Seismic testing of full-scale bridge column using high strength concrete and high strength steel
was carried out by Restrepo et al. (2006). The 914mm diameter bridge pier was reinforced with
42- #5 (15.8 mm diameter) longitudinal bars and #3 (9.7 mm diameter) hoops spaced at 40 mm.
The clear height of the column was 2444 mm, and the clear cover was 38 mm. Force-controlled
load history was applied until flexural yielding occurred and after that, the displacement controlled
cyclic load was in action (Restrepo et al., 2006). The loading protocol used in the experiment is
shown in Figure 3.2a. Constant axial load of 2669 kN was applied on top of the bridge column.
Fixed base is considered during analysis of the bridge pier since the footing was prestressed to the
strong floor. Material properties measured in both the experiments are listed in Table 3.1. The
program SeismoStruct is capable of predicting collapse load and large deformation in structure
considering both material and geometric non-linearity (Pinho et al., 2007). 3-D inelastic force-
based beam-column elements are considered in modeling the bridge piers. Material models are
calibrated using the values provided in Table 3.1 to catch the strength, deformation and stiffness
transition under reverse cyclic loading.

42
Table 3.1 Material properties used in model validation
f’c (MPa) fy (MPa) fsu (MPa) εsu (MPa) fyh (MPa)
Correia et al. (2008) 20.6 367 - - 367
Restrepo et al. (2006) 56.5 648.1 1067.3 5.2 827.4
Here, f’c = Uniaxial compressive strength of concrete, fy = Yielding stress of longitudinal bars, fsu
= Ultimate stress of longitudinal bars, εsu = Strain at ultimate stress of longitudinal bars, fyh =
Yielding stress of transverse bars
Figure 3.1b displays the comparative hysteretic performance of experimental and analytical
results of the steel reinforced square concrete column. Results obtained from the analytical
modeling of Correia et al. (2008) shows that SeismoStruct can predict the test results reasonably
where the variation in maximum shear capacity is only 8.3% (Figure 3.1b). The energy dissipation
capacity from the numerical analysis is found 152 kN-mm, which is 5.72% higher than the
experimental result. This is due to higher loop area inside the hysteretic curve and indicates that
the program predicts the residual deformation little more than the experimental outcome (14%
more maximum residual deformation). The parameter post-elastic and elastic stiffness ratio and
the shape defining parameters are adjusted to conform the stress-strain behavior accurately in
Manegotto-Pinto model. Material modeling and fiber-based element modeling approach are
discussed in details in Chapter 5. Values for the calibrated parameters are b = 0.015, R0 = 20, a1 =
18.5, a2 = 0.15, a3 = -0.025 and a4 = 15. Figure 3.2b portrays the shear force, and drift capacity
of the high-performance material made bridge pier from the numerical model of Restrepo et al.
(2006), which is in good agreement to the experimental results. The maximum shear force is
calculated 1311 kN, which only 0.77% higher than the experimental results respectively.
Moreover, the cumulative energy dissipation capacity from the hysteretic curve is determined
523.9 kN-mm that is only 1.06% more than that of the lab test. The calibrated hardening and cyclic
response parameters used in modeling to better represent the experimental data are b = 0.015, R0
= 19.5, a1 = 18.8, a2 = 0.05, a3 = 0.25 and a4= 0. Validating the experimental results with the
simulation clearly express the effectiveness of the program in predicting the simulated seismic
behavior of steel reinforced column and bridge pier for a wide range of material properties.

43
Figure 3.1 Comparison of analytical results with experimental results from Correia et al. (2008);
(a) loading protocol (b) analytical validation
Figure 3.2 Comparison of analytical results with experimental results from Restrepo et al.
(2006); (a) loading protocol (b) analytical validation
3.3 Geometry and Design of Bridge Piers Following CHBDC
Design and geometric configuration of steel reinforced concrete bridge piers following
different design guidelines are described in this section. Concrete of 35 MPa compressive strength
and ASTM A615 Grade 60 steel (415 MPa yield strength) are considered to design the bridge piers
seismically following two design methods, forced-based design approach, and PBD approach.
Most of the bridges are designed following the traditional force-based method where for simple
bridges seismic demands are calculated by single-mode spectral method (Zhang et al., 2016).
Whereas, PBD is relatively new design method, which has recently been adopted in CHBDC (CSA
2014). Performance of the bridge is controlled by designing it to meet certain target performance
levels for various hazard probability is the main concept of PBD. A lifeline bridge assumed to be
-80
-60
-40
-20
0
20
40
60
80
0 1 2 3 4 5 6 7
Dis
pla
ce
me
nt (m
m)
Time (sec)
(a)
-150
-100
-50
0
50
100
150
-5 -3.75 -2.5 -1.25 0 1.25 2.5 3.75 5
La
tera
l fo
rce
(kN
)
Lateral drift (%)
(b)
Analytical
Experimental
-300
-200
-100
0
100
200
300
0 2 4 6 8
Dis
pla
ce
me
nt (m
m)
Time (sec)
(a)
-1500
-1000
-500
0
500
1000
1500
-4 -3 -2 -1 0 1 2 3 4
Sh
ea
r fr
oce
(kN
)
Drift %
(b)
Experimental
Analytical

44
located in Vancouver, Canada is designed as per CHBDC. At a seismic ground motion probability
of 2% in 50 years, a lifeline bridge should remain open for immediate use. Though CHBDC 2014
allows designing a lifeline bridge using PBD method only; to understand the variation in design
outcomes and seismic performance of same bridge pier designed with different design code
alternatives, FBD approach is also embraced from CHBDC 2010. The diameter of the bridge pier
is 915 mm, and the height is 5250 mm as shown in Figure 3.3. Aspect ratio is maintained 5 to
ensure flexure dominated behavior of the bridge pier (Billah and Alam, 2016a). Considering a
simple regular bridge supported on a single pier bridge bent, the 10% axial load ratio is considered
in designing the bridge column. Soil-structure interaction is disregarded in this particular study for
simplicity. Cracked stiffness from Priestley et al. (1996) is used to calculate the fundamental time
period of the bridge pier following the equation T=2π√(m/kcr) where m is the effective mass and
kcr is the cracked stiffness of the bridge pier.
Korinda (1972) and Hage (1974) demonstrated the importance of accurate flexural stiffness
calculation of structure considering both lateral and gravity loads. With the increase in steel
strength, the cracking probability of concrete will increase. Changes will occur in the flexural
stiffness of the cracked section. This reduced stiffness will necessitate the recalculation of the
moment of inertia of the section. This modification will vary with the reinforcement grade and
reinforcement ratio. The importance factor and the response modification factor are taken 3 and 3
respectively, and the site coefficient of 1.5 for soil profile type III from CHBDC (CSA, 2010) are
considered in calculating the base shear demand. It is recommended that, in an earthquake event
of 475 years return period, a lifeline bridge should remain open to traffic for immediate use. A
constant lumped mass of 2300 kN is applied at the top of bridge column to represent weight coming
from the superstructure. The design moment, axial force and base shear demand are 5020 kN-m,
2300 kN, and 950 kN respectively. Reinforced concrete sectional analysis software Response 2000
(Bentz, 2000) is employed in generating the moment-curvature capacity of the column section. It
has the capacity to perform flexural strain compatibility calculation with the moment-curvature
relationship. A user-friendly graphical interface to define material properties and section geometry
and dimensions allow the user to interpret the results easily. The material properties can easily be
modified to plot stress-strain curves. Previous studies effectively used Response 2000 in sectional
analysis (Karim and Yamazaki, 2001; Setzler and Sezen, 2008; Xu and Zhang, 2011; Salomon and
Moen, 2014; Özer and Soyöz, 2015; Colley et al., 2015). Design spectral acceleration is taken

45
from Vancouver design response spectrum for soil type C. To check the performance of FBD
bridge pier, displacement demands are calculated for return periods of 475, 975 and 2475 years.
FBD of the bridge pier requires 16-55M longitudinal bars, which yields 4.87% longitudinal
reinforcement ratio. The transverse spiral reinforcements are 20M bars spaced 50 mm at the center
in the plastic hinge region as shown in Figure 3.3 and 65 mm to the rest. For the PBD, spirals
configuration and sizes are the same. The only variation is in longitudinal reinforcement based on
design methodology.
Figure 3.3 Cross-section and elevation of steel reinforced concrete bridge pier
It is not very likely that the FBD and the PBD will yield same design results. FBD is
entirely based on the elastic force demand on structure reduced by the structure ductility. It is not
targeted to satisfy any performance level of a structure such as drift, displacement or material
strain. On the contrary, PBD can be done following any method (i.e., static pushover analysis, non-
linear time history analysis) but has to be checked following the specified method (Zhang et al.,
2016). Performance criteria are defined in terms of material strain limit for different hazard level
earthquakes and seismic performance or damage category in CHBDC 2014. Deformation and
strain give a clear indication of damage in structure than forces and stresses (Moehle, 1996). The
strain limit and displacement in structural components can be interrelated as well as the level of
specified damages. To meet certain performance criteria is not an easy task for engineers
considering the construction and economic feasibility.

46
Performance criteria for bridges first included in CHBDC in 2014. After that, the
supplement on the code in 2016 had noticeable changes in terms of performance criteria. Drift in
bridge pier cannot always define the damage properly; rather the material strain level is the key
parameter that dictates the damage in structure more distinctly. However, drift is more easily
visible and predictable in case of a seismic event and most commonly used framework to present
seismic performance and vulnerability. The study is intended to design the bridge piers regarding
material strain level specified in CHBDC (CSA, 2014; CHBDC, 2016) to find out the design
variations and show their behavior during actual ground motions in terms of drift capacity. For a
lifeline bridge, CHBDC 2014 (CSA 2014) specified the damage must be repairable for higher level
design (seismic ground motion probability 2% in 50 years). For seismic ground motion with a
probability of 5% in 50 years, the bridge should have minimal damage with immediate service to
the traffic. These damage and service criteria are presented in terms of material strain (concrete
compressive strain and steel strain for reinforced concrete bridge pier) as shown in Table 3.2. For
lower level design, CHBDC 2014 (CSA 2014) specified that there should be no damage whereas
the supplement proposed that the strain in steel cannot exceed 0.01 (CHBDC, 2016). Updated and
previous performance criteria to design a reinforced concrete lifeline bridge pier are concisely
presented in Table 3.2. The level of analysis is also specified in CHBDC 2014. For the highest
level of design, inelastic static pushover analysis accounting non-linearity in structural elements
and elastic dynamic analysis are required. However, in this particular study, pushover analysis is
performed to select the longitudinal reinforcement targeting the performance criteria and
displacement demand estimated from response spectrum analysis. Non-linear time history
analyses are also carried out to check the performance of the PBD bridge piers under seismic
motions. The program SeismoStruct (SeismoStruct, 2015) can show the material strain levels for
stated performance criteria with reasonable accuracy (Billah and Alam, 2016b). Concrete and
reinforcing steel are modeled following the models proposed by Mander et al. (1988) and
Menegotto and Pinto (1973) respectively.
Figure 3.4a shows the static pushover performance of the FBD bridge pier with 4.87
percentage of longitudinal rebars. Strain criteria of the materials are marked on the pushover curve.
The dashed vertical lines represent the displacement demand for three events probabilities.
Supplement to CHBDC 2014 specifies the concrete strain should not exceed 0.006 and the strain
in steel should be less than 0.01 under the displacement demand of 1 in 475 years (10% probability
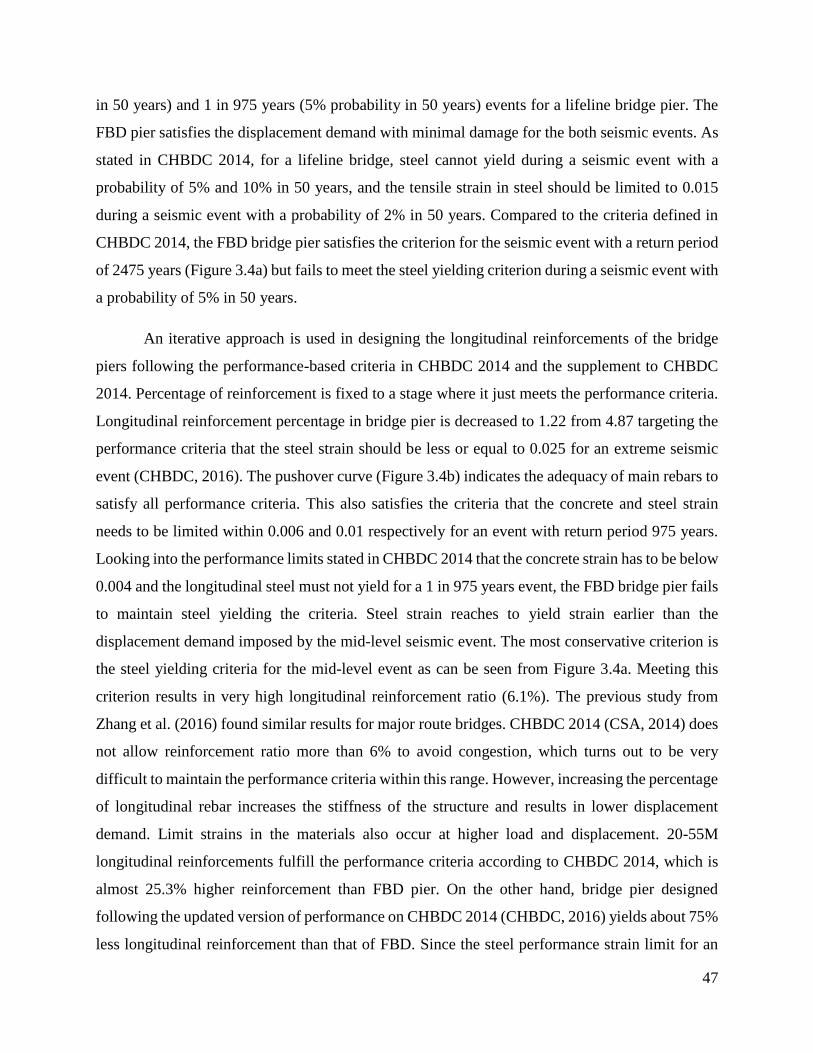
47
in 50 years) and 1 in 975 years (5% probability in 50 years) events for a lifeline bridge pier. The
FBD pier satisfies the displacement demand with minimal damage for the both seismic events. As
stated in CHBDC 2014, for a lifeline bridge, steel cannot yield during a seismic event with a
probability of 5% and 10% in 50 years, and the tensile strain in steel should be limited to 0.015
during a seismic event with a probability of 2% in 50 years. Compared to the criteria defined in
CHBDC 2014, the FBD bridge pier satisfies the criterion for the seismic event with a return period
of 2475 years (Figure 3.4a) but fails to meet the steel yielding criterion during a seismic event with
a probability of 5% in 50 years.
An iterative approach is used in designing the longitudinal reinforcements of the bridge
piers following the performance-based criteria in CHBDC 2014 and the supplement to CHBDC
2014. Percentage of reinforcement is fixed to a stage where it just meets the performance criteria.
Longitudinal reinforcement percentage in bridge pier is decreased to 1.22 from 4.87 targeting the
performance criteria that the steel strain should be less or equal to 0.025 for an extreme seismic
event (CHBDC, 2016). The pushover curve (Figure 3.4b) indicates the adequacy of main rebars to
satisfy all performance criteria. This also satisfies the criteria that the concrete and steel strain
needs to be limited within 0.006 and 0.01 respectively for an event with return period 975 years.
Looking into the performance limits stated in CHBDC 2014 that the concrete strain has to be below
0.004 and the longitudinal steel must not yield for a 1 in 975 years event, the FBD bridge pier fails
to maintain steel yielding the criteria. Steel strain reaches to yield strain earlier than the
displacement demand imposed by the mid-level seismic event. The most conservative criterion is
the steel yielding criteria for the mid-level event as can be seen from Figure 3.4a. Meeting this
criterion results in very high longitudinal reinforcement ratio (6.1%). The previous study from
Zhang et al. (2016) found similar results for major route bridges. CHBDC 2014 (CSA, 2014) does
not allow reinforcement ratio more than 6% to avoid congestion, which turns out to be very
difficult to maintain the performance criteria within this range. However, increasing the percentage
of longitudinal rebar increases the stiffness of the structure and results in lower displacement
demand. Limit strains in the materials also occur at higher load and displacement. 20-55M
longitudinal reinforcements fulfill the performance criteria according to CHBDC 2014, which is
almost 25.3% higher reinforcement than FBD pier. On the other hand, bridge pier designed
following the updated version of performance on CHBDC 2014 (CHBDC, 2016) yields about 75%
less longitudinal reinforcement than that of FBD. Since the steel performance strain limit for an

48
event of 5% probability in 50 years increased almost five folds in the recent supplement to CHBDC
2014 (CHBDC, 2016), longitudinal steel ratio demand drops drastically. The design results with
reinforcement details are displayed in Table 3.3 and Figure 3.5.
Table 3.2 Performance criteria for reinforced concrete lifeline bridges (CSA, 2014)
Seismic
ground
motion
probability
Service Damage
(CHBDC
2014)
Damage
(CHBDC
2014
supplement)
Performance
criteria
(CHBDC 2014)
Performance
criteria
(CHBDC 2014
supplement)
10% in 50
years
Immediate None Minimal - εc ≤ 0.006 and
εst ≤ 0.01
5% in 50
years
Immediate Minimal Minimal εc ≤ 0.004 and
εst ≤ εy
εc ≤ 0.006 and
εst ≤ 0.01
2% in 50
years
Service
limited
Repairable Repairable εst ≤ 0.015 εst ≤ 0.025
Here, εc = Concrete compressive strain, εst = steel strain
Table 3.3 Design cases and details
ID Design basis f’c
(MPa)
Steel
grade
fy
(MPa)
Reinforcement
percentage
Longitudinal
rebar detail
F_35/415 CHBDC 2010 35 60 415 4.87% 16-55M
P_35/415_s CHBDC 2014
supplement
35 60 415 1.22% 16-25M
P_35/415 CHBDC 2014 35 60 415 6.1% 20-55M

49
Figure 3.4 Static pushover analysis
0
200
400
600
800
1000
0 100 200 300 400 500
Ba
se
sh
ea
r (k
N)
Displacement (mm)
(a) F_35/415
εc=0.004εc=0.006εy=0.0021εs=0.01εs=0.015εs=0.0252%in50yrs5%in50yrs10%in50yrs
0
50
100
150
200
250
300
350
400
0 100 200 300 400
Ba
se
sh
ea
r (k
N)
Displacement (mm)
(b) P_35/415_s
εc=0.006
εs=0.01
εs=0.025
2%in50yrs
5%in50yrs
10%in50yrs
0
200
400
600
800
1000
1200
0 100 200 300 400 500
Ba
se
sh
ea
r (k
N)
Displacement (mm)
(c) P_35/415
εc=0.004
εy=0.0021
εs=0.015
2%in50yrs
5%in50yrs
10%in50yrs

50
Figure 3.5 Cross sections of designed bridge piers
3.4 Seismic Ground Motions
Twenty near-fault earthquake ground motions of varying magnitude and peak ground
acceleration (PGA) are selected to symbolize medium to strong ground motions. The near-fault
ground motions range from PGA value of 0.37g to 1.07g. If the subject structure is within 15 km
of a fault, then it can be categorized as NF (Caltrans, 2004). However, 10 km fault distance is
defined as near fault in CHBDC 2014 (CSA, 2014). In this study, ground motions with epicentral
distance less than 10 km are considered as near fault motions (Table 3.4). The south coast of British
Columbia is susceptible to megathrust due to the movement of the Juan de Fuca oceanic plate
under North American plate (Wagstaffe, 2016). Hundreds of small faults spread like matrix under
the British Columbia providence. There are possibilities of shallow earthquakes below some major
cities including Vancouver as well with faults under 10 km. According to Somerville (2002), NF
ground motions incorporates high ground displacement, peak velocities, and long period velocity
pulse. NF ground motions create pulse-like loading and apply high input energy on structures.
Billah and Alam (2014a) studied the vulnerability of a bridge bent retrofitted with four alternatives
for near-fault and far field ground motions. They concluded that the retrofitted bridge bents are
more susceptible to near-fault ground motions and induce higher ductility demand. The ground
motions shown in Table 3.4 are acquired from Pacific Earthquake Engineering Research (PEER)
Center earthquake database (PEER, 2011) in such a way that they represent the characteristics of
the site of the bridge pier. Naumoski et al. (1988) stated that the ratio of peak ground acceleration
(PGA) and peak ground velocity (PGV) of a ground motion indicate the frequency content and for
western Canada, this ratio is close to 1.0. However, Parghi and Alam (2017) studied the fragility
of a retrofitted bridge pier located in Vancouver for 20 ground motion suites whose PGA/PGV
ratio varied between 0.46 and 1.56 due to non-availability of adequate ground motion data in that

51
particular region. PGA/PGV ratios for the chosen ground motions in this study are between 0.37
and 1.14 and assumed to represent seismic motions in Vancouver. More than fifty percent ground
motions selected have the PGA/PGV ratio range of 0.6-1.14. To generate sufficient data to plot the
fragility curves, all the ground motions are taken into consideration. The near-fault ground motion
records are scaled to the design spectrum of Vancouver for 5% damping ratio of C soil type
SeismoMatch (SeismoMatch, 2014). Figure 3.6 demonstrates the response spectra for the different
suits of ground motions for both the original and matched motions with quartiles.
Table 3.4 Characteristics of the earthquake ground motion histories
Sl.
No.
Earthquake Year Richter
magnitude
Epicentral
distance (km)
PGA (g) PGA/PGV
1 Tabas 1978 7.4 1.2 0.90 0.81
2 Tabas 1978 7.4 1.2 0.96 0.92
3 Loma Prieta 1989 7 3.5 0.70 0.42
4 Loma Prieta 1989 7 3.5 0.46 0.50
5 Loma Prieta 1989 7 6.3 0.67 0.40
6 Loma Prieta 1989 7 6.3 0.37 0.54
7 C. Mendocino 1992 7.1 8.5 0.63 0.51
8 C. Mendocino 1992 7.1 8.5 0.65 0.71
9 Erzincan 1992 6.7 2 0.42 0.37
10 Erzincan 1992 6.7 2 0.45 0.79
11 Landers 1992 7.3 1.1 0.69 0.53
12 Landers 1992 7.3 1.1 0.79 1.14
13 Nothridge 1994 6.7 7.5 0.87 0.51
14 Nothridge 1994 6.7 7.5 0.38 0.75
15 Nothridge 1994 6.7 6.4 0.72 0.60
16 Nothridge 1994 6.7 6.4 0.58 1.11
17 Kobe 1995 6.9 3.4 1.07 0.78
18 Kobe 1995 6.9 3.4 0.56 0.80
19 Kobe 1995 6.9 4.3 0.77 0.45
20 Kobe 1995 6.9 4.3 0.42 0.67

52
Figure 3.6 Spectral motion records (a) original near-fault motions spectra (b) matched ground
motion spectra
3.5 Performance Assessment
To assess the performance of the bridge piers designed following the PBD method,
dynamic time history analyses are carried out. The above-mentioned ground motions are scaled to
match Vancouver response spectrum for an event with a probability of 2% in 50 years. The
performance limit set for this particular hazard level is the strain in reinforcing steel cannot exceed
0.015 and 0.025 in CHBDC 2014 (CSA, 2014) and the supplement to CHBDC 2014 (CHBDC,
2016) respectively. Maximum strain induced in the longitudinal reinforcements from the time
history analyses are presented in Figure 3.7. From the results, it can be seen that the performance
criteria are met for most of the ground motions. For the bridge column P_35/415_s, only four out
of twenty ground motions induced higher strain than specified (Figure 3.7a). Likewise, for the
bridge pier P_35/415, four ground motion noticeably exceeded the strain limit in steel
reinforcement (Figure 3.7b). However, the median strain value remains 0.015 and 0.023 for
P_35/415 and P_35/415_s bridge piers correspondingly, which is within the specified limit.
0
0.5
1
1.5
2
2.5
3
3.5
4
0 1 2 3 4
Sp
ectr
al A
cce
lera
tio
n (
g)
Period (sec)
50 percentile
25 percentile
75 percentile
0
0.5
1
1.5
2
2.5
3
0 1 2 3 4
Sp
ectr
al a
cce
lera
tio
n (
g)
Period (sec)
25th percentile
50th percentile
75th percentile
Design spectrum
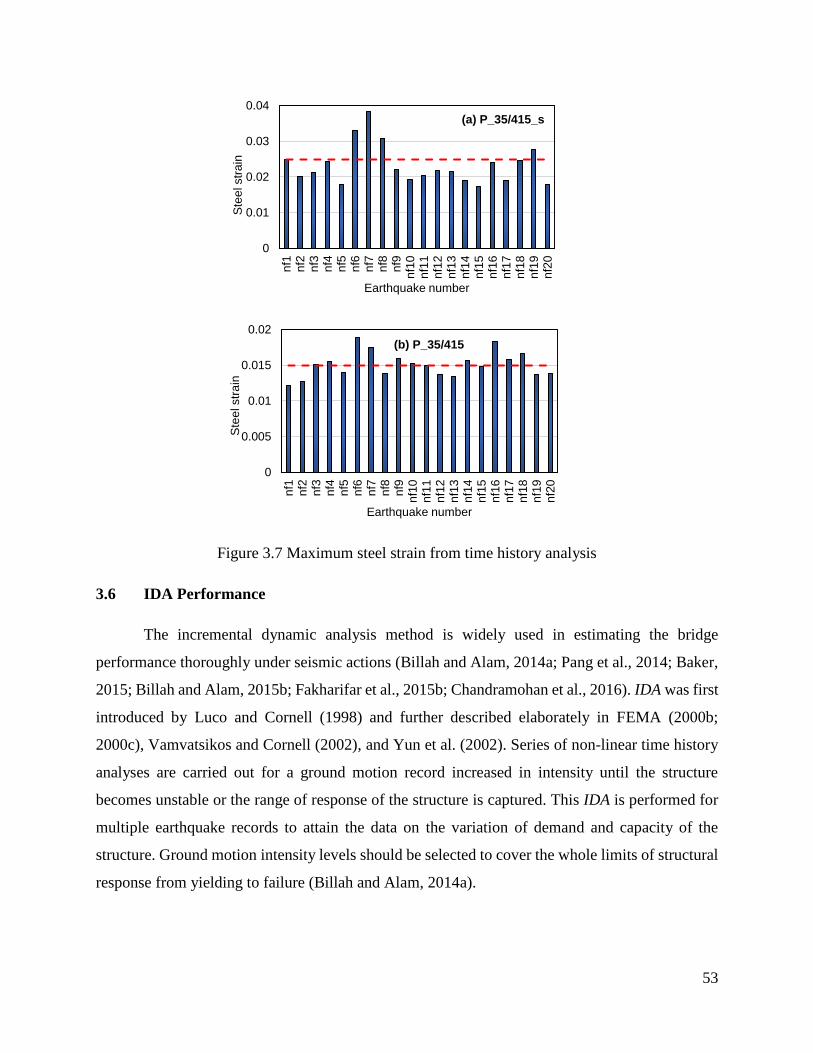
53
Figure 3.7 Maximum steel strain from time history analysis
3.6 IDA Performance
The incremental dynamic analysis method is widely used in estimating the bridge
performance thoroughly under seismic actions (Billah and Alam, 2014a; Pang et al., 2014; Baker,
2015; Billah and Alam, 2015b; Fakharifar et al., 2015b; Chandramohan et al., 2016). IDA was first
introduced by Luco and Cornell (1998) and further described elaborately in FEMA (2000b;
2000c), Vamvatsikos and Cornell (2002), and Yun et al. (2002). Series of non-linear time history
analyses are carried out for a ground motion record increased in intensity until the structure
becomes unstable or the range of response of the structure is captured. This IDA is performed for
multiple earthquake records to attain the data on the variation of demand and capacity of the
structure. Ground motion intensity levels should be selected to cover the whole limits of structural
response from yielding to failure (Billah and Alam, 2014a).
0
0.01
0.02
0.03
0.04
nf1
nf2
nf3
nf4
nf5
nf6
nf7
nf8
nf9
nf1
0n
f11
nf1
2n
f13
nf1
4n
f15
nf1
6n
f17
nf1
8n
f19
nf2
0
Ste
el str
ain
Earthquake number
(a) P_35/415_s
0
0.005
0.01
0.015
0.02
nf1
nf2
nf3
nf4
nf5
nf6
nf7
nf8
nf9
nf1
0n
f11
nf1
2n
f13
nf1
4n
f15
nf1
6n
f17
nf1
8n
f19
nf2
0
Ste
el str
ain
Earthquake number
(b) P_35/415

54
3.6.1 PGA vs. Maximum drift
A suit of 20 near-fault ground motion records as shown in Table 4 are used in executing
the IDA to determine the maximum drift capacity and yield behavior of the bridge piers under
dynamic loading. These seismic motions are matched to highest level design spectrum (2%
probability in 50 years) for Vancouver before implementing IDA.
Figure 3.8 IDA curve for maximum drift
The IDA plots are produced from the non-linear time history analysis of the bridge pier for
force-based and performance-based designs. Figure 3.8 shows the PGA versus maximum drift
percentage of the bridge pier for individual ground motion records. All the plots show somewhat
elastic behavior before starting non-linearity, and scattered curves indicate how the response varies
even for same intensity earthquakes. The diversified frequency content of ground motions can be
attributed to such behavior. PBD pier (P_35/415) designed following CHBDC 2014 show higher
stiffness than the FBD pier (F_35/415) and the PBD pier (P_35/415_s) designed following the
supplement to CHBDC 2014 in the elastic zone. Higher reinforcement ratio results in higher
0
0.5
1
1.5
2
0 2 4 6
PG
A (
g)
Maximum drift %
(a) F_35/415
Median16th Fractile84th Fractile
0
0.5
1
1.5
2
0 2 4 6
PG
A (
g)
Maximum drift %
(b) P_35/415_s
Median16th Fractile84th Fractile
0
0.5
1
1.5
2
0 2 4 6
PG
A (
g)
Maximum drift %
(c) P_35/415
Median16th Fractile84th Fractile

55
stiffness of the structure. However, the inelastic behaviors of the bridge piers are quite diversified
with gradual softening towards failure for PBD bridge columns (Figure 3.8b and 3.8c) and
undulating behavior for FBD bridge column (Figure 3.8a). The PBD pier (P_35/415_s) fails to
take more than 3g PGA earthquake whereas the FBD (F_35/415) and PBD (P_35/415) columns
can take more than 3g PGA for some ground motions. The IDA curves are random lines or function
of intensity measures (IM) (Vamvatsikos and Cornell, 2002). To understand their comparative
performance with more reliable data, the curves are also summarized in terms of 16th, 50th and 84th
fractile values. Mean, median and 84th fractile values are mostly used in engineering design (Billah
and Alam, 2014). Figure 3.8 displays the developed 16%, 50%, and 84% fractile curves in terms
of maximum drift for distinct ground motion intensities at 2% in 50 years probability level. For
PGA 1g, 16% near-fault ground motion records cause maximum drift of 2.71%, 4.67% and 2.39%
for FBD pier (F_35/415), PBD pier following the supplement to CHBDC 2014 (P_35/415_s) and
PBD pier following CHBDC 2014 (P_35/415) respectively. At the same ground motion intensity
level, 3.23%, 6.12% and 2.91% maximum drifts are induced for F_35/415, P_35/415_s and
P_35/415 bridge piers correspondingly by 50% of the seismic motions. The FBD pier (F_35/415)
displays 4.49% maximum drift by 84% ground motions at PGA 1g. On the other hand, P_35/415_s
and P_35/415 piers show 186% higher and 13.2% less maximum drift compared to F_35/415 pier.
The FBD method from CHBDC 2010 and the PBD method from CHBDC 2014 both are effective
in lowering the maximum drift of bridge pier. Serviceability and damage of bridge piers are
presented in terms of maximum drift by several researchers. Repairable damage is specified by
0.5% (Liu et al., 2012; Ghobarah, 2001) and 1.5% maximum drift (Kim and Shinozuka, 2004;
Fakharifar et al., 2015b) and the near collapse are by 2% (Liu et al., 2012), 2.5% (Ghobarah, 2001;
Kim and Shinozuka, 2004; Fakharifar et al., 2015b) and 5% (Banerjee and Shinozuka, 2008). In
this present study, the repairable damage is calculated from the pushover analysis using the
material strain criteria. For F_35/415 pier, the maximum drift of 2% (using criteria εst ≤ 0.025) and
for P_35/415_s and P_35/415 piers, the maximum drift of about 2% is considered as repairable
damage state from the criteria εst ≤ 0.025 and εst ≤ 0.015 respectively and 4% drift as collapse limit.
When the near-fault ground motions are matched to 2% in 50 years probability level, 50% motions
of 1g PGA cause unrepairable damage in bridge piers irrespective of design methods. Collapse
limit reaches to FBD column by 50% motions of 1.2g PGA. The P_35/415_s pier designed
following the supplement to CHBDC 2014 demands 33% less PGA to reach the collapse drift limit

56
by 50% ground motions considered. Lower stiffness due to less reinforcement ratio can be
attributed to such behavior of P_35/415_s pier (75% less longitudinal reinforcement than
F_35/415). The PBD bridge column P_35/415 designed according to CHBDC 2014 is within
collapse prevention range when 50% motions are considered with PGA 1.4g.
3.6.2 Yield displacement
Strain in steel is considered as an important factor since the design of both the PBD bridge
columns are governed by steel strain level. Yielding in steel does not occur at the same
displacement level under different dynamic loading. The Higher frequency with a high number of
cycles with lower intensity earthquake can cause the bridge pier yield faster than a higher intensity
earthquake with lower cycles and frequency. Displacements at yielding of the F_35/415,
P_35/415_s and P_35/415 bridge piers under scaled ground motions are shown in Figure 3.9.
Median yield displacement for FBD column is 44.5 mm (Figure 3.9a) with a standard deviation of
3.07 mm. The PBD bridge pier P_35/415 shows higher median yield displacement, and
P_35/415_s shows lower median yield displacement compared to F_35/415 pier under dynamic
motions. P_35/415_s pier is exhibiting 26.9% lower median yield displacement (Figure 3.9b)
whereas P_35/415 pier is showing 8% higher than F_35/415 pier (Figure 3.9c) at a 2% in 50 years
probability level seismic motions.
Uncertainties in load, material properties, design, and construction process can cause
unexpectedly higher load and lower resistance causing damage to structures. To fight the issue,
most of the design code uses load factor higher than 1 and material resistance factor lower than 1.
North American design codes for buildings and bridges specify the material properties of steel as
minimum requirements. Mirza and MacGregor (1979) found that the beta function can be a
potential repetitive of the yield strength of steel rebars. Bournonville et al. (2004) studied the
variability in properties of ASTM A615, A616 and A706. Statistical analysis was conducted to
find the probability distribution function of yield strength, tensile strength and weight of
reinforcement. They found similar distribution like Mirza and MacGregor (1979) for both yield
and tensile strength of steel reinforcement except higher size A615 steels. In this particular study,
yield displacements follow the Weibull distribution, which is valid for extreme conditions since
uncertainties in material properties are not considered in this study. The median yield displacement
can be used to determine the displacement ductility of the bridge piers for seismic vulnerability
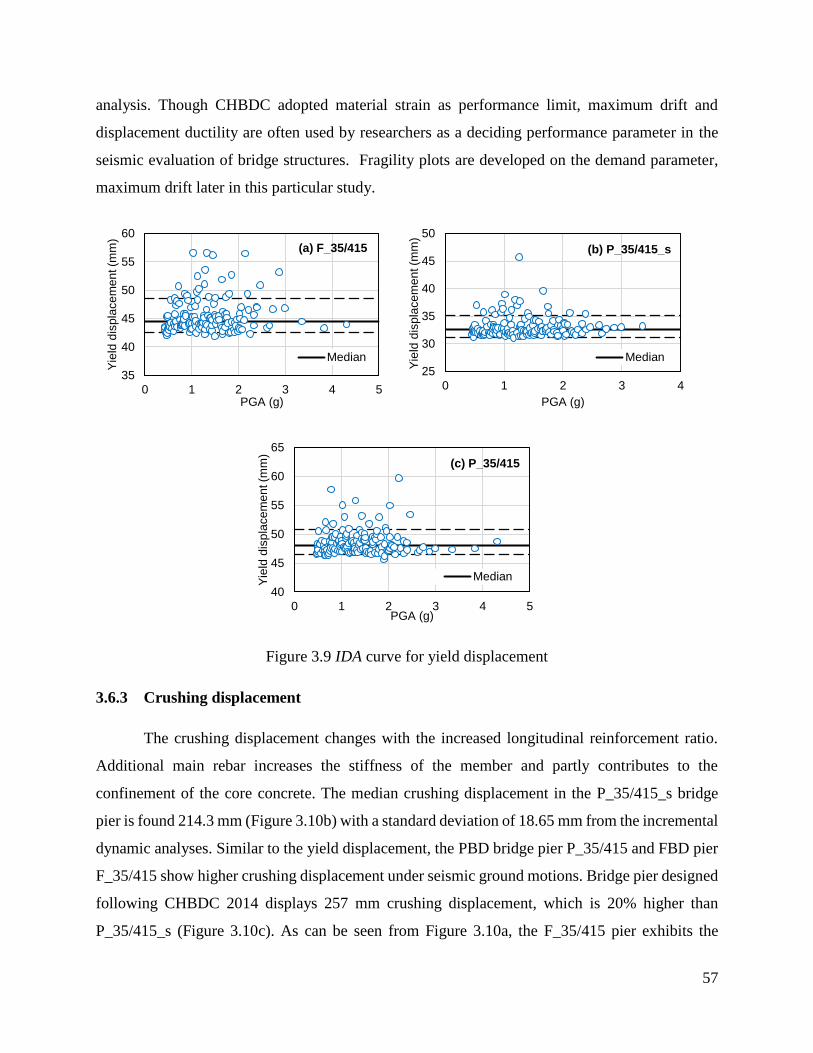
57
analysis. Though CHBDC adopted material strain as performance limit, maximum drift and
displacement ductility are often used by researchers as a deciding performance parameter in the
seismic evaluation of bridge structures. Fragility plots are developed on the demand parameter,
maximum drift later in this particular study.
Figure 3.9 IDA curve for yield displacement
3.6.3 Crushing displacement
The crushing displacement changes with the increased longitudinal reinforcement ratio.
Additional main rebar increases the stiffness of the member and partly contributes to the
confinement of the core concrete. The median crushing displacement in the P_35/415_s bridge
pier is found 214.3 mm (Figure 3.10b) with a standard deviation of 18.65 mm from the incremental
dynamic analyses. Similar to the yield displacement, the PBD bridge pier P_35/415 and FBD pier
F_35/415 show higher crushing displacement under seismic ground motions. Bridge pier designed
following CHBDC 2014 displays 257 mm crushing displacement, which is 20% higher than
P_35/415_s (Figure 3.10c). As can be seen from Figure 3.10a, the F_35/415 pier exhibits the
35
40
45
50
55
60
0 1 2 3 4 5
Yie
ld d
isp
lace
me
nt (m
m)
PGA (g)
(a) F_35/415
Median
25
30
35
40
45
50
0 1 2 3 4
Yie
ld d
isp
lace
me
nt (m
m)
PGA (g)
(b) P_35/415_s
Median
40
45
50
55
60
65
0 1 2 3 4 5
Yie
ld d
isp
lace
me
nt (m
m)
PGA (g)
(c) P_35/415
Median

58
median crushing displacement of 250.9 mm at seismic motions with 2475years of return period.
Although the longitudinal reinforcement ratio is almost five folds in P_35/415 pier compared to
P_35/415_s, the crushing displacement increases only 20%. With increased longitudinal
reinforcement percentages, the variation in crushing displacement also increases with increased
standard deviation. Crushing starts earlier in the PBD bridge column P_35/415_s at a PGA as low
as 0.8g. Whereas, crushing in the P_35/415 pier initiates at a PGA of 1.5g. The FBD from CHBDC
2010 and PBD from CHBDC 2014 yield to stronger bridge piers requiring higher intensity
earthquake for the same level of damage.
Figure 3.10 IDA curve for crushing displacement
3.7 EDP and IM Relationship
For a given intensity measure (IM) of seismic motions, the engineering demand parameters
(EDP) are determined from the inelastic simulation of structures. The response of the structure can
be portrayed in terms of pertinent engineering parameters like displacement, strain, residual
deformation, force-induced and acceleration in structure. Interstorey drift, drift ratio, floor
200
225
250
275
300
325
350
0 2 4
Cru
shin
g d
ispla
cem
ent (m
m)
PGA (g)
(a) F_35/415
Median
170
190
210
230
250
270
290
0 1 2 3 4
Cru
shin
g d
ispla
cem
ent (m
m)
PGA (g)
(b) P_35/415_s
Median
190
210
230
250
270
290
310
330
350
0 1 2 3 4 5
Cru
shin
g d
ispla
cem
ent (m
m)
PGA (g)
(c) P_35/415
Median
59
acceleration are some commonly used EDP in building analysis. For bridge structures, pier
deformation, drift, residual drift, abutment displacement, isolation bearing displacement and strain
are the characterizing engineering parameters used to identify the response depending on the
structural components involved in the analysis. Maximum drift is the most widely used response
parameter in fragility analysis of bridge piers. Whereas, peak ground acceleration (PGA) and the
spectral acceleration are the most commonly used intensity measure seismic fragility analysis
(Mackie and Stojadinovic, 2004; Nielson and DesRoches, 2007a; Shinozuka et al., 2003). In this
study, PGA is considered the IM of the ground motions to measure the response of the bridge piers
in terms of maximum drift percentage. A comparatively new intensity measure acceleration
spectral intensity (SI) are examined to understand the variation of EDP with the IM.
3.7.1 Maximum drift % vs. PGA
The relationship between the bridge piers maximum response and the ground motion
parameter PGA are displayed in Figure 3.11. As the ground motion intensity increases, the
maximum drift in bridge piers increases. These increments do not follow a linear path. Rather, the
maximum response becomes scattered, and dispersion in demand increases with the increasing
ground motion intensity. R-squared values shown in the figures do not support the linear fit of
PGA with maximum drift of bridge piers. The range of r-squared values from the regression model
is 0.45-0.72. However, at PGA less than 1g, the lower dispersion may allow predicting the response
of structure considering linear variation of EDP and IM. Most suitable correlation between PGA
and maximum drift is the logarithmic correlation in developing the probabilistic seismic demand
model, which is discussed in Chapter 4.

60
Figure 3.11 IDA performance: Maximum drift % vs. PGA
3.7.2 Maximum drift % vs. Spectrum Intensity
Spectrum Intensity (SI) is showing potential as a ground motion intensity measure in
predicting seismic response of soil deposits (Bradley et al., 2009). SI of a ground motion was first
defined by Housner (1963) as the integral of pseudo-spectral velocity (PSV) from 0.1 to 2.5 sec of
the ground motion. 5% damping ratio is commonly used in calculating the PSV. The correlation
between the maximum drift response of the designed bridge piers and the spectral intensity as a
ground motion measure is shown in Figure 3.12. Compared to PGA, SI shows smaller dispersion
in demand parameter. Maximum drift follows an increasing trend with increased SI. This trend is
somewhat linear for the FBD bridge pier F_35/415. With decreasing longitudinal reinforcement in
the PBD, the dispersion in demand parameter increases. The linearly fitted r-squared value from
the regression model varies from 0.61 to 0.78. A simplified predicting equation to determine the
EDP based on SI as an IM can also be proposed. Further investigation on the correlation between
SI and EDP are expected to consider the potency of spectral intensity as a ground motion intensity
measure.
R² = 0.7152
0
2
4
6
8
10
12
0 1 2 3 4 5
Ma
xim
um
dri
ft %
PGA (g)
(a) F_35/415
R² = 0.4501
0
2
4
6
8
10
12
14
16
0 1 2 3 4 5
Ma
xim
um
dri
ft %
PGA (g)
(b) P_35/415_s
R² = 0.7239
0
2
4
6
8
10
12
0 1 2 3 4 5
Ma
xim
um
dri
ft %
PGA (g)
(c) P_35/415

61
Figure 3.12 IDA performance: Maximum drift % vs. Acceleration Spectrum Intensity
3.8 Summary
This chapter introduces the primary objectives of this study and follows the roadmap to attain
the goals. Seismic analyses of a lifeline bridge pier designed following three different design
alternatives from CHBDC are conducted in this section. Numerical models of the bridge piers are
developed and analyzed for 20 site-specific near-fault ground motions. Incremental dynamic
analyses are carried out to assess the performances of the designed bridge piers. In total, 600
models are analyzed to develop the IDA plots and evaluate the behaviors of the bridge piers under
dynamic motions. The results from this chapter are wrapped in brief as followings.
In determining the response of bridge columns under simulated earthquake, the program
SeismoStruct can be used with acceptable accuracy. The validation of experimental load-
drift results with the analytical outcomes expresses the competency of the program for a
wide range of material properties.
R² = 0.7735
0
2
4
6
8
10
12
0 1 2 3
Ma
xim
um
dri
ft %
Acc Spectrum Intensity (g*sec)
(a) F_35/415
R² = 0.609
0
2
4
6
8
10
12
0 0.5 1 1.5 2 2.5
Ma
xim
um
dri
ft %
Acc Spectrum Intensity (g*sec)
(b) P_35/415_s
R² = 0.7485
0
2
4
6
8
10
12
0 1 2 3
Ma
xim
um
dri
ft %
Acc Spectrum Intensity (g*sec)
(c) P_35/415

62
The FBD of the lifeline bridge pier resulted in 4.87% longitudinal reinforcement. The
response modification factor for a single pier bridge bent is only 3 in CHBDC 2010, which
yields very high demand in shear. CHBDC does not specify any restriction on single pier
bridge bent for a lifeline bridge, which results in very high reinforcement ratio. The pier
designed following CHBDC 2014 performance criteria requires 6.1% main reinforcement
ratio to satisfy the performance criteria that the steel should not yield at a ground motion
with a probability of 5% in 50 years. Such highly conservative design results in
reinforcement ratio even more than the maximum allowable limit in CHBDC.
Following the supplement to CHBDC 2014, the governing design criteria for the lifeline
bridge are found to be the repairable damage in a seismic event with a return period of
2475 years. However, this criterion is less conservative compared to the criteria defined in
CHBDC 2014 and resulted in only 1.22% longitudinal reinforcement ratio. Maximum steel
tensile strain of 0.01 (almost five folds to the Grade 60 steel reinforcement steel strain)
describes the minimal damage criteria in the supplement to CHBDC 2014, which
previously was the tensile yielding of steel in CHBDC 2014.
Lower reinforcement requirement in the bridge pier designed according to the supplement
to CHBDC 2014 will minimize construction cost and construction hindrance by reducing
reinforcement congestion. However, the reduction in performance must be checked to
decide on the most suitable design method.
The IDA plots reveal that the conservative PBD of bridge pier undoubtedly experiences
lower drift at a certain intensity ground motion. Nonetheless, the drift also shows improved
performance when FBD method is used from CHBDC 2010 in designing a lifeline bridge
pier.
Increased longitudinal reinforcement percentage increases the median yield displacement
and median crushing displacement of bridge piers making it stronger against earthquakes.

63
Chapter 4 : FRAGILITY ANALYSIS
4.1 Background
Fragility analysis is a probabilistic method of measuring the potential damage to the
structural components and the structure and widely used as a seismic risk assessment tool. The
failure and damage to the bridges after a seismic event can severely hamper the transportation
facilities. To mitigate the damage cost, economic and life loss, it is utmost important to understand
the vulnerability of the bridge structure. The money invested by the stakeholders in constructing
and repairing bridge projects requires assurance over the performance of the newly constructed or
retrofitted bridge. Establishing fragility curves can provide insight into the probabilistic
performance of the bridges, which possess critical importance in prior earthquake planning and
post-disaster response management.
Many of the bridges in North America are designed and constructed before the availability
of any seismic design provision. The catastrophe happened in the Northridge earthquake acted as
an alarm to the structural engineers. After that, every bridge design code went through critical
investigation and earthquake resistant design came into action. Eventually, PBD is taking the place
of traditional FBD due to its capability of depicting structural performance explicitly. For better
perception on the bridge performance designed following different design method and risk
assessment of the bridges, fragility analysis is a viable option. This chapter of the study will play
a significant role in giving an idea of the probability-based seismic vulnerability of bridge pier
designed following different design guidelines. This chapter of the study is designed to discuss the
methodology of fragility analysis using probabilistic seismic demand model (PSDM). The process
of defining the damage states are also described here with corresponding damage fragility.
4.2 Seismic Fragility
Fragility function is a probabilistic tool that describes the probability of a structure being
damaged beyond a certain damage level for a given ground motion intensity level (Billah and
Alam, 2013; Billah and Alam, 2014c). The conditional probability of damage can be expressed as
𝐹𝑟𝑎𝑔𝑖𝑙𝑖𝑡𝑦 = 𝑃[𝐿𝑆|𝐼𝑀 = 𝑦] (4.1)

64
where limit state (LS) is the specified damage level of the structure at the given ground
motion intensity measure (IM) and y is the realized condition of the ground motion intensity
measure. Current seismic performance assessment of structures are leaning towards the fragility
analysis since it describes the likelihood of damage to the structure exceeding a certain level.
The demand placed on the structure to satisfy a specific performance level by a ground
motion intensity measure is displayed by fragility plots. Probabilistic seismic demand model
(PSDM) is used to correlate the EDP and the IM. Two common approaches to develop PSDM are
the scaling approach (Alam et al. 2012; Zhang and Huo, 2009) and the cloud approach (Choi et
al., 2004; Mackie and Stojadinović, 2004; Nielson and DesRoches, 2007a, 2007b). In the current
study, the cloud method is employed in evaluating the seismic fragility functions of the bridge
piers. Maximum drift in the bridge pier is considered as the EDP, and the PGA of each ground
motion is taken as IM. Various choices of IM such as PGA, peak ground velocity (PGV), Arias
intensity (AI), spectral acceleration (Sa), spectral displacement (Sd) at first mode period are
proposed by several researchers; but PGA is acknowledged as the most effective and optimum IM
(Padgett and DesRoches, 2008). The logarithmic correlation between median EDP and IM can be
expressed as below assuming the power law function in the cloud approach from Cornell et al.
(2002).
𝐸𝐷𝑃 = 𝑎 (𝐼𝑀)𝑏 𝑜𝑟, 𝑙𝑛 (𝐸𝐷𝑃) = 𝑙𝑛 (𝑎) + 𝑏 𝑙𝑛 (𝐼𝑀) (4.2)
where a and b are coefficients, which can be estimated from a regression analysis from
IDA. Gardoni et al. (2003) recommended that the EDPs follow the log-normal distribution. The
dispersion of the demand, βEDPǀIM can be estimated from Equation 3 (Baker and Cornell, 2006).
𝛽𝐸𝐷𝑃| 𝐼𝑀 = √∑ (ln(𝐸𝐷𝑃)−ln(𝑎𝐼𝑀𝑏))2𝑁𝑖=1
𝑁−2 (4.3)
where N= number of total simulation cases.
Fragility curves are generated using the following equation from Padgett (2007).
𝑃[𝐿𝑆|𝐼𝑀] = 𝛷[ln(𝐼𝑀)−ln (𝐼𝑀𝑛)
𝛽𝑐𝑜𝑚𝑝] (4.4)
where Φ[ ] is the standard normal cumulative distribution function and

65
𝑙𝑛(𝐼𝑀𝑛) =ln(𝑆𝑐)−ln (𝑎)
𝑏 (4.5)
IMn is defined as the median value of the intensity measure for the selected damage states,
which are discussed in the next section. The dispersion component is presented in Equation 4.6
(Padgett, 2007).
𝛽𝑐𝑜𝑚𝑝 =√𝛽𝐸𝐷𝑃| 𝐼𝑀+𝛽𝑐
2
𝑏 (4.6)
𝛽𝑐 = √ln (1 + 𝐶𝑂𝑉2) (4.7)
where Sc is the median and βc is the dispersion value for a particular damage state of bridge
component. The dispersion is calculated using the Equation 4.7 (Nielson, 2005). The coefficient
of variation (COV) is assigned to each damage state for associated uncertainty. Smaller values of
COV are assumed for slight and moderate damage states (COVslight = COVmoderate = 0.25) and larger
values for the higher damage states (COVextensive = COVcollapse = 0.5) (Billah and Alam, 2014a).
4.3 Limit States (LSs)
Damages in the bridges can be experienced by service disruption like cracking and spalling
of concrete or in the form of collapse like crushing of concrete. Any damage can cause service
interruption and economic loss. Cracking in concrete and spalling of concrete cover occur during
small to moderate earthquakes. No life safety concern is associated with this serviceability limit
states. At an extreme event with less probability, significant damage can happen to the confined
core concrete through crushing and fracture of the previously buckled rebars (Goodnight et al.,
2015). Life safety and collapse limit state are portrayed by the later damage conditions. In an
experimental investigation of the load history protocol and design parameters on the performance
limit of circular bridge piers, Goodnight et al. (2015) found the damage sequence in RC columns
as cracking in concrete, yielding of longitudinal rebars, crushing of concrete cover, yielding of
confining steel, buckling of longitudinal rebars and fracture of the previously buckled
reinforcements.
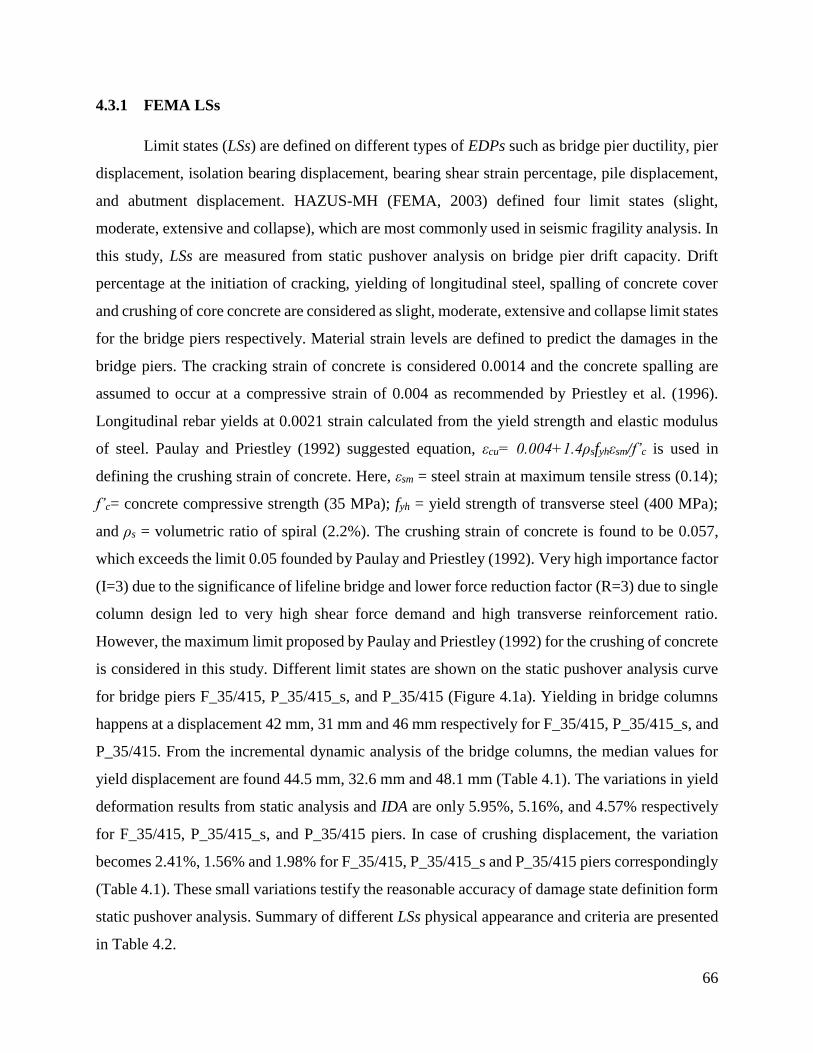
66
4.3.1 FEMA LSs
Limit states (LSs) are defined on different types of EDPs such as bridge pier ductility, pier
displacement, isolation bearing displacement, bearing shear strain percentage, pile displacement,
and abutment displacement. HAZUS-MH (FEMA, 2003) defined four limit states (slight,
moderate, extensive and collapse), which are most commonly used in seismic fragility analysis. In
this study, LSs are measured from static pushover analysis on bridge pier drift capacity. Drift
percentage at the initiation of cracking, yielding of longitudinal steel, spalling of concrete cover
and crushing of core concrete are considered as slight, moderate, extensive and collapse limit states
for the bridge piers respectively. Material strain levels are defined to predict the damages in the
bridge piers. The cracking strain of concrete is considered 0.0014 and the concrete spalling are
assumed to occur at a compressive strain of 0.004 as recommended by Priestley et al. (1996).
Longitudinal rebar yields at 0.0021 strain calculated from the yield strength and elastic modulus
of steel. Paulay and Priestley (1992) suggested equation, εcu= 0.004+1.4ρsfyhεsm/f’c is used in
defining the crushing strain of concrete. Here, εsm = steel strain at maximum tensile stress (0.14);
f’c= concrete compressive strength (35 MPa); fyh = yield strength of transverse steel (400 MPa);
and ρs = volumetric ratio of spiral (2.2%). The crushing strain of concrete is found to be 0.057,
which exceeds the limit 0.05 founded by Paulay and Priestley (1992). Very high importance factor
(I=3) due to the significance of lifeline bridge and lower force reduction factor (R=3) due to single
column design led to very high shear force demand and high transverse reinforcement ratio.
However, the maximum limit proposed by Paulay and Priestley (1992) for the crushing of concrete
is considered in this study. Different limit states are shown on the static pushover analysis curve
for bridge piers F_35/415, P_35/415_s, and P_35/415 (Figure 4.1a). Yielding in bridge columns
happens at a displacement 42 mm, 31 mm and 46 mm respectively for F_35/415, P_35/415_s, and
P_35/415. From the incremental dynamic analysis of the bridge columns, the median values for
yield displacement are found 44.5 mm, 32.6 mm and 48.1 mm (Table 4.1). The variations in yield
deformation results from static analysis and IDA are only 5.95%, 5.16%, and 4.57% respectively
for F_35/415, P_35/415_s, and P_35/415 piers. In case of crushing displacement, the variation
becomes 2.41%, 1.56% and 1.98% for F_35/415, P_35/415_s and P_35/415 piers correspondingly
(Table 4.1). These small variations testify the reasonable accuracy of damage state definition form
static pushover analysis. Summary of different LSs physical appearance and criteria are presented
in Table 4.2.

67
Table 4.1 Comparison of IDA and ISPA performance
Pier ID Yielding Crushing
Median yield
displacement
(mm)
Yield
displacement
from ISPA
Median crushing
displacement
(mm)
Crushing
displacement
from ISPA
F_35/415 44.5 42 250.9 245
P_35/415_s 32.6 31 214.3 211
P_35/415 48.1 46 257.0 252
Figure 4.1 Limit states from pushover analysis
0
200
400
600
800
1000
1200
0 100 200 300 400 500
Ba
se
sh
ea
r (k
N)
Displacement (mm)
(a) FEMA
P_35/415P_35/415_sF_35/415CrackingYielidngSpallingCrushing
0
200
400
600
800
1000
1200
0 100 200 300 400 500
Ba
se
sh
ea
r (k
N)
Displacement (mm)
(b) CHBDC
P_35/415P_35/415_sminimalextensiverepairableprobable replacement

68
Table 4.2 Damage states of bridge piers following FEMA
Limit
State
Physical
Phenomenon
(FEMA,
2003)
F_35/415 P_35/415_s P_35/415
Displacement
(mm)
Drift
%
Displacement
(mm)
Drift
%
Displacement
(mm)
Drift
%
Slight Cracking
and minor
spalling
11 0.21 12 0.23 8 0.15
Moderate Moderate
cracking and
spalling
42 0.80 31 0.59 46 0.88
Extensive Degradation
without
collapse
78 1.49 73 1.39 80 1.52
Collapse Failure
leading to
collapse
245 4.67 211 4.02 252 4.80
4.3.2 CHBDC LSs
The damage states in CHBDC 2014 and the supplement to CHBDC 2014 are defined as
minimal, extensive, repairable and probable replacement. The damage criteria and corresponding
drift limits are shown in Table 4.3. Fig. 4.1b portrays the damage states over the pushover curves
for the PBD bridge piers. For the P_35/415 bridge pier, no quantitative limit is specified in CHBDC
2014 for probable replacement of the bridge pier. Bridge pier designed following the Supplement
to CHBDC 2014 criteria is likely to experience extensive damage at a drift of 2.91% and may need
to be replaced when the drift reaches to 3.58%. On the other hand, the P_35/415 pier designed
according to CHBDC 2014 performance criteria encounters only extensive damage at 3.92% drift.
CHBDC 2014 defines material strain limit for different serviceability conditions. However,
no damage limit is defined to represent the cracking or slight damage in CHBDC 2014 (Zhang,
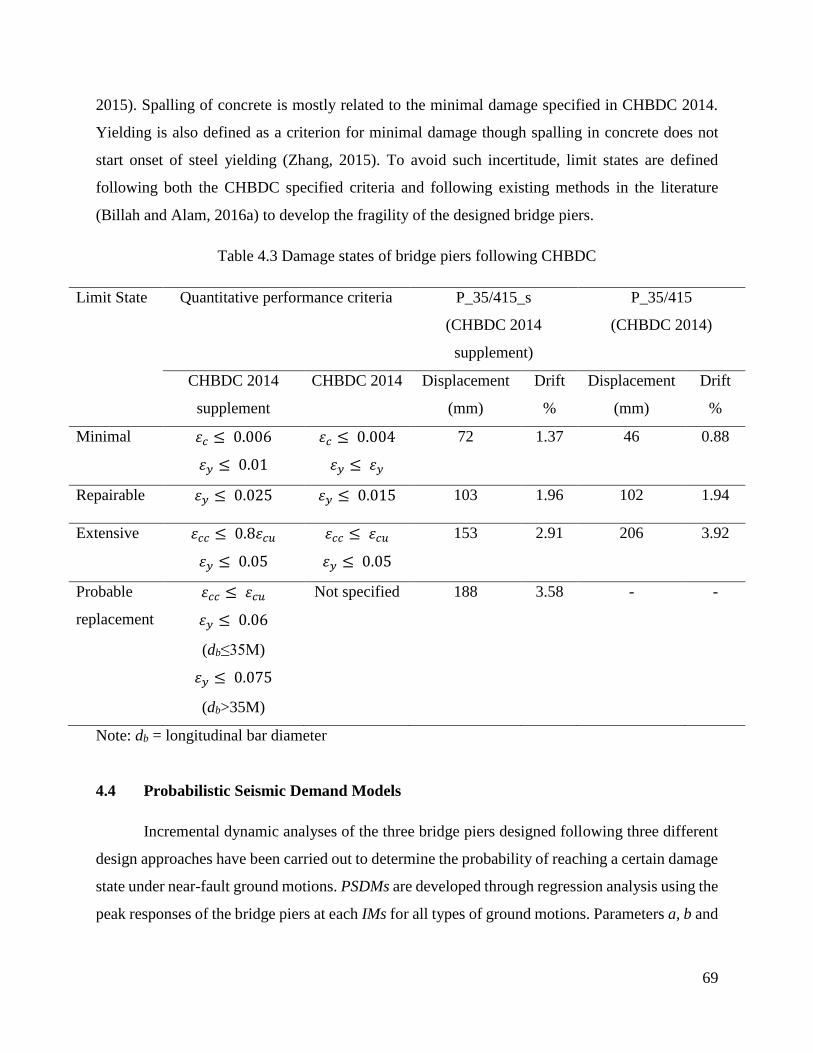
69
2015). Spalling of concrete is mostly related to the minimal damage specified in CHBDC 2014.
Yielding is also defined as a criterion for minimal damage though spalling in concrete does not
start onset of steel yielding (Zhang, 2015). To avoid such incertitude, limit states are defined
following both the CHBDC specified criteria and following existing methods in the literature
(Billah and Alam, 2016a) to develop the fragility of the designed bridge piers.
Table 4.3 Damage states of bridge piers following CHBDC
Limit State Quantitative performance criteria P_35/415_s
(CHBDC 2014
supplement)
P_35/415
(CHBDC 2014)
CHBDC 2014
supplement
CHBDC 2014 Displacement
(mm)
Drift
%
Displacement
(mm)
Drift
%
Minimal 𝜀𝑐 ≤ 0.006
𝜀𝑦 ≤ 0.01
𝜀𝑐 ≤ 0.004
𝜀𝑦 ≤ 𝜀𝑦
72 1.37 46 0.88
Repairable 𝜀𝑦 ≤ 0.025 𝜀𝑦 ≤ 0.015 103 1.96 102 1.94
Extensive 𝜀𝑐𝑐 ≤ 0.8𝜀𝑐𝑢
𝜀𝑦 ≤ 0.05
𝜀𝑐𝑐 ≤ 𝜀𝑐𝑢
𝜀𝑦 ≤ 0.05
153 2.91 206 3.92
Probable
replacement
𝜀𝑐𝑐 ≤ 𝜀𝑐𝑢
𝜀𝑦 ≤ 0.06
(db≤35M)
𝜀𝑦 ≤ 0.075
(db>35M)
Not specified 188 3.58 - -
Note: db = longitudinal bar diameter
4.4 Probabilistic Seismic Demand Models
Incremental dynamic analyses of the three bridge piers designed following three different
design approaches have been carried out to determine the probability of reaching a certain damage
state under near-fault ground motions. PSDMs are developed through regression analysis using the
peak responses of the bridge piers at each IMs for all types of ground motions. Parameters a, b and

70
βEDPǀIM are calculated from the regression analysis. Fragility curves for the bridge piers are
established using these parameters and Equation 4.3 to 4.7.
Figures 4.2a shows the PSDMs for maximum drift demand of F_35/415 pier and Figures
4.2b, 4.2c displays for P_35/4151_s and P_35/415 piers respectively under near-fault motions. R-
squared values are in proximity for all the PSDMs. Also, the r-squared values vary between 0.78
and 0.86, which indicates reasonably well correlation between the EDP and IM. The fragilities are
estimated from the limiting capacity of each damage state and PSDMs parameters.
Table 4.4 compares the effect of different design methods on the demand models. The
regression parameters from Equation 2 are presented here along with dispersion. From the table,
it is clear that PBD following the new supplement to CHBDC 2014 yields higher values than FBD
from CHBDC 2010 and PBD from CHBDC 2014 in case of maximum drift of the bridge pier.
These explain the higher susceptibility of bridges to near-fault ground motions when designed
following the PBD method from the new supplement. In comparison to F_35/415 and P_35/415,
P_35/415_s shows higher intercept (ln(a)) and slope (b) of the regression model, which increases
the demand placed on the bridge piers. Higher dispersion indicates the increased variation of
demand values predicted by the regression models.
Table 4.4 PSDMs for different design methods
EDP→
F_35/415 P_35/415_s P_35/415
Maximum Drift %
a 3.44 5.49 3.13
b 1.11 1.13 1.10
βEDP│IM 0.330 0.453 0.333

71
Figure 4.2 Probabilistic seismic demand models (PSDMs)
4.5 Fragility Analysis
Fragility functions are presented in the form of fragility curves of the designed bridge piers.
PSDMs developed for the bridge piers are used to calculate the parameter a and b. Following the
Equation from 4.3 to 4.7 and employing the limit states obtained from static pushover analysis,
fragility curves for the bridge piers are generated for FEMA and CHBDC specified damage states.
4.5.1 Fragilities for FEMA specified DSs
Figure 4.3 demonstrates the fragility curves of the three reinforced concrete bridge piers
designed according to force-based and PBD method specified in CHBDC for near-fault ground
motions up to PGA 2g. Among the three piers, the PBD pier P_35/415_s designed following the
supplement to CHBDC 2014 is the most vulnerable one. It is clear from Figure 4.3 that for these
particular loadings, site scenario and pier configuration, the damage probability of a bridge pier
lessens if PBD from CHBDC 2014 or FBD from CHBDC 2010 is employed.
y = 1.1087x + 1.2366R² = 0.8583
-2
-1
0
1
2
3
4
-3 -2 -1 0 1 2
ln (
Dri
ft %
)
ln (PGA)
(a) F_35/415
y = 1.1264x + 1.7043R² = 0.7787
-2
-1
0
1
2
3
4
-3 -2 -1 0 1 2
ln (
Dri
ft %
)
ln (PGA)
(b) P_35/415_s
y = 1.1015x + 1.1401R² = 0.8592
-2
-1
0
1
2
3
4
-3 -2 -1 0 1 2
ln (
Dri
ft %
)
ln (PGA)
(c) P_35/415

72
At PGA value 1g for near-fault earthquakes, the probability of slight, moderate, extensive
and collapse damage to all the bridge pier is essentially 100%. Damage in P_35/415_s starts earlier
than F_35/415 and P_35/415 pier. 50% slight damage happens in F_35/415 and P_35/415_s pier
at a PGA value as low as 0.08g and 0.07g respectively. The same damage probability is found at
PGA 0.08g in P_35/415 pier. Extensive damage probability becomes 0.5 for the bridge column
designed following CHBDC 2014 performance code at PGA 0.34g while for the pier designed
with the FBD method from CHBDC 2010, the similar damage starts at 14.7% lower PGA
earthquake. The PBD pier P_35/415_s is the most sensitive to damage where the 50% extensive
damage possibility is found at 0.12g PGA (58.6% and 64.7% lower than F_35/415 and P_35/415
respectively). The behavior of bridge piers regarding collapse fragility varies substantially.
Collapse probability in F_35/415 and P_35/415 piers starts just after 0.6g and 0.75g PGA
correspondingly. However, P_35/415_s pier exhibits initiation of collapse damage at a lower PGA
(0.25g PGA). At design PGA 0.463g, there is 12% probability that the PBD pier designed
following the supplement to CHBDC 2014 will collapse. However, the FBD of the pier from
CHBDC 2010 and PBD from CHBDC 2014 lower the probability to almost 0% at design PGA of
0.463g. The collapse in the P_35/415 pier designed following CHBDC 2014 performance codes
shows strong behavior maintaining the collapse possibility to 50% at 1.89g PGA earthquake.
Extremely high percentage of longitudinal reinforcement ratio not only increases the stiffness and
yield performance, but maximum response capacity during dynamic loading also increases
remarkably leading to higher ductility in structure. At PGA 1g, expected collapse damage risks are
13.6%, 66.4% and 6.3% for F_35/415, P_35/415_s and P_35/415 piers correspondingly.

73
Figure 4.3 Fragility curves for FEMA specified limit states (a) FBD pier, (b) PBD pier following
the supplement to CHBDC 2014 (c) PBD pier following CHBDC 2014
0
0.2
0.4
0.6
0.8
1
0 0.5 1 1.5 2
Pro
ba
bili
ty o
f D
am
ag
e
PGA (g)
(a) F_35/415
SlightModerateExtensiveCollapse
0
0.2
0.4
0.6
0.8
1
0 0.5 1 1.5 2
Pro
ba
bili
ty o
f D
am
ag
e
PGA (g)
SlightModerateExtensiveCollapse
0
0.2
0.4
0.6
0.8
1
0 0.5 1 1.5 2
Pro
ba
bili
ty o
f D
am
ag
e
PGA (g)
SlightModerateExtensiveCollapse
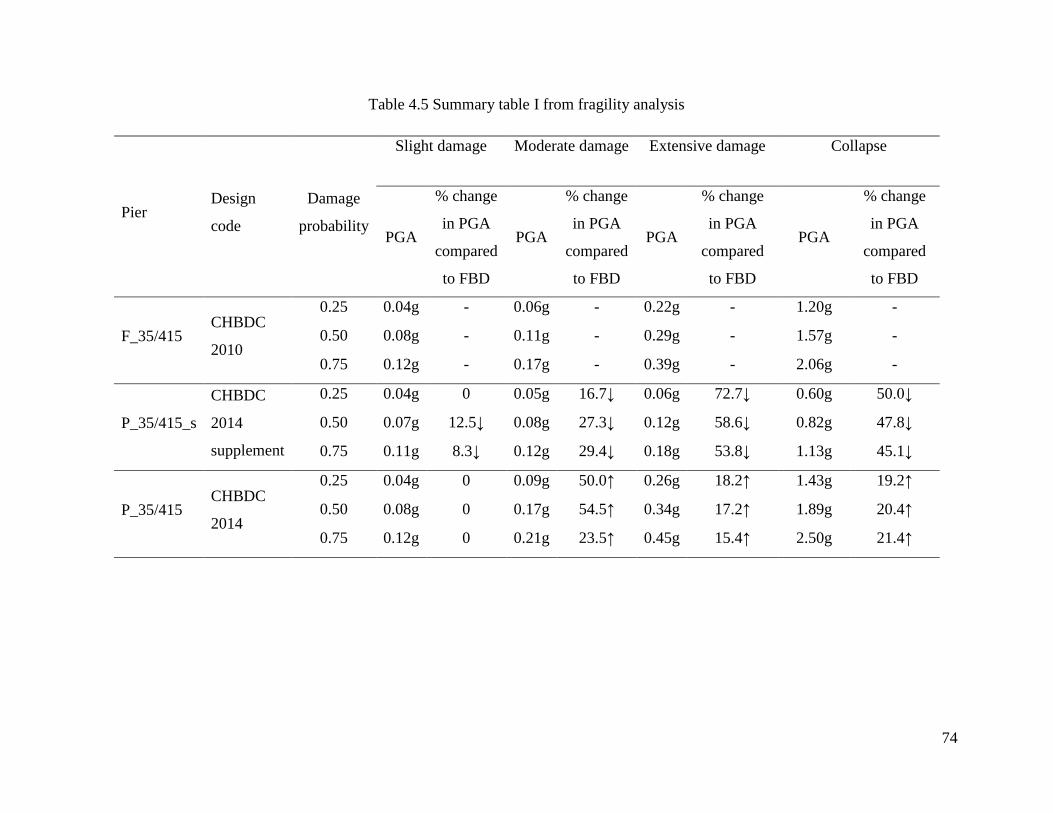
74
Table 4.5 Summary table I from fragility analysis
Pier Design
code
Damage
probability
Slight damage Moderate damage Extensive damage Collapse
PGA
% change
in PGA
compared
to FBD
PGA
% change
in PGA
compared
to FBD
PGA
% change
in PGA
compared
to FBD
PGA
% change
in PGA
compared
to FBD
F_35/415 CHBDC
2010
0.25 0.04g - 0.06g - 0.22g - 1.20g -
0.50 0.08g - 0.11g - 0.29g - 1.57g -
0.75 0.12g - 0.17g - 0.39g - 2.06g -
P_35/415_s
CHBDC
2014
supplement
0.25 0.04g 0 0.05g 16.7↓ 0.06g 72.7↓ 0.60g 50.0↓
0.50 0.07g 12.5↓ 0.08g 27.3↓ 0.12g 58.6↓ 0.82g 47.8↓
0.75 0.11g 8.3↓ 0.12g 29.4↓ 0.18g 53.8↓ 1.13g 45.1↓
P_35/415 CHBDC
2014
0.25 0.04g 0 0.09g 50.0↑ 0.26g 18.2↑ 1.43g 19.2↑
0.50 0.08g 0 0.17g 54.5↑ 0.34g 17.2↑ 1.89g 20.4↑
0.75 0.12g 0 0.21g 23.5↑ 0.45g 15.4↑ 2.50g 21.4↑

75
Table 4.6 Summary table II from fragility analysis
Pier PGA
Slight damage Moderate damage Extensive damage Collapse
Damage
probability
% change
in damage
compared
to FBD
Damage
probability
% change
in damage
compared
to FBD
Damage
probability
% change
in damage
compared
to FBD
Damage
probability
% change
in damage
compared
to FBD
F_35/415
0.25g 1.00 - 0.98 - 0.38 - 0 -
0.5g 1.00 - 0.99 - 0.91 - 0.01 -
1.0g 1.00 - 1.00 - 0.99 - 0.13 -
1.5g 1.00 - 1.00 - 1.00 - 0.46 -
P_35/415_s
0.25g 1.00 0 0.99 1.0↑ 0.92 142.1↑ 0.01 100↑
0.5g 1.00 0 0.99 0 0.99 8.8↑ 0.16 150↑
1.0g 1.00 0 1.00 0 1.00 1.0↑ 0.66 407.7↑
1.5g 1.00 0 1.00 0 1.00 0 0.89 93.5↑
P_35/415
0.25g 1.00 0 0.90 8.2↓ 0.22 42.1↓ 0 0
0.5g 1.00 0 0.99 0 0.83 8.8↓ 0 100↓
1.0g 1.00 0 1.00 0 0.99 0 0.06 53.8↓
1.5g 1.00 0 1.00 0 1.00 0 0.29 36.9↓

76
Fragility performances of the bridge piers are summarized in tabulated form as displayed
in Table 4.5 and Table 4.6. PGAs that cause 25%, 50% and 75% probability of different damage
levels for force-based and PBD column are outlined in Table 4.5. Percentage variation in PGA for
PBD pier compared to FBD pier are also presented. Likewise, damage probability and their
variation at 0.25g, 0.5g, 1g and 1.5g PGA seismic motions are compiled in Table 4.6. It is apparent
that from the tables that the damage probability decreases when PBD method from CHBDC 2014
and FBD method from CHBDC 2010 are adopted; especially the collapse performance improves
significantly. Current PBD practice following CHBDC 2104 supplement decreases ground motion
intensity requirement 12.5% for 50% slight damage, 52.9% for 50% moderate damage, 64.7% for
50% extensive damage and 56.6% for 50% collapse probability of bridge pier compared to PBD
method from CHBDC 2014. The P_35/415 pier designed following CHBDC 2014 performance
criteria takes roughly 54.5%, 17.2%, and 20.4% higher intensity earthquake for similar moderate,
extensive and collapse damage probability than F_35/415 pier. Though the supplement to CHBDC
2014 provides performance criteria in such a way to ensure economic feasibility and reduced
construction hindrance due to reinforcement congestion, very low longitudinal reinforcement
resulted from relaxed criteria and comparatively poor seismic performance, make the supplement
to CHBDC 2014 less attractive for a lifeline bridge pier. Table 4.6 demonstrates that at high-
intensity earthquakes, FBD from CHBDC 2010 can also noticeably decrease the slight, moderate
and extensive damage probabilities. Besides, at low-intensity motion (0.5g PGA), collapse
probability reduces significantly in F_35/415 and P_35/415 pier compared to P_35/415_s pier.
4.5.2 Fragilities for CHBDC specified DSs
Fragilities of the PBD bridge piers following the CHBDC damage states are presented in
Fig. 4.4. Minimal, repairable and extensive damage limits are indicated quantitatively in CHBDC
2014 (CSA, 2014), and the damage probabilities of P_35/415 pier are displayed in Fig. 4.4b. There
is 50% probability of minimal, repairable and extensive damage at 0.17g PGA, 0.51g PGA and
1.4g PGA earthquake respectively when the bridge pier is designed following CHBDC 2014. The
bridge pier P_35/415_s shows the same minimal damage at PGA 0.12g. Since the minimal damage
criteria changed from steel yielding to 0.01 strain limit in steel in the newly published supplement,
it increased the minimal damage drift to 1.37% from 0.88% (Table 4.3). However, the minimal
damage fragility increases due to lower reinforcement demand in the bridge pier P_35/415_s.

77
Likewise, the other damage case scenarios are also similar. 50% repairable and 50% extensive
damage probability happens at 56.8% and 45.7% lower PGA earthquakes in P_35/415_s pier than
that of P_35/415 pier. The relaxed performance criteria in the supplement to CHBDC 2014 leads
to lower longitudinal reinforcement ratio. This reduced main reinforcement increases the seismic
damage vulnerability in the bridge pier. 0.76g PGA ground motion shows 50% damage probability
that may cause failure to the pier P_35/415_s and necessitate the replacement. At PGA 1g, the
repairable and extensive damage probability in pier P_35/415_s are 100% and 96% respectively.
Whereas, for P_35/415 pier these probabilities are 98% (2% lower) and 21% (78% lower)
correspondingly.
Figure 4.4 Fragility curves for CHBDC limit states (a) PBD pier following the supplement to
CHBDC 2014 (b) PBD pier following CHBDC 2014
4.6 Summary
Fragility analyses of the lifeline bridge piers designed following the FBD and PBD
approaches are carried out and presented in this section. Designing the bridge pier according to the
supplement to CHBDC 2014 yielded only 1.22% longitudinal reinforcement ratio whereas the
highly conservative CHBDC 2014 performance criteria and the FBD from CHBDC 2010
guidelines resulted in 6.1% and 4.87% longitudinal reinforcement correspondingly. It is evident
that the seismic vulnerability of these bridge piers will be different due to their main reinforcement
ratio. Damage states are defined individually for each bridge pier from static pushover analysis.
PSDMs are developed from the IDA results, and fragility curves are plotted using equations
described in this chapter. The following outcomes are summarized from this section.
0
0.2
0.4
0.6
0.8
1
0 0.5 1 1.5
Pro
ba
bili
ty o
f D
am
ag
e
PGA (g)
(a) P_35/415_s
Minimal
Repairable
Extensive
Probablereplacement
0
0.2
0.4
0.6
0.8
1
0 0.5 1 1.5
Pro
ba
bili
ty o
f D
am
ag
e
PGA (g)
(b) P_35/415
Minimal
Repairable
Extensive

78
Limit states of the bridge pier can be defined from static pushover analysis with reasonable
accuracy. The median yield displacement and median crushing displacement of the
designed bridge piers obtained from IDA are in proximity to the corresponding values
derived from inelastic static pushover analyses plots.
CHBDC specified damage states for bridge piers are minimal, repairable, extensive and
probable replacement. Definite performance criteria for concrete cracking and slight
damage are absent in CHBDC performance guidelines. Minimal damage is associated with
steel yielding and concrete strain of 0.004 as stated in CHBDC 2014, which is dubious. No
specific criteria present in the CHBDC 2014 for collapse or probable replacement of bridge
pier. The supplement to CHBDC 2014 has quantified all the damage criteria with
noticeable modifications.
For the bridge pier P_35/415 designed following CHBDC 2014, the damage states in term
of maximum drift are found 0.88%, 1.94%, and 3.92% respectively for minimal, repairable
and extensive damage. For the pier P_35/415_s, the similar LSs are calculated at 1.37%,
1.96%, 2.91% and 3.58% for the probable replacement.
Limit states are developed using FEMA mentioned physical phenomenon. All the slight,
moderate, extensive and collapse damage limits are tabulated in Table 4.2. Collapse criteria
of FBD and PBD bridge piers vary significantly.
Bridge pier designed following CHBDC 2014 code shows lowest seismic vulnerability
considering the LSs from both FEMA and CHBDC. The pier P_35/415_s designed
according to criteria from the supplement to CHBDC 2014 shows higher damage
probability than P_35/415 due to lower reinforcement ratio. The performance in term of
fragility is much better in the FBD bridge pier F_35/415 than the P_35/415_s pier. PGA at
50% collapse probability decreased about 47.8% when the new performance criteria used
than that of traditional FBD method. Moreover, at PGA 0.5g, the collapse possibility
increases about 150%. The newly published performance criteria in the supplement to
CHBDC 2014 can be used in designing lifeline bridge piers for economic benefit, but the
seismic performance is not even with the FBD pier from CHBDC 2010 and the PBD pier
from CHBDC 2014.

79
Chapter 5 : EFFECT OF REINFORCING STEEL STRENGTH ON THE
PERFORMANCE-BASED DESIGN OF BRIDGE PIER
5.1 Background
Reinforcement in RC structure is a critical ingredient that can control the behavior of the
structure during a seismic event. Very limited number of research are available in the literature on
the dynamic behavior of RC structural elements reinforced with high strength steel under simulated
earthquake loading. To date, there is no research has been published on the effect of reinforcing
steel strength on the PBD of bridge column. A number of ASTM steel grades are available to
design bridge piers. However, it would be time-consuming and pricey to test the dynamic
performance of bridge components to investigate the effect of steel strength and ductile properties.
Simulating with proper validation can give an insight on the seismic performance of the RC bridge
piers before in-field applications.
This chapter focuses on the performance of a lifeline bridge pier designed following the
CHBDC 2014 and reinforced with various ASTM grade longitudinal steel rebars and varying
concrete strength. The geometric and design details of the studied bridge pier are elaborately
discussed with appropriate simulation technique. Twenty ground motions are selected from PEER
ground motion database (PEER, 2011) to assess the performance of the designed bridge pier
through dynamic analysis. Responses of the bridge piers are plotted in terms of IDA curves and
fragility curves to apprehend the effect of reinforcing steel and concrete strength on the PBD of
the bridge pier.
5.2 Bridge Pier Geometry
The bridge pier considered in this study is a circular reinforced concrete bridge pier located
in Vancouver, BC and is seismically designed first following CHBDC 2010 (CSA, 2010). The
considered bridge is a lifeline bridge. In the event of the design earthquake (return period of 475
years), a lifeline bridge needs to remain open for immediate use to all traffic as per CHBDC 2010.
Therefore, the piers need to be designed to achieve this targeted performance. According to
CHBDC 2010, the importance factor of I=3 and the response modification factor of R=3 are
considered for this lifeline bridge. The diameter of the column designed is fixed to be 1.83 m.
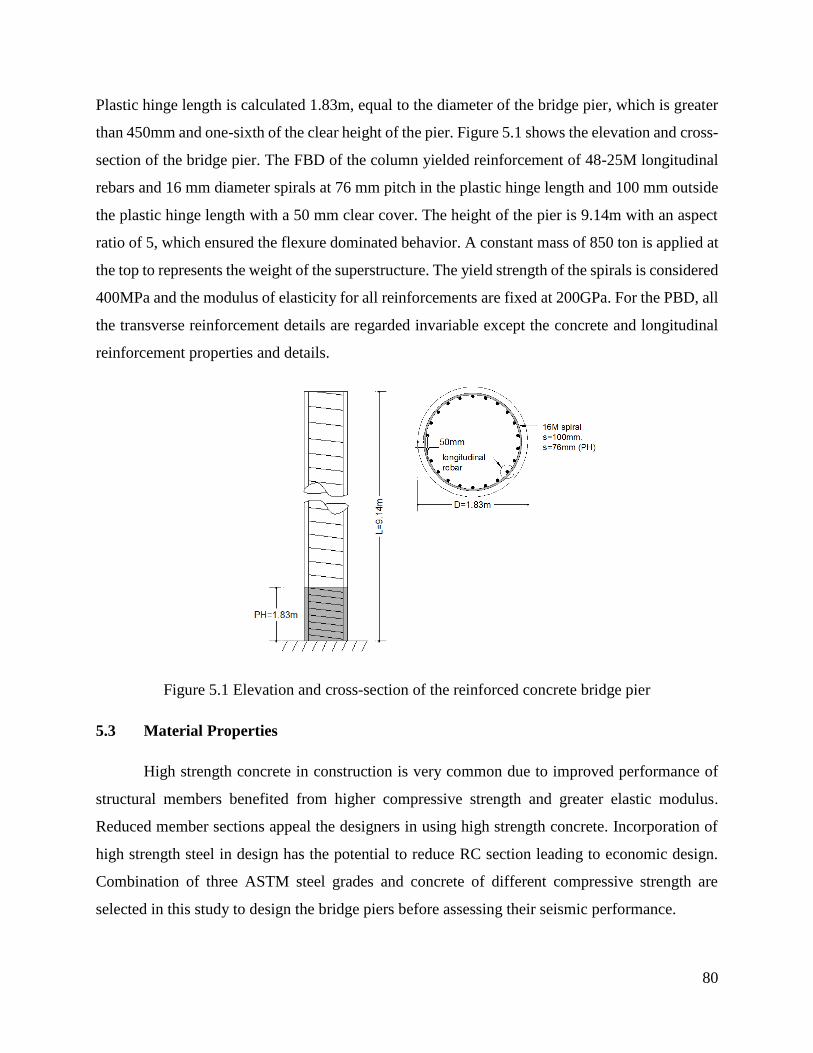
80
Plastic hinge length is calculated 1.83m, equal to the diameter of the bridge pier, which is greater
than 450mm and one-sixth of the clear height of the pier. Figure 5.1 shows the elevation and cross-
section of the bridge pier. The FBD of the column yielded reinforcement of 48-25M longitudinal
rebars and 16 mm diameter spirals at 76 mm pitch in the plastic hinge length and 100 mm outside
the plastic hinge length with a 50 mm clear cover. The height of the pier is 9.14m with an aspect
ratio of 5, which ensured the flexure dominated behavior. A constant mass of 850 ton is applied at
the top to represents the weight of the superstructure. The yield strength of the spirals is considered
400MPa and the modulus of elasticity for all reinforcements are fixed at 200GPa. For the PBD, all
the transverse reinforcement details are regarded invariable except the concrete and longitudinal
reinforcement properties and details.
Figure 5.1 Elevation and cross-section of the reinforced concrete bridge pier
5.3 Material Properties
High strength concrete in construction is very common due to improved performance of
structural members benefited from higher compressive strength and greater elastic modulus.
Reduced member sections appeal the designers in using high strength concrete. Incorporation of
high strength steel in design has the potential to reduce RC section leading to economic design.
Combination of three ASTM steel grades and concrete of different compressive strength are
selected in this study to design the bridge piers before assessing their seismic performance.

81
5.3.1 Steel
High strength steel rebars are characterized by lower carbon than that of low strength steel
rebars. Chromium content is higher in HSR like ASTM A1035 to provide higher tensile properties
compared to ASTM A615 steel. The actual stress-strain plots for various grade steel tested in WJE
laboratories are shown in Figure 5.2 (Graham and Paulson, 2008). Monotonic axial compression
testing was carried out in accordance to ASTM E9. The total elongation was measured over a
gauge length of 8 inches. It displays the fracture elongation or increase in length over 8 inches
gauge length.
As displayed in Figure 5.2, ASTM A1035 (Grade 100 and Grade 120) steel bar exhibits a
linear trend in stress-strain plots up to 600MPa. A well-defined yield plateau is absent in the stress-
strain curve of ASTM A1035 steel bars. The 2% offset method is usually used to find out the yield
strength of steel grade equal and higher to 100. The maximum tensile strength reached beyond
1000MPa at strain range of 0.04 mm/mm to 0.06 mm/mm. Fracture elongations of the ASTM
A1035 rebars were found 7.35% and 7.09% for Grade100 and Grade120 rebars respectively. The
total elongation of steel rebar can vary from 0.08 to 0.10 for ASTM A1035 steel (Graham and
Paulson, 2008).
Figure 5.2 Stress-strain curves for various grades of steel rebar (from Graham and Paulson,
2008)
In this current study, the three types of steel grade are considered and combined with three
different strength concrete in designing the bridge piers and analyzing them under earthquake
0
200
400
600
800
1000
1200
0 0.05 0.1 0.15 0.2
Str
ess (
Mp
a)
Strain (mm/mm)
ASTM A1035 (Grade 120)
ASTM A1035 (Grade 100)
ASTM A615 (Grade 75)
ASTM A615 (Grade 60)

82
loadings. Minimum yield strength specified by ASTM are used in the analyses. However, total
elongation of the steel rebars are taken from Graham and Paulson (2008) described stress-strain
curves (Figure 5.2) to account for the ductility of the actual case scenario. Though the fracture
elongation depends on the bar diameter, for simplicity uniform fracture percentage are considered
irrespective of assigned diameter. The total elongation for ASTM A615 Grade 80 rebars is
assumed 12.25% from the mean of the total elongation test data presented in Overby et al. (2015).
Table 5.1 Material properties of the steel grades used in analysis
ASTM Grade Designation Yield strength
(ksi)
Yield strength
(MPa)
Total
elongation
60 A 615 60 415 14.3%
80 A 615 80 550 12.25%
120 A1035 120 830 7.09%
5.3.2 Concrete
Three different concrete strengths of 35MPa, 50MPa, and 70MPa are used in designing the
lifeline bridge pier. Table 5.2 shows the typical properties of the concrete. To find out the concrete
strain at peak stress, several researchers proposed linear relationship as a function of the
compressive strength of concrete. For normal strength concrete, strain at peak stress is proximity
to 0.002. However, for high strength concrete, linearity in the ascending branch of stress-strain
curve is larger causing higher strain at peak stress (Attard and Setunge, 1996). The equation 𝜀𝑐 =
𝑓𝑐′
𝐸𝑐
4.26
√𝑓𝑐′4 is used in determining the strain at peak stress from Setunge (1993) for crushed aggregate.
Here, f’c is the compressive strength of concrete (MPa) and Ec is the elastic modulus of concrete
(MPa) calculated using the simplified formula 𝐸𝑐 = 4700√𝑓𝑐′ provided by ACI 318 (ACI, 1983)
for normal-weight concrete. Splitting tensile strength is predicted using the recommended equation
𝑓𝑠𝑝′ = 0.59√𝑓𝑐
′ MPa from ACI (1984).

83
Table 5.2 Concrete properties used in analysis
Compressive strength
(MPa)
Tensile splitting
strength (MPa)
Elastic modulus
(MPa)
Strain at peak stress
35 3.5 27806 0.00221
50 4.17 33234 0.00241
70 4.94 39323 0.00262
5.4 Design of Bridge Pier
Changed reinforced percentage possesses a significant effect on the stiffness of the
structural member. During calculation of displacement demand, the effective or cracked stiffness
of the structure should be incorporated. The pre-cracking response of a member is governed by the
gross moment of inertia and concrete modulus, but the post-cracking behavior largely relies on the
cracked moment of inertia, which depends on the longitudinal reinforcement percentage. There
are two apparent methods of designing an RC member to avoid congestion of reinforcement, (1)
increasing the member section dimension to make room for reinforcements, which is not an
economically efficient solution and (2) decreasing longitudinal reinforcement ratio providing high
strength steel. However, ACI 318 and AASHTO limits the design of longitudinal reinforcement
with Grade 100 and Grade 120 reinforcement. Grade 100 steel is allowed in designing transverse
reinforcements for seismically active regions. Reducing the number of reinforcement with HSR
can lead to higher displacement demand due to lower flexural stiffness. A study from Rautenberg
(2011) defended the concept that the initial stiffness is the driving parameter for peak drift of RC
members. Laughery (2016) experimentally tested two different types of portal frames reinforce
with conventional and high strength steel to check the same hypothesis. He found that the peak
response of the RC structure is depended on the initial stiffness calculated from gross cross-
sectional properties. He also concluded that reducing reinforcement ratio associated with HSR
does not necessarily cause larger peak drift since the variation in stiffness was not large. Elastic
stiffness ratios are assumed from Figure 5.3 as explained in Paulay and Priestley (1992) to calculate
the cracked moment of inertia of the bridge pier sections.
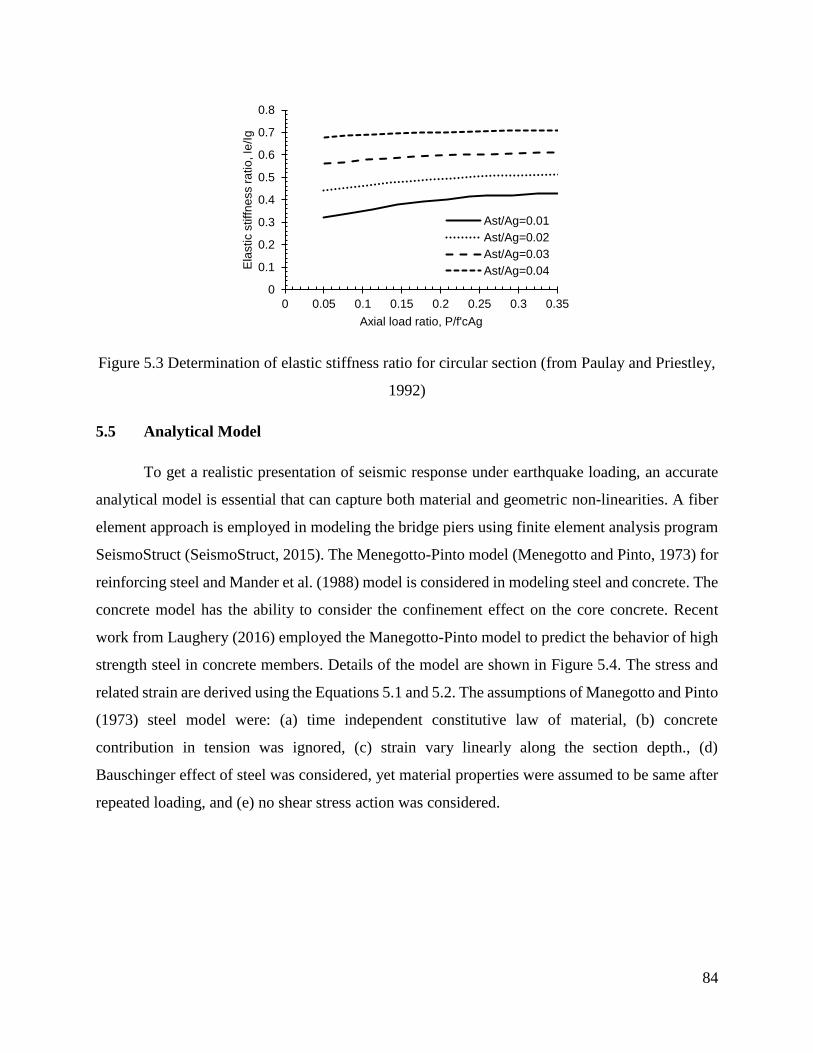
84
Figure 5.3 Determination of elastic stiffness ratio for circular section (from Paulay and Priestley,
1992)
5.5 Analytical Model
To get a realistic presentation of seismic response under earthquake loading, an accurate
analytical model is essential that can capture both material and geometric non-linearities. A fiber
element approach is employed in modeling the bridge piers using finite element analysis program
SeismoStruct (SeismoStruct, 2015). The Menegotto-Pinto model (Menegotto and Pinto, 1973) for
reinforcing steel and Mander et al. (1988) model is considered in modeling steel and concrete. The
concrete model has the ability to consider the confinement effect on the core concrete. Recent
work from Laughery (2016) employed the Manegotto-Pinto model to predict the behavior of high
strength steel in concrete members. Details of the model are shown in Figure 5.4. The stress and
related strain are derived using the Equations 5.1 and 5.2. The assumptions of Manegotto and Pinto
(1973) steel model were: (a) time independent constitutive law of material, (b) concrete
contribution in tension was ignored, (c) strain vary linearly along the section depth., (d)
Bauschinger effect of steel was considered, yet material properties were assumed to be same after
repeated loading, and (e) no shear stress action was considered.
0
0.1
0.2
0.3
0.4
0.5
0.6
0.7
0.8
0 0.05 0.1 0.15 0.2 0.25 0.3 0.35
Ela
stic s
tiff
ne
ss r
atio
, Ie
/Ig
Axial load ratio, P/f'cAg
Ast/Ag=0.01
Ast/Ag=0.02
Ast/Ag=0.03
Ast/Ag=0.04

85
Figure 5.4 Steel model under cyclic loading (Manegotto and Pinto, 1973)
𝜀𝑠∗ = |
𝜀𝑠
𝜀𝑠0| (5.1)
𝜎𝑠 = (𝑘𝑠𝜀𝑠∗ +
(1−𝑘𝑠)𝜀𝑠∗
(1+𝜀𝑠∗𝑅 )
1𝑅
) 𝜎𝑠0 (5.2)
where εs = steel strain, σs = steel stress, εs* = normalized steel strain, εs0 = steel strain at
intersection of initial modulus line and tangent modulus at ultimate, σs0 = steel stress at intersection
of initial modulus line and tangent modulus at ultimate, ks = Es∞ / Es, ratio of tangent modulus at
ultimate to initial modulus, Ro = parameter defining the shape of the curve.
The parameters εs0, σs0, ks, and Ro are usually adjusted to conform the stress-strain behavior
of steel from tests. Program default values for the calibration parameters are considered in this
study. The 3-D inelastic beam-column element is used in modeling the bridge pier. Circular section
is divided into 400 discrete segments as shown in Figure 5.5c. The software can predict large
deformation behavior of structural elements. The whole bridge pier is modeled in thirteen
segments. Nodes are closely packed in the plastic hinge location of the bridge pier at a spacing of
250mm and about 1000mm in rest of the location. Lumped mass and 10% axial load are applied
at the top of the bridge piers. Soil-structure interaction is not considered in this study, and the base
is modeled fixed. The modeling details are presented in Figure 5.5. The accuracy of the program

86
in modeling and predicting the experimental behavior of RC bridge columns made of varying
material properties are discussed in details in Chapter 3.
(a) (b) (c)
Figure 5.5 Finite element modeling of bridge pier (a) 2-D model, (b) 3-D elevation and (c)
section model
5.6 Performance-Based Design Following CHBDC 2014
The PBD of bridge pier is based on the target performance objectives defined in CHBDC
2014. These performance criteria are presented in terms of strain in concrete and steel. Material
strain more explicitly depicts the performance of structural elements than drift. However, material
strain level can be correlated to associated drift in bridge pier. According to CHBDC 2014, a
lifeline bridge should experience minimal damage for earthquakes with return periods of 475 years
and 975 years. The damage should be repairable in a seismic event with 2475 years of return
period. The minimal damage and repairable damages in the new supplement to CHBDC 2014 are
defined by εc ≤ 0.004 and εs ≤ εy, and εs ≤ 0.015 respectively. Here, εc is the compressive strain in
concrete, εs is the tensile strain in reinforcing steel bars, and εy is yielding strain of steel rebar.
Primary design is based on the FBD. Displacement demand on the bridge pier is calculated from
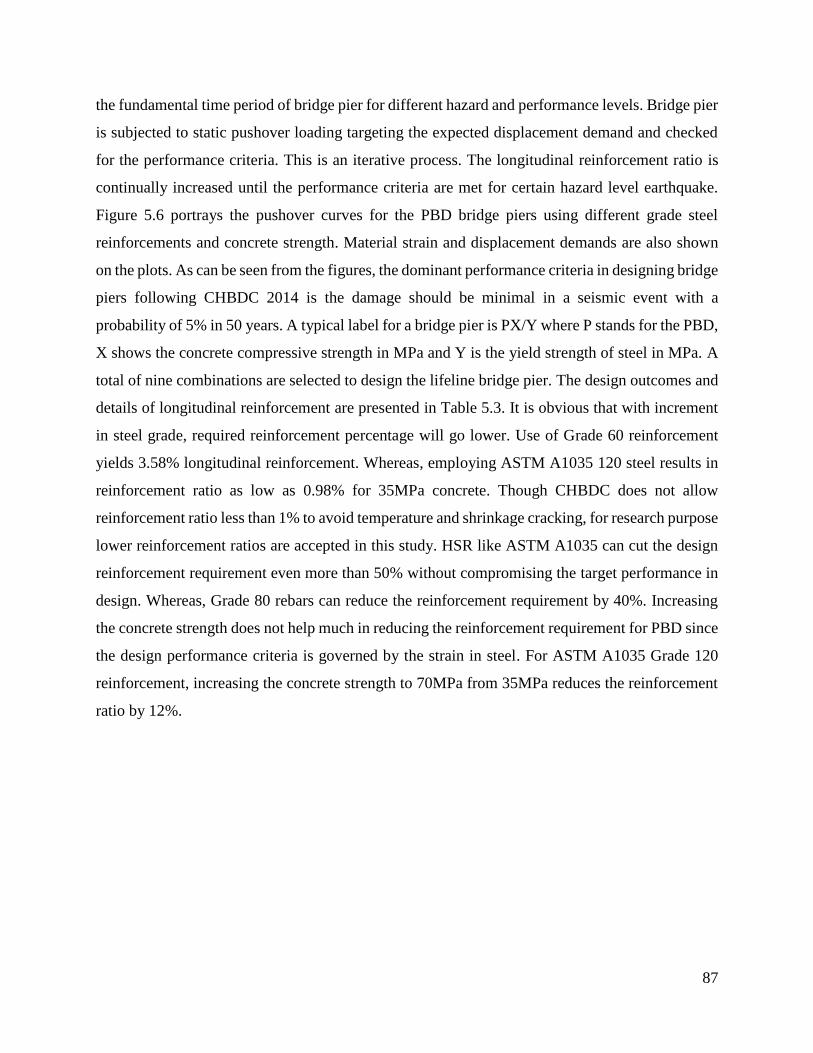
87
the fundamental time period of bridge pier for different hazard and performance levels. Bridge pier
is subjected to static pushover loading targeting the expected displacement demand and checked
for the performance criteria. This is an iterative process. The longitudinal reinforcement ratio is
continually increased until the performance criteria are met for certain hazard level earthquake.
Figure 5.6 portrays the pushover curves for the PBD bridge piers using different grade steel
reinforcements and concrete strength. Material strain and displacement demands are also shown
on the plots. As can be seen from the figures, the dominant performance criteria in designing bridge
piers following CHBDC 2014 is the damage should be minimal in a seismic event with a
probability of 5% in 50 years. A typical label for a bridge pier is PX/Y where P stands for the PBD,
X shows the concrete compressive strength in MPa and Y is the yield strength of steel in MPa. A
total of nine combinations are selected to design the lifeline bridge pier. The design outcomes and
details of longitudinal reinforcement are presented in Table 5.3. It is obvious that with increment
in steel grade, required reinforcement percentage will go lower. Use of Grade 60 reinforcement
yields 3.58% longitudinal reinforcement. Whereas, employing ASTM A1035 120 steel results in
reinforcement ratio as low as 0.98% for 35MPa concrete. Though CHBDC does not allow
reinforcement ratio less than 1% to avoid temperature and shrinkage cracking, for research purpose
lower reinforcement ratios are accepted in this study. HSR like ASTM A1035 can cut the design
reinforcement requirement even more than 50% without compromising the target performance in
design. Whereas, Grade 80 rebars can reduce the reinforcement requirement by 40%. Increasing
the concrete strength does not help much in reducing the reinforcement requirement for PBD since
the design performance criteria is governed by the strain in steel. For ASTM A1035 Grade 120
reinforcement, increasing the concrete strength to 70MPa from 35MPa reduces the reinforcement
ratio by 12%.

88
Figure 5.6 Load-displacement plot for bridge piers designed using different strength steel and
concrete
0
1000
2000
3000
4000
0 100 200 300
Ba
se
sh
ea
r (k
N)
Displacement (mm)
(a) P35/415 0
1000
2000
3000
4000
0 100 200 300
Ba
se
sh
ea
r (k
N)
Displacement (mm)
(b) P35/550
0
500
1000
1500
2000
2500
3000
0 100 200 300
Ba
se
sh
ea
r (k
N)
Displacement (mm)
(c) P35/8300
1000
2000
3000
4000
5000
0 100 200 300
Ba
se
sh
ea
r (k
N)
Displacement (mm)
(d) P50/415
0
1000
2000
3000
4000
0 100 200 300
Ba
se
sh
ea
r (k
N)
Displacement (mm)
(e) P50/5500
500
1000
1500
2000
2500
3000
0 100 200 300
Ba
se
sh
ea
r (k
N)
Displacement (mm)
(f) P50/830
0
1000
2000
3000
4000
5000
0 100 200 300
Ba
se
sh
ea
r (k
N)
Displacement (mm)
(g) P70/415 0
1000
2000
3000
4000
0 100 200 300
Ba
se
sh
ea
r (k
N)
Displacement (mm)
(h) P70/550
0
500
1000
1500
2000
2500
3000
0 100 200 300
Ba
se
sh
ea
r (k
N)
Displacement (mm)
(i) P70/830

89
Table 5.3 Design details of the bridge pier following the supplement to CHBDC 2014
ID f'c
(MPa)
Steel
grade
fy (MPa) Reinforcement
percentage
Longitudinal
rebar detail
P35/415 35 60 415 3.58% 48-50M
P35/550 35 80 550 2.1% 28-50M
P35/830 35 120 830 0.98% 32-32M
P50/415 35 60 415 4.12% 42-57M
P50/550 35 80 550 2.1% 28-50M
P50/830 35 120 830 0.92% 30-32M
P70/415 35 60 415 4.12% 42-57M
P70/550 35 80 550 1.94% 26-50M
P70/830 35 120 830 0.86% 28-32M
5.7 Moment-Curvature Relationship
Reinforcing bar number and diameter in the design of the bridge piers varied to account
for the different yield strength and performance achievement. Performance criteria specified in the
design code are satisfied, and they maintain a similar moment-curvature relationship for the design
alternatives reinforced with similar grade steel reinforcement. Almost identical moment capacity
for the Grade 120 and Grade 80 steel reinforced bridge pier sections can be noticed from Figure
5.7. Though the moment capacity increases slightly with the increase in concrete strength, the
longitudinal reinforcement ratio detects the moment-curvature behavior for a section. The
moment-curvature plot shows almost similar initial stiffness and post-elastic transition. The
moment capacity of the section varies from 26000 kN-m to 44000 kN-m. The maximum moment
capacity is observed at a curvature of 0.002 (1/m) in most of the cases.

90
Figure 5.7 Moment-curvature relationship of designed RC bridge pier sections
5.8 Ground Motions
Twenty ground motions are selected from PEER database (PEER, 2011) as discussed in
Chapter 3 to carry out the incremental dynamic analysis. The fault distances for all the ground
motions are less than 10 km. Key characteristics of these motions are the PGA/PGV ratio that
varies between 0.46 and 1.56 and the PGA value ranges from 0.37g to 1.07g indicating medium to
strong earthquake intensity of ground motions. According to Naumoski et al. (1988), the
PGA/PGV ratio for western Canada is close to 1. However, the 20 ground motions selected have
previously been used as site-specific motions for Vancouver (Parghi and Alam, 2017). Time
histories of the seismic motions are collected from PEER strong motion database (PEER, 2011).
Selected ground motions are matched using the program SeismoMatch (SeismoMatch, 2014) to
Vancouver design spectrum for soil class C and maximum hazard level earthquake (2% probability
of exceedance in 50 years). Ground motion matching is done from time period 0.05s to 4s as
suggested by Baker et al. (2011). The original ground motion spectra are presented in Figure 5.8a
and the mean matched ground motions response spectrum are displayed in Figure 5.8b to match
the Vancouver design spectrum.
0
10000
20000
30000
40000
50000
0 0.005 0.01
Mo
me
nt
(kN
-m)
Curvature (1/m)
P35/415 P35/550P35/830 P50/415P50/550 P50/830P70/415 P70/550P70/830
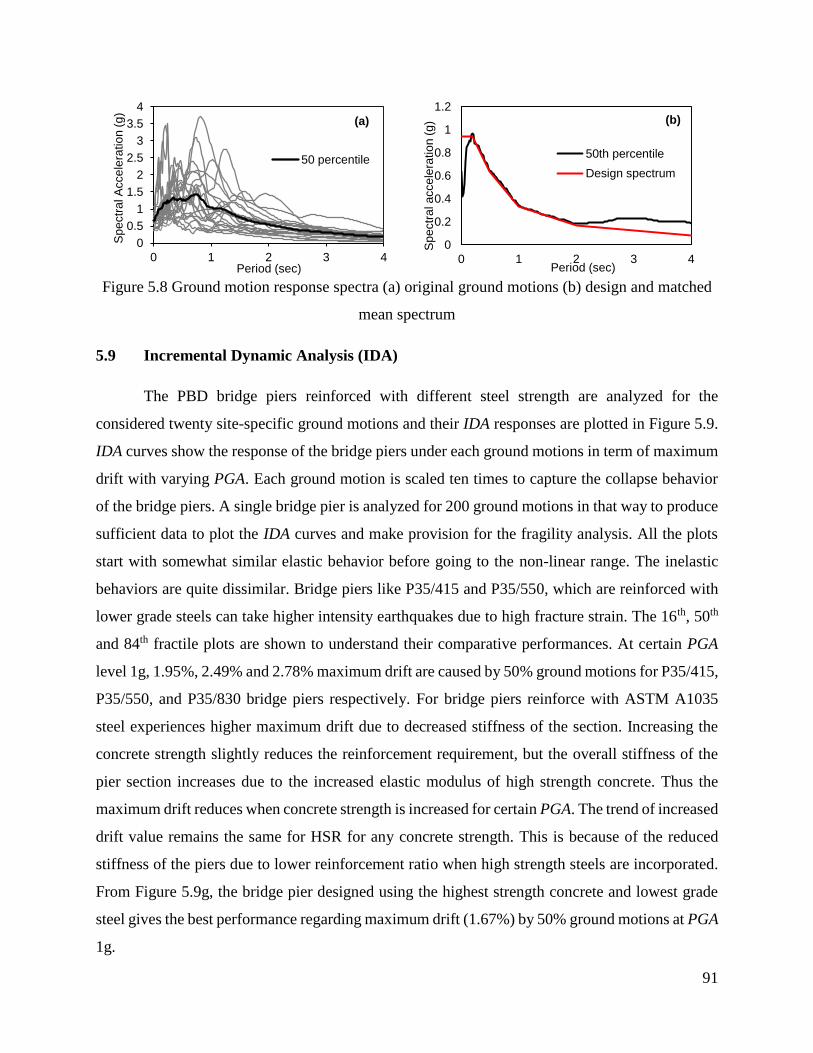
91
Figure 5.8 Ground motion response spectra (a) original ground motions (b) design and matched
mean spectrum
5.9 Incremental Dynamic Analysis (IDA)
The PBD bridge piers reinforced with different steel strength are analyzed for the
considered twenty site-specific ground motions and their IDA responses are plotted in Figure 5.9.
IDA curves show the response of the bridge piers under each ground motions in term of maximum
drift with varying PGA. Each ground motion is scaled ten times to capture the collapse behavior
of the bridge piers. A single bridge pier is analyzed for 200 ground motions in that way to produce
sufficient data to plot the IDA curves and make provision for the fragility analysis. All the plots
start with somewhat similar elastic behavior before going to the non-linear range. The inelastic
behaviors are quite dissimilar. Bridge piers like P35/415 and P35/550, which are reinforced with
lower grade steels can take higher intensity earthquakes due to high fracture strain. The 16th, 50th
and 84th fractile plots are shown to understand their comparative performances. At certain PGA
level 1g, 1.95%, 2.49% and 2.78% maximum drift are caused by 50% ground motions for P35/415,
P35/550, and P35/830 bridge piers respectively. For bridge piers reinforce with ASTM A1035
steel experiences higher maximum drift due to decreased stiffness of the section. Increasing the
concrete strength slightly reduces the reinforcement requirement, but the overall stiffness of the
pier section increases due to the increased elastic modulus of high strength concrete. Thus the
maximum drift reduces when concrete strength is increased for certain PGA. The trend of increased
drift value remains the same for HSR for any concrete strength. This is because of the reduced
stiffness of the piers due to lower reinforcement ratio when high strength steels are incorporated.
From Figure 5.9g, the bridge pier designed using the highest strength concrete and lowest grade
steel gives the best performance regarding maximum drift (1.67%) by 50% ground motions at PGA
1g.
0
0.5
1
1.5
2
2.5
3
3.5
4
0 1 2 3 4
Sp
ectr
al A
cce
lera
tio
n (
g)
Period (sec)
(a)
50 percentile
0
0.2
0.4
0.6
0.8
1
1.2
0 1 2 3 4
Sp
ectr
al a
cce
lera
tio
n (
g)
Period (sec)
(b)
50th percentile
Design spectrum

92
Figure 5.9 IDA curves of the designed bridge piers
0
0.5
1
1.5
2
0 2 4 6
PG
A (
g)
Maximum drift %
(a) P35/415 0
0.5
1
1.5
2
0 2 4 6
PG
A (
g)
Maximum drift %
(b) P35/550
0
0.5
1
1.5
2
0 2 4 6
PG
A (
g)
Maximum drift %
(c) P35/8300
0.5
1
1.5
2
0 2 4 6P
GA
(g
)Maximum drift %
(d) P50/415
0
0.5
1
1.5
2
0 2 4 6
PG
A (
g)
Maximum drift %
(e) P50/5500
0.5
1
1.5
2
0 2 4 6
PG
A (
g)
Maximum drift %
(f) P50/830
0
0.5
1
1.5
2
0 2 4 6
PG
A (
g)
Maximum drift %
(g) P70/4150
0.5
1
1.5
2
0 2 4 6
PG
A (
g)
Maximum drift %
(h) P70/550
0
0.5
1
1.5
2
0 2 4 6
PG
A (
g)
Maximum drift %
(i) P70/830

93
5.10 Damage States
Inelastic static pushover analysis (ISPA) and incremental dynamic analysis are conducted
on the PBD bridge piers reinforced with varying steel grades. Damage states of the bridge piers
are defined from the non-linear static pushover analysis for both FEMA and CHBDC specified
damage states. Minor deviations in yield and crushing performance from ISAP and IDA allow
defining the limit states from ISPA with reasonable accuracy as discussed in Chapter 4. 3-D finite
element models are developed using the finite element program SeismoStruct (2015). 10% axial
load is considered on top of each bridge pier. Details of the modeling technique, underlying
assumptions, and material models are discussed in the previous sections. Uncertainties in material
properties are not considered in this study. Damage states are decided on maximum drift only.
Yielding of longitudinal steel is a critical performance benchmark for RC bridge piers.
Bridge pier encounters higher residual deformation after yielding of steel rebars during dynamic
loading. CHBDC 2014 (CSA, 2014) defines the minimal damage of structure in term of steel
yielding. The moderate damage state outlined by FEMA (FEMA, 2003) is also characterized by
yielding of longitudinal steel. Spalling and crushing of concrete eventually start after the yielding
of main rebars. The yield strain of ASTM A615 Grade 60, Grade 80, ASTM A1035 Grade 120
steel reinforcements used in this study are respectively 0.002075, 0.00275, and 0.00415 mm/mm.
All the reinforcing steel are assumed to have an elastic modulus of 200GPa.
The collapse of bridge pier is often defined by the crushing of confined concrete (FEMA,
2003; CHBDC 2016). This performance criterion marks the unsuitability of use of the bridge and
requirement of probable replacement. The yield strength of transverse reinforcement considerably
affects the crushing strain of concrete. The yield strength of transverse steel is assumed to be 400
MPa in this study. Crushing strain of confined concrete is determined using the equation, εcu=
0.004+1.4ρsfyhεsm/f’c suggested by Paulay and Priestley (1992). Here, εsm = steel strain at maximum
tensile stress (0.14); f’c= concrete compressive strength (MPa); fyh = yield strength of transverse
steel (400 MPa); and ρs = volumetric ratio of spiral (0.6%). The crushing strain for the designed
bridge piers is found to be 0.018, 0.014 and 0.011 for 35MPa, 50MPa, and 70 MPa concrete
respectively. The usual range of crushing strain of concrete varies between 0.015 and 0.05 (Paulay
and Priestley, 1992). However, concrete strength and transverse reinforcement configuration
largely affect the crushing strain. For a fixed lateral reinforcement configuration, increased

94
concrete strength increases the brittleness (Setunge, 1993). Longitudinal steel strength does not
necessarily affect the crushing of concrete as can be seen from the equation provided above.
5.10.1 FEMA damage states
FEMA specified onset of cracking in concrete cover and minor spalling as slight damage
in bridge pier. Yielding defines the moderate damage state, which can also be described by
physical phenomenon of moderate cracking and minor spalling in concrete. Extensive damage
with degradation can be captured by spalling of concrete, and crushing of confined core concrete
may lead to the probable collapse of the bridge pier. Priestley et al. (1996) suggested that the
cracking and spalling in cover concrete occur at 0.0014 and 0.004 strain. These suggested values
are used in defining slight and extensive damage states. Moderate damage is taken at a
displacement when the longitudinal steel rebar yields, and collapse in bridge pier is considered at
crushing strain of concrete as described earlier. Different damage criteria over the ISPA curves of
the bridge piers are presented in Figure 5.10. Bridge reinforced with lower strength steel can
undergo higher displacement due to higher total elongation capacity of steel. However, damage
happens at lower drift ratio as the longitudinal steel grade is decreased. Cracking in bridge pier
occurs almost at similar drift ratio. Moderate, extensive and collapse damage vary notably with
the change in design reinforcement grades. The higher the reinforcing steel grade, the higher is the
drift ratio for a particular damage state. P35/415 pier collapses at a drift ratio of 1.98% whereas
P35/830 pier can take about 14% more drift before failure. Increasing the concrete strength helps
in increasing the slight, extensive and collapse damage state, which are coupled with concrete
strain limits. However, the moderate damage starts early for higher concrete strength. Moderate
damage starts at 0.77% drift in pier P35/550. The same damage level is observed at 0.71%, and
0.68% drift ratio in P50/550, and P70/550 bridge piers respectively. All the damage states
encounter improvement with the incorporation of high strength concrete and high yield strength
reinforcing steel in PBD. Details of FEMA damage states are presented in Table 5.4 for individual
bridge piers.

95
Figure 5.10 FEMA limit states from pushover analysis
0
1000
2000
3000
4000
0 100 200 300
Ba
se
sh
ea
r (k
N)
Displacement (mm)
(a) P35/415
0
1000
2000
3000
4000
0 100 200 300
Ba
se
sh
ea
r (k
N)
Displacement (mm)
(b) P35/550
0
500
1000
1500
2000
2500
3000
0 100 200 300
Ba
se
sh
ea
r (k
N)
Displacement (mm)
(c) P35/830
0
1000
2000
3000
4000
5000
0 100 200 300
Ba
se
sh
ea
r (k
N)
Displacement (mm)
(d) P50/415
0
1000
2000
3000
4000
0 100 200 300
Ba
se
sh
ea
r (k
N)
Displacement (mm)
(e) P50/5500
500
1000
1500
2000
2500
3000
0 100 200 300
Ba
se
sh
ea
r (k
N)
Displacement (mm)
(f) P50/830
0
1000
2000
3000
4000
5000
0 100 200 300
Ba
se
sh
ea
r (k
N)
Displacement (mm)
(g) P70/415
0
1000
2000
3000
4000
0 100 200 300
Ba
se
sh
ea
r (k
N)
Displacement (mm)
(h) P70/550
0
500
1000
1500
2000
2500
3000
0 100 200 300
Ba
se
sh
ea
r (k
N)
Displacement (mm)
(i) P70/830

96
Table 5.4 Damage states of bridge piers in term of drift following FEMA
Damage State → Slight Moderate Extensive Collapse
P35/415 0.14% 0.63% 1.04% 1.98%
P35/550 0.13% 0.77% 1.16% 2.05%
P35/830 0.12% 0.96% 1.28% 2.26%
P50/415 0.15% 0.61% 1.08% 1.87%
P50/550 0.14% 0.71% 1.21% 1.97%
P50/830 0.13% 0.90% 1.33% 2.18%
P70/415 0.15% 0.58% 1.15% 1.81%
P70/550 0.15% 0.68% 1.28% 1.93%
P70/830 0.14% 0.83% 1.40% 2.10%
5.10.2 CHBDC damage states
CHBDC explains the damage states of bridges in a slightly different way. The DSs
prescribed in CHBDC 2014 (CSA, 2014) are minimal, repairable, extensive and probable
replacement. Minimal damage is associated with concrete and steel strain of 0.004 and yielding
respectively. It is noticeable that minimal damage in CHBDC 2014 defines the moderate damage
in bridge pier by FEMA when yielding in steel governs. The concrete strain of 0.004 equals the
Priestley et al. (1996) recommended value for concrete spalling, which detects the extensive
damage to the pier. According to CHBDC 2014, the minimal damage starts at a drift equal to
FEMA specified extensive damage limit when strain in concrete governs. In case of all the
designed bridge pier, reinforcing steel yielding strain criteria governed the minimal damage state.
The repairable damage is detected by steel strain of 0.015. Extensive damage is governed by the
criteria that the confined core concrete strain cannot surpass the concrete crushing strain.
Apparently, steel strength seems to have little effect in dictating the collapse damage state of the
bridge piers. Figure 5.11 displays the CHBDC damage states over the ISPA curve of the designed
piers and corresponding drift ratio are summarized in Table 5.5.
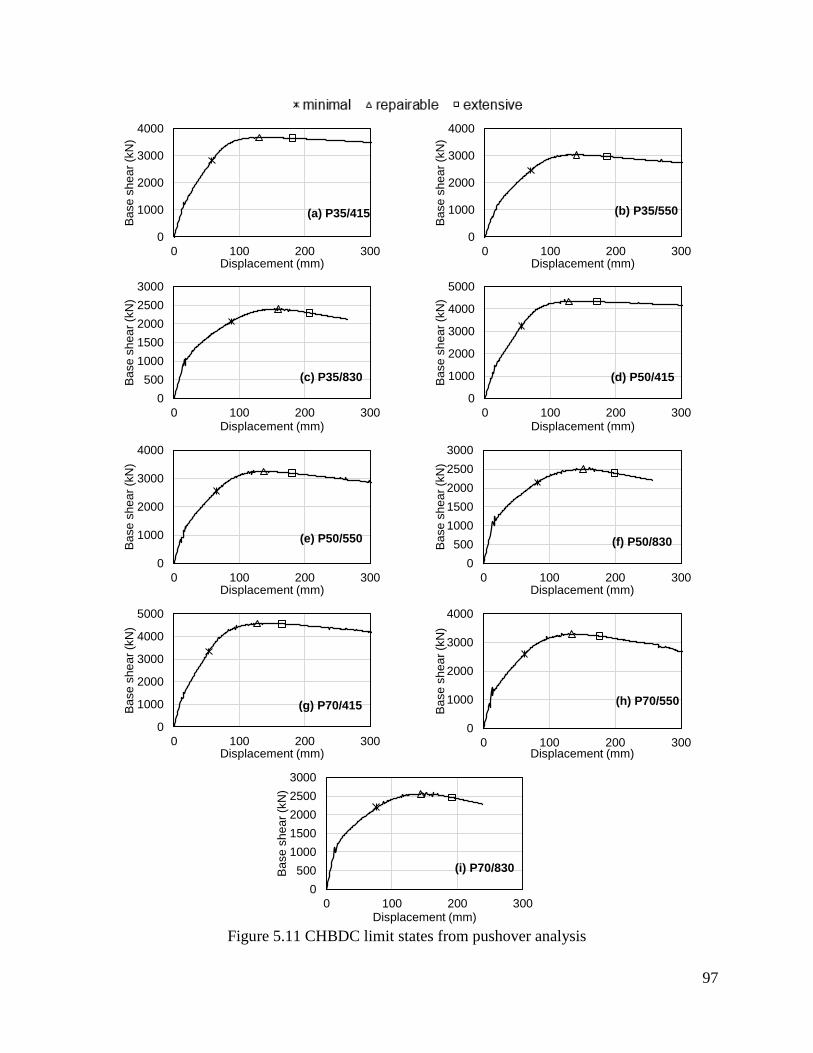
97
Figure 5.11 CHBDC limit states from pushover analysis
0
1000
2000
3000
4000
0 100 200 300
Ba
se
sh
ea
r (k
N)
Displacement (mm)
(a) P35/415
0
1000
2000
3000
4000
0 100 200 300
Ba
se
sh
ea
r (k
N)
Displacement (mm)
(b) P35/550
0
500
1000
1500
2000
2500
3000
0 100 200 300
Ba
se
sh
ea
r (k
N)
Displacement (mm)
(c) P35/830
0
1000
2000
3000
4000
5000
0 100 200 300
Ba
se
sh
ea
r (k
N)
Displacement (mm)
(d) P50/415
0
1000
2000
3000
4000
0 100 200 300
Ba
se
sh
ea
r (k
N)
Displacement (mm)
(e) P50/550
0
500
1000
1500
2000
2500
3000
0 100 200 300
Ba
se
sh
ea
r (k
N)
Displacement (mm)
(f) P50/830
0
1000
2000
3000
4000
5000
0 100 200 300
Ba
se
sh
ea
r (k
N)
Displacement (mm)
(g) P70/415
0
1000
2000
3000
4000
0 100 200 300
Ba
se
sh
ea
r (k
N)
Displacement (mm)
(h) P70/550
0
500
1000
1500
2000
2500
3000
0 100 200 300
Ba
se
sh
ea
r (k
N)
Displacement (mm)
(i) P70/830

98
Table 5.5 Damage states of bridge piers in term of drift (%) following CHBDC 2014
Damage State → Minimal Repairable Extensive
P35/415 0.63% 1.42% 1.98%
P35/550 0.77% 1.53% 2.05%
P35/830 0.96% 1.74% 2.26%
P50/415 0.61% 1.40% 1.87%
P50/550 0.71% 1.50% 1.97%
P50/830 0.90% 1.65% 2.18%
P70/415 0.58% 1.39% 1.81%
P70/550 0.68% 1.47% 1.93%
P70/830 0.83% 1.58% 2.10%
5.11 PSDMs
To determine the seismic demand on bridge pier from incremental dynamic analyses, a
total of 200 bridge piers models are simulated for each bridge pier. Peak responses of the bridge
piers in term of maximum drift are considered for corresponding ground motion intensity to
generate the probabilistic seismic demand models (PSDMs). The logarithm of drift ratios is plotted
in vertical axis and logarithm of PGA in the horizontal axis to find the parameter a and b from the
regression analysis. PSDM plots are demonstrated in Figure 5.12. Dispersion demand, βEDPǀIM is
also found using the regression values. The parameters a, b and βEDPǀIM are explained in Chapter
4. The values obtained for the designed bridge piers are exhibited in Table 5.6. Variations in the
r-squared values are very small, but the values are close to 1. It indicates a reasonably good
correlation between the engineering demand parameter and the intensity measure. Employing
higher grade steel in the design of bridge pier slightly increases intercept (ln(a)) and slope (b) of
the PSDM that shows higher susceptibility to ground motions. The reverse scenario is found when
high strength concrete is used in design.

99
Figure 5.12 Probabilistic seismic demand models
y = 1.0945x + 0.6933R² = 0.8463
-2
-1
0
1
2
3
-3 -2 -1 0 1 2
ln (
Dri
ft %
)
ln (PGA)
(a) P35/415
y = 1.1313x + 0.8334R² = 0.8485
-2
-1
0
1
2
3
-3 -2 -1 0 1 2
ln (
Dri
ft %
)
ln (PGA)
(b) P35/550
y = 1.2036x + 1.0037R² = 0.8391
-2
-1
0
1
2
3
-3 -2 -1 0 1 2
ln (
Dri
ft %
)
ln (PGA)
(c) P35/830
y = 1.0596x + 0.5659R² = 0.8402
-2
-1
0
1
2
3
-3 -2 -1 0 1 2
ln (
Dri
ft %
)
ln (PGA)
(d) P50/415
y = 1.1093x + 0.7701R² = 0.8443
-2
-1
0
1
2
3
-3 -2 -1 0 1 2
ln (
Drift
%)
ln (PGA)
(e) P50/550
y = 1.1494x + 0.9342R² = 0.8138
-2
-1
0
1
2
3
-3 -2 -1 0 1 2
ln (
Dri
ft %
)
ln (PGA)
(f) P50/830
y = 1.0663x + 0.5065R² = 0.8404
-3
-2
-1
0
1
2
3
-3 -2 -1 0 1 2
ln (
Dri
ft %
)
ln (PGA)
(g) P70/415
y = 1.1019x + 0.7162R² = 0.8476
-2
-1
0
1
2
3
-3 -2 -1 0 1 2
ln (
Dri
ft %
)
ln (PGA)
(h) P70/550
y = 1.1673x + 0.8796R² = 0.8429
-2
-1
0
1
2
3
-3 -2 -1 0 1 2
ln (
Dri
ft %
)
ln (PGA)
(i) P70/830
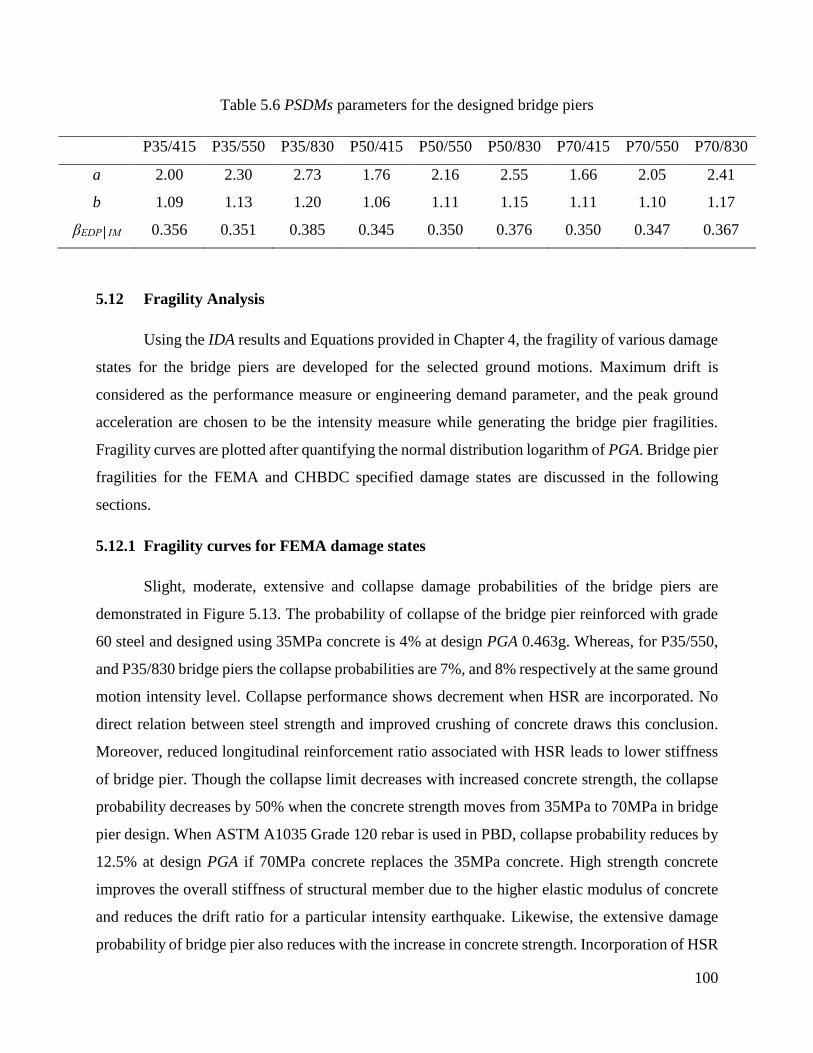
100
Table 5.6 PSDMs parameters for the designed bridge piers
P35/415 P35/550 P35/830 P50/415 P50/550 P50/830 P70/415 P70/550 P70/830
a 2.00 2.30 2.73 1.76 2.16 2.55 1.66 2.05 2.41
b 1.09 1.13 1.20 1.06 1.11 1.15 1.11 1.10 1.17
βEDP│IM 0.356 0.351 0.385 0.345 0.350 0.376 0.350 0.347 0.367
5.12 Fragility Analysis
Using the IDA results and Equations provided in Chapter 4, the fragility of various damage
states for the bridge piers are developed for the selected ground motions. Maximum drift is
considered as the performance measure or engineering demand parameter, and the peak ground
acceleration are chosen to be the intensity measure while generating the bridge pier fragilities.
Fragility curves are plotted after quantifying the normal distribution logarithm of PGA. Bridge pier
fragilities for the FEMA and CHBDC specified damage states are discussed in the following
sections.
5.12.1 Fragility curves for FEMA damage states
Slight, moderate, extensive and collapse damage probabilities of the bridge piers are
demonstrated in Figure 5.13. The probability of collapse of the bridge pier reinforced with grade
60 steel and designed using 35MPa concrete is 4% at design PGA 0.463g. Whereas, for P35/550,
and P35/830 bridge piers the collapse probabilities are 7%, and 8% respectively at the same ground
motion intensity level. Collapse performance shows decrement when HSR are incorporated. No
direct relation between steel strength and improved crushing of concrete draws this conclusion.
Moreover, reduced longitudinal reinforcement ratio associated with HSR leads to lower stiffness
of bridge pier. Though the collapse limit decreases with increased concrete strength, the collapse
probability decreases by 50% when the concrete strength moves from 35MPa to 70MPa in bridge
pier design. When ASTM A1035 Grade 120 rebar is used in PBD, collapse probability reduces by
12.5% at design PGA if 70MPa concrete replaces the 35MPa concrete. High strength concrete
improves the overall stiffness of structural member due to the higher elastic modulus of concrete
and reduces the drift ratio for a particular intensity earthquake. Likewise, the extensive damage
probability of bridge pier also reduces with the increase in concrete strength. Incorporation of HSR

101
improves the moderate damage performance of the bridge piers. For 35MPa concrete, moderate
damage probability reduces by 6% at design PGA when Grade 120 rebar is used in place of
traditional Grade 60 reinforcements. For high strength concrete (70MPa), the reduction becomes
3%. Increase yielding strain of steel can be attributed to such behavior. Table 5.7 summarizes the
PGA at which the selected ground motions cause 50% damage probability in the bridge piers. The
PGA demand increases 15% for 50% collapse probability and about 57% for the 50% extensive
damage probability from P35/415 pier to P70/415 pier. When HSR are used, the demand increases
by 6.5% for 50% collapse probability from P35/830 pier to P70/830 pier. The inclusion of HSR in
designing the bridge pier is greatly effective in increasing the demand for moderate damage to
bridge pier (52% increment from P35/415 to P35/830 pier) since this criterion is in direct
connection to the yielding of steel.

102
Figure 5.13 Fragility plots for FEMA limit states
0
0.2
0.4
0.6
0.8
1
0 0.5 1 1.5
Pro
ba
bili
ty o
f D
am
ag
e
PGA (g)
(a) P35/4150
0.2
0.4
0.6
0.8
1
0 0.5 1 1.5
Pro
ba
bili
ty o
f D
am
ag
e
PGA (g)
(b) P35/550
0
0.2
0.4
0.6
0.8
1
0 0.5 1 1.5
Pro
ba
bili
ty o
f D
am
ag
e
PGA (g)
(c) P35/8300
0.2
0.4
0.6
0.8
1
0 0.5 1 1.5
Pro
ba
bili
ty o
f D
am
ag
ePGA (g)
(d) P50/415
0
0.2
0.4
0.6
0.8
1
0 0.5 1 1.5
Pro
ba
bili
ty o
f D
am
ag
e
PGA (g)
(e) P50/5500
0.2
0.4
0.6
0.8
1
0 0.5 1 1.5
Pro
ba
bili
ty o
f D
am
ag
e
PGA (g)
(f) P50/830
0
0.2
0.4
0.6
0.8
1
0 0.5 1 1.5
Pro
ba
bili
ty o
f D
am
ag
e
PGA (g)
(g) P70/4150
0.2
0.4
0.6
0.8
1
0 0.5 1 1.5
Pro
ba
bili
ty o
f D
am
ag
e
PGA (g)
(h) P70/550
0
0.2
0.4
0.6
0.8
1
0 0.5 1 1.5
Pro
ba
bili
ty o
f D
am
ag
e
PGA (g)
(i) P70/830

103
Table 5.7 PGA at which the damage probability is 50% (FEMA LSs)
LS → Slight Moderate Extensive Collapse
P35/415 0.06g 0.19g 0.37g 0.98g
P35/550 0.06g 0.25g 0.37g 0.84g
P35/830 0.06g 0.29g 0.36g 0.78g
P50/415 0.06g 0.18g 0.46g 1.10g
P50/550 0.06g 0.23g 0.42g 0.87g
P50/830 0.06g 0.26g 0.39g 0.80g
P70/415 0.06g 0.18g 0.58g 1.13g
P70/550 0.06g 0.23g 0.50g 0.91g
P70/830 0.06g 0.26g 0.47g 0.83g
5.12.2 Fragility curves for CHBDC damage states
Minimal damage probability of the designed bridge piers happens when the steel strain
reaches yield strain, or the concrete strain reaches 0.004 (CSA, 2014). This criterion is highly
conservative compared to the slight damage criteria specified in FEMA. The damage fragilities for
CHBDC DSs starts later compared to the fragilities of DSs from FEMA. Minimal damage criterion
is governed by the yielding of steel in all the designed bridge piers. Demand for 50% probabilities
of minimal damage is increased by 44% from P50/415 to P50/830 bridge pier. Increase in concrete
strength has ignorable effect on moderate damage performance of bridge piers. Concrete strain
limit governed the extensive damage in all the bridge piers, which is similar to the collapse damage
fragility found following FEMA. Crushing of core concrete regulated this damage in the piers.
Both the minimal and repairable damage probability reduces at design PGA when HSR are
employed in PBD. Repairable damage probability reduces to 21% at design PGA 0.463g in
P35/830 compared to 26% in P35/415 bridge pier. Increasing concrete strength increases the
repairable damage probability insignificantly. However, repairable damage probability reduces by
11% when high strength concrete is used along with HSR. Table 5.8 demonstrates the PGA at
which the CHBDC specified damage probabilities become 50%. ASTM A1035 Grade 120 steel
reinforced bridge piers require 3.5%, 3.5%, and 3.6% higher PGA earthquakes for 50% repairable
damage probabilities compared to the ASTM A615 Grade 60 steel reinforced bridge pier for
35MPa, 50MPa, and 70MPa concrete respectively. Bridge piers fragilities from CHBDC damage
criteria are presented in Figure 5.14.

104
Figure 5.14 Fragility plots for CHBDC damage states
0
0.2
0.4
0.6
0.8
1
0 0.5 1 1.5
Pro
ba
bili
ty o
f D
am
ag
e
PGA (g)
(a) P35/4150
0.2
0.4
0.6
0.8
1
0 0.5 1 1.5
Pro
ba
bili
ty o
f D
am
ag
e
PGA (g)
(b) P35/550
0
0.2
0.4
0.6
0.8
1
0 0.5 1 1.5
Pro
ba
bili
ty o
f D
am
ag
e
PGA (g)
(c) P35/8300
0.2
0.4
0.6
0.8
1
0 0.5 1 1.5
Pro
ba
bili
ty o
f D
am
ag
e
PGA (g)
(d) P50/415
0
0.2
0.4
0.6
0.8
1
0 0.5 1 1.5
Pro
ba
bili
ty o
f D
am
ag
e
PGA (g)
(e) P50/5500
0.2
0.4
0.6
0.8
1
0 0.5 1 1.5
Pro
ba
bili
ty o
f D
am
ag
e
PGA (g)
0
0.2
0.4
0.6
0.8
1
0 0.5 1 1.5
Pro
ba
bili
ty o
f D
am
ag
e
PGA (g)
(g) P70/4150
0.2
0.4
0.6
0.8
1
0 0.5 1 1.5
Pro
ba
bili
ty o
f D
am
ag
e
PGA (g)
(h) P70/550
0
0.2
0.4
0.6
0.8
1
0 0.5 1 1.5
Pro
ba
bili
ty o
f D
am
ag
e
PGA (g)
(i) P70/830

105
Table 5.8 PGA at which the damage probability is 50% (CHBDC LSs)
LS → Minimal Repairable Extensive
P35/415 0.19g 0.57g 0.98g
P35/550 0.25g 0.58g 0.84g
P35/830 0.29g 0.59g 0.78g
P50/415 0.18g 0.57g 1.10g
P50/550 0.23g 0.57g 0.87g
P50/830 0.26g 0.59g 0.80g
P70/415 0.18g 0.56g 1.14g
P70/550 0.23g 0.57g 0.91g
P70/830 0.26g 0.58g 0.83g
5.13 Effect of Transverse Reinforcement Strength
Using high strength longitudinal rebar in designing bridge pier reduces the damage
probabilities associated with steel strain such as moderate damage from FEMA and minimal and
repairable damage from CHBDC guidelines. However, the collapse vulnerability of the bridge pier
increases due to reduced demand in longitudinal reinforcement resulting from HSR application.
Increasing the concrete strength can slightly mitigate the problem when the transverse
reinforcement arrangements are kept similar. In this section, the lifeline bridge pier is designed
following PBD from CHBDC 2014 for fixed concrete and longitudinal rebar strength with varying
transverse reinforcement strength and analyzed for seismic actions. Three combinations of
transverse reinforcements are considered and labeled as P70/830/TX as shown in Table 5.9. Here,
P stands for the PBD, 70 stands for the 70MPa concrete strength, 830 represents the 830MPa
longitudinal steel strength, T stands for transverse reinforcement, and X shows the yield strength
of the transverse rebars. 415MPa, 550MPa and 830MPa steel are considered for transverse
reinforcement to design the bridge pier. The associated material properties are shown in Table 5.1.
Pitch of the spiral reinforcements is maintained 76mm in plastic hinge region and 100mm in the
rest of the pier. One to one replacement is considered with higher grade steel without changing the
spiral spacing for transverse reinforcement in designing the bridge pier. Inelastic static pushover
analyses are carried out to check the performance criteria specified in CHBDC 2014 for a single

106
lifeline bridge pier. The design details are shown in Table 5.9, and the pushover curves are
presented in Appendix B for brevity. Increasing the spiral strength to 550 MPa reduces the
longitudinal rebar ratio by 7% compared to traditional Grade 60 spirals. However, employment of
highest Grade steel (Grade 120) does not help in further reducing the longitudinal reinforcement
ratio targeting the performance criteria.
Table 5.9 Design details of the bridge pier
ID f'c
(MPa)
fy
(MPa)
fyh
(MPa)
Reinforcement
percentage
Longitudinal
rebar detail
P70/830/T415 70 830 415 0.86% 28-32M
P70/830/T550 70 830 550 0.80% 26-32M
P70/830/T830 70 830 830 0.80% 26-32M
Incremental dynamic analysis is conducted for 20 near-fault ground motions, and the IDA
plots are shown in Appendix B (Figure B.3). Increasing the transverse reinforcement strength
reduces the longitudinal rebar ratio, but increases the overall stiffness of the structure. To plot the
fragility curves, limit states are defined following both FEMA and CHBDC guidelines. Limit states
are plotted over ISPA curves and presented in Appendix B in figures (Figure B.4 and Figure B.5)
and tabulated form (Table B.1 and Table B.2). Increasing spiral strength increases the limit state
notably for collapse damage (9% increment when Grade 120 spiral is used instead of Grade 60).
The crushing strain of concrete is calculated using the equation, εcu= 0.004+1.4ρsfyhεsm/f’c
suggested by Paulay and Priestley (1992). The crushing strain is found 0.012 and 0.01 for
P70/830/T550 and P70/830/T830 bridge piers correspondingly. Though the crushing strain
reduces with the increment in transverse reinforcement strength, it can take higher drift to reach
the crushing of concrete.

107
Figure 5.15 Fragility plots for FEMA damage states
Fragility curves plotted for the FEMA damage states are shown in Figure 5.15. The
collapse probability curves tend to move to the right when high strength spirals are used in
designing bridge pier. Other damage probability plots are essentially at similar locations. Table
5.10 demonstrates the PGA demand for 50% of particular limit states. Demand in PGA for 50%
collapse probability increases 7.23% and 9.64% for Grade 80 and Grade 120 spirals compared to
Grade 60 transverse reinforcements. Slight and extensive damage probability demands almost
similar PGA with varying spiral strengths. However, extensive damage probability increases with
the increase of spiral strength. Demand in PGA reduces by 4.26% when highest grade spirals are
used in design compared to Grade 60 spirals.
Table 5.10 PGA at which the damage probability is 50% (FEMA LSs)
LS → Slight Moderate Extensive Collapse
P70/830/T415 0.06g 0.27g 0.47g 0.83g
P70/830/T550 0.06g 0.24g 0.46g 0.89g
P70/830/T830 0.06g 0.24g 0.45g 0.91g
0
0.2
0.4
0.6
0.8
1
0 0.5 1 1.5
Pro
ba
bili
ty o
f D
am
ag
e
PGA (g)
(a) P70/830/T4150
0.2
0.4
0.6
0.8
1
0 0.5 1 1.5
Pro
ba
bili
ty o
f D
am
ag
e
PGA (g)
(b) P70/830/T550
0
0.2
0.4
0.6
0.8
1
0 0.5 1 1.5
Pro
ba
bili
ty o
f D
am
ag
e
PGA (g)
(c) P70/830/T830

108
Figure 5.16 displays the fragility curves plotted for CHBDC 2014 damage states. The
extensive damage state is essentially similar to the collapse damage state from FEMA. The
minimal damage state is governed by the concrete strain limit. The repairable damage limit is
specified in terms of steel strain value of 0.015 in CHBDC 2014. The minimal and extensive
damage vulnerability reduces with increased spiral strength in design. However, the reparable
damage exhibits opposite behavior. Demand in PGA reduces to 0.56g when Grade 80 and Grade
120 transverse reinforcements are used from 0.57g for Grade 60 spirals (Table 5.11). For 50%
minimal damage probability, demand in PGA increases by 14.3% when HSR are considered as
transverse reinforcement.
Figure 5.16 Fragility plots for CHBDC damage states
Table 5.11 PGA at which the damage probability is 50% (CHBDC LSs)
LS → Minimal Repairable Extensive
P70/830/T415 0.21g 0.57g 0.83g
P70/830/T550 0.24g 0.56g 0.89g
P70/830/T830 0.24g 0.56g 0.91g
0
0.2
0.4
0.6
0.8
1
0 0.5 1 1.5
Pro
ba
bili
ty o
f D
am
ag
e
PGA (g)
(a) P70/830/T4150
0.2
0.4
0.6
0.8
1
0 0.5 1 1.5
Pro
ba
bili
ty o
f D
am
ag
e
PGA (g)
(b) P70/830/T550
0
0.2
0.4
0.6
0.8
1
0 0.5 1 1.5
Pro
ba
bili
ty o
f D
am
ag
e
PGA (g)
(c) P70/830/T830
109
5.14 Summary
HSR are being acquainted in different RC building and bridge guidelines. CHBDC allows
the use of steel reinforcement with yield strength as high as 500MPa. However, availability and
production of high strength steel like ASTM A1035 Grade 100 and Grade 120 have the potential
to be incorporated in CHBDC to design bridge columns. Moreover, the PBD composed of
performance criteria on the tensile strain in steel and concrete where HSR and high strength
concrete can perform an active role to improve the performance of bridge pier. This section of the
study explicitly investigated the behavior of PBD bridge piers considering different strength steel
in combination with different concrete strength under site-specific ground motions. Finally, effects
of the strength of transverse reinforcement on design and seismic performance are also investigated
for high strength materials. Key results from this chapter are compiled herein.
Designing bridge piers following the PBD method and using HSR like ASTM A1035
Grade 120 can reduce the design reinforcement ratio about 50% than that of conventional
Grade 60 reinforcement. ASTM A615 Grade 80 rebars also have the potential of reducing
the reinforcement demand by 40% without compromising the performance criteria
specified in CHBDC 2014. The cost of construction, reinforcement congestion, and cost in
logistic supports can be substantially reduced when high strength steel is used in the design
of bridge piers.
Incremental dynamic analyses of the bridge piers show slightly higher susceptibility of
HSR bridge piers in term of drift due to lower column stiffness. However, incorporation of
high strength concrete further reduces the longitudinal rebar requirement, but IDA plot
shows improved performance in terms of drift ratio due to increased stiffness of the bridge
piers derived from the higher elastic modulus of high strength concrete.
Damage states for the bridge piers are defined from inelastic static pushover analysis curve
with reasonable accuracy. Collapse drift limit increases about 15% when HSR are used.
Whereas, the moderate damage state from FEMA guideline experiences maximum uplift
with 23% increment. Repairable damage limit from CHBDC specification is also increased
by maximum 22% when HSR are employed.
Moderate and repairable damage vulnerabilities decrease with the increment of steel
strength in design. Collapse damage vulnerability related to concrete strain increases for

110
the bridge piers designed with HSR. Incorporation of high strength concrete and high
strength spirals can mitigate the problem associated with HSR.
111
Chapter 6 : CONCLUSIONS
6.1 Summary
PBD of bridges is gaining attention in recent times from the structural engineers due to its
unique ability to design targeting some definite performance criteria. CHBDC accepted the PBD
in designing bridges in 2014. For major route bridge, PBD is optional and rely on the responsible
authority. For critical bridges in the transportation network and disaster management like lifeline
bridges, PBD is mandatory. In 2016, the performance-criteria went through noteworthy
modifications. Performance limits stated in CHBDC 2014 is highly conservative and leads to
excessive amount of design reinforcements as studied by researchers and the author. Relaxed
performance criteria specified in the supplement to CHBDC 2014 are yet to be studied on bridge
design and performance assessment of the designed bridges. Also, the effect of the strength of
reinforcing steel in PBD and behavior of bridge pier under seismic loading is not available in the
literature. How the strength of concrete when combined with various steel grade affect the PBD,
and seismic performance of bridge pier are yet to be studied.
This thesis demonstrates the design outcomes of a lifeline RC bridge pier designed
following FBD method from CHBDC 2010 and PBD methods from CHBDC 2014 and the
supplement to CHBDC 2014. The governing design criteria in PBD for a lifeline bridge are
identified. Inconsistencies in design results are discussed with reasoning. 20 near-fault ground
motions are selected to study the seismic performance of the designed bridge piers through
incremental dynamic analysis and proper analytical modeling. Reactions of the bridge piers to the
dynamic loading and static pushover loading are compared on yield and crushing displacements
of the piers. Performance limit states are defined from the static pushover analysis curves to
generate the fragility plots of bridge piers to have an improved understanding of the seismic
vulnerability of bridge piers when different design alternatives are employed.
PBD results in higher longitudinal reinforcement ratio in bridge piers to satisfy the
performance criteria. However, employing high strength steel in design has the potential to reduce
the required reinforcement without compromising the performance. No such study has been
performed by far on the consequence of adopting HSR in PBD of bridge piers. This study is also

112
focused on the design of a lifeline bridge pier according to CHBDC 2014 using HSR in
combination with different concrete strengths to predict the effect of HSR thoroughly.
Performances of the bridge piers are investigated for static loading and site-specific earthquakes.
Seismic vulnerability of the designed bridge piers under 20 near-fault ground motions are
evaluated to find out optimal design solution.
6.2 Limitations of the Study
This research possesses the following limitations for simplification purposes:
This study is based on extensive numerical analyses. However, experimental investigation
of similar work can add more reliability on the outcomes.
Regular single pier bridge bent is considered here for analysis. Selection of bridge bent
with various configurations like multicolumn bridge bent, irregular bridge bent, and
consideration of substructure and other bridge types in design and analysis could result in
different findings.
Uncertainties in material properties and bridge pier geometry are not considered in this
study.
Maximum drift and peak ground acceleration are chosen to be the engineering demand
parameter (EDP) and intensity measure (IM) respectively. Whereas other parameters like
spectral acceleration and residual drift could be selected as potential IM and EDP.
6.3 Conclusions
This research analytically studies to compare the seismic performance and fragility of three
steel-reinforced concrete lifeline bridge piers designed following FBD from CHBDC 2010 and
PBD from CHBDC 2014 and the supplement to CHBDC 2014 using pushover analysis. Six
hundred bridge pier models are prepared to assess the responses of the bridge piers using
incremental dynamic analysis method under a suit of 20 near-fault ground motions matched to
Vancouver design spectrum. Later on, HSR are included in designing a bridge pier following the
PBD from CHBDC 2014. HSR are also combined with varying concrete strength to analyze the
complete effect of HSR on design and performance of lifeline bridge pier under seismic motions.
A total of 1800 simulations are done for nine combinations of design for the IDA. Fragility analyses

113
are conducted to compare the seismic vulnerability of the bridge piers. The following conclusions
can be drawn from the design and analyses results.
1. PBD following CHBDC 2014 yields very high reinforcement ratio for a lifeline bridge,
even crossing the maximum reinforcement percentage limit (6%) specified. This will result
in superior seismic performance, but the construction cost and difficulty will rise.
Designing the bridge pier following the PBD from the supplement to CHBDC 2014 yields
only 1.22% reinforcement ratio for considered loading and geometric conditions.
2. Designing the bridge pier according to the CHBDC 2010 FBD method results in 4.87%
reinforcement ratio, which is 20.2% less than that of PBD pier designed according to
CHBDC 2014. However, 300% more reinforcement required if FBD design is followed for
a single lifeline bridge pier compared to the PBD method from the supplement to CHBDC
2014. CHBDC does not restrict the design of a lifeline bridge with single pier bent. Thus,
higher importance factor with lower force reduction factor yields in very high longitudinal
reinforcement ratio.
3. The governing design criteria in CHBDC 2014 is found to be the minimal damage during
a seismic event of 5% probability in 50 years. This criterion ends in extremely high
reinforcement requirement since the strain in steel cannot reach the yield limit. However,
in the supplement to CHBDC 2014, this strain limit has been escalated to 0.01, almost five
folds to the yielding strain of steel considered in this study. The governing design criterion
becomes the steel strain cannot exceed 0.025 in an earthquake with a probability of 5% in
50 years, leads to lower reinforcement ratio.
4. Increasing longitudinal reinforcement percentage makes the bridge pier stiffer. As a result,
PBD bridge column designed according to the supplement to CHBDC 2014 experiences
103% more maximum drift compared to the FBD pier and 125% more maximum drift
compared to the pier designed following CHBDC 2014 at the same PGA (0.5g) by 50%
ground motions.
5. PBD from CHBDC 2014 and FBD from CHBDC 2010 offer larger yield displacement
capacity (36.7% and 47.8% higher respectively) during dynamic loading than that of PBD
from the supplement to CHBDC 2014. Higher yield deformation capacity indicates better
performance demanding a higher intensity earthquake to reach the strain limit.
114
6. In terms of fragility analysis, pier designed following CHBDC 2014 exhibits remarkably
good performance. The supplement to CHBDC 2014 followed bridge pier increases the
collapse probability at PGA 1g earthquake to 66% from 13% in FBD pier. Whereas, the
CHBDC 2014 PBD pier reduces it to 6%. Considering construction challenge and
economic feasibility, designing bridge piers following CHBDC 2014 supplement will
provide reduced longitudinal reinforcement with a compromised seismic performance for
a lifeline bridge pier.
7. Fragility curves using the limit states defined from CHBDC performance criteria for PBD
indicate higher damage fragility of the bridge pier designed following the supplement to
CHBDC 2014 compared to the CHBDC 2014 code followed bridge pier. Minimal
performance criteria stated in the supplement to CHBDC 2014 are milder compared to
highly conservative CHBDC 2014 entail lower longitudinal reinforcement, which
increases the damage probability of bridge pier. The minimal damage criteria should be
considered for further modification for a lifeline bridge pier.
8. The inclusion of HSR have the capability to reduce longitudinal reinforcement requirement
in PBD to about 50% compared to Grade 60 rebars. The economy in construction projects
without compromising seismic performance can be achieved by incorporating HSR in
design.
9. Moderate damage state limit from FEMA guideline and repairable damage state limit from
CHBDC experience improvement due to its direct link to steel strength. The demand in
PGA of ground motion increases from 44% to 53% for 50% moderate damage possibility
in a bridge pier when Grade 120 rebars is used in design in place of Grade 60 for varying
concrete strength. For 50% repairable damage probability, the demand increases about
3.5%. However, the collapse vulnerability increases notably at design PGA earthquake
when HSR are employed in the design of bridge piers due to lower reinforcement ratio.
Increasing concrete strength and transverse reinforcement strength can solve this issue
marginally.
6.4 Recommendation for Future Research
Design is the primary and most critical step for any large scale project. Faulty design can
cause catastrophe during and after the construction of the structure. The economy in construction

115
and stability in performance during a seismic action without causing any major damage are
expected by the stakeholders and users. This particular study tries give in insight on the PBD of
lifeline bridge pier by comparing design alternatives and utilizing varying steel and concrete
strength. The scope of this study could be extended to the following aspects:
Performance criteria in the PBD may need some modification especially over minimal
damage criteria for lifeline single bridge pier in future research to relate with the design
outcome comparable to the FBD results.
Recent modifications in performance criteria in CHBDC should be studied in other types
of bridge structure with different configurations to extend the scope of the PBD.
Design with high strength steel should be considered in CHBDC in near future to utilize
the benefit of improved strength and performance. To improve the collapse performance
of HSR bridge piers, variation in transverse reinforcement properties and details in
combination with concrete and longitudinal steel strength should be studied. However,
more vigorous research is expected on dynamic analysis and cost-benefit analysis of HSR
bridges for better decision making.

116
REFERENCES
AASHTO 2007. AASHTO LRFD Bridge design specifications. American Association of State
Highway and Transportation Officials, Washington, D.C.
AASHTO 2014. AASHTO LRFD Bridge design specifications. 7th ed., customary U.S. units.
American Association of State and Highway Transportation Officials, Washington, DC.
AASHTO MP 18M/MP 18-15. 2015. Standard specification for uncoated, corrosion-resistant,
deformed and plain alloy, billet-steel bars for concrete reinforcement and dowels.
American Association of State and Highway Transportation Officials, Washington, DC.
ACI 1983. Building Code Requirements for Reinforced Concrete. ACI 318-83, ACI Committee
318, American Concrete Institute, Detroit.
ACI 1984. State-of-the-Art Report on High-Strength Concrete. ACI 363R-84, ACI Committee
363, American Concrete Institute, Detroit.
ACI 2014. Building code requirements for structural concrete and commentary. ACI 318-14, ACI
Committee 318, American Concrete Institute, Farmington Hills, Michigan.
Adams, J., and Halchuk, S. 2003. Fourth generation seismic hazard maps of Canada: values for
over 650 Canadian localities intended for the 2005 National Building Code of Canada.
Geological Survey of Canada, Open File 4459.
Ahlborn, T., and DenHartigh, T. 2002. A comparative bond study of MMFX reinforcing steel in
concrete. Michigan Tech Report CSD- 2002-03.
Alam, M.S., Bhuiyan, A.R., and Billah, A.H.M.M. 2012. Seismic fragility assessment of SMA-
bar restrained multi-span continuous highway bridge isolated with laminated rubber bearing
in medium to strong seismic risk zones. Bulletin of Earthquake Engineering, 10(6): 1885-
1909.
Alam, M.S., Youssef. M.A., and Nehdi, M. 2008. Analytical prediction of the seismic behaviour
of superelastic shape memory alloy reinforced concrete elements. Engineering Structures,
30(12): 3399-3411.
Allen, D.E. 1975. Limit states design-A probabilistic study. Canadian Journal of Civil
Engineering, 2(1): 36-49.
117
ASTM 2007. Standard specification for deformed and plain, low-carbon, chromium, steel bars for
concrete reinforcement. ASTM A1035, ASTM International, West Conshohocken,
Pennsylvania.
ASTM 2009. Standard Specification for Deformed and Plain Carbon-Steel Bars for Concrete
Reinforcement. ASTM A615-09b, ASTM International, West Conshohocken,
Pennsylvania.
Attard, M.M., and Setunge, S. 1996. Stress-Strain Relationship of Confined and Unconfined
Concrete. ACI Materials Journal, 93(5): 432-441.
ATC 1985. Earthquake damage evaluation data for California (ATC-13). Applied Technology
Council, Redwood City, California.
ATC 1987. Evaluating the seismic resistance of existing buildings (ATC-14). Applied Technology
Council Redwood City, California.
ATC 1996 Seismic evaluation and retrofit of existing concrete buildings (ATC-40). Applied
Technology Council, Redwood City, California.
ATC 2003. Recommended LFRD guidelines for the seismic design of highway bridges.
MCEER/ATC-49, Applied Technology Council, Redwood City, California.
ATC 2014. Roadmap for the use of high-strength (ATC-115). Applied Technology Council
Redwood City, California.
Aoyama, H. 2001. Design of modern highrise reinforced concrete structures. Imperial College
Press, London, United Kingdom.
Azizinamini, A., Chisala, M., and Ghosh, S.K. 1995. Tension development length of reinforcing
bars embedded in high-strength concrete. Engineering Structures, 17(7): 512–522.
Azizinamini, A., Stark, M., Roller, J. J., and Ghosh, S. K. 1993. Bond performance of reinforcing
bars embedded in high-strength concrete. ACI Structural Journal, 90(5): 554–561.
Baker, J.W. 2015. Efficient Analytical Fragility Function Fitting Using Dynamic Structural
Analysis. Earthquake Spectra, 31(1): 579–599.
Baker, J.W., and Cornell, C.A. 2006. Vector-valued ground motion intensity measures for
probabilistic seismic demand analysis. PEER report 2006/08, PEER Center, University of
California, Berkeley, CA.

118
Baker, J.W., Lin, T., Shahi, S.K., and Jayaram, N. 2011. New ground motion selection procedures
and selected motions for the PEER transportation research program. PEER Technical
report 2011/03, PEER Center, University of California, Berkeley, CA.
Banerjee, S., and Shinozuka, M. 2008. Mechanistic quantification of RC bridge damage states
under earthquake through fragility analysis. Probabilistic Engineering Mechanics, 23(1):
12–22.
Bardakis, V.G., and Fardis, M.N. 2010. A displacement-based seismic design procedure for
concrete bridges having deck integral with the piers. Bulletin of Earthquake Engineering,
9(2): 537–560.
Basöz, N., Kiremidjian, A.S., King, S.A., and Law, K.H. 1999. Statistical analysis of bridge
damage data from the 1994 Northridge, CA, earthquake. Earthquake Spectra, 15(1): 25-54.
Bentz, E.C. 2000. Sectional Analysis of Reinforced Concrete. Ph.D. Dissertation, University of
Toronto, Ontario, Canada.
Bertero, V.V. 1996. The need for multi-level seismic design criteria. In Proceedings of the 11th
World Conference on Earthquake Engineering, 23-28 June, Acapulco, Mexico.
Billah, A.H.M.M. and Alam, M.S. 2014a. Seismic performance evaluation of multi-column bridge
bents retrofitted with different alternatives using incremental dynamic analysis.
Engineering Structures, 62–63: 105–117.
Billah, A.H.M.M., and Alam, M.S. 2014b. Performance-based prioritization for seismic
retrofitting of reinforced concrete bridge bent. Structure and Infrastructure Engineering,
10(8): 929-949.
Billah, A.H.M.M., and Alam, M.S. 2014c. Seismic fragility assessment of concrete bridge pier
reinforced with superelastic Shape Memory Alloy. Earthquake Spectra, 31(3): 1515-1541.
Billah, A.H.M.M. and Alam, M.S. 2015a. Seismic Fragility Assessment of Highway Bridges: A
State-of-The-Art Review. Structure and Infrastructure Engineering, 11(6): 804-832.
Billah, A.H.M.M., and Alam, M.S. 2015b. Seismic Fragility Assessment of Concrete Bridge Pier
Reinforced with Superelastic Shape Memory Alloy. Earthquake Spectra, 31(3): 1515-
1541.

119
Billah, A.H.M.M. and Alam, M.S. 2016a. Performance-Based Seismic Design of Shape Memory
Alloy–Reinforced Concrete Bridge Piers. I: Development of Performance-Based Damage
States. Journal of Structural Engineering, 142(12): 04016140.
Billah, A.H.M.M., and Alam, M.S. 2016b. Plastic hinge length of shape memory alloy (SMA)
reinforced concrete bridge pier. Engineering Structures, 117: 321–331.
Billah, A.H.M.M., Alam, M.S., and Bhuiyan, A.R. 2013. Fragility analysis of retrofitted
multicolumn bridge bent subjected to near-fault and far-field ground motion. Journal of
Bridge Engineering, 18(10): 992–1004.
Bournonville, M., Dahnke, J., and Darwin, D. 2004. Statistical analysis of the mechanical
properties and weight of reinforcing bars. SL Report 04-1. The University of Kansas, USA.
Bradley, B.A., Cubrinovski, M., MacRae, G.A., and Dhakal, R.P. 2009. Ground-Motion Prediction
Equation for SI Based on Spectral Acceleration Equations. Bulletin of the Seismological
Society of America, 99(1): 277–285.
Brown, M., Bayrak, O., and Jirsa, J. 2006. Design for shear based on loading conditions. ACI
Structural Journal, 103(4): 541-550.
Budek, A., Priestley, M., and Lee, C. 2002. Seismic design of columns with high-strength wire
and strand as spiral reinforcement. ACI Structural Journal, 99(5):660-670.
Caltrans 1994. Initial and supplementary bridge reports for the Northridge Earthquake. California
Department of Transportation, Sacramento, CA.
Caltrans. 2004. Seismic Design Criteria. California Department of Transportation. Sacramento,
CA.
Chandramohan, R., Baker, J.W., and Deierlein, G.G. 2016. Quantifying the Influence of Ground
Motion Duration on Structural Collapse Capacity Using Spectrally Equivalent Records.
Earthquake Spectra, 32(2): 927–950.
Chang, S. E., and Nojima, N. 2001. Measuring post-disaster transportation system performance:
The 1995 Kobe earthquake in comparative perspective. Transportation Research. Part A,
Policy and Practice, 35(6): 475–494.
Chao, S. H., Naaman, A. E., and Parra-Montesinos, G. J. 2009. Bond behavior of reinforcing bars
in tensile strain-hardening fiber-reinforced cement composites. ACI Structural Journal,
106(6): 897–906.

120
Chen, W.F., and Duan, L. 2013. Handbook of international bridge engineering. CRC Press, NW.
China-MOC. 2008. Chinese guidelines for seismic design of highway bridges.
Choi, E. 2002. Seismic analysis and retrofit of Mid-America bridges. PhD thesis, Georgia Institute
of Technology, Atlanta, GA.
Choi, E., DesRoches, R., and Nielson, B. 2004. Seismic fragility of typical bridges in moderate
seismic zones. Engineering Structures, 26(2): 187–199.
Ciancone, G.G., Michael, A.P., and Hamilton III, H.R. 2008. Behavior of standard hook anchorage
with corrosion resistant reinforcement. Technical Report FDOT No. BD 545-40, Florida
Department of Transportation, FL, USA.
Colley, S.D., Kleinjan, B., Bull, D.K., and Morris, G.J. 2015. Review of material and flexural
overstrength factors for Grade 300E reinforcing steel used in New Zealand. In
Proceedings of the NZSEE Conference, 10–12 April, Rotorua, New Zealand, Paper
Number O-18.
Cornell, A.C., Jalayer, F., and Hamburger, R.O. 2002. Probabilistic basis for 2000 SAC federal
emergency management agency steel moment frame guidelines. Journal of Structural
Engineering, 128(4): 526–532.
Correia, A.A., Almeida, J.P., and Pinho, R. 2008. Force-based versus displacement-based
formulations in the cyclic nonlinear analysis of RC frames. In Proceedings of the 14th
World Conference on Earthquake Engineering, October 12-17, Beijing, China.
CHBDC 2016. Bridge Standards and Procedures Manual. Supplement to CHBDC S6-14, Volume
I, British Columbia Ministry of Transportation, BC, Canada.
CSA 2000. Canadian highway bridge design code (CAN/CSA S6-00). Canadian Standards
Association (CSA), Toronto, Ontario.
CSA 2006. Canadian Highway Bridge Design Code (CAN/CSA S6-06). Canadian Standards
Association.
CSA 2010. S6S1-10 Supplement No. 1 to CAN/CSA-S6-06, Canadian Highway Bridge Design
Code, Canadian Standards Association, Rexdale, ON, Canada.
CSA 2014. Canadian Highway Bridge Design Code (CAN/CSA S6-14). Canadian Standards
Association.

121
Cusson, D., and Paultre, P. 1994. High-Strength Concrete Columns Confined with Rectangular
Ties. Journal of Structural Engineering, 120(3): 783–804.
Dawood, H. M., and ElGawady, M. 2013. Performance-based seismic design of unbonded precast
post-tensioned concrete filled GFRP tube piers. Composites Part B: Engineering, 44(1):
357-367.
DeJong, S.J. 2005. Fatigue of Corrosion Resistant Reinforcing Steels. MS thesis, Queen’s
University.
DeJong, S.J., and MacDougall, C. 2006. Fatigue Behaviour of MMFX Corrosion-Resistant
Reinforcing Steel. In Proceedings of the 7th International Conference on Short and Medium
Span Bridges, Montreal, Canada.
Dezfuli, H.F., and Alam, M. S. 2017. Effect of different steel-reinforced elastomeric isolators on
the seismic fragility of a highway bridge. Structural Control Health Monitor, 24(2): e1866.
doi: 10.1002/stc.1866.
El-Hacha, R., and Rizkalla, S. 2002. Fundamental material properties of MMFX steel rebars.
Research Report: RD-02/04, North Carolina State University, page 62.
El-Hacha, R., El-Agroudy, H., and Rizkalla, S. 2006. Bond Characteristics of High-Strength Steel
Reinforcement. ACI Structural Journal, 103(6): 771–782.
Esfahani, M. R., and Kianoush, M. R. 2005. Development/splice length of reinforcing bars. ACI
Structural Journal, 102(1): 22–30.
Firas, S. A., Foret Gilles, F., and Robert, L. R. 2011. Bond between carbon fibre-reinforced
polymer (CFRP) bars and ultra high performance fibre reinforced concrete (UHPFRC):
Experimental study. Construction and Building Materials, 25(2): 479–485.
Fakharifar, M., Chen, G., Dalvand, A., and Shamsabadi, A. 2015a. Collapse vulnerability and
fragility analysis of substandard RC bridges rehabilitated with different repair jackets under
post-mainshock cascading events. International Journal of Concrete Structures and
Materials, 9(3): 345–367.
Fakharifar, M., Chen, G., Sneed, L., and Dalvand, A. 2015b. Seismic performance of post-
mainshock FRP/steel repaired RC bridge columns subjected to aftershocks. Composites:
Part B, 72: 183–198.

122
Faza, S., Kwok, J., Salah, O. 2008. Application of high-strength and corrosion-resistant ASTM
A1035 steel reinforcing bar in concrete high-rise construction. In Proceedings of the
CTBUH 8th World Congress, March 3-8, Dubai.
FEMA 1996. NEHRP guidelines for the seismic rehabilitation of buildings; FEMA 274,
Commentary. Federal Emergency Management Agency, Washington DC.
FEMA 2000a. Commentary for the Seismic Rehabilitation of Buildings. FEMA-356, Federal
Emergency Management Agency, Washington, DC.
FEMA. 2000b. Recommended seismic design criteria for new steel moment frame buildings. Rep.
No. FEMA-350, SAC Joint Venture, Federal Emergency Management Agency,
Washington, DC.
FEMA. 2000c. Recommended seismic evaluation and upgrade criteria for existing welded steel
moment frame buildings. Report No. FEMA-351, SAC Joint Venture, Federal Emergency
Management Agency, Washington, DC.
FEMA 2003. HAZUS-MH software. Federal Emergency Management Agency, Washington DC.
FHWA-NHI. 2014. LRFD Seismic analysis and design of bridges reference manual. U.S.
Department of Transportation Federal Highway Administration Publication No. FHWA-
NHI-15-004.
Firoze, M. 2010. Attributes of ductile reinforcing steel. In Proceedings of the IABSE-JSCE Joint
Conference on Advances in Bridge Engineering-II, Dhaka, Bangladesh.
Floren, A., and Mohammadi, J. 2001. Performance-Based Design Approach in Seismic Analysis
of Bridges. Journal of Bridge Engineering, 6(1): 37–45.
Florida DOT. 2002. Investigation into the Structural Performance of MMFX Reinforcing Bars.
Forcellini, D., Tarantino, A., Elgamal, A., Lu, J., and Mackie, K. 2012. Performance-based seismic
assessment of isolated bridge configurations on deformable soils. In Proceedings of the
15th World Conference on Earthquake Engineering, Lisbon, Portugal.
Gardoni, P., Mosalam, K.M., and Der Kiureghian, A. 2003. Probabilistic seismic demand models
and fragility estimates for RC bridges. Journal of Earthquake Engineering, 7(1): 79-106.
Ghobarah, A. 2001. Performance-based design in earthquake engineering: state of development.
Engineering Structures, 23(8): 878-884.

123
Golabi, K., and Shepard, R. 1997. A system for maintenance optimization and improvement of US
bridge networks. Interfaces, 27(1): 71-88.
Goodnight, J.C., Feng, Y., Kowalsky, M.J., and Nau, J.M. 2015. The effects of load history and
design variables on performance limit states of circular bridge columns- volume 2:
experimental observations. Repot No. 4000(72). Alaska Department of Transportation and
Public Facilities, Channel Drive, Juneau, AK.
Gordin, E. 2010. Performance-based decision-making in post-earthquake highway bridge repair.
Ph.D. Thesis, University of California, Berkeley.
Graham, S.K., and Paulson, C. 2008. Mechanical properties of ASTM A1035 high strength steel
bar reinforcement. Prepared by Wiss, Janney, Elstner Associates, Inc., for the ACI
Innovation Task Group 6 (ITG-6), WJE No. 2008.9901.0, Pasadena, California.
Hage, S.E., 1974. The Second-Order Analysis of Reinforced Concrete Frames. M.S. Thesis,
University of Alberta, Edmonton, Canada.
Hamad, B. S., and Itani, M. S. 1998. Bond strength of reinforcement in high-performance concrete:
The role of silica fume, casting position, and superplasticizer dosage. ACI Material Journal,
95(5): 499–511.
Hamburger, R., Rojahn, C., Moehle, J., Bachman, R., Comartin, C., and Whittaker, A. 2004. The
ATC-58 project: development of next-generation performance-based earthquake
engineering design criteria for buildings. In Proceedings of the 13th World Conference on
Earthquake Engineering, 1-6 August, Vancouver, British Columbia, Canada.
Harajli, M. H., Hamad, B. S., and Karam, K. 2002. Bond-slip response of reinforcing bars
embedded in plain and fiber concrete. Journal of Materials in Civil Engineering, 14(6),
503–511.
Harajli, M. H. 2004. Comparison of bond strength of steel bars in normal and high-strength
concrete. Journal of Materials in Civil Engineering, 16(4): 365–374.
Hassan, T.K., Lucier, G.W., and Rizkalla, S.H. 2012. Splice strength of large diameter, high
strength steel reinforcing bars. Construction and Building Materials, 26(1): 216-225
Hill, C., Chiaw, C.C., and Harik, I.E. 2003. Reinforcement Alternatives for Concrete Bridge
Decks. Report KTC-03-19/SPR-215-00-1F.

124
Hognestad, E., Winter, G., Mavis, F.T., and Greaves, M. J. 1960. High-Strength Reinforcing Steels
for Concrete Bridges. In Transportation Research Record: Journal of the Transportation
Research Board, No. 39. Transportation Research Board of the National Academies,
Washington, DC, pp. 103-119.
Holschemacher, K., Weibe, D., and Klotz, S. 2005. Bond of reinforcement in ultra high-strength
concrete. Report no. SP-228-34, American Concrete Institute, Farmington Hills, MI.
Housner, G. W. 1963. The behaviour of inverted pendulum structure during earthquake, Bulletin
of the Seismological Society of America, 53: 403–417
Hsu, Y.T., and Fu, CC. 2004. Seismic Effect on Highway Bridges in Chi Chi Earthquake. Journal
of Performance of Constructed Facilities, 18(1): 47–53.
Huo, Y., and Zhang, J. 2013. Effects of Pounding and Skewness on Seismic Responses of Typical
Multispan Highway Bridges Using the Fragility Function Method. Bridge Engineering,
18(6): 499-515.
Hwang, H., Liu, J. B., and Chiu, Y. H. 2001. Seismic fragility analysis of highway bridges, Mid-
America Earthquake Center report: project MAEC RR-4, University of Illinois, Urbana-
Champaign.
Ji, J., Darwin, D., and Browning, J. 2005. Corrosion resistance of duplex stainless steels and
MMFX microcomposite steel for reinforced bridge decks. SM Report No. 80. The
University of Kansas Center for Research, Inc., Lawerence, Kansas.
Jones, M. H., Semyon Treyger, P., Pence, P. W., and Shama, A. 2013. The Gerald Desmond Cable-
Stayed Bridge-A case study in performance-based seismic design. In Proceedings of the
Structures Congress, 2-4 May, Pittsburgh, Pennsylvania.
Kabir, M.R., Billah, A.H.M.M., and Alam, M.S. 2015. Seismic vulnerability assessment of a
typical 3 span highway bridge in Bangladesh. In Proceedings of the IABSE-JSCE Joint
Conference on Advances in Bridge Engineering-III, 21-22 August 2015, Dhaka,
Bangladesh, paper ID 9.
Karamlou, A., Bochini, P. 2015. Computation of bridge seismic fragility by large-scale simulation
for probabilistic resilience analysis. Earthquake Engineering and Structural Dynamics,
44(12):1959–1978.

125
Karim, K. R., and Yamazaki, F. 2001. Effect of earthquake ground motions on fragility curves of
highway bridge piers based on numerical simulation. Earthquake Engineering and
Structural Dynamics, 30: 1839–1856.
Khan, S., and Jiang, J. 2015. Performance-based seismic design for the Vancouver Evergreen Line
Rapid Transit Project-process, challenges, and innovative design solutions. Paper
presented at the Structures Congress, Portland, Oregon.
Kim, S., and Shinozuka, M. 2004. Development of fragility curves of bridges retrofitted by column
jacketing. Probabilistic Engineering Mechanics, 19(1-2): 105–112.
Korinda, K., 1972. Discussion No. 3- Cracking and crack control. In Proceedings of the
International Conference on Planning and Design of Tall Buildings, Lehigh University,
Bethlehem, Pennsylvania.
Kowalsky, M.J. 2002. A Displacement-based approach for the seismic design of continuous
concrete bridges. Earthquake Engineering and Structural Dynamics, 31(3): 719–747.
Kowalsky, M.J., Priestley, M.J.N., and MacRae, G.A. 1995. Displacement-based design of RC
bridge columns in seismic regions. Earthquake Engineering and Structural Dynamics,
24(12): 1623–1643.
Laughery, L.A. 2016. Response of High-Strength Steel Reinforced Concrete Structures to
Simulated Earthquakes. Ph.D. Thesis, Purdue University, West Lafayette, Indiana, USA.
Liu, M., Lu, B., and Liu, B. 2012. Study on performance index of reinforced concrete bridge
column. Advances in Intelligent Soft Computing, 114:189–98.
Lu, J., Mackie, K., and Elgamal, A. 2011. BridgePBEE: OpenSees 3D pushover and earthquake
analysis of single-column 2-span bridges, User Manual, Beta 1.0.
Lubell, A., Sherwood, T., Bentz, E., and Collins, M.P. 2004. Safe shear design of large, wide
beams. ACI Concrete International, 26(1): 66-78.
Luco N., and Cornell C.A. 1998. Effects of random connection fractures on the demands and
reliability for a three-story pre-Northridge (SMRP) structure. In Proceedings of the 6th US
national conference on earthquake engineering, May 31-June 4, Earthquake Engineering
Research Institute, Oakland, California.
126
Mackie, K.R., and Stojadinović, B. 2004. Fragility curves for reinforced concrete highway
overpass bridges. 13th World Conference on Earthquake Engineering. Paper No. 1553, 1-
6 August, Vancouver, B.C., Canada.
Mackie, K., and Stojadinović, B. 2007. Performance-based seismic bridge design for damage and
loss limit states. Earthquake Engineering & Structural Dynamics, 36(13): 1953-1971.
Malhas, F.A. 2002. Preliminary Experimental Investigation of the Flexural Behavior of Reinforced
Concrete Beams using MMFX Steel. Final Report for MMFX Technologies Corporation,
University of North Florida, Jacksonville, Florida.
Mander, J. B., Priestley, M. J. N., and Park, R. 1988. Theoretical stress strain model for confined
concrete. Journal of Structural Engineering, 114(8): 1804-1826.
Marsh, M. L., and Stringer, S. J. 2013. Performance-based seismic bridge design. TRB’s National
Cooperative Highway Research Program (NCHRP) Synthesis 440 Transportation
Research Board, Washington, D.C.
Mast, R.F., Dawood, M., Rizkalla, S.M., and Zia, P. 2008. Flexural Strength Design of Concrete
Beams Reinforced with High-Strength Steel Bars. ACI Structural Journal, 105(4): 570–
577.
McNally, M.M. 2003. MMFX Rebar Evaluation for I-95 Service Road Bridge 1-712-B. MS thesis,
University of Delaware, Delaware, USA.
Menegotto, M., and Pinto, P. E. 1973. Method of analysis for cyclically loaded R.C. plane frames
including changes in geometry and nonelastic behaviour of elements under combined
normal force and bending. Symposium on the Resistance and Ultimate Deformability of
Structures Acted on By Well-Defined Repeated Loads, International Association for
Bridge and Structural Engineering, Zurich, Switzerland, 15–22.
Mirza, S. 2007. Danger ahead: The coming collapse of Canada’s municipal infrastructure. Report
for the Federation of Canadian Municipalities, Ottawa, Ont., 1-25.
Mirza, S. A., and MacGregor, J. G. 1979. Variability of Mechanical Properties of Reinforcing
Bars. Structural Division, ASCE, 105: 921-937.
Mitchell, D., Paultre, P., Tinawi, R., Saatcioglu, M., Tremblay, R., Elwood, K.J., Adams, J., and
DeVall, R. 2010. Evolution of seismic design provisions in the national building code of
Canada. Canadian Journal of Civil Engineering, 37(9): 1157–1170.

127
Moehle, J.P. 1996. Displacement-based seismic design criteria. In Proceedings of the 11th World
Conference on Earthquake Engineering, 23-28 June, Acapulco, Mexico. Paper no. 2125.
Moran, J.D.G., and Lubell, A.S. 2008. Behavior of Concrete Deep Beams with High Strength
Reinforcement. Report No. 277. University of Alberta. Alberta, Canada.
Muguruma, H., Nishiyama, M., Watanabe, F., and Tanaka, H. 1991. Ductile Behavior of High
Strength Concrete Columns Confined by High Strength Transverse Reinforcement. ACI
SP-128 - Evaluation and Rehabilitation of Concrete Structures and Innovations in Design,
128: 877–891.
Munikrishna, A. 2008. Shear Behavior of Concrete Beams Reinforced with High Performance
Steel Shear Reinforcement, M.S. Thesis, North Carolina State University, Raleigh, North
Carolina.
Nagashima, T., Sugano, S., Kimura, H., and Ichikawa, A. 1992. Monotonic Axial Compression
Test on Ultrahigh Strength Concrete Tied Columns. In Proceedings of the 10th World
Conference on Earthquake Engineering, 19-24 July, Madrid, pp 2983–2988.
Naumoski, N., Tso, W.K., and Heidebrecht, A.C. 1988. A selection of representative strong motion
earthquake records having different A/V ratios. EERG Rep. 88-01, Dept. of Civil
Engineering, McMaster Univ., Hamilton, ON, Canada.
Nawy, E.G. 1968. Crack Control in Reinforced Concrete Structures, Journal of the American
Concrete Institute, Farmington Hills, MI, 65: 825–838.
Nielson, B.G. 2005. Analytical Fragility Curves for Highway Bridges in Moderate Seismic Zones.
Ph.D. Thesis, Georgia Institute of Technology, Atlanta, GA.
Nielson, B.G., and DesRoches, R. 2007a. Seismic fragility methodology for highway bridges using
a component level approach. Earthquake Engineering and Structural Dynamics, 36: 823-
839.
Nielson, B.G., and DesRoches, R. 2007b. Seismic fragility curves for typical highway bridge
classes in the central and southeastern United States. Earthquake Spectra, 23: 615-633. doi:
10.1193/1.2756815.
Nishiyama, M., Fukushima, I., Watanabe, F., and Muguruma, H. 1993. Axial Loading Tests on
High Strength Concrete Prisms Confined by Ordinary and High Strength Steel. In

128
Proceedings of the Symposium on High Strength Concrete, 20-23 June, Norway, pp 322–
329.
NIST 2014. Use of High-Strength Reinforcement in Earthquake-Resistant Concrete Structures.
National Institute of Standards and Technology GCR 14-917-30, prepared by the NEHRP
Consultants Joint Venture, a partnership of the Applied Technology Council and the
Consortium for Universities for Research in Earthquake Engineering, for the National
Institute of Standards and Technology, Gaithersburg, Maryland.
NRC 2017. 2010 National Building Code of Canada seismic hazard values.
<http://earthquakescanada.nrcan.gc.ca/> (March. 05, 2017)
NRCC 2005. National building code of Canada. National Research Council of Canada, Ottawa,
Ontario.
NRCC. 2010. National building code of Canada. National Research Council of Canada, Ottawa,
Ontario.
NZ-Transport. 2014. New Zealand bridge manual. New Zealand Government.
Ortiz, J. 2006. Displacement-based design of continuous concrete bridges under transverse seismic
excitation. European School for Advanced Studies in Reduction of Seismic Risk (ROSE
School).
Ou, Y., Kurniawan, D., and Handika, N. 2012. Shear behavior of reinforced concrete columns with
high strength steel and concrete under low axial load. In Proceedings of the ACI Fall
Convention, 21-25 October, Toronto, Ontario, Canada.
Overby, D., Kowalsky, M., and Seracino, R. 2015. A706 Grade 80 Reinforcement for Seismic
Applications. Report No. CA16-2563, California Department of Transportation,
Sacramento, CA.
Özer, E., and Soyöz, S. 2015. Vibration-based damage detection and seismic performance
assessment of bridges. Earthquake Spectra, 31(1): 137-157.
Padgett, J.E. 2007. Seismic vulnerability assessment of retrofitted bridges using probabilistic
methods. Ph.D. Thesis, Georgia Institute of Technology, Atlanta, GA.
Padgett J., and DesRoches, R. 2007. Bridge functionality relationships for improved seismic risk
assessment of transportation networks. Earthquake Spectra, 23: 115–130.
129
Padgett, J. E., and DesRoches, R. 2008. Methodology for the development of analytical fragility
curves for retrofitted bridges. Earthquake Engineering and Structural Dynamics, 37: 157–
174.
Pang, Y., Wu, X., Shen, G., and Yuan, W. 2014. Seismic fragility analysis of cable-stayed bridges
considering different sources of uncertainties. Journal of Bridge Engineering, 19(4): 1—1.
Parghi, A., and Alam, M.S. 2017. Collapse Fragility Analysis of Non-Seismically Designed Bridge
Columns Retrofitted with FRP Composites. In Proceedings of the Structures Congress 2017:
Bridges and Transportation Structures, 6–8 April, Denver, Colorado.
Paulay, T., and Priestley, M. N. J. 1992. Seismic design of reinforced concrete and masonry
buildings, Willey, New York.
Paulson, C., Graham, S.K., and Rautenberg, J.M. 2013. Determination of Yield Strength for
Nonprestressed Steel Reinforcement, prepared by Wiss, Janney, Elstner Associates, Inc.,
for the Charles Pankow Foundation, RGA 04-13, WJE No. 2013.4171, Pasadena,
California.
Paultre, P., Légeron, F., and Mongeau, D. 2001. Influence of Concrete Strength and Transverse
Reinforcement Yield Strength on Behavior of HighStrength Concrete Columns. ACI
Structural Journal, 98(4): 490-501.
PEER 2011. New ground motion selection procedures and selected motions for the PEER
transportation research program. PEER Rep. 2011/03, PEER center, University of
California, Berkeley, CA.
Peterfreund, P. 2003. Development length of MMFX steel reinforcing bars used in bridge deck
applications. MSc thesis, University of Massachusetts-Amherst.
Pinho, R., Casarotti, C., and Antoniou, S. 2007. A Comparison of singlerun pushover analysis
techniques for seismic assessment of bridges. Earthquake Engineering Structural Dynamics,
36(10): 1347–1362.
Price, K.R., Fields, D., and Lowes, L.N. 2014. The impact of high-strength reinforcing steel on
current design practice. Research Grant Agreement #01-13, Charles Pankow Foundation,
Vancouver, Washington.
Priestley, M. 2000. Performance based seismic design. Bulletin of the New Zealand Society for
Earthquake Engineering, 33(3): 325-346.

130
Priestley, M.J.N., Calvi, G.M., and Kowalsky, M.J. 2007. Displacement-based seismic design of
structures. IUSS Press, Pavia, Italy.
Priestley, M.J.N., Seible, F., and Calvi, G.M. 1996. Seismic design and retrofit of bridges. Willey,
New York.
Rautenberg, J.M. 2011. Drift capacity of concrete columns reinforced with high-strength steel.
PhD thesis, Purdue University, West Lafayette, USA.
Razvi, S.R., and Saatcioglu, M. 1994. Strength and deformability of high strength concrete
columns. ACI Structural Journal, 91(6): 678–687.
Restrepo, J.I., Seible, F., Stephan, B., and Schoettler, M.J. 2006. Seismic testing of bridge columns
incorporating high-performance materials. ACI Structural Journal, 103(4): 496–504.
Reza, S.M. 2012. Seismic Performance of Multi-Span RC Bridge with Irregular Column Heights.
M.A.Sc. Thesis, the University of British Columbia, Canada.
Reza, S.M., Alam, M.S., and Tesfamariam, S. 2014. Seismic performance comparison between
direct displacement-based and force-based design of a multi-span continuous reinforced
concrete bridge with irregular column heights. Canadian Journal of Civil Engineering, 41:
440–449.
Rizkalla, S., Zia, P., Seliem, H., and Lucier, G. 2005. Evaluation of MMFX steel for NCDOT
concrete bridges. Report FHWA/NC/2006-31, NCDOT Project 2004-27.
Roy, N., Paultre, P., and Proulx, J. 2010. Performance-based seismic retrofit of a bridge bent:
Design and experimental validation. Canadian Journal Civil Engineering 37: 367–379.
Russell, H.G., Miller, R.A., Harries, K.A., and Shahrooz, B.M. 2011. Design of concrete structures
using high-strength steel reinforcement. NCHRP report 679. Transportation research
board, Washington, D.C.
Saiidi, M. 2011. Managing seismic performance of highway bridges evolution in experimental
research. Structure and Infrastructure Engineering, 7(7–8): 569–586.
Saleem, M.A., Mirmiran, A., Xia, J., and Mackie, K. 2013. Development length of high-strength
steel rebar in ultrahigh performance concrete. Journal of Materials in Civil Engineering,
25(8): 991-998.

131
Salomon, A.L., and Moen, C.D. 2014. Structural design guidelines for concrete bridge decks
reinforced with corrosion-resistant reinforcing bars. Report No. FHWA/VCTIR 15-R10.
U.S. Department of Transportation Federal Highway Administration. Charlottesville,
Virginia.
SEAOC Vision 2000. 1995. Performance based seismic engineering of buildings, vols. I and II:
Conceptual framework. Sacramento Structural Engineers Association of California, CA.
SeismoMatch. 2014. SeismoMatch help file. Available from www.seismsoft.com
SeismoStructure. 2015. SeismoStruct help file. Available from www.seismsoft.com
Seliem, H., Hosny, A., Dwairi, H., and Rizkalla, S. 2006. Shear behavior of concrete beams
reinforced with MMFX steel without web reinforcement. NC State Report IS-06-08.
Seliem, H.M., Hosny, A., Rizkalla, S., Zia, P., Briggs, M., Miller, S., Darwin, D., Browning, J.,
Glass, G.M., Hoyt, K., Donnelly, K., and Jirsa, J.O. 2009. Bond characteristics of ASTM
A1035 steel reinforcing bars. ACI Structural Journal, 106(4): 530–539.
Seliem, H.M., Lucier, G., Rizkalla, S.H., and Zia, P. 2008. Behavior of concrete bridge decks
reinforced with high-performance steel. ACI Structural Journal, 105(1): 78-86.
Setunge, S. 1993. Structural Properties of Very High-Strength Concrete. Ph.D. Thesis, Monash
University, Australia.
Setzler, E.J., and Sezen, H. 2008. Model for the lateral behavior of reinforced concrete columns
including shear deformations. Earthquake Spectra, 24(2): 493-511.
Shahrooz, B.M., Miller, R.A., Harris, K.A., and Russell, H.G. 2011. Design of concrete structures
using high-strength steel reinforcement. National Cooperative Highway Research Program
(NCHRP) Report 679, Transportation Research Board of the National Academies,
Washington, D.C.
Shahrooz, B.M., Reis, J., Wells, E., Miller, R.A., Harries, K., and Russell, H.G. 2010. Flexural
behavior and design with high-strength bars and those without well-defined yield point. In
Transportation Research Record: Journal of the Transportation Research Board.
Transportation Research Board of the National Academies, Washington, DC, 10: 103-111.
Sheikh, M. N., and Légeron, F. 2014. Performance based seismic assessment of bridges designed
according to Canadian Highway Bridge Design Code. Canadian Journal of Civil
Engineering, 41: 777–787.
132
Shinozuka, M., Feng, M.Q., Kim, H.K., and Kim, S.H. 2000. Nonlinear static procedure for
fragility curve development. ASCE Journal of Engineering Mechanics, 126: 1287– 1296.
Shinozuka M, Feng M.Q, Kim H, Uzawa, T., and Ueda, T. 2003. Statistical analysis of fragility
curves. MCEER Report-03-0002.
Shiro, M., and Hitoshi, S. 1996. Development of high strength mild steel deformed bars for high
performance reinforced concrete structural members. In Proceedings of the 11th World
Conference on Earthquake Engineering, 23-18 June, Acapulco, Mexico, Paper no. 1742.
Siqueiraa, G., Sandab, A., Paultreb, P., and Padgettc, J. 2014. Fragility curves for isolated bridges
in eastern Canada using experimental results. Engineering Structure, 74: 311–324.
Somerville, P.G. 2002. Characterizing near fault ground motion for the design and evaluation of
bridges. In Proceedings of the 3rd National Conference and Workshop on Bridges and
Highways, April 28-May 1, Portland, Oregon.
Sperry, J., Al-Yasso, S, Searle, N., DeRubies, M.,Darwin, D., O’Reilly, M., Matamoros, A.,
Feldman, L., Lepage, A., Lequesne, R., and Ajam, A. 2015. Anchorage of high-strength
reinforcing bars with standard hooks. SM Report No. 111. The University of Kansas Center
For Research, Inc., Lawrence, Kansas
Stephan, B., Restrepo, J., and Seible, F. 2003. Seismic Behavior of Bridge Columns Built
Incorporating MMFX Steel. UCSD Report SSRP- 2003/09.
Suarez, V., and Kowalsky, M. 2006. Implementation of displacement based design for highway
bridges. In Proceedings of the 5th National Seismic Conference on Bridges & Highways,
San Francisco, Canada.
Sumpter, M.S. 2007. Behavior of high performance steel as shear reinforcement for concrete
beams. ACI Structural Journal, 106(2): 171–177.
Tadros, M.K. 2017. High-strength steel in bridge applications. Concrete Bridge Technology.
ASPIRE.
Tavares, D. H., Padgett, J. E., and Paultre, P. 2012. Fragility curves of typical as-built highway
bridges in eastern Canada. Engineering Structures, 40: 107-118.
Tureyen, A.K., and Frosch, R.J., 2003, Concrete shear strength: Another perspective. ACI
Structural Journal, 100(5): 609-615.

133
Vamvatsikos D, and Cornell CA. 2002. Incremental dynamic analysis. Earthquake Engineering
Structural Dynamic, 31(3): 491–514.
Vijay, P.V., GangaRao, H.V.S., and Prachasaree, W. 2002. Bending Behavior of Concrete Beams
Reinforced with MMFX Steel Bars, West Virginia University.
Wagstaffe, J. 2016 Oct 11. The 'Big One' near Vancouver you may not know about. Retrieved
from http://www.cbc.ca
Wang, Z. 2006. Understanding seismic hazard and risk assessments: An example in the New
Madrid Seismic Zone of the central United States. In Proceedings of the 8th National
Conference on Earthquake Engineering. San Francisco, California.
Xu, S.Y., and Zhang, J. 2011. Hysteretic shear–flexure interaction model of reinforced concrete
columns for seismic response assessment of bridges. Earthquake Engineering and
Structural Dynamics, 40(3): 315–337.
Yotakhong, P. 2003. Flexural performance of MMFX reinforcing rebars in concrete structures.
M.S. Thesis, North Carolina State University, Raleigh, North Carolina.
Yun, S., Hamburger, RO., Cornell, C.A., and Foutch, DA. 2002. Seismic performance evaluation
for steel moment frames. Journal of Structural Engineering, 128(4): 534–45.
Zelaschi, C., Monteiro, R., and Pinho, R. 2015. Improved fragility functions for RC bridge
populations. In Proceedings of the 5th ECCOMAS Thematic Conference on Computational
Methods in Structural Dynamics and Earthquake Engineering, 25–27 May, Crete Island,
Greece.
Zeno, G.A. 2009. Use of High Strength Steel Reinforcement in Shear Friction Applications. MSCE
thesis, University of Pittsburgh, Pennsylvania.
Zhang, Q. 2015. Performance based design and evaluation of reinforced concrete bridges. M.A.Sc.
Thesis, the University of British Columbia, Kelowna, Canada.
Zhang, Q., Alam, M.S., Khan, S. and Jiang, J. 2016. Seismic performance comparison between
force-based and performance-based design as per Canadian Highway Bridge Design Code
(CHBDC) 2014. Canadian Journal of Civil Engineering, 43: 741–748.
Zhang, J., and Huo, Y. 2009. Evaluating effectiveness and optimum design of isolation devices for
highway bridges using the fragility function method. Engineering Structures, 31(8): 1648-
1660.

134
Ziehl, P.H., Cloyd, J.E., and Kreger, M.E. 1998. Evaluation of Minimum Longitudinal
Reinforcement Requirements for Reinforced Concrete Columns, Research Report 1473-S,
Center for Transportation Research, University of Texas, Austin, Texas.
Ziehl, P.H., Cloyd, J.E., and Kreger, M.E. 2004. Investigation of minimum longitudinal
reinforcement requirements for concrete columns using present-day construction materials.
ACI Structural Journal, 101(2): 165-175.

135
APPENDICES
Appendix A: Longitudinal Reinforcement Design for FBD
The following column-interaction diagram (Figure A.1) is used to determine the
longitudinal reinforcement percentage for the FBD method of the bridge pier.
Figure A.1 Column interaction diagram for FBD
0
5000
10000
15000
20000
25000
30000
35000
40000
45000
50000
0 1000 2000 3000 4000 5000 6000 7000
Axia
l lo
ad
(kN
)
Moment (kN-m)
f'c=35, fy= 415, clear cover=50mm
ρ=1%
ρ=2%
ρ=3%
ρ=4%
ρ=5%
ρ=6%

136
FBD calculation details for a lifeline single bridge pier following CHBDC 2010:
𝐷𝑖𝑎𝑚𝑒𝑡𝑒𝑟 𝑜𝑓 𝑡ℎ𝑒 𝑝𝑖𝑒𝑟, 𝑑 = 915𝑚𝑚
𝐶𝑙𝑒𝑎𝑟 𝑐𝑜𝑣𝑒𝑟 = 50𝑚𝑚
𝐻𝑒𝑖𝑔ℎ𝑡 𝑜𝑓 𝑡ℎ𝑒 𝑝𝑖𝑒𝑟, 𝐿 = 5.25𝑚
𝐶𝑜𝑛𝑐𝑟𝑒𝑡𝑒 𝑠𝑡𝑟𝑒𝑛𝑔𝑡ℎ = 35𝑀𝑃𝑎
𝐿𝑜𝑛𝑔𝑖𝑡𝑢𝑑𝑖𝑛𝑎𝑙 𝑠𝑡𝑒𝑒𝑙 𝑟𝑒𝑖𝑛𝑓𝑟𝑜𝑐𝑒𝑚𝑒𝑛𝑡 𝑠𝑡𝑟𝑒𝑛𝑔𝑡ℎ = 415𝑀𝑃𝑎
𝐿𝑢𝑚𝑝𝑒𝑑 𝑚𝑎𝑠𝑠, 𝑚 = 2300𝑘𝑁 = 234455𝑘𝑔
𝐴𝑥𝑖𝑎𝑙 𝑙𝑜𝑎𝑑 𝑟𝑎𝑡𝑖𝑜 = 10% 𝑜𝑓 𝑔𝑟𝑜𝑠𝑠 𝑐𝑎𝑝𝑎𝑐𝑖𝑡𝑦; 𝑊 = 10%𝑥657556𝑥35 = 2300𝑘𝑁
𝑀𝑜𝑑𝑢𝑙𝑢𝑠 𝑜𝑓 𝑒𝑙𝑎𝑠𝑡𝑖𝑐𝑖𝑡𝑦 𝑜𝑓 𝑐𝑜𝑛𝑐𝑟𝑒𝑡𝑒 = 26273.08𝑀𝑃𝑎
𝐶𝑟𝑜𝑠𝑠 − 𝑠𝑒𝑐𝑡𝑖𝑜𝑛𝑎𝑙 𝑎𝑟𝑒 𝑜𝑓 𝑡ℎ𝑒 𝑝𝑖𝑒𝑟 = 657556.5𝑚𝑚2
𝐺𝑟𝑜𝑠𝑠 𝑚𝑜𝑚𝑒𝑛𝑡 𝑜𝑓 𝑖𝑛𝑒𝑟𝑡𝑖𝑎 𝑜𝑓 𝑝𝑖𝑒𝑟 𝑠𝑒𝑐𝑡𝑖𝑜𝑛, 𝐼𝑔 =𝜋𝑑4
64= 3.44𝑥1010𝑚𝑚4
𝑍𝑜𝑛𝑎𝑙 𝑎𝑐𝑐𝑒𝑙𝑒𝑟𝑎𝑡𝑖𝑜𝑛 𝑟𝑎𝑡𝑖𝑜 𝑓𝑜𝑟 𝑉𝑎𝑛𝑐𝑜𝑢𝑣𝑒𝑟, 𝐴 = 0.2
𝐼𝑚𝑝𝑜𝑟𝑡𝑎𝑛𝑐𝑒 𝑓𝑎𝑐𝑡𝑜𝑟 𝑓𝑜𝑟 𝑎 𝑙𝑖𝑓𝑒𝑙𝑖𝑛𝑒 𝑏𝑟𝑖𝑑𝑔𝑒, 𝐼 = 3
𝑆𝑖𝑡𝑒 𝑐𝑜 − 𝑒𝑓𝑓𝑖𝑐𝑖𝑒𝑛𝑡 𝑓𝑜𝑟 𝑠𝑜𝑖𝑙 𝑝𝑟𝑜𝑓𝑖𝑙𝑒 𝐼𝐼𝐼, 𝑆 = 1.5
𝑅𝑒𝑠𝑝𝑜𝑛𝑠𝑒 𝑚𝑜𝑑𝑖𝑓𝑖𝑐𝑎𝑡𝑖𝑜𝑛 𝑓𝑎𝑐𝑡𝑜𝑟 𝑓𝑜𝑟 𝑠𝑖𝑛𝑔𝑙𝑒 𝑝𝑖𝑒𝑟, 𝑅 = 3
𝐴𝑠𝑠𝑢𝑚𝑖𝑛𝑔 4% 𝑙𝑜𝑛𝑔𝑖𝑡𝑢𝑑𝑖𝑛𝑎𝑙 𝑟𝑒𝑖𝑛𝑓𝑜𝑟𝑐𝑒𝑚𝑒𝑛𝑡, 𝑒𝑙𝑎𝑠𝑡𝑖𝑐 𝑠𝑡𝑖𝑓𝑓𝑛𝑒𝑠𝑠 𝑟𝑎𝑡𝑖𝑜 𝑓𝑟𝑜𝑚 𝐹𝑖𝑔. 5.3,
𝐼𝑒𝑓𝑓
𝐼𝑔= 0.76 ; 𝐼𝑒𝑓𝑓 = 0.76𝑥𝐼𝑔 = 2.61𝑥1010𝑚𝑚4
𝑆𝑡𝑖𝑓𝑓𝑛𝑒𝑠𝑠 𝑜𝑓 𝑡ℎ𝑒 𝑝𝑖𝑒𝑟, 𝑘 =3𝐸𝐼𝑒𝑓𝑓
𝐿3 = 14243.71𝑁
𝑚𝑚
𝑇𝑖𝑚𝑒 𝑝𝑒𝑟𝑖𝑜𝑑, 𝑇 = 2𝜋√𝑚
𝑘= 0.806𝑠𝑒𝑐
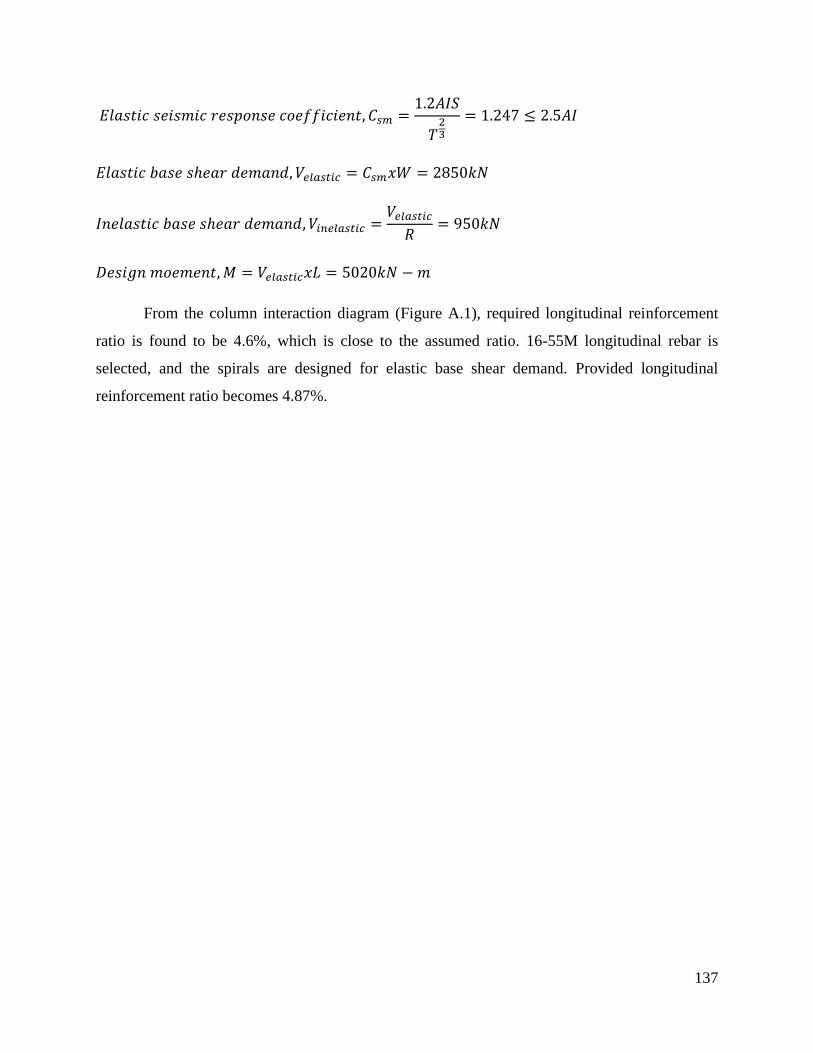
137
𝐸𝑙𝑎𝑠𝑡𝑖𝑐 𝑠𝑒𝑖𝑠𝑚𝑖𝑐 𝑟𝑒𝑠𝑝𝑜𝑛𝑠𝑒 𝑐𝑜𝑒𝑓𝑓𝑖𝑐𝑖𝑒𝑛𝑡, 𝐶𝑠𝑚 =1.2𝐴𝐼𝑆
𝑇23
= 1.247 ≤ 2.5𝐴𝐼
𝐸𝑙𝑎𝑠𝑡𝑖𝑐 𝑏𝑎𝑠𝑒 𝑠ℎ𝑒𝑎𝑟 𝑑𝑒𝑚𝑎𝑛𝑑, 𝑉𝑒𝑙𝑎𝑠𝑡𝑖𝑐 = 𝐶𝑠𝑚𝑥𝑊 = 2850𝑘𝑁
𝐼𝑛𝑒𝑙𝑎𝑠𝑡𝑖𝑐 𝑏𝑎𝑠𝑒 𝑠ℎ𝑒𝑎𝑟 𝑑𝑒𝑚𝑎𝑛𝑑, 𝑉𝑖𝑛𝑒𝑙𝑎𝑠𝑡𝑖𝑐 =𝑉𝑒𝑙𝑎𝑠𝑡𝑖𝑐
𝑅= 950𝑘𝑁
𝐷𝑒𝑠𝑖𝑔𝑛 𝑚𝑜𝑒𝑚𝑒𝑛𝑡, 𝑀 = 𝑉𝑒𝑙𝑎𝑠𝑡𝑖𝑐𝑥𝐿 = 5020𝑘𝑁 − 𝑚
From the column interaction diagram (Figure A.1), required longitudinal reinforcement
ratio is found to be 4.6%, which is close to the assumed ratio. 16-55M longitudinal rebar is
selected, and the spirals are designed for elastic base shear demand. Provided longitudinal
reinforcement ratio becomes 4.87%.

138
Appendix B: Effect of Transverse Reinforcement Strength on Design and Seismic
Performance
Figure B.2 Static pushover analysis curves
Figure B.3 IDA curve for maximum drift
Figure B.4 FEMA limit states
0
500
1000
1500
2000
2500
3000
0 100 200 300
Ba
se
sh
ea
r (k
N)
Displacement (mm)
(a) P70/830/T550
εc=0.004
εy=0.00415
εs=0.015
2%in50yrs
5%in50yrs
10%in50yrs
0
500
1000
1500
2000
2500
3000
0 100 200 300
Ba
se
sh
ea
r (k
N)
Displacement (mm)
(b) P70/830/T830
εc=0.004
εy=0.00415
εs=0.015
2%in50yrs
5%in50yrs
10%in50yrs
0
0.5
1
1.5
2
0 2 4 6
PG
A (
g)
Maximum drift %
(a) P70/830/T550
Median16th Fractile84th Fractile
0
0.5
1
1.5
2
0 2 4 6
PG
A (
g)
Maximum drift %
(b) P70/830/T830
Median16th Fractile84th Fractile
0
500
1000
1500
2000
2500
3000
0 100 200 300
Ba
se
sh
ea
r (k
N)
Displacement (mm)
(a) P70/830/T550
cracking
yielding
spalling
crushing
0
500
1000
1500
2000
2500
3000
0 100 200 300
Ba
se
sh
ea
r (k
N)
Displacement (mm)
(b) P70/830/T830
cracking
yielding
spalling
crushing

139
Table B.1 LSs of bridge pier following FEMA for Drift%
Damage State → Slight Moderate Extensive Collapse
P70/830/T415 0.14% 0.83% 1.40% 2.10%
P70/830/T550 0.13% 0.83% 1.38% 2.25%
P70/830/T830 0.13% 0.83% 1.39% 2.29%
Figure B.5 CHBDC limit states
Table B.2 LSs of bridge pier following CHBDC for Drift%
Damage State → Minimal Repairable Extensive
P70/830/T415 0.83% 1.58% 2.10%
P70/830/T550 0.83% 1.56% 2.25%
P70/830/T830 0.83% 1.58% 2.29%
Figure B.6 Probabilistic seismic demand models
0
500
1000
1500
2000
2500
3000
0 100 200 300
Ba
se
sh
ea
r (k
N)
Displacement (mm)
(a) P70/830/T550
minimal
repairable
extensive
0
500
1000
1500
2000
2500
3000
0 100 200 300
Ba
se
sh
ea
r (k
N)
Displacement (mm)
(b) P70/830/T830
minimal
repairable
extensive
y = 1.1712x + 0.8947R² = 0.842
-2
-1
0
1
2
3
-3 -2 -1 0 1 2
ln (
Dri
ft %
)
ln (PGA)
(a) P70/830/T550
y = 1.1742x + 0.9003R² = 0.8433
-2
-1
0
1
2
3
-3 -2 -1 0 1 2
ln (
Dri
ft %
)
ln (PGA)
(b) P70/830/T830