Critical Issues for Formaldehyde Cancer Risk Assessment James Swenberg, D.V.M., Ph.D., DACVP...
34
Critical Issues for Formaldehyde Cancer Risk Assessment James Swenberg, D.V.M., Ph.D., DACVP University of North Carolina O H H
-
Upload
amelia-chandler -
Category
Documents
-
view
215 -
download
1
Transcript of Critical Issues for Formaldehyde Cancer Risk Assessment James Swenberg, D.V.M., Ph.D., DACVP...
Critical Issues for Formaldehyde Cancer Risk Assessment
James Swenberg, D.V.M., Ph.D., DACVP
University of North CarolinaChapel Hill, NC
O
H H

Formaldehyde is One of the Oldest Chemicals in the World
• One-carbon pool• Methanol metabolism• Amino Acid metabolism• Lipid Peroxidation• P450 dependent demethylation (O-, N-, S-methyl)
Sources of Endogenous
Formaldehyde
Formaldehyde was Part of the Origin of Life

Carcinogenesis Bioassays• CIIT/Battelle studies in rats and mice
– 12 month sacrifice/interim report – 18 month data published in Cancer
Research (Swenberg ,et al 1980)– Final report and Cancer Research
paper on the study (Kerns, et al. 1983)• CIIT expanded the exposure range and
mechanistic designs in a second bioassay published in Cancer Research (Monticello, et al, 1996)
• Subsequent cancer bioassays– Inhalation studies– Oral studies
0
10
20
30
40
50
60
70
0 2 4 6 8 10 12 14 16
HCHO Concentration (ppm)
Tu
mor
In
cid
ence
(%
)
0
2
4
6
8
10
12
14
Cel
l Pro
lifer
atio
n (m
ean
unit
leng
th la
belin
g in
dex)
at
Nas
al L
evel
II
(fol
d in
crea
se o
ver
cont
rol)
Tumor Incidence 24-month Study(Kerns, 1983)
Tumor Incidence 24-month Study(Monticello, 1996)
Cell Proliferation Study 6-month(Monticello, 1990)
Cell Proliferation Study 12-month(Monticello, 1990)
Cell Proliferation Study 18-month(Monticello, 1990)
Tumor Incidence and Cell Proliferation in Rats Exposed to Formaldehyde
Early Mode of Action Studies
• Cytotoxicity and cell proliferation studies– Cell proliferation is a key factor in converting DNA
damage to mutations
• Minute volume studies comparing rats and mice
• DNA-protein cross-link quantitation– Careful assays based on physical chemistry were
conducted in rats and primates
– Demonstrated nonlinear exposure relationships
– Did not find any accumulation in multiple day exposures

Formaldehyde is very reactive with proteins and DNA, leading to diverse protein adducts and DNA damage.
ProteinN CH2
Protein CH2
CH2OH
H2C
O
H H
glutathione
S-hydroxymethyl-glutathione
ADH3
S-formylglutathione
S-formylglutathionehydrolase
formate
CO2+H2O
glutathione
endogenous sources
exogenous sources
ALDH1A1ALDH2
one carbon pool
adduct formation
Fate and metabolism of formaldehyde
Adapted for IARC monograph 88
Recent Molecular Mode of Action Studies

Formaldehyde Specific DNA Adducts
13CD2O Exposure
Tissue Collection
DNA Isolation
Reduction with NaCNBH3
Digestion and HPLC
Fractionation
Nano-LC-MS/MS
Endogenous282.2 → 166.1 m/z
RT: 8.04 - 12.00 SM: 9G
9 10 11 12Time (min)
0
500000
1000000
1500000
2000000
2500000
3000000
3500000
4000000
4500000
5000000
Inte
nsity
0
50000
100000
150000
200000
250000
300000
Inte
nsity
0
1000000
2000000
3000000
4000000
5000000
6000000
7000000
8000000
9000000
Inte
nsity
RT: 10.56
RT: 10.51
RT: 10.53
NL: 9.96E6TIC F: + p NSI SRM ms2 282.200 [165.600-166.600] MS ICIS Half_life_Me_dG_09302010_05
NL: 3.40E5TIC F: + p NSI SRM ms2 285.200 [168.600-169.600] MS ICIS Half_life_Me_dG_09302010_05
NL: 5.32E6TIC F: + p NSI SRM ms2 297.200 [175.600-176.600] MS ICIS Half_life_Me_dG_09302010_05
NH
N
N
O
NH2N
O
OH
HO
NH
N
N
O
NH
N
O
OH
HO
CH3
NH
N
N
O
NH
N
O
OH
HO
CH2OH
NaCNBH3
HH
O
NH
N
N
O
NH
N
O
OH
HO
13CD2H
NH
N
N
O
NH
N
O
OH
HO
13CD2OH
NaCNBH3D13C
D
O
Exogenous285.2 → 169.1 m/z
RT: 8.04 - 12.00 SM: 9G
9 10 11 12Time (min)
0
500000
1000000
1500000
2000000
2500000
3000000
3500000
4000000
4500000
5000000
Inte
nsity
0
50000
100000
150000
200000
250000
300000
Inte
nsity
0
1000000
2000000
3000000
4000000
5000000
6000000
7000000
8000000
9000000
Inte
nsity
RT: 10.56
RT: 10.51
RT: 10.53
NL: 9.96E6TIC F: + p NSI SRM ms2 282.200 [165.600-166.600] MS ICIS Half_life_Me_dG_09302010_05
NL: 3.40E5TIC F: + p NSI SRM ms2 285.200 [168.600-169.600] MS ICIS Half_life_Me_dG_09302010_05
NL: 5.32E6TIC F: + p NSI SRM ms2 297.200 [175.600-176.600] MS ICIS Half_life_Me_dG_09302010_05
Internal Standard297.2 → 176.1 m/z
RT: 8.04 - 12.00 SM: 9G
9 10 11 12Time (min)
0
500000
1000000
1500000
2000000
2500000
3000000
3500000
4000000
4500000
5000000
Inte
nsity
0
50000
100000
150000
200000
250000
300000
Inte
nsity
0
1000000
2000000
3000000
4000000
5000000
6000000
7000000
8000000
9000000
Inte
nsity
RT: 10.56
RT: 10.51
RT: 10.53
NL: 9.96E6TIC F: + p NSI SRM ms2 282.200 [165.600-166.600] MS ICIS Half_life_Me_dG_09302010_05
NL: 3.40E5TIC F: + p NSI SRM ms2 285.200 [168.600-169.600] MS ICIS Half_life_Me_dG_09302010_05
NL: 5.32E6TIC F: + p NSI SRM ms2 297.200 [175.600-176.600] MS ICIS Half_life_Me_dG_09302010_05

Formaldehyde-induced N2-hydroxymethyl-dG adducts in rats exposed to 10 ppm Formaldehyde for 1 or 5 days
Exposure Period
TissuesExogenous
adducts/107 dGEndogenous
adducts/107 dG
1 dayNoseLungLiver
1.28 ± 0.49ndnd
2.63 ± 0.732.39 ± 0.162.66 ± 0.53
SpleenBone Marrow
ThymusBlood
ndndndnd
2.35 ± 0.311.05 ± 0.142.19 ± 0.361.28 ± 0.38
5 dayNoseLungLiver
2.43 ± 0.78ndnd
2.84 ± 1.132.61 ± 0.353.24 ± 0.42
SpleenBone Marrow
ThymusBlood
ndndndnd
2.35 ± 0.591.17 ± 0.351.99 ± 0.301.10 ± 0.28

RT: 8.00 - 12.00 SM: 9G
8 9 10 11 12Time (min)
0
500000
1000000
1500000
2000000
2500000
30000000
500000
1000000
1500000
2000000
2500000
3000000
Inte
nsi
ty
0
500000
1000000
1500000
2000000
2500000
3000000
RT: 10.30
RT: 10.30
RT: 10.31
NL: 3.00E6TIC F: + p NSI SRM ms2 282.200 [165.600-166.600] MS ICIS Me_dG_09272010_05
NL: 3.00E6TIC F: + p NSI SRM ms2 285.200 [168.600-169.600] MS ICIS Me_dG_09272010_05
NL: 3.00E6TIC F: + p NSI SRM ms2 297.200 [175.600-176.600] MS ICIS Me_dG_09272010_05
Endogenous282.2 → 166.1
m/z
Exogenous285.2 → 169.1 m/z
Internal Standard297.2 → 176.1 m/z
4.9 adducts/107 dG
9.0 adducts/107 dG
20 fmol
Exposure (ppm)
Exogenous adducts/107
dG
Endogenous adducts/107
dGn
0.7±0.2 0.039±0.019 3.62±1.33 3*
2.0±0.1 0.19±0.08 6.09±3.03 4**
5.8±0.5 1.04±0.24 5.51±1.06 4
9.1±2.2 2.03±0.43 3.41±0.46 5
15.2±2.1 11.15±3.01 4.24±0.92 5
*4-6 rats combined** 2 rats combined
Dosimetry of N2-hydroxymethyl-dG Adducts in Nasal Epithelium of Rats
15 ppm Rat NE

Ratio of Exogenous to Endogenous Adducts
0
0.5
1
1.5
2
2.5
3
0 5 10 15 20Formaldehyde Exposure Dose(ppm)
Rat
io o
f Exo
gen
ou
s V
ersu
s E
nd
og
eno
us
Ad
du
cts
NH
N
N
O
NH
N
O
OH
HO
CH2OH
NH
N
N
O
NH
N
O
OH
HO
13CD2OH
Endogenous
Exogenous

Non-Human Primate Study
• 13CD2O Exposure for 2 days (6 hours/day) at 2 or 6 ppm (n=4)
• Cynomolgus Macaque
• Tissues (to date)
– Nasal turbinates
– Femoral Bone Marrow
– Brain
– Lung

Adduct Numbers in Primate Nasal Maxilloturinbates
Exposure concentrati
on
Exogenous adducts/107
dG
Endogenous adducts/107
dG
1.9 ppm 0.25 ± 0.04 2.49 ± 0.39
6.1 ppm 0.41 ± 0.05 2.05 ± 0.53
n = 3 or 4

Primate Femoral Bone Marrow Endogenous and Exogenous Adducts
1.9 ppm 13CD2O 6.1 ppm 13CD2O
312 µg DNA
RT: 8.00 - 12.00 SM: 7G
8 9 10 11 12Time (min)
0
200000
400000
600000
800000
1000000
1200000
1400000
1600000
1800000
Inte
nsity
0
10000
20000
30000
40000
50000
Inte
nsity
0
1000000
2000000
3000000
4000000
5000000
6000000
Inte
nsity
RT: 10.62
RT: 10.62
NL: 6.48E6TIC F: + p NSI SRM ms2 282.200 [165.600-166.600] MS ICIS Monkey_Me_dG_092910_10
NL: 5.76E4TIC F: + p NSI SRM ms2 285.200 [168.600-169.600] MS Monkey_Me_dG_092910_10
NL: 1.83E6TIC F: + p NSI SRM ms2 297.200 [175.600-176.600] MS ICIS Monkey_Me_dG_092910_10
7E6
6E4
2E6
Endogenous282.2 → 166.1
m/z
Exogenous285.2 → 169.1 m/z
Internal Standard297.2 → 176.1 m/z
178 µg DNA
No Exogenous Adducts
Detected with 5-10 fold >DNA
RT: 8.00 - 12.00 SM: 7G
8 9 10 11 12Time (min)
0
500000
1000000
1500000
2000000
2500000
3000000
Inte
nsity
0
5000
10000
15000
20000
25000
30000
35000
40000
Inte
nsity
0
5000000
10000000
15000000
20000000
Inte
nsity
RT: 10.52
RT: 10.52
NL: 2.30E7TIC F: + p NSI SRM ms2 282.200 [165.600-166.600] MS ICIS Monkey_Me_dG_092910_11
NL: 4.18E4TIC F: + p NSI SRM ms2 285.200 [168.600-169.600] MS Monkey_Me_dG_092910_11
NL: 3.01E6TIC F: + p NSI SRM ms2 297.200 [175.600-176.600] MS ICIS Monkey_Me_dG_092910_11
2E7
4E4
3E6
Endogenous282.2 → 166.1 m/z
Exogenous285.2 → 169.1 m/z
Internal Standard297.2 → 176.1 m/z
Note: We used ~20-30 ug for
nasal tissue

Adduct Numbers in Primate Bone Marrow
Exposure concentrati
on
Exogenous adducts/107
dG
Endogenous adducts/107
dG
1.9 ppm nd 17.48 ± 2.61
6.1 ppm nd 12.45 ± 3.63
n = 4
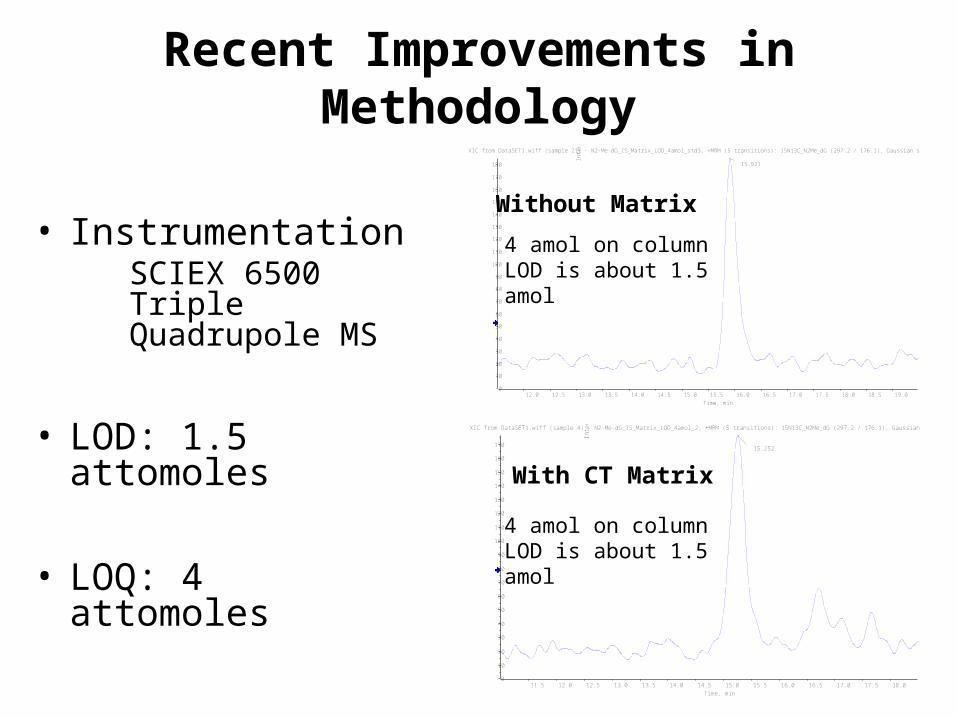
Recent Improvements in Methodology
• InstrumentationSCIEX 6500 Triple Quadrupole MS
• LOD: 1.5 attomoles
• LOQ: 4 attomoles
11.5 12.0 12.5 13.0 13.5 14.0 14.5 15.0 15.5 16.0 16.5 17.0 17.5 18.0
Time, min
0
10
20
30
40
50
60
70
80
90
100
110
120
130
140
150
160
170
Inte
nsi
ty
15.252
XIC from DataSET1.wiff (sample 4) - N2-Me-dG_IS_Matrix_LOD_4amol_2, +MRM (5 transitions): 15N13C_N2Me_dG (297.2 / 176.1), Gaussian smoothed
12.0 12.5 13.0 13.5 14.0 14.5 15.0 15.5 16.0 16.5 17.0 17.5 18.0 18.5 19.0
Time, min
0
10
20
30
40
50
60
70
80
90
100
110
120
130
140
150
160
170
180
Inte
nsi
ty
15.921
XIC from DataSET1.wiff (sample 21) - N2-Me-dG_IS_Matrix_LOD_4amol_std3, +MRM (5 transitions): 15N13C_N2Me_dG (297.2 / 176.1), Gaussian smoothed
Without Matrix
With CT Matrix
4 amol on columnLOD is about 1.5 amol
4 amol on columnLOD is about 1.5 amol

Time PointsExogenous
adducts/107 dGEndogenous
adducts/107 dGn
7 day14 day
0.35 ± 0.170.84 ± 0.17
2.51 ± 0.633.09 ± 0.98
55
21 day28 day
0.95 ± 0.111.07 ± 0.16
3.34 ± 1.062.82 ± 0.76
55
28 day + 6 hr28 day + 24 hr
0.85 ± 0.380.83 ± 0.61
2.61 ± 0.552.87 ± 0.65
55
28 day + 72 hr28 day + 168 hr
0.64 ± 0.140.76 ± 0.19
2.95 ± 0.712.69 ± 0.45
56
N2-Methyl-dG Adducts in Rat Nasal Epithelium Following 2 ppm Exposure for up to 28 days (6 hr/day)

Time to Steady-State for [13CD2]-HO-CH2-dG Adducts in Nasal Epithelium

N2-Methyl-dG Adduct Numbers in Rat Bone Marrow Following 2 ppm Exposure for up to 28 days (6 hr/day)
Time PointsExogenous
adducts/107 dGEndogenous
adducts/107 dGn
7 day14 day
ndNd
3.37 ± 1.562.72 ± 1.36
66
21 day28 day
ndndc
2.44 ± 0.964.06 ± 3.37
65
28 day + 6 hr28 day + 24 hr
ndnd
2.41 ± 1.144.67 ± 1.84
65
28 day + 72 hr28 day + 168 hr
ndnd
5.55 ± 0.762.78 ± 1.94
64
C One bone marrow DNA had 0.34 /107 dG exogenous N2-HOMe-dG adducts in one bone marrow sample.

N2-Methyl-dG Adduct Numbers in Rat WBC Following 2 ppm Exposure for up to 28 days (6 hr/day)
Time PointsExogenous
adducts/107 dGEndogenous
adducts/107 dGn
7 day14 day
ndnd
4.91 ± 3.713.01 ± 0.54
44
21 day28 day
ndnd
3.53 ± 0.723.53 ± 0.72
44

Studies on Potential Artifact for Endogenous N2-HOMe-dG Adducts
• The EPA asked us to rule out potential artifacts in our DNA isolation, reduction and hydrolysis. The amine group in Tris somehow interferes with DNA or nucleosides, and then forms N2-HOMe-dG and artificially increases the detected amounts of endogenous DNA adducts.
• To address these issues, we compared 3 different batches of Tris HCl buffer (BioXtra, ⦁BioUltra, BioPerformance) at the same concentration. Use of BioPerformance resulted in 10-fold greater numbers of N2-HOMe-dG, but sodium phosphate buffer (BioXtra) had a peak area that was 100-fold lower than Tris HCl buffer (BioPerformance). This was ⦁equal to approximately 35 amol N2-Me-dG on column or 1.5 adducts/109 dG in 50 µg DNA, which was more than 180-fold lower than the average endogenous amounts of N2-Me-dG in all tissues (2.71 ± 1.23 adducts/107 dG, n=205).
• The potential interferences present when sodium phosphate buffer was used were minimal, with less than 0.56% of the average endogenous amounts of N2-Me-dG in all tissues.
• The average endogenous amount of N2-HOMe-dG in all exposed tissues (n=397) was 2.82 ± 1.36 adducts/107 dG; and the average endogenous amount of N2-HOMe-dG in all exposed tissues in the current 28 day study (n=158) was 2.78 ± 1.30 adducts/107 dG; while the average endogenous amount of N2-HOMe-dG in all control tissues (n=47) was 2.47 ± 0.92 adducts/107 dG. These are not significantly different. Thus, it is clear that formaldehyde exposure does not increase endogenous N2-HOMe-dG.

Spontaneous Hydrolysis of Formaldehyde DPCs Forms HO-CH2-dG Adducts

New Research Studies• Epigenetic effects of inhaled formaldeyhde.
– EHP paper for epigenetic studies in monkey maxilloturbinate.– 1 and 4 week exposures to 2 ppm formaldehyde and 1 week post exposure show
changes in nasal tissue and WBC, but no changes in bone marrow. Different MiRNAs in different tissues and at different times.
• Development of hemoglobin adduct methods and data.– Ospina et al method was set up.
• Exogenous adducts not found in exposed rat blood• Endogenous adducts are found
• Endogenous vs Exogenous N6-formyllysine formation and hydrolysis.– Collaboration with MIT– Exogenous protein adducts only found in nasal epithelium and trachea
• Development of DNA-Protein Cross-link analysis– Spontaneous hydrolysis generates HO-CH2-dG adducts
• Rat and primate comparisons of DPC and adducts vs IRIS human estimates.• Additional rat and primate studies will examine ROS induced DNA adducts,
formation of endogenous and exogenous DPCs, cytokine effects on epigenetic alterations, globin adducts and N6-formyllysine.

Nonhuman Primate Project
• Cynomolgus macaques were exposed to 0, 2, or 6 ppm 13CD2 formaldehyde for 6 h/day for 2 days
• RNA samples were collected from the maxilloturbinate and hybridized to miRNA microarrays to compare genome-wide miRNA expression profiles of formaldehyde-exposed versus unexposed samples.
• 13 MicroRNAs had altered expression.
• Inhibition of apoptosis genes was predicted and demonstrated (Rager et al., 2013, EHP).
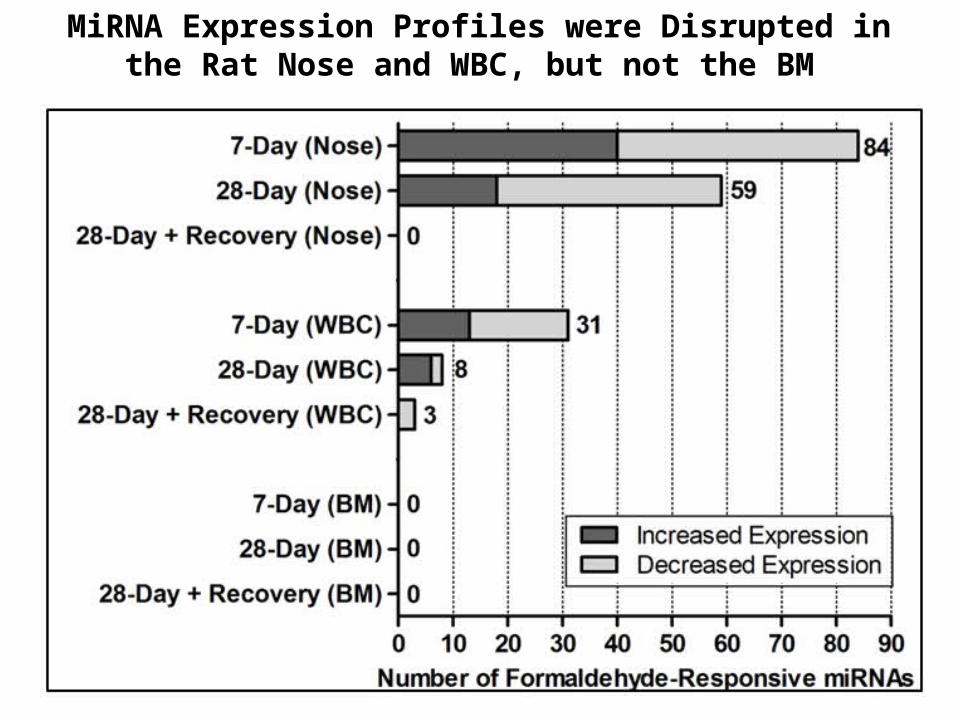
MiRNA Expression Profiles were Disrupted in the Rat Nose and WBC, but not the BM

3
5
7
50 55 60 65
1
2
3
3
5
7
50 55 60 65
Retention time, min Retention time, min
Cou
nts
2x10
0.8
1
Endogenous
Cou
nts Internal Standard
1
2
3 Exogenous
Cou
nts
0.6
1
2x10
0.8
0.6
Control 10 ppm Formaldehyde
Endogenous
Internal Standard
ExogenousC
ount
sC
ount
sC
ount
s
+NH2
(CH2)4CH
COO-H3N+
13C2H2OHNH2
(CH2)4CH
COO-H3N+
13CO
2H2H
++NH2
(CH2)4
CHCOO-H3N+
13C2H
O
O
Inhalation Exposure of Rats to [13CD2]-Formaldehyde leads to Formation of Labeled N6-formyllysine in Nasal Tissue

N6-Formylation per 104 Lys
Tissue Nasal Epithelium Lung Liver Bone Marrow
Adduct type Endo Exog Endo Exog Endo Exog Endo Exog
Total Protein 2 ± 0.1 0.9 ± 0.1 3 ± 0.4 ND 3 ± 0.5 ND 4 ± 0.1 ND
Cytoplasmic 2 ± 0.4 0.8 ± 0.1 4 ± 0.6 ND 4 ± 0.1 ND 3 ± 0.3 ND
Membrane 2 ± 0.4 0.7 ± 0.2 3 ± 0.4 ND 3 ± 0.2 ND 2 ± 0.3 ND
Soluble nuclear 2 ± 1.0 0.5 ± 0.2 4 ± 0.3 ND 4 ± 0.7 ND 2 ± 0.2 ND
Chromatin bound 2 ± 0.4 0.2 ± 0.01 3 ± 0.2 ND 3 ± 0.3 ND 2 ± 0.1 ND
Endogenous and Exogenous N6-formyllysine Following a 6hr 9 ppm [13CD2]-Formaldehyde Exposure
Edrissi et al., Chemical Research in Toxicology: DOI: 10.1021/tx400320u, October 2013.
Exposure 7 d 14 d 21 d 28 d28 d +
6 h post
28 d + 24 h post
28 d + 72 h post
28 d + 7 d post
Nasal Epithelium
19.8 ± 7.1
22.1 ± 12.7
24.8 ± 14.6
36.5 ± 15
22.8 ± 12.2
12.8 ± 4.8
13.2 ± 6.2
5.9 ± 1.0
Trachea1.5 ± 0.5
1.2 ± 0.1
1.7 ± 0.9
1.4 ± 0.2
1.1 ± 0.1 1.2 ± 0.3 1.1 ± 0.3 0.8 ± 0.3
Lung < 0.7 < 0.7 < 0.7 < 0.7 < 0.7 < 0.7 < 0.7 < 0.7
Liver < 0.7 < 0.7 < 0.7 < 0.7 < 0.7 < 0.7 < 0.7 < 0.7
Bone Marrow
< 0.7 < 0.7 < 0.7 < 0.7 < 0.7 < 0.7 < 0.7 < 0.7
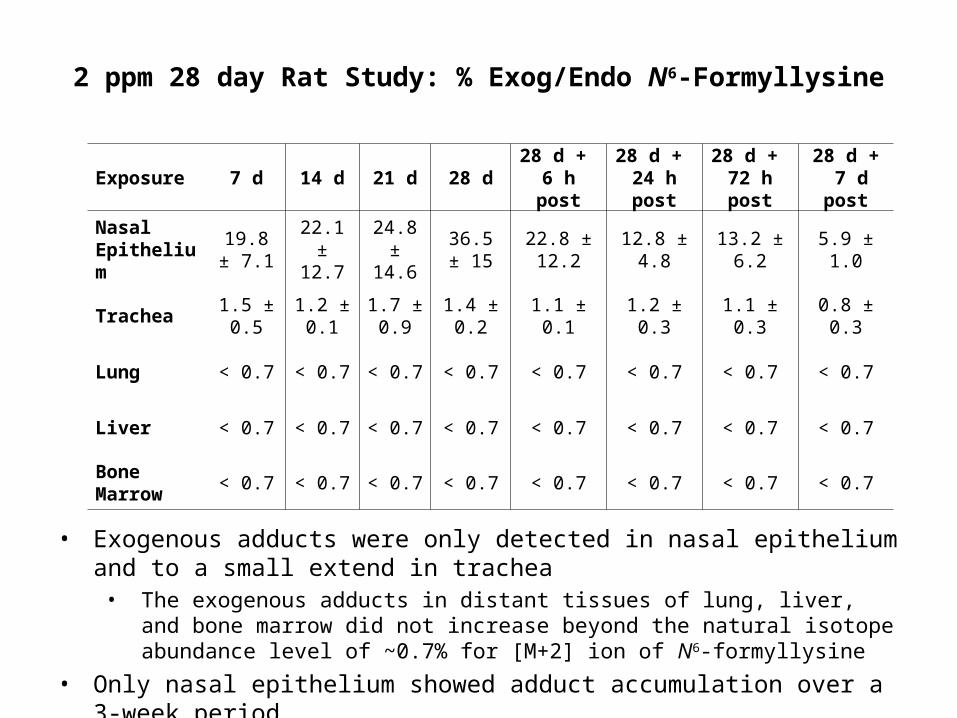
2 ppm 28 day Rat Study: % Exog/Endo N6-Formyllysine
• Exogenous adducts were only detected in nasal epithelium and to a small extend in trachea
• The exogenous adducts in distant tissues of lung, liver, and bone marrow did not increase beyond the natural isotope abundance level of ~0.7% for [M+2] ion of N6-formyllysine
• Only nasal epithelium showed adduct accumulation over a 3-week period

Conclusions• We have developed a series of highly specific and ultrasensitive
methods that comprehensively demonstrate that inhaled formaldehyde does not reach distant tissues of rats and nonhuman primates.
• These methods utilize [13CD2]-formaldehyde for the exposures so that both endogenous and exogenous DNA, globin and N6-formyllysine adducts can be distinguished and quantitated.
• The assays were conducted in two independent laboratories and have confirmed that [13CD2]-formaldehyde does not reach distant tissues such as blood and bone marrow.
• This research raises serious issues regarding the plausibility that inhaled formaldehyde causes leukemia. It seriously challenges the epidemiologic studies in several ways, including accurate exposure assessment, confounders and a lack of consistency across human and animal evaluations of carcinogenesis.

29
Moeller B C et al. Toxicol. Sci. 2013;toxsci.kft029

Collaborators and Sponsors• Kun Lu• Ben Moeller• Rui Yu• Yongquan Lai• Genna Kingon• Tom Starr• Jacob McDonald• Melanie Doyle-Eisele• Julia Rager• Rebecca Fry• Bahar Edrissi• Peter Dedon
• Hamner Institutes for Health Sciences
• Lovelace Respiratory Research Institute
• Texas Commission for Environmental Quality
• FormaCare-CEFIC
• Research Foundation for Health and Environmental Effects
• NIEHS Superfund Basic Research Program (P42-ES 5948)
• NIEHS Center for Environmental Health and Susceptibility (P30 ES 10126)

Linearized Multistage Modelfor Cancer Risk Assessment
• The LMS model has been the default model for the EPA since 1986.
• It is highly public health conservative.
• Dr. Kenny Crump, the originator of the LMS model, has stated that this model
– incorporates no biology, and
– will over estimate cancer risks by several orders of magnitude if nonlinear data are known

F Langevin et al. Nature 475, 53-58 (2011) doi:10.1038/nature10192
Acute leukaemia in Aldh2–/– Fancd2–/– mice.

Me-dG Adducts / 107 dG (capillary method)
Tissues
Control 500 mg/kg 2000 mg/kg
Endogenous
Exogenous
Endogenous
Exogenous
Endogenous
Exogenous
Brain6.69 ± 2.91
notdetected
7.95 ± 2.37
n.d.10.38 ±
4.84n.d.
Liver4.35 ± 1.01
5.66 ± 0.52
0.08 ± 0.08
8.14 ± 2.03
0.41 ± 0.14
Lung4.55 ± 1.93
7.24 ± 1.95
0.13 ± 0.04
10.32 ± 1.83
0.22 ± 0.06
Kidney4.31 ±
2.48.48 ± 1.50
0.12 ± 0.04
7.86 ± 2.14
0.39 ± 0.09
Thymus2.55 ± 0.37
3.49 ± 0.12
0.16 ± 0.06
3.73 ± 0.17
0.42 ± 0.03
WBC3.32 ± 0.45
3.65 ± 0.43
0.09 ± 0.03
3.92 ± 0.25
0.19 ± 0.02
Spleen3.70 ± 1.34
5.85 ± 1.12
0.19 ± 0.12
4.89 ± 0.69
0.90 ± 0.26
Bone Marrow
2.99 ± 0.56
2.99 ± 0.73
0.37 ± 0.08
3.34 ± 0.49
1.42 ± 0.29

0.45
0.40
0.35
0.30
0.25
0.20
0.15
0.10
0.05
Exogenous/Endogenous N2-HOMe-dG Adducts From Methanol