Critical Care - lnx.mednemo.itlnx.mednemo.it/wp-content/uploads/2008/10/cc7711.pdf · performed...
37
This Provisional PDF corresponds to the article as it appeared upon acceptance. Copyedited and fully formatted PDF and full text (HTML) versions will be made available soon. Differential influence of arterial blood glucose on cerebral metabolism following severe traumatic brain injury Critical Care 2009, 13:R13 doi:10.1186/cc7711 Monika Holbein ([email protected]) Markus Bechir ([email protected]) Silke Ludwig ([email protected]) Jutta Sommerfeld ([email protected]) Silvia R Cottini ([email protected]) Marius Keel ([email protected]) Reto Stocker ([email protected]) John F Stover ([email protected]) ISSN 1364-8535 Article type Research Submission date 5 September 2008 Acceptance date 6 February 2009 Publication date 6 February 2009 Article URL http://ccforum.com/content/13/1/R13 This peer-reviewed article was published immediately upon acceptance. It can be downloaded, printed and distributed freely for any purposes (see copyright notice below). Articles in Critical Care are listed in PubMed and archived at PubMed Central. For information about publishing your research in Critical Care go to http://ccforum.com/info/instructions/ Critical Care © 2009 Holbein et al. , licensee BioMed Central Ltd. This is an open access article distributed under the terms of the Creative Commons Attribution License ( http://creativecommons.org/licenses/by/2.0), which permits unrestricted use, distribution, and reproduction in any medium, provided the original work is properly cited.
Transcript of Critical Care - lnx.mednemo.itlnx.mednemo.it/wp-content/uploads/2008/10/cc7711.pdf · performed...
This Provisional PDF corresponds to the article as it appeared upon acceptance. Copyedited andfully formatted PDF and full text (HTML) versions will be made available soon.
Differential influence of arterial blood glucose on cerebral metabolism followingsevere traumatic brain injury
Critical Care 2009, 13:R13 doi:10.1186/cc7711
Monika Holbein ([email protected])Markus Bechir ([email protected])
Silke Ludwig ([email protected])Jutta Sommerfeld ([email protected])
Silvia R Cottini ([email protected])Marius Keel ([email protected])
Reto Stocker ([email protected])John F Stover ([email protected])
ISSN 1364-8535
Article type Research
Submission date 5 September 2008
Acceptance date 6 February 2009
Publication date 6 February 2009
Article URL http://ccforum.com/content/13/1/R13
This peer-reviewed article was published immediately upon acceptance. It can be downloaded,printed and distributed freely for any purposes (see copyright notice below).
Articles in Critical Care are listed in PubMed and archived at PubMed Central.
For information about publishing your research in Critical Care go to
http://ccforum.com/info/instructions/
Critical Care
© 2009 Holbein et al. , licensee BioMed Central Ltd.This is an open access article distributed under the terms of the Creative Commons Attribution License (http://creativecommons.org/licenses/by/2.0),
which permits unrestricted use, distribution, and reproduction in any medium, provided the original work is properly cited.

Differential influence of arterial blood glucose on cerebral metabolism
following severe traumatic brain injury
1Monika Holbein, 1Markus Béchir, 1Silke Ludwig, 1Jutta Sommerfeld, 1Silvia R Cottini, 2Marius Keel, 1Reto Stocker, 1John F Stover
1Surgical Intensive Care Medicine, University Hospital Zuerich, Raemistrasse 100,
Zuerich, 8091, Switzerland 2Department of Surgery, Division of Trauma Surgery, University Hospital Zuerich,
Raemistrasse 100, Zuerich, 8091, Switzerland
Corresponding author
John F. Stover, MD
Surgical Intensive Care Medicine
University Hospital Zuerich
Raemistrasse 100
CH 8091 Zuerich

Abstract
Introduction
Maintaining arterial blood glucose within tight limits is beneficial in critically ill patients.
Upper and lower limits of detrimental blood glucose levels must be determined.
Methods
In 69 patients with severe traumatic brain injury (TBI), cerebral metabolism was monitored
by assessing changes in arterial and jugular venous blood at normocarbia (paCO2 4.4-5.6
kPa), normoxia (paO2 9-20 kPa), stable hematocrit (27-36%), brain temperature 35-38
degreesC, and CPP 70-90 mmHg. This resulted in a total of 43,896 values for glucose
uptake, lactate release, oxygen extraction ratio (OER), CO2 and HCO3 production, SjvO2,
oxygen-glucose index (OGI), lactate-glucose index (LGI), and lactate-oxygen index (LOI).
Arterial bood glucose concentration-dependent influence was determined retrospectively
by assessing changes in these parameters within pre-defined blood glucose clusters,
ranging from <4 to >9 mmol/l.
Results
Arterial blood glucose significantly influenced signs of cerebral metabolism reflected by
increased cerebral glucose uptake, decreased cerebral lactate production, reduced
oxygen consumption, negative LGI, and decreased cerebral CO2/HCO3 production at
arterial blood glucose levels above 6-7 mmol/l compared to lower arterial blood glucose
concentrations. At blood glucose >8 mmol/l signs of increased anaerobic glycolysis
(OGI<6) supervened.
Conclusions
Maintaining arterial blood glucose levels between 6 and 8 mmol/l appears superior
compared to lower and higher blood glucose concentrations in terms of stabilized cerebral
metabolism. It appears that arterial blood glucose values <6 and >8 mmol/l should be
avoided. Prospective analysis is required to determine the optimal arterial blood glucose
target in patients suffering from severe TBI.
Introduction
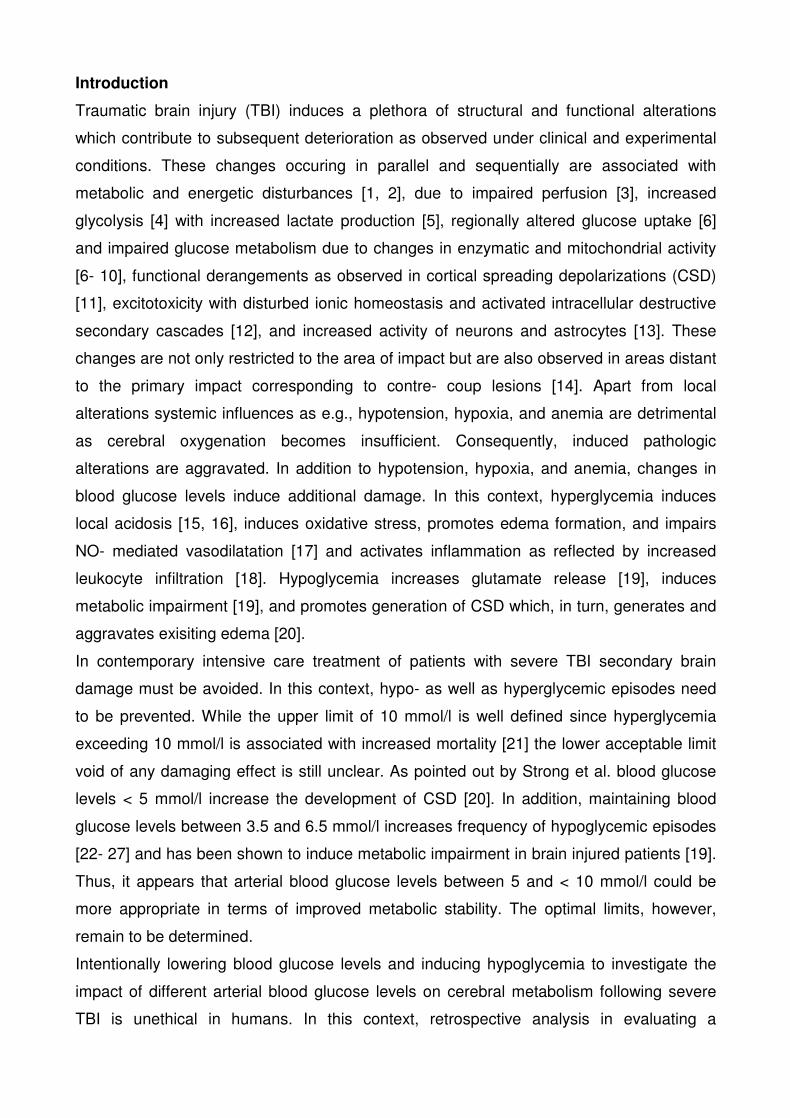
Traumatic brain injury (TBI) induces a plethora of structural and functional alterations
which contribute to subsequent deterioration as observed under clinical and experimental
conditions. These changes occuring in parallel and sequentially are associated with
metabolic and energetic disturbances [1, 2], due to impaired perfusion [3], increased
glycolysis [4] with increased lactate production [5], regionally altered glucose uptake [6]
and impaired glucose metabolism due to changes in enzymatic and mitochondrial activity
[6- 10], functional derangements as observed in cortical spreading depolarizations (CSD)
[11], excitotoxicity with disturbed ionic homeostasis and activated intracellular destructive
secondary cascades [12], and increased activity of neurons and astrocytes [13]. These
changes are not only restricted to the area of impact but are also observed in areas distant
to the primary impact corresponding to contre- coup lesions [14]. Apart from local
alterations systemic influences as e.g., hypotension, hypoxia, and anemia are detrimental
as cerebral oxygenation becomes insufficient. Consequently, induced pathologic
alterations are aggravated. In addition to hypotension, hypoxia, and anemia, changes in
blood glucose levels induce additional damage. In this context, hyperglycemia induces
local acidosis [15, 16], induces oxidative stress, promotes edema formation, and impairs
NO- mediated vasodilatation [17] and activates inflammation as reflected by increased
leukocyte infiltration [18]. Hypoglycemia increases glutamate release [19], induces
metabolic impairment [19], and promotes generation of CSD which, in turn, generates and
aggravates exisiting edema [20].
In contemporary intensive care treatment of patients with severe TBI secondary brain
damage must be avoided. In this context, hypo- as well as hyperglycemic episodes need
to be prevented. While the upper limit of 10 mmol/l is well defined since hyperglycemia
exceeding 10 mmol/l is associated with increased mortality [21] the lower acceptable limit
void of any damaging effect is still unclear. As pointed out by Strong et al. blood glucose
levels < 5 mmol/l increase the development of CSD [20]. In addition, maintaining blood
glucose levels between 3.5 and 6.5 mmol/l increases frequency of hypoglycemic episodes
[22- 27] and has been shown to induce metabolic impairment in brain injured patients [19].
Thus, it appears that arterial blood glucose levels between 5 and < 10 mmol/l could be
more appropriate in terms of improved metabolic stability. The optimal limits, however,
remain to be determined.
Intentionally lowering blood glucose levels and inducing hypoglycemia to investigate the
impact of different arterial blood glucose levels on cerebral metabolism following severe
TBI is unethical in humans. In this context, retrospective analysis in evaluating a

concentration- dependent impact of different arterial blood glucose concetrations on
cerebral metabolism is helpful. For this, changes in various parameters of cerebral
metabolism [jugular venous oxygen saturation (SjvO2), oxygen- glucose index, lactate-
oxygen index, lactate- glucose index, arterio- jugular venous glucose and lactate
differences] were determined for pre- defined arterial blood glucose values in a total of 69
patients with severe TBI. In addition, post hoc analysis of influence of time, different
lesions, side of jugular venous catheter insertion, and outcome was performed.

Materials and Methods
Following approval by the local Ethics Committee which waived the need for written
informed consent for this retrospective analysis, patient records from a total of 69 patients
treated on our intensive care unit (ICU) from 2004 to 2006 were reviewed. All patients
were required to have received a jugular venous catheter with a minimum monitoring time
of 24 hours. Patients with severe injuries anticipated to succumb to their injuries within the
first 24 hours were not considered for the present analysis. Barbiturates as well as
propofol are known to dose- dependently suppress neuronal activity and cerebral
metabolism [28]. To avoid difficult interpretation of the cerebral metabolic parameters due
to differing depth of sedation only patients subjected to continuous infusion of fentanyl
(Sintenyl®) and midazolam (Dormicum®) were investigated in the present study.
Standardized treatment protocol
Following severe TBI intubated and ventilated patients were treated according to our
standardized treatment protocol. Following CT diagnostic and surgical interventions
including insertion of an ICP probe (Neurovent®, Raumedic AG, 95205 Münchberg,
Germany) patients were transferred to our ICU. Continuous analgesia and sedation was
controlled by BIS EEG (BIS VISTATM, Aspect Medical Systems, Inc., One Upland Road,
Norwood, MA 02062) tapering drug dosage to maintain a BIS level between 20- 40.
Norepinephrine, dobutamine, and volume (crystalloids and colloids) were administered to
maintain CPP above 70 mmHg.
Sonographically guided insertion of a jugular bulb catheter in the larger internal jugular
vein was performed within the first hour following admission to the ICU. In 88% of the
investigated patients the right jugular vein was larger, irrespective of the type of lesion and
predominant location of the brain lesions (table 1). Subsequent radiological control using
conventional x- ray of the lateral aspect of the cervical spine and head revealed position of
the tip of the jugular catheter. Whenever required the jugular catheter was repositioned
with the tip of the catheter aimed at the caudal aspect of the mastoid process to avoid
obstructing the jugular bulb and the sigmoid sinus. Thereafter, arterial and simultaneously
drawn jugular venous blood samples were routinely investigated in 4- 6 hour intervals. This
sampling frequency was the same for every day and every patient until removal of the
jugular venous catheter. Arterial and jugular venous blood gas analyses using
commercially available pre- heparinized syringes (safe PICO Aspirator, Radiometer,
Copenhagen, Radiometer Medical ApS, Åkadevej 21, DK- 2700 Brønshøj, Denmark) were

performed using the ABL825 Flex Analyzer® (Radiometer Medical ApS, Åkadevej 21, DK-
2700 Brønshøj, Denmark).
Differentiated CPP and ventilation management was guided by SjvO2 maintaining SjvO2
above 60%. Brain temperature was maintained between 35 and 36.0° C using cooling
blankets or an intravenous cooling system (CoolGard3000®, Alsius®, 15770 Laguna
Canyon Road, Suite 150, Irvine, CA 92618 USA).
Overall, treatment measures were adapted and tapered to primarily maintain ICP< 15
mmHg. Following optimization of therapeutic interventions an ICP < 20 mmHg was
tolerated as long as CPP was maintained and cerebral metabolism was stable.
Patients received enteral nutrition via gastric or jejunal tube started within the first 12
hours. Administered calories were adapted according to indirect calorimetry performed
twice weekly.
Control and standardized management of arterial blood glucose concentrations
Arterial blood glucose was controlled in 1- 4 hour intervals depending on the actual arterial
blood glucose level determined in the arterial blood gas analysis. Arterial blood glucose
target was set at 3.5- 6.5 mmol/l based on the findings by van den Berghe and colleagues
[22- 24]. Arterial blood glucose was decreased by increasing insulin dose which was
infused continuously. Arterial blood glucose was increased by decreasing infused insulin
and by augmenting enteral nutrition. Glucose was not routinely infused as performed by
van den Berghe and colleagues [22- 24] to prevent the risk of promoting brain edema
formation. Transient glucose infusion was only considered in cases of severe
hypoglycaemia (< 2 mmol/l) which occurred once in one patient.
Calculated parameters of cerebral metabolism
Arterio- jugularvenous differences
Uptake and release of glucose (glc) and lactate (lac) can be assessed by calculating
corresponding arterio- jugularvenous differences (AJVD). While positive values reflect
uptake, negative values unmask cerebral release:
1) AJVD glc= arterial glc- jugularvenous glc
2) AJVD lac= arterial lac- jugularvenous lac
Cerebral arterio- jugularvenous difference in oxygen (avDO2)
avDO2 was calculated based on the arterial and jugular venous oxygen content:
3) avDO2= caO2- cjvO2

Arterial and jugular venous oxygen content were calculated based on hemoglobin (Hb)
concentration and oxygen saturation in arterial (SaO2) an jugular venous (SjvO2) blood
using the following equations:
4) caO2= (1.34 x Hb x SaO2) + (0.003 x paO2)
5) cjvO2= (1.34 x Hb x SjvO2) + (0.003 x pjvO2)
Oxygen extraction rate (OER)
OER was calculated based on the equation
6) OER= (caO2- cjvO2)/ caO2, expressed in%
Oxygen- glucose index (OGI)
OGI was calculated based on changes in avDO2 and arterio- jugularvenous difference in
glucose (AJVD glc):
7) OGI= avDO2/ AJVD glc
During aerobic glycolysis approximately six molecules of oxygen are used to oxidate one
molecule of glucose. Whenever glucose metabolism exceeds oxygen consumption, the
calculated OGI will be < 6, thereby reflecting anaerobic glycolysis. An OGI > 6 indicates
aerobic metabolism of substrates other than glucose, as e.g., lactate.
Lactate- glucose index (LGI)
LGI was calculated considering changes in arterio- jugularvenous difference in lactate
(AJVD lac) and AJVD glc:
8) LGI= AJVD lac/ AJVD glc
LGI reflects generation of cerebral lactate from glucose. Increased cerebral lactate
production results in negative LGI values while positive LGI reflects lactate uptake.
Lactate- oxygen index (LOI)
LOI was calculated using the following equation:
9) LOI= AJVD lac/ avDO2
LOI can be used as a crude estimate for the extent of cerebral anaerobic metabolism
relative to oxidative metabolism. In this context, lactate release results in negative LOI
while lactate uptake is reflected by a positive LOI.
Arterio- jugularvenous difference in pH
AJVD pH can be used to assess dynamic changes. Less positive values unmask
decreased release of H+- ions, reduced production of CO2 or sustained buffering of
acidosis due to increased release of HCO3.
10) AJVD pH= pHa- pHjv
Arterio- jugularvenous difference in pCO2

Negative AJVD pCO2 values represent increased cerebral production of CO2. Less
negative AJVD pCO2 values unmask reduced release of CO2.
11) AJVD pCO2= paCO2- pjvCO2
Arterio- jugularvenous difference in HCO3
Dynamic changes in AJVD HCO3 reflect production of HCO3 and intracerebral buffer
capacity. In this context, negative AJVD HCO3 represent increased HCO3 production.
12) AJVD HCO3= arterial HCO3- jugularvenous HCO3
Detailed evaluation
Pre- defined parameters (ICP, CPP, paCO2, parameters of cerebral metabolism) were
assessed for different arterial blood glucose values grouped in 1 mmol/l clusters ranging
from < 4 to > 9 mmol/l.
Parameters of cerebral metabolism were investigated under conditions of normocarbia
(paCO2 4.4- 5.6 kPa), normoxia (paO2 9- 20 kPa), and hematocrit between 27 and 36%. In
addition, only values determined at a temperature between 35- 38°C and CPP between 70
and 90 mmHg were considered. This resulted in a total of 3’658 values per investigated
parameter, representing 69% of all recorded time points. When considering the influence
of arterial blood glucose clusters the remaining values per defined cluster were too small
to allow meaningful statistical analysis.
Time dependency was determined by evaluating changes of the pre- defined paramaters
within the arterial blood glucose clusters during the first, second, and third week.
Lesion- dependent influences were assessed by comparing the pre- defined parameters
between lesion subtypes: isolated lesions vs. mixed lesions. A more detailed analysis was
not possible due to a limited number of patients and samples per lesion subgroup.
Influence of outcome was determined by grouping the pre- defined parameters according
to survivors and non- survivors.
Calculation of frequency of pathologic values allow to determine the impact of different
arterial blood glucose clusters on cerebral brain metabolism. For this, frequency of SjvO2<
60%, OGI< 6, negative LGI, negative LOI, and negative AJVD lactate levels reflecting
increased cerebral oxygen consumption (SjvO2, OER), anaerobic glycolysis (OGI), and
lactate production (LGI, LOI, AJVD lactate) were assessed in pre- defined arterial blood
glucose clusters.

Statistical analysis
Graphical and statistical analysis was performed using SigmaPlot®10.0 and
SigmaStat®3.5, respectively. Changes over time and between groups were evaluated for
statistically significant difference using the Mann Whitney rank sum test and ANOVA on
ranks with post hoc all pairwise multiple comparison procedures (Dunn's test). Differences
were rated significant with a p< 0.05.

Results
Demographic data
Demographic data of the investigated 69 patients are given in table 1. These patients
reflect the population of patients with severe TBI treated at our institution.
Number of determined values
Overall, a total of 3’658 arterial and corresponding jugular venous blood gas analyses
were performed, resulting in a total of 43’896 values for the 12 pre- defined parameters
(ICP, CPP, paCO2, SjvO2, OER, LOI, LGI, OGI, AJVD glc, AJVD lac, AJVD pH, AJVD
CO2, AJVD HCO3).
According to the individual clinical courses, majority of values were determined in the first
week (52%), followed by 39% in the second week and 9% in the third week. Thus, the
strongest statistical power is found during the first two weeks.
Relative frequency of arterial blood glucose values
During weeks 1- 3, arterial blood glucose concentrations were predominantly measured
between 5- 6 and 6- 7 mmol/l corresponding to the set blood glucose target of 3.5- 6.5
mmol/l (fig. 1). There was no significant difference between weeks 1- 3.
Glucose- dependent and time- dependent changes
Pre- defined arterial blood glucose clusters resulted in different numbers of values per
cluster for the different parameters: < 4 mmol/l= 111, 4- 5 mmol/l= 543, 5- 6 mmol/l= 1385,
6- 7 mmol/l= 1005, 7- 8 mmol/l= 418, 8- 9 mmol/l= 134, > 9 mmol/l= 62 values.
Increasing arterial blood glucose was associated with a significantly increased cerebral
glucose uptake reflected by a more positive AJVD glc (fig. 2). In parallel, lactate release
was decreased revealed by a less negative AJVD lac approaching positive values (fig. 2).
Significant increases were observed at arterial blood glucose levels between 8 and 9
mmol/l compared to arterial blood glucose < 8 mmol/l. There were no significant
differences between the different weeks (week 1, 2, 3) (data not shown).
OER was significantly decreased reaching lowest values at blood glucose > 8 mmol/l (fig.
3). Changes in OER were reflected by increased SjvO2 levels, respectively, reaching
highest values at blood glucose > 8 mmol/l (fig. 3).
Calculated OGI was significantly decreased with increasing arterial blood glucose levels
exceeding 8 mmol/l (fig. 4). There was no difference over time (data not shown).
Calculated LOI showed a trend towards elevated values with increasing arterial blood
glucose levels. There was no difference over time (data not shown).
Calculated LGI approached positive values and was significantly increased with higher
arterial blood glucose concentrations exceeding 8 mmol/l (fig. 5). There was no difference
over time (data not shown).
Cerebral release/ production of CO2 and HCO3 was significantly reduced with arterial
blood glucose exceeding 6 mmol/l (figs. 6 and 7). This was reflected by a smaller AJVD pH
(data not shown).
With elevated arterial blood glucose levels, frequency of increased cerebral oxygen
consumption (SjvO2 < 60%) and cerebral lactate production (negative LGI values) were
reduced (fig. 8). Rate of anaerobic glycoloysis (OGI< 6), however, was increased at higher
arterial blood glucose levels (fig. 8).
Different blood glucose levels did not influence ICP and CPP values (data not shown).
Lesion- dependent changes
Pre- defined cerebral metabolic parameters as well as ICP and CPP were similar in
patients with isolated lesions compared to mixed lesions (data not shown). There were no
differences in type and extent of therapeutic measures.
Side- dependent changes
In the majority of the investigated patients (62/ 69 patients) the jugular venous catheter
was inserted in the right jugular vein, irrespective of the type of lesion and the predominant
side of the brain lesions (table 1) (right- sided brain lesions: 13/ 15 patients, left- sided
brain lesions: 7/ 8 patients, bilateral brain lesions: 42/ 46 patients). In the remaining seven
patients, the left jugular vein was canulated. There was no difference in brain metabolism
between left- sided or right- sided cannulation. However, the low number of patients and
uneven distribution within the different brain lesions do not allow statistical analysis .
Outcome- dependent changes
Investigated metabolic parameters could not differentiate non- surviving patients from
surviving patients (data not shown).
Discussion
Bed- side analysis of changes in arterial and jugular venous differences and their derived
indices of cerebral metabolism differentiated less favorable from more favorable arterial
blood glucose concentrations. Overall, cerebral metabolism appeared more stable as
judged by increased glucose uptake, reduced cerebral lactate, CO2 and HCO3 production/
release, elevated SjvO2, decreased OER, increased LOI, and elevated LGI with arterial
blood glucose levels between 8 and 9 mmol/ l.
Limitations of the study
The retrospective nature of the present analysis does not allow to clearly define dynamic
processes induced by specific arterial blood glucose concentrations or induced therapeutic
interventions as investigated changes were taken from the pooled data obtained in 69
patients with severe TBI. These pooled data consist of arterial and jugular venous blood
samples which were drawn at fixed time intervals predominantly ranging from 4- 6 hours.
These time intervals were independent from changes in arterial blood glucose values
which might have occurred between these sampling intervals. A prospective study
designed to specifically investigate the impact of dynamic changes by assessing
alterations of cerebral metabolic parameters at pre- defined changes in arterial blood
glucose levels is required to address this issue.
Calculated differences and indices of cerebral metabolism are widely accepted to gain
insight in otherwise occult changes within the brain [7, 29- 33]. However, the low temporal
and spatial resolution limit any detailed information concerning changes between the
individual blood sampling time points and influences of injured vs. non- injured or lesser
injured tissue since blood samples were drawn in 4- 6 hour intervals and jugular venous
blood reflects global rather than local intracerebral changes. In this context it has been
shown that SjvO2 only partially reflects pathologic intracerebral alterations [34] which show
a strong regional heterogeneity within peri-lesional tissue compared to lesions [35].
As observed in healthy volunteers magnetic resonance venography revealed a significant
asymmetry in the venous blood flow form the superior sagittal sinus flow to one transverse
sinus in 84% of the volunteers [36]. Based on a theoretical model this is accepted to result
in an asymmetry in jugular venous oxygen saturation measurements in patients with a
supratentorial lesion [36]. As shown by Metz and colleagues [37] monitoring of cerebral
metabolism using bilateral jugular venous catheters is superior to the unilateral approach
when searching for signs of posttraumatic cerebral ischemia due to insufficient CPP and
hyperventilation. Nevertheless 87% of ischemic events were detected when monitoring

ipsilateral to the predominant lesion or the side with the predominant jugular venous
outflow (in patients with diffuse brain injury). Thus, can expect to unmask pathologic
alterations in the majority of our patients. The scientific superiority of bilateral cannulation
of the jugular vein is off- set by the clinically relevant increased risk of bilateral thrombosis
formation which could result in increased ICP due to reduced venous outflow.
While microdialysis [1, 2, 5, 16, 19, 38, 39], PET [4- 6, 39, 40], and SPECT [41] allow more
detailed insight, these techniques are also confronted with specific limitations as e.g., high
costs, decreased regional and temporal resolution, respectively.
Continuous arterial and jugular venous blood sampling with subsequent analysis of
metabolic parameters would be helpful as described under experimental conditions [42].
For this, however, appropriate techniques have not yet been developed for the clinical
application. Until then, easy and cheap analysis of intermittently drawn blood gases which
is an integral part of contemporary intensive care treatment of critically ill patients is the
only feasible approach applicable on any specialized ICU.
Glucose and cerebral metabolism
Glucose is the predominant fuel for energy consuming processes within the brain [32].
Glucose is mainly used by the Na+/ K+ ATPase which is indispendsable to maintain
membrane stability and prevent functional as well as structural cell damage [43]. Various
endothelial, glial, and neuronal glucose transporters with different transport characteristics
guarantee sufficient glucose transport across the blood brain barrier (GLUT1) as well as
glial (GLUT1, 5) and neuronal (GLUT3, 4, 6, 8) glucose uptake [13, 44]. In this context, the
neuronal GLUT3 exhibits a lower Km (Michaelis constant) and a higher Vmax (maximal
transport velocity) compared to the other glucose transporters: Km= 1.4- 2.8 mmol/l [13,
44], Vmax 5- 34.6 nM/ 106 cells/ min [13], resulting in a significantly higher affinity and
transport capacity compared to e.g., GLUT1. These characteristics, in turn, guarantee
adequate neuronal glucose utilization under conditions of decreased glucose supply. This
is important since the ambient glucose levels within the neuronal environment is rather low
ranging from 1- 2 mmol/l compared to normal blood glucose levels between 5 and 6
mmol/l. Thus, any decrease in arterial blood glucose in conjunction with impaired
endothelial glucose transport due to reduced GLUT1 expression will endanger neuronal
function and viability.
Following TBI, increased GLUT3 expression [45] guarantees neuronal glucose uptake
while decreased GLUT1 expression [46] as found under experimental conditions limits
endothelial glucose transport. Decreased GLUT1 expression in conjunction with reduced

blood glucose levels result in a concentration- dependent decrease in glucose flux which is
mostly sustained at blood glucose levels below 3 mmol/l [47].
Under clinical conditions it is unclear which changes in presence and function of the
different GLUT subtypes is prevalent. The arterial blood glucose concentration- dependent
cerebral uptake of glucose as seen in the present study suggests that arterial blood
glucose concentrations maintained below the optimal Km of the endothelial GLUT1, i.e., <
8 mmol/l [13, 44] will result in insufficient supply. This can be overcome by maintaining
arterial blood glucose levels around 8 mmol/l as reflected by increased metabolic stability.
This is in line with findings showing the impact of decreased glucose supply on
posttraumatic functional disturbances following traumatic brain injury in terms of induced
CSD [20], increased extracellular glutamate and elevated lactate/ pyruvate ratio [19]. As
pointed out by Vespa and colleagues, cerebral oxygen consumption was decreased in
patients with higher blood glucose concentrations (120- 150 vs. 90- 120 mg/ dl) [19]. This
is also seen in the present patients. These findings strongly suggest that activation of
glucose transporter systems influence cerebral oxygen consumption. As shown by Abate
and coworkers [48] increased cerebral glucose consumption is associated with elevated
oxygen extraction ratio (OER) while low cerebral glucose consumption results in
decreased OER. Thus, the present data suggest that metabolic instability which can also
occur independently from cerebral ischemia [2] can be influenced substantially by
changing arterial blood glucose levels. Classically, OER has always been discussed in the
context of altered cerebral perfusion due to hypotension and hyperventilation [49] as
increased OER reflects insufficient cerebral perfusion. The present findings in conjunction
with data published by Vespa and colleagues [19] and Abate and coworkers [45-48]
suggest that changes in glucose metabolism substantially influence OER. Increased
oxygen consumption resulting from energetic impairment (lactate production, elevated
lactate/ pyruvate ratio) and neuronal excitation due to sustained glutamate release could
increase cerebral perfusion to correct this oxygen and energy deficit. This, however,
requires an intact coupling between metabolism and perfusion [50] which is known to be
disturbed following severe TBI [34] and during sedation/ anesthesia [51]. Based on the
facts that CPP was maintained above 70 mmHg and sedation was unchanged at all
investigated time points of analysis- assuming sufficient regional cerebral perfusion and
stable pharmacological coma- we speculate that metabolic impairment due to low arterial
blood glucose levels was the driving force for the observed increase in OER at arterial
blood glucose values < 7 mmol/ l coinciding with increased lactate and CO2 production,
and lower LGI. However, the present data do not allow to reliably differentiate whether

metabolic impairment might aggravate edema formation resulting in microcirculatory
deterioration which, in turn, increases OER. It also remains unclear whether the increased
CO2 production reflected by the negative AJVD pCO2 counteracts perfusion- metabolism
mismatch or contributes to ongoing metabolic impairment due to vessel dilation and
subsequent sustained brain swelling with compression of the microcirculation. Further
analysis including assessment of cerebral perfusion is warranted to determine the
functional impact of the metabolic changes observed in the present retrospective analysis .
Signs of tissue acidosis and regulation of cerebral metabolism
Severe TBI induces brain tissue acidosis reflected by significantly decreased brain tissue
pH inversely correlated with elevated brain lactate and pCO2 during the first posttraumatic
day [52]. Brain pH can either be determined directly by inserting specialized probes to
measure pH or indirectly by measuring tissue pCO2 and lactate. In addition, assessing
changes in arterio- jugular venous differences in pCO2 as reported by Chieregato and
colleagues [33] or HCO3- as performed in the present study can be used to indirectly
determine changes in brain pH. Apart from insufficient cerebral perfusion and cerebral
oxygenation [52] concomitant hyperglycemia has also been shown to aggravate TBI- and
ischemia- induced brain tissue acidosis [53, 54]. Sustained cerebral CO2 and HCO3-
production due to increased metabolism reflect underlying activation of various transporter
systems and regulatory mechanisms. In this context, cerebral pH is regulated by Na+/H+
exchange, Na+- driven Cl-/ HCO3- exchange, Na+-HCO3
- cotransport, and passive Cl-/
HCO3- exchange [55]. As unmasked by the present study, low arterial blood glucose levels
< 8 mmol/l are also associated with sustained CO2, HCO3-, and lactate production
suggesting that inadequate glucose supply activates various transporter systems as e.g.,
the Na+/ K+ATPase and glucose transporters to meet increased metabolic and energetic
demands resulting from e.g., sustained hypoglycemia- induced glutamate release [19] and
subsequent glutamate- mediated increased cerebral glucose consumption [56].
Glucose and secondary cerebral damage
Any decrease in arterial glucose will impair cerebral glucose- dependent pathways,
thereby resulting in disturbed metabolism as reflected by increased lactate/ pyruvate ratio
[19]. This, in turn, can induce excitotoxic damage resulting in increased extracellular
glutamate levels [19]. As shown by Shulman and colleagues [57] approximately 80% of
cortical glucose consumption (in the rat brain) is driven by glutamate cycling. Thus,
glutamate release due to reduced arterial blood glucose levels [19] increases cerebral
glucose utilization which cannot be met if arterial blood glucose remains low. This is of
importance whenever glucose uptake, glucose metabolism, enzymatic function, local
perfusion and local diffusion processes are disturbed. Together with these alterations
reduced blood glucose can aggravate underlying brain damage. In this context, a
decrease in blood glucose levels below 8 mmol/l was associated with a significant
elevation in peri-ischemic cortical depolarizations [58] which coincided with metabolic
impairment reflected by an increase in extracellular cerebral lactate and decrease in
extracellular glucose measured by microdialysis [58]. The occurrence of cortical
depolarizations was dramatically increased when blood glucose levels dropped below 6
mmol/l [58, 59]. Consequently, induction of CSD known to promote secondary damage
can be avoided by maintaining arterial blood glucose above 5 mmol/l. As suggested by the
present findings arterial blood glucose ranging from 7- 9 mmol/l appear more beneficial in
terms of improved metabolic stability.
Which arterial blood glucose concentration is optimal following severe TBI?
Under conditions of relative cerebral glucose insufficiency due to increased cerebral
glycolysis or absolute glucose insufficiency caused by systemic hypoglycemia, the brain
can metabolize lactate, pyruvate, and keton bodies [13, 32]. However, lactate metabolism
is less efficient than glycolysis and mitochondrial oxidative phosphorylation which result in
higher ATP production compared to lactate degradation. Lactate metabolism includes
energy- consuming shuttling processes to transport lactate from astrocytes to neurons for
subsequent generation of pyruvate via lactate dehydrogenase and further processing in
the citric acid cycle and mitochondrial respiratory chain [13]. While cerebral glycogen
stores have been shown to exceed arterial blood glucose levels by a three- to fourfold
during euglycemia in healthy controls [60], reflecting an additional valuable energetic
reserve, it is unclear to which extent and for which duration glycogenolysis can fuel
energy- requiring processes under pathologic conditions. As suggested by Otori and
colleagues, increase in cerebral glycogen content following experimental TBI could serve
as an endogenous source of metabolic energy [61]. Thus, a decrease in arterial blood
glucose should trigger glycogenolysis to maintain extracellular glucose concentrations and
avoid metabolic impairment. However, this does not seem to occur under clinical
conditions since decreased blood glucose resulted in a significant reduction in extracellular
glucose concentrations determined by microdialysis in TBI and epileptic patients [19, 62].
Hypoglycemia- induced impaired cerebral metabolism in terms of lactate production as
observed in the present study and increased lactate/ pyruvate ratio [19] reflects a

subordinated importance of glycogen under these specific conditions to prevent energetic
deterioration. Consequently, sufficient cerebral glucose supply must be guaranteed to
prevent avoidable secondary brain damage.
As suggested by the present retrospective analysis, optimal arterial blood glucose levels
range from 6 to 8 mmol/ l. With arterial blood glucose levels exceeding 8 mmol/ l
differentiated metabolic pathways appear to be activated as reflected by decreased rate of
increased oxygen consumption and reduced frequency of increased cerebral lactate
production. At the same time, however, anaerobic glycolysis reflected by OGI values < 6
was increased. Apart from anaerobic metabolims which implies underlying ischemia or
hypoxia it could be possible that non- oxidative metabolism resulting from mitochondrial
damage and impaired oxidative phosphorylation despite sufficient perfusion and oxygen
supply accounts for the observed decrease in OGI. This is in line with the pathophysiologic
mechanism of destructive influence of elevated arterial blood glucose levels on
mitochondria due to hyperglycemia- induced production of free oxygen radicals with
subsequent impairment of oxidative phosphorylation as discussed by van den Berghe and
colleagues [22- 24].
Taken together, arterial blood glucose levels between 6 and 8 mmol/ l could be an
appropriate range for patients suffering from severe traumatic brain injury.
Conclusions
To avoid cerebral metabolic impairment and prevent secondary brain damage adequate
blood glucose levels must be induced and maintained during the intensive care phase.
While substantial and reproducible evidence exists to avoid arterial blood glucose levels
exceeding 10 mmol/l the optimal lower blood glucose level is less clear. The present
results strongly suggest that arterial blood glucose concentrations < 6 mmol/l should be
avoided and that optimal cerebral metabolic stability is found at arterial blood glucose
levels around 8 mmol/l as reflected by increased cerebral glucose uptake, decreased
cerebral lactate production, increased SjvO2, as well as decreased cerebral oxygen
extraction, CO2 and HCO3 production. The increased frequency of reduced oxygen-
glucose index (OGI) below 6 at arterial blood glucose levels exceeding 8 mmol/ l appears
to delineate the upper limit of acceptable arterial blood glucose levels.
Prospective studies are needed to define the optimal arterial blood glucose target in
patients with severe traumatic brain injury.

Key messages:
• Changes in cerebral metabolism determined by analyzing jugular venous blood gases
and calculating arterial- jugular venous differences of metabolic indices are
significantly influenced by arterial blood glucose concentrations.
• Arterial blood glucose concentration- dependently improved cerebral metabolism
reflected by elevated SjvO2, increased cerebral glucose uptake, decreased cerebral
lactate production, reduced CO2 and HCO3- production, and increased lactate- glucose
index.
• Increased incidence in decreased oxygen- glucose index (OGI < 6) reflecting anaerobic
glycolysis occurred at arteral blood glucose > 8 mmol/ l but was not associated with
increased cerebral lactate production.
• Cerebral metabolic stability is reached at arterial blood glucose levels between 6 and 8
mmol/l.
• Arterial blood glucose concentrations < 6 and > 8 mmol/l should be avoided to prevent
signs of worsened cerebral metabolism reflected by increased cerebral lactate
production and anaerobic glycolysis, respectively.

Abbreviations
AJVD= arterio- jugular venous difference
CPP= cerebral perfusion pressure
ICP= intracranial pressure
ICU= intensive care unit
LGI= lactate- glucose index
LOI= lactate- oxygen index
OER= oxygen extraction ratio
OGI= oxygen- glucose index
TBI= traumatic brain injury
Competing interests
The authors declare that they have no competing interests.
Author’s contributions
MH collected the majority of the data, drafted parts of the manuscript and performed
graphical analysis. MB helped analyzing and interpreting the data and drafted parts of the
manuscript. SL and JS were responsible for data collection and maintaining the data bank.
SRC, MK, and RS helped analyzing and interpreting the data. JFS conceived the study
design, collected parts of the data, performed graphical and statistical analysis, and
drafted parts of the manuscript.
Acknowledgments
The help of the nursing staff in collecting clinical data is gratefully acknowledged. This
study was supported in parts by a grant from the Swiss National Research Foundation
(SNF) to JFS and the SUVA Fonds to JFS and RS.
References
1. Belli A, Sen J, Petzold A, Russo S, Kitchen N, Smith M. Metabolic failure precedes intracranial pressure rises in traumatic brain injury: a microdialysis study. Acta Neurochir (Wien). 2008, 150: 461-9
2. Vespa P, Bergsneider M, Hattori N, Wu HM, Huang SC, Martin NA, Glenn TC,
McArthur DL, Hovda DA. Metabolic crisis without brain ischemia is common after traumatic brain injury: a combined microdialysis and positron emission tomography study. J Cereb Blood Flow Metab. 2005, 25: 763- 774.
3. Coles JP. Imaging after brain injury. Br J Anaesth. 2007, 99: 49-60.
4. Bergsneider M, Hovda DA, Shalmon E, Kelly DF, Vespa PM, Martin NA, Phelps
ME, McArthur DL, Caron MJ, Kraus JF, Becker DP. Cerebral hyperglycolysis following severe traumatic brain injury in humans: a positron emission tomography study. J Neurosurg. 1997, 86: 241- 251.
5. Vespa PM, O'Phelan K, McArthur D, Miller C, Eliseo M, Hirt D, Glenn T, Hovda DA.
Pericontusional brain tissue exhibits persistent elevation of lactate/ pyruvate ratio independent of cerebral perfusion pressure. Crit Care Med. 2007, 35: 1153- 1160.
6. Hattori N, Huang SC, Wu HM, Liao W, Glenn TC, Vespa PM, Phelps ME, Hovda
DA, Bergsneider M. Acute changes in regional cerebral (18)F-FDG kinetics in patients with traumatic brain injury. J Nucl Med. 2004, 45: 775- 783.
7. Dusick JR, Glenn TC, Lee WN, Vespa PM, Kelly DF, Lee SM, Hovda DA, Martin
NA. Increased pentose phosphate pathway flux after clinical traumatic brain injury: a [1,2-13C2]glucose labeling study in humans. J Cereb Blood Flow Metab. 2007, 27: 1593-602.
8. Bartnik BL, Hovda DA, Lee PW. Glucose metabolism after traumatic brain
injury: estimation of pyruvate carboxylase and pyruvate dehydrogenase flux by mass isotopomer analysis. J Neurotrauma. 2007, 24: 181- 194.
9. Wu HM, Huang SC, Hattori N, Glenn TC, Vespa PM, Yu CL, Hovda DA, Phelps ME,
Bergsneider M. Selective metabolic reduction in gray matter acutely following human traumatic brain injury. J Neurotrauma. 2004, 21: 149-161.
10. Lifshitz J, Sullivan PG, Hovda DA, Wieloch T, McIntosh TK. Mitochondrial damage
and dysfunction in traumatic brain injury. Mitochondrion. 2004, 4: 705- 713.
11. Fabricius M, Fuhr S, Willumsen L, Dreier JP, Bhatia R, Boutelle MG, Hartings JA, Bullock R, Strong AJ, Lauritzen M. Association of seizures with cortical spreading depression and peri-infarct depolarisations in the acutely injured human brain. Clin Neurophysiol. 2008, 119: 1973- 1984.
12. Park E, Bell JD, Baker AJ. Traumatic brain injury: can the consequences be
stopped? CMAJ 2008, 178: 1163-1170.

13. Simpson IA, Carruthers A, Vannucci SJ. Supply and demand in cerebral energy metabolism: the role of nutrient transporters. J Cereb Blood Flow Metab. 2007, 27:1766- 1791.
14. Thomale UW, Griebenow M, Mautes A, Beyer TF, Dohse NK, Stroop R, Sakowitz
OW, Unterberg AW, Stover JF. Heterogeneous regional and temporal energetic impairment following controlled cortical impact injury in rats. Neurol Res. 2007, 29:594-603.
15. Parsons MW, Barber PA, Desmond PM, Baird TA, Darby DG, Byrnes G, Tress BM,
Davis SM. Acute hyperglycemia adversely affects stroke outcome: a magnetic resonance imaging and spectroscopy study. Ann Neurol. 2002, 52: 20- 28.
16. Diaz-Parejo P, Ståhl N, Xu W, Reinstrup P, Ungerstedt U, Nordström CH. Cerebral
energy metabolism during transient hyperglycemia in patients with severe brain trauma. Intensive Care Med. 2003, 29: 544- 550.
17. Garg R, Chaudhuri A, Munschauer F, Dandona P. Hyperglycemia, insulin, and
acute ischemic stroke: a mechanistic justification for a trial of insulin infusion therapy. Stroke. 2006, 37: 267- 273.
18. Kinoshita K, Kraydieh S, Alonso O, Hayashi N, Dietrich WD. Effect of
posttraumatic hyperglycemia on contusion volume and neutrophil accumulation after moderate fluid-percussion brain injury in rats. J Neurotrauma. 2002, 19: 681- 692.
19. Vespa P, Boonyaputthikul R, McArthur DL, Miller C, Etchepare M, Bergsneider M,
Glenn T, Martin N, Hovda D. Intensive insulin therapy reduces microdialysis glucose values without altering glucose utilization or improving the lactate/pyruvate ratio after traumatic brain injury. Crit Care Med. 2006, 34: 850- 856.
20. Strong AJ, Hartings JA, Dreier JP. Cortical spreading depression: an adverse
but treatable factor in intensive care? Curr Opin Crit Care. 2007, 13:126- 133.
21. Jeremitsky E, Omert LA, Dunham CM, Wilberger J, Rodriguez A. The impact of hyperglycemia on patients with severe brain injury. J Trauma. 2005, 58: 47-50.
22. van den Berghe G, Wilmer A, Hermans G, Meersseman W, Wouters PJ, Milants I,
Van Wijngaerden E, Bobbaers H, Bouillon R. Intensive insulin therapy in the medical ICU. N Engl J Med. 2006, 354: 449- 461.
23. van den Berghe G, Wouters P, Weekers F, Verwaest C, Bruyninckx F, Schetz M,
Vlasselaers D, Ferdinande P, Lauwers P, Bouillon R. Intensive insulin therapy in the critically ill patients. N Engl J Med. 2001, 345: 1359- 1367.
24. van den Berghe G, Schoonheydt K, Becx P, Bruyninckx F, Wouters PJ. Insulin
therapy protects the central and peripheral nervous system of intensive care patients. Neurology. 2005, 64: 1348- 1353.
25. Brunkhorst FM, Engel C, Bloos F, Meier-Hellmann A, Ragaller M, Weiler N, Moerer
O, Gruendling M, Oppert M, Grond S, Olthoff D, Jaschinski U, John S, Rossaint R,

Welte T, Schaefer M, Kern P, Kuhnt E, Kiehntopf M, Hartog C, Natanson C, Loeffler M, Reinhart K; German Competence Network Sepsis (SepNet). Intensive insulin therapy and pentastarch resuscitation in severe sepsis. N Engl J Med. 2008, 358: 125- 139.
26. Bilotta F, Caramia R, Cernak I, Paoloni FP, Doronzio A, Cuzzone V, Santoro A, Rosa G. Intensive Insulin Therapy After Severe Traumatic Brain Injury: A Randomized Clinical Trial. Neurocrit Care 2008, Epub before press
27. Meier R, Béchir M, Ludwig S, Sommerfeld J, Keel M, Steiger P, Stocker R, Stover
JF. Differential temporal profile of lowered blood glucose levels (3.5 - 6.5 mM versus 5 - 8 mM) in patients with severe traumatic brain injury. Crit Care. 2008, 12: R98
28. Stover JF, Pleines UE, Morganti-Kossmann MC, Stocker R, Kossmann T.
Thiopental attenuates energetic impairment but fails to normalize cerebrospinal fluid glutamate in brain-injured patients. Crit Care Med. 1999, 27: 1351- 1357.
29. Rosenthal G, Hemphill JC 3rd, Sorani M, Martin C, Morabito D, Obrist WD, Manley
GT. Brain tissue oxygen tension is more indicative of oxygen diffusion than oxygen delivery and metabolism in patients with traumatic brain injury. Crit Care Med. 2008, 36: 1917- 1924.
30. Moritz S, Kasprzak P, Woertgen C, Taeger K, Metz C. The accuracy of jugular
bulb venous monitoring in detecting cerebral ischemia in awake patients undergoing carotid endarterectomy. J Neurosurg Anesthesiol. 2008, 20: 8-14.
31. Møller K, Strauss GI, Thomsen G, Larsen FS, Holm S, Sperling BK, Skinhøj P,
Knudsen GM. Cerebral blood flow, oxidative metabolism and cerebrovascular carbon dioxide reactivity in patients with acute bacterial meningitis. Acta Anaesthesiol Scand. 2002, 46: 567-578.
32. Strauss GI, Møller K, Larsen FS, Kondrup J, Knudsen GM. Cerebral glucose and
oxygen metabolism in patients with fulminant hepatic failure. Liver Transpl. 2003, 9: 1244- 1252.
33. Chieregato A, Marchi M, Fainardi E, Targa L. Cerebral arterio-venous pCO2
difference, estimated respiratory quotient, and early posttraumatic outcome: comparison with arterio-venous lactate and oxygen differences. J Neurosurg Anesthesiol. 2007, 19: 222- 228.
34. Coles JP, Fryer TD, Smielewski P, Chatfield DA, Steiner LA, Johnston AJ, Downey
SP, Williams GB, Aigbirhio F, Hutchinson PJ, Rice K, Carpenter TA, Clark JC, Pickard JD, Menon DK. Incidence and mechanisms of cerebral ischemia in early clinical head injury. J Cereb Blood Flow Metab. 2004, 24: 202- 211.
35. Cunningham AS, Salvador R, Coles JP, Chatfield DA, Bradley PG, Johnston AJ,
Steiner LA, Fryer TD, Aigbirhio FI, Smielewski P, Williams GB, Carpenter TA, Gillard JH, Pickard JD, Menon DK. Physiological thresholds for irreversible tissue damage in contusional regions following traumatic brain injury. Brain. 2005, 128: 1931- 1942.

36. Beards SC, Yule S, Kassner A, Jackson A. Anatomical variation of cerebral venous drainage: the theoretical effect on jugular bulb blood samples. Anaesthesia. 1998, 53: 627- 633.
37. Metz C, Holzschuh M, Bein T, Woertgen C, Rothoerl R, Kallenbach B, Taeger K,
Brawanski A. Monitoring of cerebral oxygen metabolism in the jugular bulb: reliability of unilateral measurements in severe head injury. J Cereb Blood Flow Metab. 1998, 18: 332- 343.
38. Parkin M, Hopwood S, Jones DA, Hashemi P, Landolt H, Fabricius M, Lauritzen M,
Boutelle MG, Strong AJ. Dynamic changes in brain glucose and lactate in pericontusional areas of the human cerebral cortex, monitored with rapid sampling on-line microdialysis: relationship with depolarisation-like events. J Cereb Blood Flow Metab. 2005, 25: 402- 413.
39. Nortje J, Coles JP, Timofeev I, Fryer TD, Aigbirhio FI, Smielewski P, Outtrim JG,
Chatfield DA, Pickard JD, Hutchinson PJ, Gupta AK, Menon DK. Effect of hyperoxia on regional oxygenation and metabolism after severe traumatic brain injury: preliminary findings. Crit Care Med. 2008, 36: 273- 281.
40. Hatazawa J, Fujita H, Kanno I, Satoh T, Iida H, Miura S, Murakami M, Okudera T,
Inugami A, Ogawa T, et al. Regional cerebral blood flow, blood volume, oxygen extraction fraction, and oxygen utilization rate in normal volunteers measured by the autoradiographic technique and the single breath inhalation method. Ann Nucl Med. 1995; 9: 15- 21.
41. McGoron AJ Capille M, Georgiou MF, Sanchez P, Solano J, Gonzalez-Brito M,
Kuluz JW. Post traumatic brain perfusion SPECT analysis using reconstructed ROI maps of radioactive microsphere derived cerebral blood flow and statistical parametric mapping. BMC Med Imaging. 2008, 8: 4.
42. Leegsma-Vogt G, Venema K, Postema F, Korf J. Monitoring arterio-venous
differences of glucose and lactate in the anesthetized rat with or without brain damage with ultrafiltration and biosensor technology. J Neurosci Res 2001, 66: 795-802.
43. Erecińska M, Silver IA. ATP and brain function. J Cereb Blood Flow Metab. 1989,
9: 2-19.
44. Simpson IA, Dwyer D, Malide D, Moley KH, Travis A, Vannucci SJ. The facilitative glucose transporter GLUT3: 20 years of distinction. Am J Physiol Endocrinol Metab. 2008, 295: E242- 253.
45. Hamlin GP, Cernak I, Wixey JA, Vink R. Increased expression of neuronal
glucose transporter 3 but not glial glucose transporter 1 following severe diffuse traumatic brain injury in rats. J Neurotrauma 2001,18: 1011-1018.
46. Balabanov R, Goldman H, Murphy S, Pellizon G, Owen C, Rafols J, Dore-Duffy P.
Endothelial cell activation following moderate traumatic brain injury. Neurol Res 2001, 23: 175-182.

47. Barros LF, Bittner CX, Loaiza A, Porras OH. A quantitative overview of glucose dynamics in the gliovascular unit. Glia. 2007, 55: 1222- 1237.
48. Abate MG, Trivedi M, Fryer TD, Smielewski P, Chatfield DA, Williams GB, Aigbirhio
F, Carpenter TA, Pickard JD, Menon DK, Coles JP. Early derangements in oxygen and glucose metabolism following head injury: the ischemic penumbra and pathophysiological heterogeneity. Neurocrit Care. 2008, 19. [Epub ahead of print]
49. Coles JP, Fryer TD, Coleman MR, Smielewski P, Gupta AK, Minhas PS, Aigbirhio F, Chatfield DA, Williams GB, Boniface S, Carpenter TA, Clark JC, Pickard JD, Menon DK. Hyperventilation following head injury: effect on ischemic burden and cerebral oxidative metabolism. Crit Care Med. 2007, 35: 568- 578.
50. Gur RC, Ragland JD, Reivich M, Greenberg JH, Alavi A, Gur RE. Regional
differences in the coupling between resting cerebral blood flow and metabolism may indicate action preparedness as a default state. Cereb Cortex. 2009; 19: 375- 382.
51. Laitio RM, Långsjö JW, Aalto S, Kaisti KK, Salmi E, Maksimow A, Aantaa R,
Oikonen V, Viljanen T, Parkkola R, Scheinin H. The Effects of Xenon Anesthesia on the Relationship Between Cerebral Glucose Metabolism and Blood Flow in Healthy Subjects: A Positron Emission Tomography Study. Anesth Analg. 2009; 108: 593-600.
52. Clausen T, Khaldi A, Zauner A, Reinert M, Doppenberg E, Menzel M, Soukup J,
Alves OL, Bullock MR. Cerebral acid-base homeostasis after severe traumatic brain injury. J Neurosurg. 2005, 103: 597- 607.
53. Zygun DA, Steiner LA, Johnston AJ, Hutchinson PJ, Al-Rawi PG, Chatfield D,
Kirkpatrick PJ, Menon DK, Gupta AK. Hyperglycemia and brain tissue pH after traumatic brain injury. Neurosurgery. 2004, 55: 877- 881
54. Chesler M. Failure and function of intracellular pH regulation in acute hypoxic-
ischemic injury of astrocytes.Glia. 2005, 50: 398-406. 55. Chesler M. Regulation and modulation of pH in the brain. Physiol Rev. 2003, 83:
1183- 1221.
56. Caesar K, Hashemi P, Douhou A, Bonvento G, Boutelle MG, Walls AB, Lauritzen M. Glutamate receptor-dependent increments in lactate, glucose and oxygen metabolism evoked in rat cerebellum in vivo. J Physiol. 2008, 586: 1337- 1349.
57. Shulman RG, Hyder F, Rothman DL. Lactate efflux and the neuroenergetic
basis of brain function. NMR Biomed. 2001, 14: 389- 396.
58. Hopwood SE, Parkin MC, Bezzina EL, Boutelle MG, Strong AJ. Transient changes in cortical glucose and lactate levels associated with peri-infarct depolarisations, studied with rapid-sampling microdialysis. J Cereb Blood Flow Metab. 2005, 25: 391-401.
59. Strong AJ, Smith SE, Whittington DJ, Meldrum BS, Parsons AA, Krupinski J, Hunter
AJ, Patel S, Robertson C. Factors influencing the frequency of fluorescence

transients as markers of peri-infarct depolarizations in focal cerebral ischemia. Stroke 2000, 31: 214-222.
60. Oz G, Seaquist ER, Kumar A, Criego AB, Benedict LE, Rao JP, Henry PG, Van De
Moortele PF, Gruetter R. Human brain glycogen content and metabolism: implications on its role in brain energy metabolism. Am J Physiol Endocrinol Metab. 2007, 292: E946- 951.
61. Otori T, Friedland JC, Sinson G, McIntosh TK, Raghupathi R, Welsh FA. Traumatic
brain injury elevates glycogen and induces tolerance to ischemia in rat brain. J Neurotrauma. 2004, 21: 707- 718.
62. Abi-Saab WM, Maggs DG, Jones T, Jacob R, Srihari V, Thompson J, Kerr D, Leone P, Krystal JH, Spencer DD, During MJ, Sherwin RS. Striking differences in glucose and lactate levels between brain extracellular fluid and plasma in conscious human subjects: effects of hyperglycemia and hypoglycemia. J Cereb Blood Flow Metab. 2002, 22: 271- 279.

Table 1 Demographic data of 69 patients suffering from severe traumatic brain injury.
(Abbreviations: GCS= Glasgow Coma Scale; ISS= injury severity score; TBI= traumatic
brain injury; EDH= epidural hematoma; SDH= subdural hematoma; tSAH= traumatic
subarachnoid hemorrhage; ICU= intensive care unit)
Parameters Median, range or %
age [years] 38, 18- 65
gender 76% male
initial GCS 11, 3- 15
ISS 34, 12- 54
isolated TBI 25%
mortality [%] 26%
Isolated lesions [%]
EDH
SDH
contusions
tSAH
edema
32%
2%
8%
12%
4%
6%
Mixed lesions [%] 68%
Predominant side of brain lesion
right
left
bilateral
22%
11%
67%
Cannulation of right jugular vein
right- sided lesions
left- sided lesions
bilateral lesions
N= 13; 87%
N= 7; 88%
N= 42; 91%
Length of ICU [days]
survivors
deceased
16, 2- 52
10, 2- 43
Duration of jugular bulb [days]
survivors
deceased
10, 2- 24
7, 2- 15
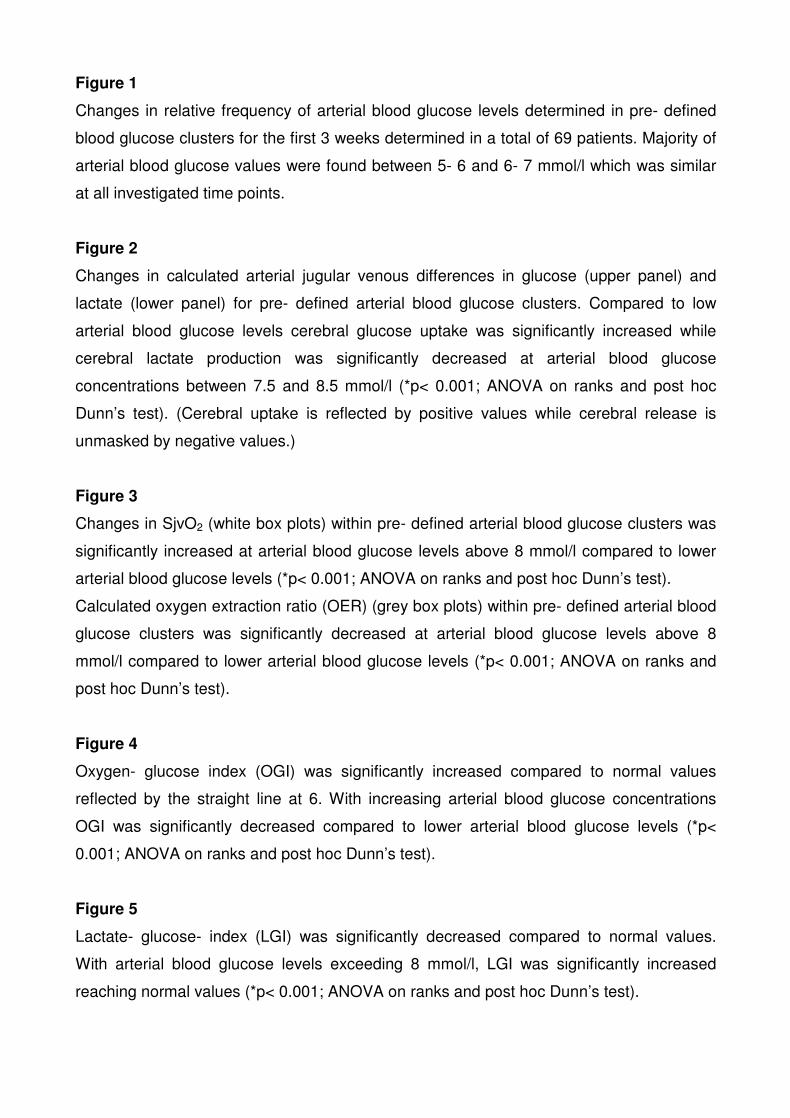
Figure 1
Changes in relative frequency of arterial blood glucose levels determined in pre- defined
blood glucose clusters for the first 3 weeks determined in a total of 69 patients. Majority of
arterial blood glucose values were found between 5- 6 and 6- 7 mmol/l which was similar
at all investigated time points.
Figure 2
Changes in calculated arterial jugular venous differences in glucose (upper panel) and
lactate (lower panel) for pre- defined arterial blood glucose clusters. Compared to low
arterial blood glucose levels cerebral glucose uptake was significantly increased while
cerebral lactate production was significantly decreased at arterial blood glucose
concentrations between 7.5 and 8.5 mmol/l (*p< 0.001; ANOVA on ranks and post hoc
Dunn’s test). (Cerebral uptake is reflected by positive values while cerebral release is
unmasked by negative values.)
Figure 3
Changes in SjvO2 (white box plots) within pre- defined arterial blood glucose clusters was
significantly increased at arterial blood glucose levels above 8 mmol/l compared to lower
arterial blood glucose levels (*p< 0.001; ANOVA on ranks and post hoc Dunn’s test).
Calculated oxygen extraction ratio (OER) (grey box plots) within pre- defined arterial blood
glucose clusters was significantly decreased at arterial blood glucose levels above 8
mmol/l compared to lower arterial blood glucose levels (*p< 0.001; ANOVA on ranks and
post hoc Dunn’s test).
Figure 4
Oxygen- glucose index (OGI) was significantly increased compared to normal values
reflected by the straight line at 6. With increasing arterial blood glucose concentrations
OGI was significantly decreased compared to lower arterial blood glucose levels (*p<
0.001; ANOVA on ranks and post hoc Dunn’s test).
Figure 5
Lactate- glucose- index (LGI) was significantly decreased compared to normal values.
With arterial blood glucose levels exceeding 8 mmol/l, LGI was significantly increased
reaching normal values (*p< 0.001; ANOVA on ranks and post hoc Dunn’s test).

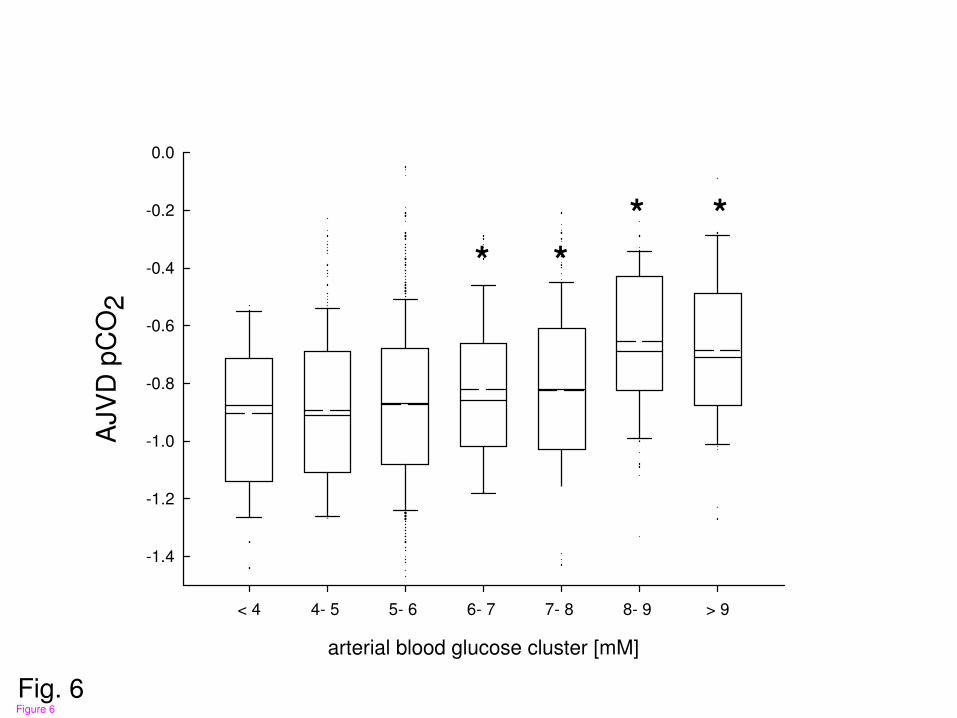
Figure 6
Calculated arterial jugular venous difference in pCO2 (AJVDpCO2) was significantly
increased with arterial blood glucose concentrations exceeding 6 mmol/l compared to low
arterial blood glucose levels (*p< 0.001; ANOVA on ranks and post hoc Dunn’s test).
Figure 7
Calculated arterial jugular venous difference in HCO3- (AJVDHCO3
-) was significantly
increased with arterial blood glucose concentrations exceeding 8 mmol/l compared to low
arterial blood glucose levels (*p< 0.001; ANOVA on ranks and post hoc Dunn’s test).
Figure 8
Calculation of frequency of pathologic values within pre- defined arterial blood glucose
clusters for increased cerebral oxygen consumption (SjvO2< 60%), sustained anaerobic
glycolysis (OGI< 6), and increased cerebral lactate production (negative LGI). With
elevated arterial blood glucose the rate of increased cerebral oxygen consumption (SjvO2<
60%) was reduced which coincided with decreased rate of increased cerebral lactate
production (negative LGI). However, frequency of anaerobic glycolysis (OGI< 6) was
increased.

Fig. 1
0
10
20
30
40
50
<44- 5
5- 66- 7
7- 88- 9 > 9
week 1
week 2
week 3
rela
tive f
requency [
%]
arterial blood glucose cluster [mM]
Figure 1

Fig. 2
arterial blood glucose cluster [mM]
< 4 4- 5 5- 6 6- 7 7- 8 8- 9 > 9
-0.2
0.0
0.2
0.4
0.6
0.8
AJV
D g
lc [m
M]
AJV
D lac [m
M]
*
*
Figure 2

Fig. 3
arterial blood glucose cluster [mM]
<4 4- 5 5- 6 6- 7 7- 8 8- 9 >9
Sjv
O2 [%
]
0
10
20
30
40
50
60
70
80
90
100
* **
OE
R [%
]
* **
Figure 3

Fig. 4
*
*
arterial blood glucose cluster [mM]
< 4 4- 5 5- 6 6- 7 7- 8 8- 9 > 9
oxygen-
glu
cose-
index
0
4
8
12
16
20
24
*
**
*
Figure 4

Fig. 5
*
*
arterial blood glucose cluster [mM]
< 4 4- 5 5- 6 6- 7 7- 8 8- 9 > 9
lacta
te-
glu
cose index
-0.6
-0.4
-0.2
0.0
0.2
0.4 *
*
Figure 5
arterial blood glucose cluster [mM]
< 4 4- 5 5- 6 6- 7 7- 8 8- 9 > 9
AJV
D p
CO
2
-1.4
-1.2
-1.0
-0.8
-0.6
-0.4
-0.2
0.0
* *
* *
Fig. 6Figure 6

Fig. 7
arterial blood glucose cluster [mM]
< 4 4- 5 5- 6 6- 7 7- 8 8- 9 > 9
AJV
DH
CO
3-
-2.5
-2.0
-1.5
-1.0
-0.5
0.0 * *
Figure 7
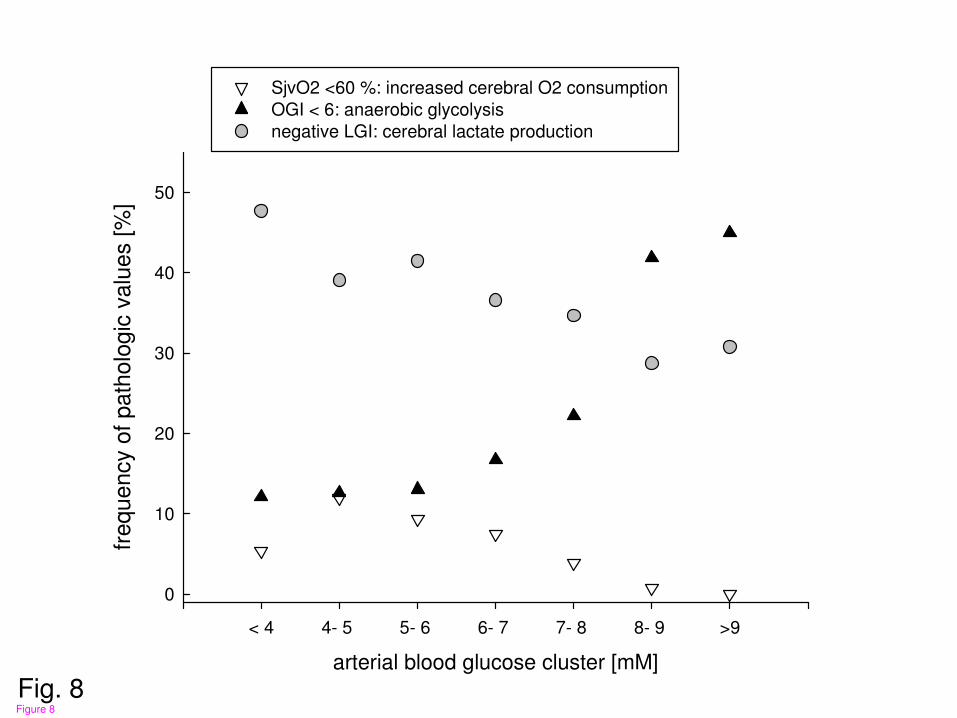
Fig. 8arterial blood glucose cluster [mM]
< 4 4- 5 5- 6 6- 7 7- 8 8- 9 >9
frequency o
f path
olo
gic
valu
es [
%]
0
10
20
30
40
50
SjvO2 <60 %: increased cerebral O2 consumption
OGI < 6: anaerobic glycolysis
negative LGI: cerebral lactate production
Figure 8