Critical Areas Handbook - Wa
104
Critical Areas Handbook Chapter 7 Monitoring and Adaptive Management of Critical Areas Regulations June 2018 Brian Bonlender, Director
Transcript of Critical Areas Handbook - Wa

Critical Areas Handbook
Chapter 7
Monitoring and Adaptive Management of Critical Areas Regulations
June 2018 Brian Bonlender, Director

Chapter Contents Introduction: Why Monitoring and Adaptive Management? ....................................................................... 1
Increasing Fairness, Transparency, Accountability and Ecological Outcomes.......................................... 1
Regulatory Context ................................................................................................................................... 3
Levels of Monitoring ................................................................................................................................. 5
Steps in Developing a Monitoring and Adaptive Management Program ..................................................... 7
Step 1. Determine the Reasons for Monitoring ........................................................................................ 7
Step 2. Establish Key Objectives and Study Questions ............................................................................. 7
Step 3. Design the Monitoring Program ................................................................................................. 10
Step 4. Determine the Monitoring Time Frame ..................................................................................... 12
Step 5. Evaluate Results and Make Recommendations .......................................................................... 12
Local and State Case Studies of Implementation and Effectiveness Monitoring ....................................... 12
Snohomish County Monitoring and Adaptive Management Program ................................................... 12
Douglas County Shoreline Critical Areas Monitoring and Adaptive Management ................................. 16
San Juan County Initiative ....................................................................................................................... 18
Jefferson County Shoreline Permitting ................................................................................................... 20
Thurston County/WDFW Shoreline Master Program ............................................................................. 23
Island County Critical Areas Permit Implementation and Effectiveness Monitoring ............................. 27
Island County Wetland Monitoring and Adaptive Management Program ............................................. 29
Island County Surface Water Quality Monitoring ................................................................................... 32
King County ............................................................................................................................................. 33
City of Kirkland Shoreline Tracking ......................................................................................................... 34
City of Bainbridge Island Shoreline Monitoring Program ....................................................................... 36
Bellingham Critical Areas Permit Implementation and Effectiveness Monitoring ................................. 39
Tacoma Critical Area and Shoreline Monitoring Program ...................................................................... 42
Washington State Department of Fish and Wildlife Hydraulic Project Approvals ................................. 44
State and Federal Mitigation Monitoring Programs ................................................................................... 47
Washington State Department of Ecology Wetland Regulatory Effectiveness Program ....................... 47
U.S. Army Corps of Engineers Mitigation Compliance Program ............................................................. 48

Data Resources for Implementation Monitoring ........................................................................................ 50
Local Government Permit Databases or Spreadsheets .......................................................................... 50
Washington Department of Fish and Wildlife High Resolution Change Detection ................................ 51
Washington Department of Natural Resources LiDAR ........................................................................... 51
Department of Ecology Wetland Change Analysis ................................................................................. 52
Department of Ecology Environmental Information Management........................................................ 52
Ecology and Federal Emergency Management Agency Risk MAP .......................................................... 52
Critical Areas Monitoring and Adaptive Management Workshops ............................................................ 52
Benefits of Monitoring ............................................................................................................................ 52
Challenges of Monitoring ........................................................................................................................ 53
Problem Solving – Peer Consultation ...................................................................................................... 53
Conclusions ................................................................................................................................................. 54
Appendices Appendix 7.A: Jefferson County No Net Loss Checklist Appendix 7.B: Thurston County Recommendations for Applying High Resolution Change Detection Data Set to Track Land Cover Change Appendix 7.C: Kirkland Landowner Templates

Chapter 7: Monitoring and Adaptive Management of Critical Areas Regulations 1
Introduction: Why Monitoring and Adaptive
Management? All counties and cities in the state have adopted critical areas regulations and permitting procedures under the Growth Management Act and the Shoreline Management Act, respectively. They have adopted these regulations to facilitate protection of critical areas. But, a local government has no way of knowing if they are achieving that goal without looking at the permit process and the on-the-ground results of critical areas regulation. They need a feedback loop to help determine whether goals are being met, and if the goals are not being met, how to improve the process. This chapter provides a suggested process for starting a permit monitoring program that can help local governments begin to address that gap in knowledge, and to improve permit implementation to protect critical areas. The chapter also provides a number of case studies of counties and cities (and state and federal agencies) that have adopted and are implementing monitoring programs – why they set up a program, what they are monitoring, and what changes they are making in response to the information they have gathered.
Increasing Fairness, Transparency, Accountability and
Ecological Outcomes
All interest groups have a common interest in a critical areas regulatory process that is fair, effective and efficient. Residents want to know that regulations are achieving their goals for the community. Developers and consultants want to improve the quality and speed of the permit process. Advocacy groups, whether environmental or private property rights, want transparency in the process. Tribes seeking to assert their treaty rights want to reduce risk from land use impacts. The goals of a monitoring and adaptive management program are increased fairness, transparency, accountability and improved ecological outcomes from regulations for critical areas protection. Monitoring tracks whether application requirements are being applied consistent with the regulations. This ensures applicants are being treated consistently and therefore fairly. Monitoring allows a local government to track the implementation of the permit system and to produce regular status reports for the public to review. It provides accountability to the public and applicants when they see that all applicants are being treated fairly and consistently in compliance with the regulations. Effectiveness monitoring determines if the intended outcomes or goals of fairness, transparency and accountability are being achieved over time.
Adaptive Management,
for purposes of this
handbook, is a
systematic process for
continually improving
management policies
and practices by
learning from the
outcomes of
implementation.

Chapter 7: Monitoring and Adaptive Management of Critical Areas Regulations 2
Adaptive management is a commitment by a local government to respond to monitoring and effectiveness results by changing approaches for protecting and managing critical areas, and to redirect resources as warranted by new information. A willingness to make improvements to address issues identified through this process is important. Monitoring and adaptive management are often low on the list of priorities for local jurisdictions. Lack of funding, staff capacity, and technical issues can make developing and implementing a program difficult. It can also expose perceived failures in the permit system, and may require changes that are difficult or unpopular. However, the benefits of a successful critical areas monitoring and adaptive management program can be substantial, and even a modest program can be worthwhile. Assessing permit implementation and effectiveness of critical areas regulations under the Growth Management Act (GMA) and the Shoreline Management Act (SMA) can help counties and cities determine if their permit system is reaching desired outcomes for protecting critical areas and accommodating appropriate uses. Monitoring and adaptive management can improve the delivery of government services around critical areas protection. The focus of a monitoring and adaptive management program is to evaluate the effectiveness of solutions identified to protect critical areas and actions taken, and to make changes as needed. The process is iterative as shown in the figure below. Such a program can result in recommended process improvements in implementing the critical areas regulations.
Conceptual representation of how implementation monitoring
can be used to improve the permit process

Chapter 7: Monitoring and Adaptive Management of Critical Areas Regulations 3
This chapter describes different levels of monitoring, outlines the components of a monitoring program, and provides local and state examples of permit monitoring programs. Permit monitoring for purposes of this guidance means any version of review that includes application of regulations to development regardless of whether a separate permit for shoreline or critical areas is required under the development regulations.
Regulatory Context
For monitoring purposes, no distinction is made in this document between critical areas regulations adopted under the Growth Management Act versus the Shoreline Management Act. Critical areas protection is required by both acts, and many jurisdictions have adopted their critical areas ordinance by reference in their Shoreline Master Program (SMP).1 The information gathered from monitoring should inform critical areas protection regardless of where critical areas are located. For example, the lessons learned from wetlands mitigation monitoring is beneficial, regardless of whether wetlands are in shoreline jurisdiction. The rules for both of these closely related statutes recognize the importance of monitoring as described below. Counties and cities may choose to adaptively manage critical areas or shoreline programs under either the GMA or the SMA as part of their periodic reviews, though there is no requirement to follow that schedule, and no reason to wait for scheduled reviews to improve permit processes.
Growth Management Procedural Criteria Critical areas protections adopted under the Growth Management Act have been in place in most jurisdictions for decades. Most jurisdictions have reviewed and updated, where needed, their regulations at least once. Monitoring and adaptive management can help to ensure these regulations achieve no net loss of critical areas functions and values. Commerce recognizes the importance of no net loss in the protection of functions and values in the Procedural Criteria:
Although counties and cities may protect critical areas in different ways or may allow some localized impacts to critical areas, or even the potential loss of some critical areas, development regulations must preserve the existing functions and values of critical areas. If development regulations allow harm to critical areas, they must require compensatory mitigation of the harm. Development regulations may not allow a net loss of the functions and values of the ecosystem that includes the impacted or lost critical areas.2
The Department of Commerce’s Best Available Science rules help local governments determine which information is the “best available science.” The rule encourages counties and cities to monitor and evaluate their efforts in critical areas protection and incorporate new scientific information, as it becomes available.3 Where there is an absence of valid scientific information, or incomplete scientific
1 RCW 36.70A.480; RCW 90.58.610 2 WAC 365-196-830(4 3 WAC 365-195-905(6)

Chapter 7: Monitoring and Adaptive Management of Critical Areas Regulations 4
information, the rule recommends using a “precautionary approach,” or an effective adaptive management program as an interim approach.4 No court decisions have held that local governments are required to adopt a monitoring and adaptive management program. However, the Supreme Court found that if Skagit County were to rely on monitoring and adaptive management to protect critical areas in agricultural lands, it needed to establish benchmarks for monitoring.5 The Growth Management Hearings Boards have addressed the value of a monitoring and adaptive management program, and required it in certain circumstances as follows:
Jefferson County was required to adopt a monitoring strategy that includes stricter development regulations that will be implemented at once if less stringent protection standards prove to be inadequate to protect against seawater intrusion. The County adopted less stringent protection standards that balance the need for protection of potable water supplies against the chilling effect of regulation against development after considering the best available science.6
When Skagit County chose a less-than-precautionary approach for protection, the Board found that approach requires an effective monitoring and adaptive management program that relies on scientific methods to evaluate how well regulatory and non-regulatory actions the County adopted to achieve their objectives.7
San Juan County was required to adopt an adaptive management program recommended by an advisory group because limitations in its ground water model and the data assembled to date did not conclusively show that increased densities in the urban growth area would not result in saltwater intrusion into the water supply.8
Voluntary Stewardship Program Many counties have opted in to the Voluntary Stewardship Program (VSP) to protect critical areas from existing and ongoing agricultural activities. The VSP requires local watershed groups to develop a work plan to protect critical areas while maintaining the viability of agriculture in designated priority watersheds.9 The work plan must include a monitoring and adaptive management program with goals and benchmarks for the protection and enhancement of critical areas. The Voluntary Stewardship Program is a non-regulatory alternative that does not rely on permits, but the principles of monitoring are the same and could be modified for VSP. Also, VSP monitoring is not the level of monitoring that is most of the focus of this chapter. This chapter encourages permit implementation monitoring, and VSP requires a form of validation monitoring. See Levels of Monitoring below for a description of each type of monitoring. For more information about the Voluntary Stewardship Program see Chapter 5.
4 WAC 365-195-920. 5 Swinomish Indian Tribal Community. v. W. Washington Growth Management Hearings Board, 161 Wn.2d 415 (2007) 6 Olympic Environmental Council, et al. v. Jefferson County, 01-2-0015 (Compliance Order, 12-4-02). 7 Swinomish Indian Tribal Community et al. v. Skagit County; 2-2-0012c (Compliance Order, 12-8-03). 8 Stephen F. Ludwig v. San Juan County, Case No. 05-2-0019c (FDO, Compliance Order, April 19, 2006). 9 RCW 36.70A.720

Chapter 7: Monitoring and Adaptive Management of Critical Areas Regulations 5
Shoreline Management Rules In approving a comprehensive SMP update, Ecology formally concludes that the SMP will result in “no net loss of ecological functions necessary to sustain shoreline natural resources.” 10 Monitoring can help a local government determine whether implementation of their Shoreline Master Program is achieving no net loss requirements, as well as the policy goal to plan for and foster reasonable and appropriate uses. Monitoring can do this by demonstrating that permits are being issued consistent with the approved SMP requirements. Ecology shoreline rules call on local governments to “monitor actions taken to implement the master program and shoreline conditions to facilitate appropriate updates of master program provisions to improve shoreline management over time.” The key “actions and conditions” are those associated with authorized developments. The shoreline rule also directs local governments to identify a process for periodically evaluating the cumulative effects of authorized development on shoreline conditions, which could involve a joint effort by local governments, state resource agencies, affected Indian tribes, and other parties.11 An example of a joint effort would be a local government working with Ecology and WDFW to employ High Resolution Change Detection data to track cumulative land use changes over time. The rules pledge that Ecology will “compile information concerning the effectiveness and efficiency of the guidelines and SMPs” and this may inform future updates to state rules. 12
Levels of Monitoring
Monitoring does not have to be complicated. Simply choosing to monitor permit implementation can provide key information for permit process improvement. Generally speaking, there are three levels of monitoring discussed in this chapter:
Permit implementation monitoring asks: (1) whether the local government issued a permit consistent with the regulations; and (2) whether the projects as built comply with all of the conditions noted in the permit. Data is about individual permits. Effectiveness monitoring continues to ask the two permit implementation monitoring questions noted above over a longer period of time – are permits being issued that are consistent with all regulatory requirements and are projects continuing to meet permit requirements. Effectiveness monitoring can also address procedural improvements to improve efficiency of the permit system. The data is not about the individual permit, but whether and how to adaptively manage the system. Validation monitoring asks general ecosystem questions about whether critical areas functions and values are being protected, and whether we are achieving no net loss of the ecosystem. Another term
10 WAC 173-26-18 6(8) 11WAC 173-26-201(2)(b); WAC 173-26-191(2)(a)(iii)(D) 12 WAC 173-26-171(3)(d) and WAC 173-26-201(2)(b)
Monitoring does not
have to be complicated.
Simply choosing to
monitor permit
implementation can
provide key information
for permit process
improvement.

Chapter 7: Monitoring and Adaptive Management of Critical Areas Regulations 6
for this type of monitoring is status and trends monitoring. Validation monitoring requires extensive scientific research that is probably beyond the resources of most local governments.13
Levels of Monitoring It is easiest to think og levels of monitoring as a continuum. Implementation monitoring is easier, can be done in a short time frame, and can eventually lead to effectiveness monitoring. This document focuses primarily on these first two levels, because there is not always a bright line between implementation and effectiveness monitoring. Many jurisdictions do them together. This chapter does not focus on validation monitoring, which is typically conducted regionally or as part of a particular scientific study. One example is the Puget Sound Ecosystem Monitoring Program (PSEMP). PSEMP is a collaboration of state, federal, tribal, local government agencies, non-
13 As noted above, the Voluntary Stewardship Program relies on a form of validation monitoring. Participation in the program is dependent upon funding, which is currently being provided by the state.

Chapter 7: Monitoring and Adaptive Management of Critical Areas Regulations 7
governmental organizations, watershed groups, business, academic researchers, local integrating organizations, and other private and volunteer groups and organizations. PSEMP has a number of work groups that monitor various populations and environmental conditions in Puget Sound, such as birds, mammals, salmon, and freshwater and marine waters. Over time, monitoring results should eventually be able to link observed changes in natural resources more closely with regulatory systems.
Steps in Developing a Monitoring and Adaptive
Management Program
Step 1. Determine the Reasons for Monitoring
Clarify the reasons for monitoring and how monitoring results will provide feedback for adaptively managing permit implementation. A decision to develop a monitoring program should start with a review of core plans or policy documents. Has the local government adopted specific direction to conduct certain kinds of monitoring? If not, determine the area of focus by addressing community concerns. Reasons for monitoring could include:
Are there specific critical areas that the jurisdiction is concerned are not adequately protected or that appear to have a high level of unpermitted activity?
Are there complaints from the community that compliance or enforcement is not adequate or is perceived as unfair?
Is there a desire to improve permit transparency, accountability and speed of permit processing?
Step 2. Establish Key Objectives and Study Questions
To be effective, a local government needs to establish clear objectives for the monitoring and adaptive management program, and develop questions that address those objectives. Is the objective to determine whether permits are being correctly issued in compliance with the regulations, and to refine the process if that objective is not being met? If so, an example of a clear objective might look like “permit provisions will be applied consistently and in compliance with the shoreline regulations;” or “applicants are complying with permit requirements.” The objectives will help determine which level of monitoring is required.

Chapter 7: Monitoring and Adaptive Management of Critical Areas Regulations 8
A local government should choose to monitor permit implementation if process improvement is the objective. Two entities are involved in implementation of a development permit, the local government and the applicant. The success or failure of permit implementation depends on the performance of both entities. Permit implementation monitoring collects information that improve the performance of the local government and the actions of the applicant. Effectiveness monitoring looks at permit implementation over time. Monitoring the outcome of permitting and enforcement of critical areas regulations over time begins to answer the question of whether regulations are applied accurately and consistently, and whether permit conditions are maintained. Monitoring of any of the stages of the permit process - permit, inspection, or enforcement of permit conditions and requirements - can help evaluate implementation and effectiveness of a critical areas regulatory program, depending on identified goals and resources. A database for gathering information on each stage is a critical tool for creating a complete system of accountability. Each stage is worth evaluating.
The success or
failure of permit
implementation
depends on the
performance of
both the local
government and
the applicant.

Chapter 7: Monitoring and Adaptive Management of Critical Areas Regulations 9
For each stage of the permit process, some basic questions are recommended. The questions would be the same for all critical areas that require protection (versus critical areas that require risk management, e.g., landslide hazard areas).
Stage in Critical Areas Permit/Review Process
Key study questions to evaluate permit implementation
Permit Did the local government issue a complete and fully compliant permit: 1. Does the permit identify the critical area and what needs to be protected? 2. Does the permit follow the code? 3. If a variance has been granted, is the reason for the variance clearly
stated? 4. Does the permit provide all the specific information necessary for the
applicant to be in compliance? 5. Does the permit clearly state and quantify the work being authorized?
Does the permit clearly state and quantify any critical areas impacts authorized by the permit decision?
Inspection 1. Pre Visit: Were all of the required technical reports, documentation, and information submitted?
2. Post-Visit: Did the applicant comply with the permit? This may require field measurements of permit provisions or requirements. If the permit requires quantifiable measures and the permit provisions are not measurable (quantitative), then the local government issued an incomplete permit.
Enforcement 1. Are enforcement actions resulting in compliance with the permit and/or the regulations?
An example of the types of questions that might be asked for monitoring of frequently flooded areas based on this framework might include the following. Permit: Are permits being properly documented per the building code?
Were buildings required to be elevated properly?
Has development been required to be properly flood vented?
Were the utilities required to be properly elevated or flood proofed?
For development in the Puget Sound Region, was compliance with the Puget Sound Biological Opinion for the NFIP documented in the permit via a Habitat Assessment or other means?
Inspection: Did the applicant comply with the permit?
Have buildings been elevated properly?
Has development been properly flood vented?
Were the utilities properly elevated or flood proofed?
For development in the Puget Sound Region, were Habitat Assessment requirements in permits followed?

Chapter 7: Monitoring and Adaptive Management of Critical Areas Regulations 10
Step 3. Design the Monitoring Program
There are a number of considerations for designing a monitoring program to ensure that the results are unbiased and actionable. Design of the permit system: An initial consideration is the design of the permit system itself. For example, does it sort actions into discrete enough categories that they can be reasonably compared to each other? An effective permit tracking system: Is the permit tracking system set up to collect the information that will be used to evaluate its effectiveness? An essential foundation for a monitoring program is a thorough and reliable way of tracking permits and permit conditions. It will be impossible to implement an effective monitoring system without such a system. Ideally, the permit tracking system should be reviewed for whether it provides the information needed to answer the key monitoring questions. Each step of the permit process should be documented. A basic spreadsheet or database should be set up to track the permit process and provide data that answers these questions regarding permits, inspections and enforcement. Planning and enforcement staff should be trained to gather and enter data in a consistent manner. An example of a very simple tracking system is an Excel spreadsheet used by the City of Kirkland. Kirkland monitors compliance with the Shoreline Master Program by tracking a number of permit requirements, such as shoreline setback, vegetation, stabilization, overwater coverage, lighting, and uses. For a template based on Kirkland’s Excel spreadsheet, click here. Other jurisdictions use database software available on the market, such as Snohomish County. Snohomish County tracks every step of the permit process in its database, including permit requirements and copies of documents.

Chapter 7: Monitoring and Adaptive Management of Critical Areas Regulations 11
Snohomish County permit tracking database
Sample size: Is the sample size large enough to be of value to monitor? Some jurisdictions issue a very limited number of permits for some activities. Knowing that you improperly issued 50 percent of a given type of permit doesn’t help much if only two were issued during the monitoring period. Random sample selection: If a jurisdiction issues a large number of permits each year, the monitoring question can be answered by reviewing some subset of the total number of permits for consistency in application of and compliance with the regulations. Implementation and effectiveness monitoring programs generally do not sample all permits, and in fact sampling all units may be inefficient unless only a small number of permits are issued each year.14 Most permit monitoring programs focus on sampling a limited number of permits in order to make inference to all permits. To say something about all permits (those that you can sample and those you cannot), you need to employ some type of random selection process of all permits. A random selection of permits avoids bias. Randomization can be achieved by adding a random element to the selection process. The cardinal rule is to make inference to all permits - each individual permit must have an equal chance of being chosen to review. An approach to choosing the sample permits you want to monitor could involve the following:
What is the specific question you want answered?
How are you defining your study population - i.e., how are you defining all permits? For example, all permits issued in 2014? Or, all building permits between 2010 and 2015?
If you have large numbers of different development permit types, you may want to consider sampling by permit type – e.g., agriculture, forest practices, or single-family residence versus commercial or subdivision. (See the Snohomish County case study for an example of this.)
How will you add a randomization element to the sample of permits that you choose from all permits? For example, will you choose the first permit issued each month over the last 5 years?
Which permit stages are to be monitored – permit, inspection or enforcement?
What types and sources of data are to be collected? Of all the things that could be measured, what exactly will be measured? For example, permit conditions for land cover, water quality, shoreline conditions, etc.
What sampling methodology will be used? What defined criteria will be used to review each permit type?
Determine if there is baseline monitoring that can be used to measure results against. What will the jurisdiction compare ongoing results against? This is not always applicable to all monitoring types - it may not be applicable to permit implementation. But to understand progress, establishing a baseline and monitoring over time will be helpful.
Selection bias/access to information: Are there provisions in the program to allow equal access to sampling results? For example, if the program relies on landowners willing to grant access to their property to perform follow up inspections it may not produce reliable results. Unless post-permit monitoring inspections are required by binding permit conditions or code requirements to compel access, the results will be biased toward access by willing landowners.
14 This is in the context of monitoring for permit implementation or effectiveness. If a jurisdiction is monitoring for mitigation compliance, prioritization of permits and/or monitoring of all permits will be more effective. See the Wetlands Compliance Mitigation and USACE Compliance Mitigation examples on pages 47 and 48.

Chapter 7: Monitoring and Adaptive Management of Critical Areas Regulations 12
Step 4. Determine the Monitoring Time Frame
In some cases, a monitoring and evaluation program is an ongoing effort, though there should be specific periods for reporting. If a monitoring effort has a defined period, the number of years before a report is generated should be informed by the scope of the monitoring questions. To have sample sizes big enough to summarize, several years at a minimum should be monitored prior to reporting. A county or city may want to prepare a report on a priority area every eight years to inform their periodic reviews under the Growth Management or Shoreline Management Acts.
Step 5. Evaluate Results and Make Recommendations
Local governments using a monitoring program should produce periodic reports that clearly answer the questions and objectives identified at the start of the program. The report should also identify any weaknesses in the program that could affect the quality of the results. Examples of the kinds of results a monitoring effort can identify:
i) Are accurate, complete and clear permits being issued? ii) Are critical area requirements being applied consistently in permits? iii) How are data summarized to provide useful feedback to interested stakeholders?
Results from a monitoring study should include recommendations for revising or adaptively managing the permit process to increase critical areas protection effectiveness or compliance with the regulatory requirements.
Local and State Case Studies of Implementation and
Effectiveness Monitoring A number of counties and state agencies have conducted monitoring of their critical areas programs. For many of them, the focus of monitoring was on both implementation and effectiveness. Implementation and effectiveness monitoring are very closely related, and often overlap. The case studies presented here provide some ideas for what a local government might choose to monitor, and the types of process improvement recommendations that could result from monitoring.
Snohomish County Monitoring and Adaptive Management
Program
1. Determine the Reasons for Monitoring The County adopted a critical area protection program in 2007 consisting of three principal tools: regulations, non-regulatory environmental programs, and a monitoring and adaptive management

Chapter 7: Monitoring and Adaptive Management of Critical Areas Regulations 13
program. The monitoring plan outlined an approach for measuring indicators of critical area functions and values (for wetlands and fish and wildlife habitat conservation areas), evaluating changes, and informing adaptive management decision-making regarding what adjustments may be needed to regulations or other County programs to protect critical area functions and values. Snohomish County chose to include a monitoring element as a precautionary approach, taking into consideration growth management hearing board rulings regarding critical area protection and monitoring in other counties. The County developed an adaptive management approach for sections of their critical areas regulations. This effort began in 2008 in accordance with the requirements contained in the Monitoring and Adaptive Management provisions of Part 700 of Snohomish County Code,15 the “no net loss” policies contained in the County’s comprehensive plan,16 and the Growth Management Act. The monitoring program was primarily intended to monitor wetlands and fish and wildlife habitat conservation areas. The second phase17 of the Monitoring and Adaptive Management Plan analyzed the effectiveness and implementation of permits and enforcement in protecting certain critical areas and their buffers (Critical Areas Monitoring Report: Analysis of the Effectiveness and Implementation of Permitting and Enforcement to Protect Critical Areas in Snohomish County, December 201418). The study was to provide data on whether the County was meeting its no net loss goals, and to provide recommendations for improving the permit process to meet those goals. This case study focuses on this second phase of the program. 2. Establish Key Objectives and Study Questions Snohomish County was interested in understanding how well its critical areas regulations were being implemented. The County uses a Critical Areas Site Plan (CASP) to identify all critical areas, buffers and restricted areas occurring in close proximity to the development area. The County’s study looked at properties with a number of permit types subject to the critical areas regulations and clearing, grading and building enforcement cases. Two of the key questions that the County asked were:
What were the land cover change gains or losses in wetlands, fish and wildlife habitat conservation areas and their buffers?
If loss is occurring, what adaptive management adjustment are needed to protect functions and values in fish and wildlife habitat conservation areas, wetlands, and their buffers?
The guiding principles for the monitoring and adaptive management plan are:
Develop and implement the monitoring program using peer-reviewed best available science.
15 Part 700 of Chapter 30.62A of Snohomish County Code. 16 Natural Environment Policies: NE 3.B.10, NE 5.A.7© and NE 7.B.1. 17 The first phase investigated changes in land cover, shoreline conditions along major rivers and lakes at a countywide scale that occurred between 2007 and 2009; and an assessment of select ecological indicators to evaluate the effectiveness of code provisions in protecting aquatic environments. The results were published in the “Critical Areas and Shorelines Monitoring Status Report” (SWM, March 2012). That report did not analyze the effectiveness or implementation of permitting or enforcement in any depth. 18 https://snohomishcountywa.gov/DocumentCenter/View/22692/2014-CAR-Monitoring-Report

Chapter 7: Monitoring and Adaptive Management of Critical Areas Regulations 14
Focus the program on the functions of fish and wildlife habitat conservations areas, wetlands, and their buffers.
Test hypotheses with indicators.
Use random sampling.
Adaptively manage the monitoring program. 3. Design the Monitoring Program For this phase of Snohomish County’s program, the emphasis was on analyzing the effectiveness and implementation of permitting and enforcement using high-resolution aerial photography at a parcel scale. Specific tasks were developed and investigated pertaining to the study questions:
Evaluate land cover changes in critical areas and buffers on a random sample of 335 of the 839 properties with permits subject to the County’s critical area regulations that have critical areas site plans (CASPs).
Evaluate land cover changes in critical areas and buffers on all 900 of the clearing, grading and building code enforcement properties subject to the County’s critical area regulations.
Evaluate land cover changes in critical areas and buffers on all 49 of the properties with Class IV forest practices permits subject to the County’s critical area regulations.
Evaluate land cover changes in critical areas and buffers on a random sample of 300 of the 797 properties with permits subject to the County’s critical area regulations that did not have critical areas that were documented.
Evaluate the implementation and effectiveness of the monitoring procedures in the County’s permit tracking system (AMANDA) used to track the presence and impacts of critical areas. Buffer and wetland area alteration options were used 485 times on 642 permit properties that had critical areas or buffers documented.
Adaptive Management Triggers
Indicator Threshold 1 (increase outreach, enforcement, mitigation)
Threshold 2 (Add programmatic adjustments)
Threshold 3 (Add code revisions)
Change detection and adjustment of time frame
Wetland Area <5% change* in one watershed
5-10% change* in 2+ watersheds
>10% change* countywide
4 years
Riparian forest quantity/quality index
<3% change* in one watershed
3-5% change* in 2+ watersheds
>5% change* countywide
2 years
*Change is measures relative to baseline
The County established a series of adaptive management triggers for each indicator based on local values. Without science upon which to base them, they selected targets that seemed appropriate. These triggers may need to be adjusted. The County used land cover data from aerial photography to map critical areas as part of the permit process. It then used subsequent land cover data to determine whether applicants met critical area site plan requirements with respect to the area of critical area and buffer requirements.
Chapter 7: Monitoring and Adaptive Management of Critical Areas Regulations 15
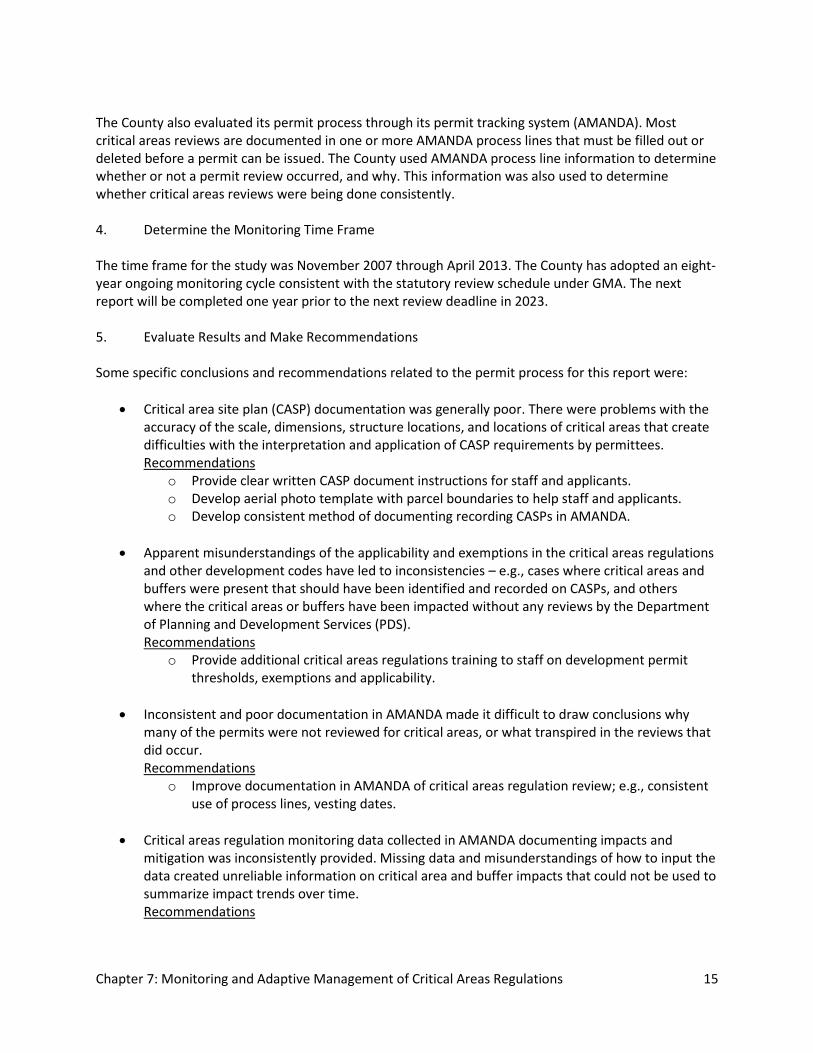
The County also evaluated its permit process through its permit tracking system (AMANDA). Most critical areas reviews are documented in one or more AMANDA process lines that must be filled out or deleted before a permit can be issued. The County used AMANDA process line information to determine whether or not a permit review occurred, and why. This information was also used to determine whether critical areas reviews were being done consistently. 4. Determine the Monitoring Time Frame The time frame for the study was November 2007 through April 2013. The County has adopted an eight-year ongoing monitoring cycle consistent with the statutory review schedule under GMA. The next report will be completed one year prior to the next review deadline in 2023. 5. Evaluate Results and Make Recommendations Some specific conclusions and recommendations related to the permit process for this report were:
Critical area site plan (CASP) documentation was generally poor. There were problems with the accuracy of the scale, dimensions, structure locations, and locations of critical areas that create difficulties with the interpretation and application of CASP requirements by permittees. Recommendations
o Provide clear written CASP document instructions for staff and applicants. o Develop aerial photo template with parcel boundaries to help staff and applicants. o Develop consistent method of documenting recording CASPs in AMANDA.
Apparent misunderstandings of the applicability and exemptions in the critical areas regulations and other development codes have led to inconsistencies – e.g., cases where critical areas and buffers were present that should have been identified and recorded on CASPs, and others where the critical areas or buffers have been impacted without any reviews by the Department of Planning and Development Services (PDS). Recommendations
o Provide additional critical areas regulations training to staff on development permit thresholds, exemptions and applicability.
Inconsistent and poor documentation in AMANDA made it difficult to draw conclusions why many of the permits were not reviewed for critical areas, or what transpired in the reviews that did occur. Recommendations
o Improve documentation in AMANDA of critical areas regulation review; e.g., consistent use of process lines, vesting dates.
Critical areas regulation monitoring data collected in AMANDA documenting impacts and mitigation was inconsistently provided. Missing data and misunderstandings of how to input the data created unreliable information on critical area and buffer impacts that could not be used to summarize impact trends over time. Recommendations

Chapter 7: Monitoring and Adaptive Management of Critical Areas Regulations 16
o Provide additional staff training to assure permit technicians, planners, engineers and environmental reviewers understand the data needs for critical areas regulation monitoring.
o Review and refine data monitoring fields in AMANDA.
Douglas County Shoreline Critical Areas Monitoring and
Adaptive Management
1. Determine the Reasons for Monitoring Douglas County does not have a lot of upland critical areas, but it does have a lot of shoreline along the Columbia River. While monitoring is not required under GMA or SMA, enforcement is required under the SMA19. Douglas County adopted a monitoring and adaptive management program in its SMP in 2009. The 2009 SMP.20 defines “monitoring” as:
[E]valuating the impacts of development proposals over time on the biological, hydrological, pedological, and geological elements of such systems and/or assessing the performance of required mitigation measures throughout the collection and analysis of data by various methods for the purpose of understanding and documenting changes in natural ecosystems and features, and includes gathering baseline data
Appendix H21 to the County SMP contains the County Shoreline Critical Areas Regulations. Section 4, Chapter 1, 1.060 and 070 require monitoring and adaptive management. Performance standards and specifics for monitoring wetlands are in Chapter 3, Section 2.035, and fish and wildlife habitat conservation areas are in Chapter 4, Section 3.037. 2. Establish Key Objectives and Study Questions The key objective of the program is no net loss of ecological functions and values under the SMP. 3. Design the Monitoring Program Douglas County has set up a problem solving process designed to achieve no net loss. County staff created a “child” permit in their permitting software that they call a “performance assurance permit” to ensure compliance. The performance assurance permit is the same as a performance bond used by public works. The financial “set-aside” is 125 percent of the project mitigation cost. It is a very specific document that is financially vested. It provides an incentive for compliance. The County prefers that people post a bond to assure no net loss, rather than requiring them to pay a fine for violations.
19 RCW 90.58.210 20 Douglas County Shoreline Master Program, page 133. http://www.douglascountywa.net/docs/default-source/tls/planning/growth-management/smp/chapter_1-9_final_8-27-09.pdf?sfvrsn=6 21 http://www.douglascountywa.net/docs/default-source/tls/planning/growth-management/smp/appendix_a-h_final_8-27-09.pdf?sfvrsn=6, start on page 161 of the PDF.

Chapter 7: Monitoring and Adaptive Management of Critical Areas Regulations 17
All shoreline development permits require a performance assurance and a monitoring process (see citation in paragraph 1 above). Staff track shoreline development permits through a software system. Staff tracks Performance Assurances (PERFs) through the same software system using “child” permits. Mitigation site monitoring reports must be created and submitted by a qualified biologist of record. As stages of compliance are achieved, funds are release sequentially from the financial set-aside. Shoreline development permits may be revoked if improvements are not executed. If monitoring reveals that installation and monitoring of mitigation improvements has been completed as required, remaining amounts of the financial surety are released. A portion of permit fees fund the monitoring program. It is mostly an unfunded requirement code enforcement absorbed (partially funded by county solid waste fees). The monitoring program also encompasses investigations of complaints, as well as joint river patrols with other state and local agencies. When the County identifies critical areas violations such as conducting work without the required permit and mitigation plan, it requires that the resolution be memorialized through the Shoreline Development Permit and PERF permit process, rounding out the process of ensuring no net loss. 4. Determine the Monitoring Time Frame The 2009 SMP requires a five-year monitoring period for permits, with biologist monitoring reports submitted in years one, three and five.. The monitoring reports must be prepared and submitted by a qualified professional biologist. This ensures that a professional who is trained in the local area Best Available Science is certifying there is no net loss of ecological functions and values. (SMP Appendix H22, Section 2.035.J and Section 3.037.I) 5. Evaluate Results and Make Recommendations The County generates a report to track the submittal and verification of the biologist’s monitoring reports. Staff looks at the biologist’s assurance of no net loss versus the potential net loss under the Shoreline Development Permit. If the biologist’s report reflects a failure of the mitigation plantings to meet the conditions required by the SMP or the specific permit, the monitoring period is extended. Once all of the reports reflect the site meets the mitigation requirements, the PERF is closed and the monies are released. A closed PERF corresponding to a completed Shoreline Development Permit means “no net loss” is validated. The County is evaluating when to execute the PERF during the permit process. Staff are evaluating whether five years is long enough to monitor, or too long. Staff are also looking at how to enforce non-compliant PERFs – whether they should revoke the permit or enter the property and complete the improvements.
22 http://www.douglascountywa.net/docs/default-source/tls/planning/growth-management/smp/appendix_a-h_final_8-27-09.pdf?sfvrsn=6

Chapter 7: Monitoring and Adaptive Management of Critical Areas Regulations 18
The County is continuing routine monitoring and identifying difficulties. For example, staff are looking at how to maintain a fire-adapted community and protect critical areas. They are also looking at the issue of how to provide code-compliant accessibility in shorelines of significance.
San Juan County Initiative
San Juan County looked at the effectiveness of its shoreline permit process. The San Juan Initiative, a partnership of the Puget Sound Partnership, Surfrider Foundation, and San Juan County formed in 2006 to determine what was working and what was not in protecting sensitive shoreline resources (See Amy H. Windrope, Timothy Quinn, Kurt L. Fresh, Andrea J. MacLennan & Joseph K. Gaydos (2016): Marine Shoreline Management – A 35-Year Evaluation of Outcomes in San Juan County, Washington, US, Coastal Management23). The goal of the Initiative was to provide a scientifically defensible, community-based process to evaluate and improve shoreline protection through citizen-supported changes to local and state policy. 1. Determine the Reasons for Monitoring The Initiative conducted this study to determine whether shoreline management requirements were adequately protecting feeder bluffs, shoreline vegetation and forage fish beaches. 2. Establish Key Objectives and Study Questions The study had two components: shoreline characterization and policy/permit review. The shoreline characterization asked the following questions:
What construction had occurred along the shoreline that would likely have impacted shoreline vegetation, feeder bluffs or forage fish beaches?
Was there a difference in on-the-ground outcomes from permitted or non-permitted structures and was there a difference in the impact of structures over time as shoreline regulations became more protective?
The evaluators also reviewed County permit databases for all records of overwater and shore armor permits after 1977. County permit review asked four questions:
Was there a permit for the activity?
Were sensitive resources identified (i.e., eelgrass beds, feeder bluffs, or forage fish beach spawning habitat) that could be negatively impacted by the activities?
Did permits contain provisions to protect those sensitive resources?
Did dimensions of field-measured armor and overwater structures comply with permit conditions?
3. Design the Monitoring Program The study describes how state and local policies were implemented in San Juan County, particularly how ecological outcomes relate to implementation challenges. Because counties must comply with the
23 https://www.tandfonline.com/doi/full/10.1080/08920753.2017.1237242

Chapter 7: Monitoring and Adaptive Management of Critical Areas Regulations 19
Growth Management Act and the Shoreline Management Act, the Initiative did not differentiate between the requirements of the two acts. Five elements of the initiative were reported on:
Characterization of shoreline construction during three time periods reflecting three different regulatory regimes;
Review of policy, regulations, and permitting processes;
Evaluation of the affected publics’ perceptions on shoreline protection;
Documentation of actions taken by the San Juan County Council in 2008 in response to Initiative findings; and
Measuring of changes in shoreline management in 2012 after implementation of Initiative recommendations in 2008.
4. Determine the Monitoring Time Frame The evaluators reviewed the County permit databases for all records of overwater and shore armor permits in three time periods: pre-SMA, post-SMA and post- 1993 which reflected post –GMA changes. These time periods were chosen because they reflected significant changes in shoreline regulations. 5. Evaluate Results and Make Recommendations Among other findings, the study found issues with county implementation under the Shoreline Management Act (SMA), and with permit tracking. Permit process findings included:
The county lacked basic maps showing the location of sensitive resources;
Permit information was stored in three separate databases and was not easily searchable, and more recent permits were recorded on note cards; and
Permits lacked essential information necessary to determine compliance.
There was no significant difference between permitted and non-permitted shoreline structures impact (size, location)
The permitting rate for shoreline armor, after 1977, was less than 10 percent (meaning that greater than 90 percent of the armor did not have a permit record) and for docks it was 78 percent.
There was no enforcement mechanism nor inspections.
Many community members believed the permitting and enforcement system to be arbitrary and unfair.
Recommendations at the local government and state levels:
Establish clear and unambiguous decision criteria;
Develop effective tracking databases and inspection programs; and
Monitor for compliance and effectiveness. Another critical component of adaptive management is adequate community engagement. The San Juan Initiative actively engaged shoreline property owners with neighborhood meetings. They also held lunches several times a year for builders, landscapers and contractors who work along the shoreline to understand their concerns and to develop solutions through collaboration.

Chapter 7: Monitoring and Adaptive Management of Critical Areas Regulations 20
Jefferson County Shoreline Permitting
1. Determine the Reasons for Monitoring
Jefferson County received an EPA grant through Clallam County. The purpose of the overall grant to Clallam and Jefferson Counties was to enhance shoreline protection through shoreline permitting. Under this grant, Clallam County developed policies and regulations pertaining to no net loss of shoreline functions during its Shoreline Master Program (SMP) update process, while Jefferson County assessed implementation of policies and regulations intended to achieve no net loss that had been incorporated into the updated SMP. And, Jefferson County wanted to develop indicators of shoreline function to determine whether it was achieving no net loss. This case study is based on the Jefferson County work to develop tools for implementing and monitoring the County’s SMP. The grant allowed the County Department of Community Development (DCD) to evaluate permit activity under the County’s updated SMP for use in future decision-making, and provided an opportunity to determine whether the County’s SMP implementation was achieving no net loss of shoreline functions. Work completed under this grant also allowed the County to identify ways to improve permitting outcomes through adaptive management. 2. Establish Key Objectives and Study Questions The overall goal of the grant was to develop tools for implementing and monitoring adopted SMPs. The objectives were:
Identify and monitor indicators of shoreline function;
Develop tools to help planners review shoreline applications;
Develop a database to track shoreline permitting applications, permitting decisions, and monitoring results;
Prepare a standardized shoreline monitoring field form;
Conduct monitoring site visits to verify compliance with shoreline permit conditions and the approved site plan, as well as post development conditions for no net loss indicators;
Prepare written guidance and templates for applying no net loss indicators that could be used by other local jurisdictions; and
Provide technical assistance to property owners and some local professionals, including realtors, contractors, and consultants.
The study asked two basic questions:
Are shoreline application proposals complying with the SMP policies and regulations?
Are shoreline permittees complying with the shoreline permit requirements? The study was based on two assumptions:
The monitoring program should be designed for use in showing compliance during periodic review and update of the SMP.
Permits issued in compliance with the SMP should result in no net loss of natural shoreline functions and values.
3. Design the Monitoring Program

Chapter 7: Monitoring and Adaptive Management of Critical Areas Regulations 21
Technical Assistance: Jefferson County DCD used the grant to improve its technical assistance to shoreline property owners through guidance and outreach. To identify the most effective outreach strategy, DCD and the consulting team made 24 monitoring site visits during summer 2015. Monitoring site visits evaluated permit compliance with permit conditions and assessed no net loss indicators of shoreline function on a Shoreline Development Field Form. The 24 monitoring site visits represented approximately 50 percent of the shoreline applications that had been approved at that time, and the information collected from these site visits were then used to target outreach activities in the County. Compliance Monitoring/Enforcement: To ensure that shoreline applications were consistent with all applicable shoreline regulations, DCD prepared a No Net Loss Checklist for use in planner review.24 Checklists prepared for each application recorded the application number, application information, project information, and shoreline permitting information. The planner reviewing the shoreline application used the checklist to confirm that all supporting information was submitted and that the proposal complied with all applicable SMP regulations. Completed checklists were entered into a database that tracked all shoreline permits issued under the updated SMP. Monitoring site visits were made to prperties in which the permitted work had either started or had recently been completed. As noted above, monitoring information was recorded on a Shoreline Development Field Form. This form evaluated the pre-development conditions and the post-development conditions for each applicable indicator of shoreline function. The results of this assessment would indicate whether or not permitted projects were affecting shoreline functions. The form was also used to record whether or not the implemented project was consistent with approved plans. The data collected during monitoring site visits were also entered into a database that tracked the following for each shoreline permit:
No Net Loss Checklist Information: application number, landowner name, project address, parcel number, type of land ownership, development type, development summary description, shore type, waterbody name, shoreline reach, and shoreline designation;
No Net Loss Indicators: identified each indicator by shore type, pre-development conditions, and post-development conditions;
Monitoring Site Visit Information: describe any variations from permit, describe mitigation (if required), identify whether or not application was for restoration, describe development implications for no net loss, and general comments.
Shoreline Permit Review: Shoreline applications received by DCD and compiled in the database were also used to track shoreline permitting and no net loss indicators, and to evaluate this activity relative to future shoreline permitting decisions in Jefferson County. 4. Determine the Monitoring Time Frame The updated Jefferson County SMP went into effect in February 2014, and all shoreline permits issued between the SMP effective date and December 2016 (grant end date) were tracked in a database. During this timeframe, Jefferson County received 142 shoreline applications. County planners completed 118 No Net Loss Checklists, issued 105 shoreline permits, and monitored 64 projects for compliance with permit conditions and the approved site plan.
24 See Appendix 7.A.

Chapter 7: Monitoring and Adaptive Management of Critical Areas Regulations 22
5. Evaluate Results and Make Recommendations A compilation of the monitoring results of permitted shoreline projects showed that planners generally reviewed proposals consistent with the SMP, and that the majority of the applicants complied with permit conditions. The indicators of shoreline function used by the county suggest that permitted projects are not likely to negatively affect shoreline ecological processes. These results indicate that county permitting is generally effective at maintaining baseline shoreline conditions. There were a few cases where there was (1) insufficient or inadequate information submitted by the applicant, (2) insufficient or inadequate review of the application by the project planner, or (3) lack of compliance with permit condition by the applicant (or hired workers). Monitoring showed that, for the most part, the no net loss provisions of the SMP are being met and that the indicators evaluated demonstrate that baseline shoreline ecological conditions are not being negatively affected by permitting activities. That said, monitoring did indicate that additional or better enforcement may be needed in some cases to achieve full compliance with SMP requirements. A list of key issues below identifies some actions that the county could take to improve the permit review process and achieve better permit compliance during project implementation.
Issue: Shoreline approval for repair of existing modifications/uses where repair to original condition results in impacts to ecological functions. Potential options:
o Encourage planners to carefully review maintenance and repair exemptions relative to the exemption requirements.
o Encourage planners to pull old files (when available) from archiving to better compare what was previously approved with the current proposal.
o Encourage planners to make more site visits to review existing site conditions relative to the proposed work shown on submitted site plans.
Issue: Unauthorized expansion of existing modifications/uses that commonly occur through maintenance/repair requires shoreline exemption approval. Potential options:
o Actions to address this key issue are similar to those listed above. o New mapper tool with better imagery may help planners review on-site conditions.
Issue: Loss of canopy cover and vegetation beyond approved clearing limits. Potential options:
o Require all site plans to show limits of clearing. o Require all site plans to show trees to be removed during construction. o Require submittal of a stormwater worksheet that states how much clearing is proposed
with each shoreline application. Require all applications to include photographs of project area.
o Encourage better communication between DCD planner and Jefferson County Environmental Health sanitarian (who ultimately issues septic permits).
o Add permit conditions requiring applicants to install orange construction barrier fencing at clearing limits and require a site visit to review the location of the fencing prior to beginning any earthwork.
o Provide additional training to septic designers and septic installers (to increase consistency between county-approved plan sheets and site development activities).

Chapter 7: Monitoring and Adaptive Management of Critical Areas Regulations 23
o Consider using performance bonds for permitted projects to encourage greater compliance with permit conditions.
Issue: Mitigation approved without maintenance/monitoring requirements. Potential options:
o Encourage planners and staff biologist to review mitigation plans more thoroughly. o During next SMP update, provide regulatory requirements for preparing “No Net Loss”
reports; add specific reporting criteria that must be addressed to show that the proposal complies with all regulatory requirements and ensure that no net loss of shoreline ecological functions is met for all permitted projects.
Issue: Permitted building setbacks and other allowed modifications adjacent to coastal geologically hazardous areas, with immediate or future risk to shoreline ecological functions. DCD does not have geologists on staff and the department currently relies on information in geotechnical reports prepared by geologists (or engineers) with a state stamp to make permitting decisions. Work completed during the course of this grant indicates that, in some cases, the reports may need further evaluation by an independent third-party expert prior to issuing a shoreline permit. Potential options:
o Send reports out for third-party review, as needed (mapper tool guidance provided by the consulting team will help DCD determine if third-party review may be appropriate).
o Encourage DCD planners to provide handouts pertaining to slope stability and vegetation retention to property owners to increase understanding of potential hazards to human health and safety as well as the shoreline environment.
Thurston County/WDFW Shoreline Master Program
In 2015, Thurston County Long Range Planning and Washington Department of Fish and Wildlife (WDFW) used a National Estuary Program (NEP) grant to quantify shoreline vegetation and land cover change and evaluate land use permit compliance within Thurston County’s shoreline regulatory jurisdiction. Thurston County has over 400 miles of shoreline. Thurston County measures and monitors no net loss based on existing conditions remaining the same as when the SMP was implemented. Protection and restoration are needed to offset new development. The County finds both function and acreage are important. 1. Determine the Reasons for Monitoring Thurston County partnered with WDFW and Ecology to pilot use WDFW’s High Resolution Change Detection (HRCD) data25 to monitor compliance and effectiveness within the County’s Shoreline Master Program (SMP) jurisdiction. This project developed a protocol manual for using HRCD that could be used by any jurisdiction within the Puget Sound region.26
25 See more about WDFW’s High Resolution Change Detection on page 51. 26 See Appendix 7.B: Recommendations for Applying the HRCD Data Set to Track Land Cover Change.

Chapter 7: Monitoring and Adaptive Management of Critical Areas Regulations 24
2. Establish Key Objectives and Study Questions The project was designed as a pilot to answer several related sets of questions for both Thurston County and WDFW. For Thurston County, key questions were:
What land cover change is happening within designated marine SMP areas? What change is happening throughout the Deschutes River watershed (WRIA 13)?
How does the change known by Thurston County permit records compare with detected changes by the HRCD? I.e., is change that occurred permitted and appropriate?
Can the County use HRCD to monitor no net loss?
What changes, if any, can be made to the land use permits or process that could increase the relevancy or effectiveness in using the HRCD in compliance monitoring?
For WDFW, the questions were:
How well can the HRCD detect changes relative to land use permit records?
Using Thurston County’s marine SMP area as an example test area, what land cover changes are happening not captured by the HRCD?
With the development of a HRCD user manual, can other entities use the HRCD effectively in the absence of further assistance by WDFW?
3. Design the Monitoring Program The exercise was designed to quantify the increase in impervious surfaces and decrease in canopy within Thurston County’s marine SMP area. The project consisted of five phases: Phase 1: Initial SMP Change Analysis: WDFW Habitat program staff and Thurston County’s long-range planning staff intersected the HRCD dataset with Thurston County’s marine SMP area and parcel data for the three time periods of HRCD available (2006 to 2009, 2009 to 2011, and 2011 to 2013) within ArcGIS. With known areas of change found, those locations were compared with land use permit records from Thurston County. The intent was to find locations of observed change via HRCD without any permit record. This wasn’t meant to be a direct means of enforcement, but an initial analysis of undocumented change that could provide a pared-down set of locations for further investigation. This phase would also produce land cover change statistics, including area of change and counts of land cover change events, by SMP designation and parcel. Phase 2: Learning What the HRCD Misses: Using the SMP marine area in Thurston County, WDFW staff manually looked for land cover changes not captured by the HRCD. This was intended to help WDFW understand rates of omission in the HRCD using an area under some developmental pressure with relatively small changes. This was done by manually finding and digitizing changes using the (National Agriculture Imagery Program) NAIP27 imagery that were not captured by the HRCD dataset. Phase 3: Developing a Standardized Method for Utilizing the HRCD: A major goal of this project was to develop support materials for others to utilize the HRCD to answer their land use management questions in the absence of in-person WDFW staff assistance. Using the lessons learned in Phases 1 and 2, WDFW and Thurston County cooperated on composing a manual for a recommended method to
27 https://www.fsa.usda.gov/programs-and-services/aerial-photography/imagery-programs/naip-imagery/

Chapter 7: Monitoring and Adaptive Management of Critical Areas Regulations 25
apply the HRCD to a specific land use management question. This phase also included the development of a web-based service for users to download the HRCD dataset, detail the methodology of HRCD construction, find contact information, and more. This is located at www.pshrcd.com. Phase 4: Testing the Manual through Remaining SMP Analysis in WRIA 13: Using only the HRCD dataset and the manual produced in Phase 3, Thurston County planning staff developed an application and utilized the HRCD successfully. For their application, they examined the land cover change within the remaining SMP areas within WRIA 13 for the three time periods of HRCD data available. Phase 5: Training and Outreach: With the lessons learned and products derived from Phases 1 through 4 of the project, WDFW and Thurston County staff, working in conjunction with the Coastal Training Program, developed a workshop for planning staff with other state agencies, local governments, and some non-governmental organizations. WDFW also used this opportunity to train internal staff on the benefits, limitations, and uses of HRCD. 4. Determine the Monitoring Time Frame The evaluators analyzed land cover change within Thurston County’s SMP area between 2006 and 2013. At the time of the project (2015), three iterations of the HRCD dataset were available for analysis for the study area, 2006 to 2009, 2009 to 2011, and 2011 to 2013. Permit records that corresponded to these timeframes were pulled. 5. Evaluate Results and Make Recommendations Currently, the only way the County has knowledge of unpermitted activity is through public complaints (i.e., neighbor complaining about the construction of something). This is an unreliable way to assess compliance. The county found that HRCD data, while not perfect, can be used to assess compliance and find above-ground unpermitted activity.

Chapter 7: Monitoring and Adaptive Management of Critical Areas Regulations 26
Overall, the data showed that less than half of one percent (0.39%) of the marine SMP area had change identified by HRCD from 2006 to 2013.28 Approximately two-thirds of this was due to canopy loss, with one-third due to new impervious surfaces. The project did not find any developments that were out of compliance, though it did find unpermitted events in each of the time periods (e.g., tree removal). The Thurston HRCD project demonstrated the utility of the HRCD in analyzing the patterns of land cover change in a specific geographic area of concern. However, Thurston County found that measuring compliance with HRCD data was “tedious and difficult” because of the capacity of the county’s current AMANDA database. In many cases land use permits did not include enough information to determine conclusively that a parcel with observed change via HRCD was out of compliance or determine that the parcel had a permit record during the study’s timeframe in question. Improvements in methods of development permit tracking could improve the capacity to use HRCD data in pairing with permitting to track compliance. This result was not entirely unexpected, as the HRCD can serve as a starting point and help local governments find otherwise unknown changes, understand patterns, and investigate unexpected changes more closely. Furthermore, the HRCD proved to be a relatively simple dataset to use. With the development of standard application methods, Thurston County was able to complete an analysis of its remaining SMP area without any further help from WDFW.
28 The land use change excludes over 25 acres of change occurring in the Billy Frank Jr Nisqually National Wildlife Refuge, because the loss of vegetation there was due to a saltmarsh restoration project.

Chapter 7: Monitoring and Adaptive Management of Critical Areas Regulations 27
Island County Critical Areas Permit Implementation and
Effectiveness Monitoring
1. Determine the Reasons for Monitoring Island County chose to monitor critical areas permit implementation and effectiveness because it often imposes strict conditions of approval on permits that impact critical areas or the shoreline. They also impose requirements for applicants to address critical areas violations. 2. Establish Key Objectives and Study Questions Two of the key questions the County asks are:
How do we ensure that these conditions are implemented? (Permit Implementation Monitoring)
How do we know if performance standards are met over time? (Permit Effectiveness Monitoring)
The County sees these two questions as dependent on each other – without one, you don’t have the other. 3. Design the Monitoring Program Permit Implementation Monitoring The County monitors all critical areas permits that are issued. It is time consuming to monitor every permit. Common conditions or requirements that are monitored include:
Notice to title
Conservation easements
Protective buffers
Buffer averaging
Restoration o Includes performance standards o Takes time
Mitigation o Includes performance standards o Takes time
The County uses separate denotations for wetlands projects, shoreline projects, and code violations. The denotations allow staff to track each type of permit separately. This allows the County to track each project separately. And, it allows staff to easily sort through the various projects.

Chapter 7: Monitoring and Adaptive Management of Critical Areas Regulations 28
The County uses the permit database, “parent” and “child” permit conditions29, installation inspections, and as-built reports to conduct implementation monitoring. They have created child permits in the database to track implementation and effectiveness of parent conditions. Using the County’s SmartGov database, they generate automatic alerts for inspections, monitoring reports, document submittals, etc. A typical child permit condition that is generated for parent mitigation requirements states:
The Critical Areas Planner shall be notified within seven days of mitigation installation to schedule an installation inspection. This inspection is required prior to final building inspection of the building permit.
This child permit condition puts the project on the County’s radar. It creates the necessary physical files associated with the project, and adds the project to the database. It ensures that mitigation is implemented by sending an email notices that triggers an installation inspection. Once an inspection is requested, county staff visit the site for conformance with the approved mitigation plan. The planner then issues a field inspection report. Once the project has passed inspection, the County requires the applicant to submit an “As-Built” report that gives the County a baseline document for comparison with future monitoring reports. An As-Built report typically includes:
A short narrative of the project and the goals;
A species list and number of plants that were installed;
The date the planting was complete; and
Photo documentation.
Once an As-Built report is submitted and approved, staff starts the “monitoring clock”. Permit Effectiveness Monitoring A typical mitigation project has a five-year monitoring period. Island County uses a number of tools for monitoring. For example, permit conditions include annual reporting requirements. A typical condition with mitigation associated permits states “Annual monitoring reports shall be submitted to Island County Planning and Community Development by October 31st for a period of five years”. Staff use monitoring reports and periodic inspections to compare current conditions with the As-Built report, determine if projects are meeting their performance standards, and trigger periodic permit inspections. The County then uses information gathered from these activities to adaptively manage projects that aren’t meeting their performance standards by working with the landowner, and/or enforcing permit conditions when necessary. Final inspections are similar in scope to installation inspections. Staff use them to verify that performance standards have been met. If standards have not been met, the inspection is used to identify problems, implement revisions, and continue to monitor, if needed.
29 Planners create a “child” permit to generate notices for monitoring implementation after the “parent” permit with conditions has been issued and closed out.

Chapter 7: Monitoring and Adaptive Management of Critical Areas Regulations 29
Funding Mitigation implementation and effectiveness monitoring is mostly funded through the permit fee system. When someone submits for a Reasonable Use Determination Permit (RUD) they have to pay not only the base permit fee(s), but also $100 for each year of monitoring that is required for the mitigation project. Projects typically span five years. Therefore, applicants are required to pay $500 (sometimes more if the project needs additional years). 4. Determine the Monitoring Time Frame Staff monitoring and adaptive management of permit implementation and effectiveness is ongoing. No reports have been generated to date. 5. Evaluate Results and Make Recommendations The County has not been monitoring long enough to have comprehensive results for evaluation. However, early results have revealed difficulties with implementation of planning requirements, and plant mortality. Challenges with the database have also been identified.
Island County Wetland Monitoring and Adaptive Management
Program
1. Determine the Reasons for Monitoring Island County adopted the Wetland Monitoring and Adaptive Management Program (WMP) in 2008 as part of its critical areas ordinance update.30 The program assesses and monitors changes in wetland “health” to evaluate the effectiveness of the critical areas regulations in protecting wetlands health. It requires compliance assessment when thresholds of decline in wetland health are met. It is used to resolve non-compliant uses or initiate legislative changes to the critical areas ordinance. The Island County Code specifically states:
Purpose. The primary purpose of the county's wetland monitoring program will be to determine the overall health of a wetland. To do so, the county will track both chemical indicators through measuring water quality and biological indicators by sampling wetland vegetation. These measures will be used to evaluate the effectiveness of county regulations.31
30 ICC 17.02A 31 ICC 17.02A.080.A

Chapter 7: Monitoring and Adaptive Management of Critical Areas Regulations 30
2. Establish Key Objectives and Study Questions The County has identified three key study questions and objectives for the program:
Question: What is the status of wetland health in Island County? o Objective: Determine wetland health through baseline sampling
Question: Is wetland health changing? o Objective: Track wetland health through monitoring.
Question: Is Island County’s critical areas ordinance effectively protecting wetlands? o Objective: Evaluate the effectiveness of critical area regulations through compliance
assessment where declines are found. 3. Design the Monitoring Program The program was designed as follows:
Conduct baseline monitoring from 2008 - 2012.
Conduct monitoring to assess change from 2013 - 2017.
Initiate adaptive management actions where thresholds of decline are met.
Contributing Area Category
Dominant Land Use in Contributing Area
Buffer Width and Degree of Intrusion
1 Forested >100 feet forested
2 Forested Slight buffer intrusion (75-100 feet)
3 Forested Moderate to intense intrusion (0-75 feet forested buffer)
4 Ag or Developed > 100 feet
5 Ag or Developed 75-100 feet
6 Ag or Developed Moderate to intense intrusion (0-75 feet forested buffer)
Wetlands Sampling Selection
The County chose a sample size of approximately 60 wetlands with approximately 15 wetlands sampled annually. Wetlands were selected to represent a range of contributing areas, buffer widths, and levels of intrusion. The parameters for sampling vegetation (herbaceous) were percent cover of non-native species, percent cover of native species, and species richness (diversity of species). The water quality parameters were dissolved oxygen, fecal coliform, nitrate, pH, phosphorus, temperature, turbidity, conductivity, and hardness.

Chapter 7: Monitoring and Adaptive Management of Critical Areas Regulations 31
4. Determine the Monitoring Time Frame As previously noted, the county monitored baseline conditions for four years, then conducted monitoring over the next four years to assess change. Change is analyzed at five-year intervals. The code requires the County to produce reports, including all baseline monitoring data, summary statistics, an assessment of the accuracy and completeness of the data, and a description of data collection issues, if any, identified during the reporting period as well as the following additional information:
A description of any identified trends and all compliance assessments and source identification actions taken during the reporting period.
A description of educational outreach actions as well as enforcement actions taken during the reporting period.
A discussion of wetland monitoring priorities for the next reporting period.
A description of enforcement actions relating to wetlands.
A summary characterization of wetland health and the effectiveness of CAO regulations in implementing comprehensive plan goals and policies for wetlands.32
The County completed four years’ worth of baseline data collection and four years’ worth of monitoring, concluded in 2017. 5. Evaluate Results and Make Recommendations The thresholds for adaptive management are set out in the code:
Greater than 10 percent increase in percentage cover of non-native species
Greater than 10 percent increase in percentage change in species richness
“Signficant elevation of water quality contaminants”33 Adaptive management actions identified as a result of exceeding these thresholds are:
Compliance assessment/Source identification
Education/Voluntary compliance
Enforcement
Modification of critical area regulations While the County has completed five years of baseline data collection and five years of monitoring, adaptive management actions are on hold while the County assesses the need for revisions to the WMP. The County has identified a number of challenges to implementation of the program. These include staff turnover, inconsistencies in data collection, and inconsistent access to monitoring sites that require willing landowners. The County has also had challenges with environmental conditions. Seasonally dry wetlands are difficult for conducting water quality sampling. Some wetlands have little herbaceous vegetation. There have been changes in hydrology. And there have been issues with distinguishing between natural change
32 ICC 17.02A.080.G 33 ICC 17.02!080.B.5

Chapter 7: Monitoring and Adaptive Management of Critical Areas Regulations 32
versus change resulting from land use practices. Finally, this has been a time and resource-intensive program with limited staff and resources to devote. Future recommendations for modifying the WMP include:
Taking a watershed approach to monitoring instead of analyzing individual wetlands. This would be less time intensive, would allow the county to analyze larger tracts of land, and would provide more holistic data representative of larger ecosystems;
Focusing on the Surface Water Management Plan and incorporating wetland compliance in priority watersheds; and
Using High Resolution Change Detection to monitor vegetation loss remotely instead of on the ground.
Island County Surface Water Quality Monitoring
1. Determine the Reasons for Monitoring Island County’s impetus for monitoring surface water quality is to determine whether exemptions to the critical areas regulations (e.g., existing and ongoing agriculture) and permitted uses are adversely affecting critical areas.34 The Island County Code specifically states:
Purpose. The primary focus of the county's water quality monitoring program is to detect and respond to potential sources of contamination of surface water that are adversely affecting critical areas. The sources of concern are primarily non-point source contaminants from uses allowed in the rural area of the county.35
The Island County surface water quality monitoring program establishes baseline water quality and trends. The County uses the program to detect water quality impairments, and to initiate compliance assessment, source identification, and other adaptive management actions to address water quality impairments. 2. Establish Key Objectives and Study Questions The County’s surface water quality monitoring program establishes the following questions:
Are permitted and exempt uses (e.g., agriculture) adversely affecting critical areas?
Are water quality standards being exceeded?
What are the sources of surface water contamination?
Are exceedances attributable to non-compliance with the critical areas ordinance?
Are site-specific modifications to Best Management Practices (BMPs) or legislative changes to the critical areas ordinance needed to address water quality impairments?
34 ICC 17.02.040.L 35 ICC 17.02.040.L.1

Chapter 7: Monitoring and Adaptive Management of Critical Areas Regulations 33
3. Design the Monitoring Program The County has established a baseline for water quality monitoring, and it has initiated adaptive management actions where water quality exceedances are identified. The County has established sampling the following parameters with standards and thresholds, and is tracking them for trends:
Dissolved oxygen
Fecal coliform
Nitrate
pH
Phosphorus
Temperature
Turbidity 4. Determine the Monitoring Time Frame Island County began monitoring surface water quality in 2006. The program is ongoing. 5. Evaluate Results and Make Recommendations The results of baseline water quality monitoring are used to prioritize watersheds for future monitoring and adaptive management actions in an effort to resolve water quality exceedances. The County has the ability to initiate a number of adaptive management actions based on water quality data. They include:
Compliance assessment and source identification
Education
Enforcement
Site specific changes to BMPs for existing and ongoing agriculture
Modification of the critical areas ordinance
King County
King County has also done monitoring of their critical areas ordinance under GMA and Puget Sound shoreline under SMA. For more information, see Critical Areas Ordinance Monitoring36, WRIA 9 Marine Shoreline Monitoring and Compliance Pilot Project37, and Improving Environmental Outcome: An Evaluation of Compliance and Recommendations for Improvement38. Commerce hopes to add more detailed case studies on King County’s work in future iterations of this chapter.
36 https://www.kingcounty.gov/depts/dnrp/wlr/sections-programs/science-section/critical-areas.aspx 37 https://www.kingcounty.gov/services/environment/watersheds/central-puget-sound/nearshore-environments/shoreline-monitoring.aspx 38 http://www.govlink.org/watersheds/8/committees/1003/KCPermitComplianceMasterReport-COMPLETE.pdf

Chapter 7: Monitoring and Adaptive Management of Critical Areas Regulations 34
City of Kirkland Shoreline Tracking The City of Kirkland tracks shoreline permits and exemptions, building permits, and enhancement projects to ensure compliance with Shoreline Master Program permit conditions and maintain an ongoing record of shoreline changes.
1. Determine the Reasons for Monitoring
Kirkland adopted a new Shoreline Master Program (SMP) in August 2010 that covers approximately 10 miles of Lake Washington shoreline. The City wanted to track how the program is achieving “no net loss of ecological functions.” The City also wanted to develop useable data to track successes and failures, as well as meet Ecology periodic review requirements.
2. Establish Key Objectives and Study Questions
Key study objectives and questions are:
Data collection: What are all the values, figures, and other possible data the City may want to collect?
Goals: What are the short-term and long-term goals the SMP codes are intended to achieve?
Purpose and Intent: Do the figures being collected capture the required information to show whether or not the City is maintaining ecological function and following the purpose and intent of the SMP?
Administration: Can code administrators apply the code and collect the data without being unnecessarily burdened?
Build consensus: Will the data be useful in future discussions with citizens, council, or commission members?
3. Design the Monitoring Program
The key question is how SMP requirements are being met. The city maintains checklists for key indicators of ecological function. For example:
Shoreline stabilization: How many linear feet of hard shoreline have been added, removed, repaired, or altered? Was a geotechnical report and needs assessment required. How much “soft stabilization” was added, removed, or used to replace hard structures?
Shore setbacks: How many square feet of structures have been removed from shore setbacks through mitigation?
Overwater structures: How many new piers or docks were added? How much new grating has been installed?
Vegetation: How many trees were removed, retained, planted for mitigation? How many square feet of lawn have been replaced with native plants?
In-water enhancement projects: Are spawning gravels added? Have structures been removed?
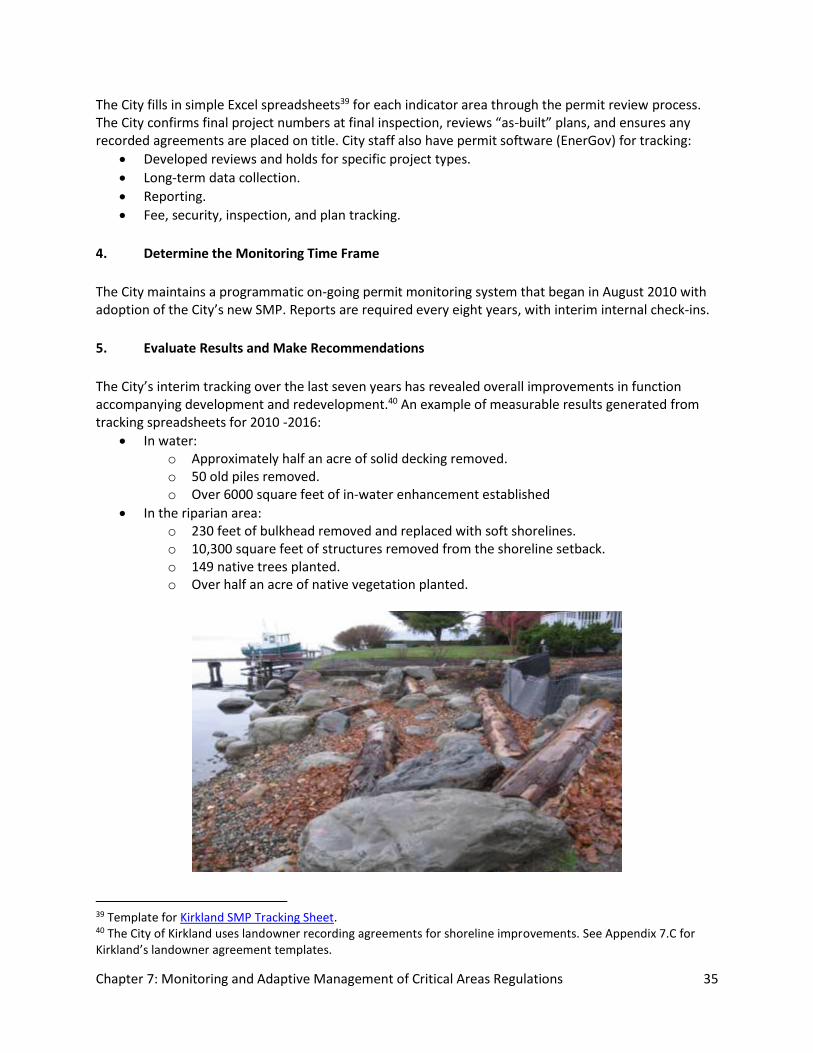
Chapter 7: Monitoring and Adaptive Management of Critical Areas Regulations 35
The City fills in simple Excel spreadsheets39 for each indicator area through the permit review process. The City confirms final project numbers at final inspection, reviews “as-built” plans, and ensures any recorded agreements are placed on title. City staff also have permit software (EnerGov) for tracking:
Developed reviews and holds for specific project types.
Long-term data collection.
Reporting.
Fee, security, inspection, and plan tracking.
4. Determine the Monitoring Time Frame
The City maintains a programmatic on-going permit monitoring system that began in August 2010 with adoption of the City’s new SMP. Reports are required every eight years, with interim internal check-ins.
5. Evaluate Results and Make Recommendations
The City’s interim tracking over the last seven years has revealed overall improvements in function accompanying development and redevelopment.40 An example of measurable results generated from tracking spreadsheets for 2010 -2016:
In water: o Approximately half an acre of solid decking removed. o 50 old piles removed. o Over 6000 square feet of in-water enhancement established
In the riparian area: o 230 feet of bulkhead removed and replaced with soft shorelines. o 10,300 square feet of structures removed from the shoreline setback. o 149 native trees planted. o Over half an acre of native vegetation planted.
39 Template for Kirkland SMP Tracking Sheet. 40 The City of Kirkland uses landowner recording agreements for shoreline improvements. See Appendix 7.C for Kirkland’s landowner agreement templates.
Chapter 7: Monitoring and Adaptive Management of Critical Areas Regulations 36
Annual evaluations of the interim tracking results have been used to make sure project data has been
properly entered and checked on accuracy. For example:
Individuals entering data have helped in clarifying the fields in the Excel spreadsheet.
Inclusion of data in the EnerGov software tracking system.
Modification of the spreadsheet at varying intervals to make sure data is clear and measurable.
The final eight-year results in 2019 will generate a work program, and long-range and current planning coordination. Recommendations for adaptive management will address:
Review of code administration – administrative recommendations based on internal staff review include:
o Are we achieving the key objectives and study questions? o What internal steps are working or could be improved to maximize compliance with the
purpose and intent the SMP and SMA? o Have we installed any roadblocks to educating the public on the benefits of a healthy
shoreline? o Are there any ways to incentivize additional shoreline enhancements? Are there any
roadblocks to homeowners to propose voluntary shoreline enhancement plans?
Update of tracking system. Are our permit processes helping or hindering the recording of this data?
Possible code amendments.
Report results.
One key to the City’s success with this program is that the planner who led the 2010 SMP update developed the monitoring and adaptive management program.
City of Bainbridge Island Shoreline Monitoring Program
1. Determine the Reasons for Monitoring Both Bainbridge Island elected officials and community members had an interest in monitoring efforts to collect recent, local, and scientifically appropriate data with which to review and assess the effectiveness of the City’s SMP. Planning staff developed an SMP monitoring program based on City Council direction in April 2015. While there has been little implementation of the program to date due to lack of staff time and funding, lessons learned will be useful for the critical areas ordinance update. This case study focuses on how the SMP monitoring program was envisioned and planned to work. The primary goals of the SMP monitoring program include:
Meet regulatory requirements.
Document compliance with SMP regulations.
Quantify and characterize environmental change in the shoreline.
Expand knowledge and understanding of SMP goals, policies, and regulations.
Establish a common understanding of shoreline resources and regulatory framework.
Provide feedback for the next SMP update.

Chapter 7: Monitoring and Adaptive Management of Critical Areas Regulations 37
2. Establish Key Objectives and Study Questions The monitoring program was designed to help answer several key questions:
Is effective compliance with SMP regulations being achieved?
Are gains or losses of ecological functions and processes occurring in the shoreline environment?
If losses are occurring, what are the drivers?
What are the programmatic and/or regulatory adjustments needed to achieve no net loss of shoreline functions and processes?
3. Design the Monitoring Program
The monitoring program was designed based upon a series of general steps:
Conduct extensive research and discussion by the City’s Environmental Technical Advisory Committee and others.
Convene a peer workshop with shoreline research and regulatory professionals for review and refinement.
Gather input from shoreline, monitoring and outreach experts.
Develop a specific monitoring strategy.
Gain Council acceptance.
Develop a first-year program. The monitoring program is designed to measure a number of shoreline functions, including:
Eelgrass and kelp - Monitoring important nearshore subtidal habitats.
Intertidal beach sediment supply, sediment distribution, and shoreline position - monitoring critical habitat for juvenile salmonids, forage fish, shellfish and eelgrass, including changes to major shoreline features.
Marine riparian vegetation – monitoring shading, and food supply to the nearshore.
Water quality – Monitoring for adequate water quality for fish and nearshore resources.
Estuarine emerging vegetation (salt marsh) – monitoring for changes in critical salt marsh habitats.
The monitoring program includes two types of monitoring that will provide data to inform adaptive management actions. In general, implementation monitoring is intended to (a) capture and track permit activity; and (b) ensure compliance with permit-level mitigation measures and performance standards. Status and trend monitoring is intended to monitor change in established ecological parameters.

Chapter 7: Monitoring and Adaptive Management of Critical Areas Regulations 38
Monitoring Approach Monitoring results will inform an adaptive management process aimed at improving both regulations and program implementation as needed. 4. Determine the Monitoring Time Frame The monitoring program was initiated in 2015, and was planned to extend through the City’s next SMP update in 2020. Year 1 was to conclude at the end of 2015. Monitoring results were to inform the City’s next SMP update, due in 2020. The first year of funding was anticipated to include only allocation/dedication of current planning staff. Subsequent years would require additional funding dependent on the results of Year 1 and recommendations for adaptive management and program growth. 5. Evaluate Results and Make Recommendations As of early 2018, some activity has occurred. LiDAR data and air photos had been collected and converted to land use/land cover data through a WDFW grant. A DNR eelgrass monitoring effort has expanded the scope of data collection to include the south shore of the island. The City is exploring a potential partnership with the Western Washington University Huxley College of the Environment in Poulsbo. The City is developing a permit tracking framework to capture project data consistent with typical impacts as outlined in its Single Family Residence Shoreline Mitigation Manual: vegetation removal, new impervious surface area, placement of fill, and new overwater structure coverage.

Chapter 7: Monitoring and Adaptive Management of Critical Areas Regulations 39
Bainbridge Island has learned a number of lessons from this effort:
Motivation and funding is limited when there is no mandate.
Scientists and planners need to collaborate on the feasibility of data collection and database management.
It is important to look for all available resources (e.g., other ongoing monitoring efforts, and grant and partnership opportunities).
It is difficult to develop a permit tracking system “after the fact”.
It is important to consider how permit tracking will occur when writing code.
Permit tracking expectations for staff at “onboarding” need to be developed.
It may be more effective to have dedicated staff for compliance monitoring. The effort informed the City’s update of its critical areas regulations. It has created a minor critical area permit for tracking/monitoring purposes. Previously, many activities within critical areas were not captured. There was no review, or review in conjunction with clearing or building permits. There is no fee or intake appointment required, and it often can be approved at the counter. In addition, the City is setting up a permit database to begin tracking as of the effective date of its newly updated critical areas ordinance. Planning has added a new critical areas review workflow step, attaching it to the “parent permit” where possible to streamline the process while still being able to track the permit. The planner must enter critical area project details (e.g., area of wetland buffer reduction, area of buffer mitigation) before a permit can be closed out of the system, which allows the City to generate reports on permitted activities within critical areas.
Bellingham Critical Areas Permit Implementation and
Effectiveness Monitoring
1. Determine the Reasons for Monitoring The City of Bellingham monitors critical areas through permits but also for its own restoration projects in critical areas and shorelines because Bellingham places a high value on the environment. The City has not only adopted a critical areas ordinance (CAO) but has adopted goals and policies aimed specifically at protecting and restoring critical areas. These goals and policies are part of the Environment Chapter (Bellingham Comprehensive Plan) and are also reflected in Bellingham’s “Legacies”, the long-term goals adopted by the City Council in 2009. Together these form the foundation that supports the monitoring, protection, and restoration of critical areas. Two of the key Legacy goals are: protect and improve the health of lakes, streams and Salish Sea; and protect and restore ecological functions and habitat

Chapter 7: Monitoring and Adaptive Management of Critical Areas Regulations 40
The regulatory protections embodied in the CAO are the foundation of critical area permit conditions, and they sprout from the purpose section of the CAO. One such purpose: Prevent cumulative adverse environmental impacts to water quality, wetlands, and fish and wildlife habitat, and the overall net loss of wetlands, frequently flooded areas, and habitat conservation areas.41 2. Establish Key Objectives and Study Questions The City regularly monitors critical areas permits (shoreline permits are not discussed here specifically but monitoring is similar). The key objective of monitoring is to determine if the mitigation is meeting goals, objectives, and performance standards that are based on code requirements (i.e. should result in no net loss of functions and values). The required annual monitoring report indicates if maintenance has occurred and lists the deficiencies so that the City can require corrections before any financial surety is released annually. In addition, monitoring provides new evidence for adaptive management. For mitigation, it tells staff what is working and not working with regard to plants, techniques, timing, etc. For general monitoring, it can help prioritize restoration actions or determine when restoration will not yield ecological lift. 3. Design the Monitoring Program The City has mapped and characterized many of its critical areas, and this GIS mapping (called “CityIQ”) greatly enables monitoring. GIS staff map each wetland delineation received as part of a development application and these are layered on top of past citywide wetland inventories giving the public and staff a good planning tool. Knowing where critical areas are is essential to being able to monitor them. A
41 BMC 16.55.010D(4)

Chapter 7: Monitoring and Adaptive Management of Critical Areas Regulations 41
good example of the City’s mapping and characterization is the 2015 Habitat Restoration Technical Assessment in which four habitat types—wetlands, forest, meadows, streams—were assessed for ecological function and rated for restoration potential. These “road maps” enhance monitoring done for a variety of reasons and from a variety of funding sources. Some monitoring is done because of adopted total maximum daily loads (TMDLs), some because of strong community interest, and others because it is a piece of a robust stream and marine restoration program. The city also monitors on a systematic level all critical area and shoreline permits.
Permit-based monitoring starts with critical area permits written with a list of legal “findings and conclusions” on which the permit conditions are based. One of the standard conditions requires a minimum of five consecutive years of monitoring and maintenance. In addition to monitoring (and maintenance) the applicant is required to submit a financial surety based on a line-item estimate of all mitigation costs multiplied by 150 percent. The financial surety is held for a minimum of five years and released annually only when the performance standards for mitigation are met as described in the annual monitoring report. All critical areas remaining onsite, such as wetlands, streams, and their buffers, are protected in perpetuity through a recorded conservation easement that is added to the City’s GIS layer. Tracking permits and permit conditions is done through TRAKiT, the City’s permit software program. Staff also uses an Excel spreadsheet to track monitoring status for each monitoring year for all critical area and shoreline permits. The city monitors its own restoration projects, such as the “Whatcom Creek Red Tail Reach”, a major stream channel improvement project. Monitoring this restoration project will use high-resolution change detection in order to monitor the ecological changes after restoration. The City also has access to drone technology for such projects. Monitoring permittee mitigation is part of the permit staff’s job, so permit fees fund the work in part. Funding for city-sponsored restoration projects comes from a variety of sources, including grants and a settlement fund from the 19999 Whatcom Creek fire. 4. Determine the Monitoring Time Frame The City has monitored critical area permit mitigation requirements since adopting the first wetland regulations in 1992. However, both tracking and mitigation results have improved with updated permit software tracking, consistent permit writing, improved mitigation plans and implementation, and regulatory tools aimed at mitigation success. Each critical area permit has a monitoring period of five years, or later if the performance standards are not being met. Non-permitted monitoring carried out by the City is ongoing, and in many cases long term. Some examples of annual monitoring are:
Urban Streams Monitoring Program Report since 1989
Lake Whatcom Monitoring Project Report for decades
Great Blue Heron Colony Annual Reports since 2000

Chapter 7: Monitoring and Adaptive Management of Critical Areas Regulations 42
5. Evaluate Results and Make Recommendations The City’s non-permit related monitoring projects have resulted in a broad spectrum of adaptive management. Urban streams monitoring helps prioritize restoration projects aimed at lowering stream temperature. Lake Whatcom monitoring has resulted in new regulations, land acquisition, and major stormwater retrofits because the lake is the City’s sole water supply. A major construction project adjacent to the heron colony was managed to avoid the most vulnerable periods in the nesting season. Permit-related monitoring also results in adaptive management. In updates to the City’s CAO, a number of protection measures have been codified, including the requirement for financial surety for each mitigation project. Adaptive management was put into place when the City started requiring in permits that mitigation plants be installed by specialists, after witnessing failures due to lack of expertise. A small industry of ecological restoration specialists is now established because there is a market for their expertise. A local “wetland study group” composed of wetland biologists and agency staff hold periodic meetings focused on an identified topic. The problem solving and communication have gone a long way to help all who participate in some way with the evaluating and the protecting of critical areas.
Tacoma Critical Area and Shoreline Monitoring Program
1. Determine the Reasons for Monitoring The Growth Management Act and the City of Tacoma’s critical area preservation ordinance require “no net loss” to preserve the existing functions and values of critical areas. The City’s Shoreline Master Program (SMP) policy requires “no net loss” and an overall “net gain” of ecological function, as well as preservation of existing functions and values. The City’s use preferences have a requirement that non-preferential uses maintain vegetated buffers to address net gain. The City’s use preferences require redevelopment or development for uses other than a water-dependent use to maintain a vegetated marine buffer even in areas where the buffer is currently not vegetated. 2. Establish Key Objectives and Study Questions The objectives for permit implementation monitoring are to track compliance with the goals of the CAPO and SMP for each approval. The two permit implementation questions are:
Does the permit provide clear conditions to ensure compliance?
Is the project consistent with the regulations? Permit compliance questions are:
Was the project constructed consistent with the permit? A site visit is conducted to verify construction is in compliance with the permit. Staff look at whether BMPs are installed to minimize impacts, fencing and signage are installed, and notice is recorded on the title.
Was the required mitigation installed? Bonding is required to ensure compliance. Site visits are conducted to verify planting installation complies with As-Built requirements. Site visits are also used to verify annual monitoring reports regarding the percent of plant survival, and to measure and report on compliance with goals and performance standards.

Chapter 7: Monitoring and Adaptive Management of Critical Areas Regulations 43
3. Design the Monitoring Program
Tacoma uses the Accela permitting database for permits and monitoring. The City keeps separate records for each permit approval and for long term monitoring.
Staff use the parent permit to establish the metrics for monitoring impacts and mitigation. They use a child permit to create a separate critical areas monitoring record.

Chapter 7: Monitoring and Adaptive Management of Critical Areas Regulations 44
General Schematic for Monitoring Record
The City has unique compensatory mitigation conditions that are monitored separately. This includes the long-term monitoring of the overall success of vegetation and mitigation performance standards. 4. Determine the Monitoring Time Frame The City monitors on an ongoing basis. Reports can be produced for any time period. However, the City is not currently issuing reports on a regular basis. 5. Evaluate Results and Make Recommendations The City is always monitoring projects to ensure they meet permit requirements. They look at whether mitigation sites are meeting performance standards as required by the permit. If requirements are not being met, staff review whether critical area code requirements are sufficient to ensure protection. Staff also look at whether better enforcement or financial sureties are needed.
Washington State Department of Fish and Wildlife Hydraulic
Project Approvals
The Washington State Department of Fish and Wildlife (WDFW) is monitoring its hydraulic project approval (HPA) program. WDFW’s Year-One Progress Report: Implementation and Effectiveness

Chapter 7: Monitoring and Adaptive Management of Critical Areas Regulations 45
Monitoring of Hydraulic Projects42, February 2015, addresses implementation monitoring for process improvement and effectiveness monitoring for desired habitat conditions. 1. Determine the Reasons for Monitoring WDFW is monitoring its HPA program to help ensure that hydraulic projects are compliant with current rules, and that current rules effectively protect fish habitats. The main purpose of monitoring is to provide information that, over time, helps the department improve both implementation of the hydraulic code rules and the effectiveness of those rules at protecting fish life. 2. Establish Key Objectives and Study Questions The focus of WDFW’s implementation monitoring is on improvement of the performance of both WDFW as the permittor, and permittees (applicants). In 2013 WDFW limited the scope of its monitoring to new and replacement culverts on fish-bearing streams in western Washington and new and replacement marine shoreline armoring in Puget Sound. The study asked four key questions:
Did the permittor issue a complete permit, that is, one that contains provisions and/or project plans for all critical structural dimensions?
Did the permit or application materials contain the information needed to determine consistency with Chapter 220-660 WAC?
Did the permittee comply with the permit?
Does the completed hydraulic project comply with the hydraulic code rules? 3. Design the Monitoring Program In 2013 WDFW conducted implementation monitoring on 54 culverts in Western Washington. Implementation monitoring focused on four critical structural dimensions: culvert width at streambed, culvert slope, countersunk depth at outlet, and culvert length. The department also estimated bankfull width at each site. The 2013 monitoring attempted to answer two questions about the HPA permitting process: 1) Did permittees comply with their HPA permits; and 2) Did hydraulic structures comply with hydraulic code rules? 4. Determine Monitoring Time Frame The monitoring study is ongoing. The one-year progress report was issued in February 2015, and results from 2014 and 2015 will be available in July 2017. 5. Evaluate Results and Make Recommendations Key findings from monitoring culverts were:
The most important parameter for culvert design is channel width. Yet, it appears that many permittees do not know what they should be measuring or how they should be measuring it.
A significant proportion of HPA permits lacked information necessary to determine whether the culvert’s dimensions will be consistent with rules and/or design guidelines.
Basic information essential to the HPA process was difficult to find in the permit, plans, Joint Aquatic Resources Permit Application (JARPA), and other materials submitted by the applicant.
42 https://wdfw.wa.gov/publications/01746/

Chapter 7: Monitoring and Adaptive Management of Critical Areas Regulations 46
The permittee compliance rate for the four critical structural dimensions was 76 percent.
The permit accordance rate – number of permits that are in accordance with the hydraulic code rules – varied greatly and was found to be unreliable. The lack of a widely accepted, standard procedure for measuring channel width is the likely cause of the variance. There was a discrepancy between the rate of permittee compliance with the HPA permit (76 percent) and the permit accordance rate (50 percent). Accordance with the rules is the responsibility of the permittor issuing the permit. The size of this discrepancy may be largely due to different methods for estimating channel width as noted above.
Recommendations and follow up from the report:
Language referring to stream channel width should be identical in hydraulic code rules, permit provisions, and culvert design guidelines.
Standard procedures for estimating mean bankfull width and channel slope should be developed by WDFW and widely distributed for use by HPA applicants. The WDFW Habitat Program Science Division is currently developing these procedures.
Key information – such as bankfull width, channel slope, culvert design type, and culvert dimensions – should be reported and easy to find. We recommend a mandatory form for all HPA applications to be completed by the applicant. Standard permit provisions effective July 1, 2015, now require this information.
WDFW or some other credible organization should check bankfull width measurements submitted by HPA applicants. Habitat biologists are now encouraged to confirm all information contained in the plans for fish passage culverts.
For no-slope culverts, WDFW or some other credible organization should check channel slope submitted by HPA applicants. Habitat biologists are now encouraged to confirm channel information contained in the plans for fish passage culverts.
Standard permit provisions for culverts used by WDFW habitat biologists should be reviewed for consistency with hydraulic code rules and design guidelines. Standard permit provisions effective July 1, 2015, were reviewed for consistency with Chapter 220-660 WAC.

Chapter 7: Monitoring and Adaptive Management of Critical Areas Regulations 47
State and Federal Mitigation Monitoring Programs If local governments are also interested in compliance monitoring, two examples from Ecology and the U.S. Army Corps of Engineers are provided.
Washington State Department of Ecology Wetland Regulatory Effectiveness Program The Washington State Department of Ecology (Ecology) performs compliance reviews of compensatory wetland mitigation projects (i.e., when wetlands are replaced to mitigate for unavoidable fill) to ensure compliance with wetland permit conditions.43 1. Reasons for Monitoring Compliance The goal of compliance is to improve the success rate of wetland mitigation projects, ensure that wetland mitigation is implemented according to permit conditions, and to work collaboratively with applicants to achieve compliance and success at individual sites. At each site, the goal is to identify problems with wetland mitigation sites early, and determine corrective actions and adaptive management necessary to ensure a successful mitigation site. The compliance program was developed after a series of evaluations between 2001 and 2003 found mitigation projects were not consistently replacing wetland acreage and functions, and compliance tracking and follow-up was incomplete and sporadic.
2. Key Program Questions/Objectives
The wetland mitigation compliance program’s priority is wetland mitigation projects where Ecology issued a Section 401 Water Quality Certification or Administrative Order for wetland impacts. Key questions include:
Are compensatory mitigation sites meeting goals, objectives and performance standards?
Are sites being maintained? Are site conditions improving over time after initial construction?
Are sites meeting acreage requirements for wetland and buffer? 3. Monitoring Program Design The program is ongoing. From 2004 – 2016, the program tracked 220 projects with permittee-responsible mitigation requirements, and 60 projects using alternative mitigation such as mitigation bank credits, advance mitigation, or in-lieu fees. Ecology provides recommendations in formal follow-up letters from site inspections; reviews reports (as-built and monitoring reports), tracks deadlines, and ensures reports have complete information per Ecology’s Order.
43 https://ecology.wa.gov/Water-Shorelines/Wetlands/Mitigation/Compliance

Chapter 7: Monitoring and Adaptive Management of Critical Areas Regulations 48
The program includes site inspections at several stages: “As-built” stage, after the mitigation project is first completed; midway through the monitoring period; and at project closeout (typically 10 years). At closeout, the site inspection informs whether the site has met its goals, objectives, and performance standards. 4. Monitoring Program Time Frame This is an on-going program that began in 2006. Ecology prepared reports to the Washington State Office of Financial Management on two basic performance measures:
Within 2 years of permit issuance, determine the status of 100 percent of wetland mitigation projects.
For at least 75 percent of wetland mitigation projects, conduct a site inspection within 18 months of receipt of the “as-built” report (i.e., a site visit should be conducted soon after the project is complete).
5. Evaluation of Results and Recommendations The wetland mitigation compliance team has identified numerous benefits to date, including:
Ecology finds an increase in voluntary compliance because applicants know there is oversight (less time needed checking up on every project)
Key to the improvements is the ability to work with applicants early to address issues that would result in site failure. It is essential to have the consultant or applicant on-site during site reviews. Early follow-up is important.
Mitigation plans need to have well thought-out goals, objectives, performance standards, monitoring, and contingency plans to begin with. However, evaluations must also be flexible and acknowledge that sites are not always going to turn out as planned.
Coordination between regulatory agencies including the U.S. Army Corps of Engineers and local governments is vital.
The evaluation program created a feedback loop to improve permitting decisions – lessons learned during site visits can be applied to review of current mitigation proposals. The results of the compliance program have improved consistency and predictability through better standardized requirements (401 conditions, requirements for plans)
The program has helped target improvements needed in guidance and training.
U.S. Army Corps of Engineers Mitigation Compliance Program
1. Reasons for Monitoring Compliance There are multiple goals for this program, including
Protect human health and safety by ensuring permit conditions are being met.
To work toward no net loss of aquatic function, wetland acreage, or river/stream miles.
To level the playing field by ensuring that everyone complies with their respective permit conditions equally.
To improve the permitting process by closing the feedback loop between what impacts and mitigation are permitted and how effective and efficient that mitigation is over time at replacing lost functions and values.

Chapter 7: Monitoring and Adaptive Management of Critical Areas Regulations 49
2. Key Program Questions/Objectives Compensatory mitigation for Section 10 permits might include riparian planting, bulkhead removal, pocket beach creation, removal of old pilings, other structures, or debris, and more. Compensatory mitigation for Section 404 permits includes wetland or stream creation, restoration, enhancement, and/or preservation. This program looks at permittee-responsible mitigation. Compliance for mitigation banks and in-lieu fee programs is handled separately. The three key questions are:
Was the mitigation installed according to the approved drawings and plans?
Is the mitigation meeting performance standards? If not, what contingency actions must occur to bring the site into compliance with performance standards?
Has the required documentation been submitted, such as proof of site protection mechanisms?
3. Compliance Monitoring Program Design With hundreds of projects permitted each year that require compensatory mitigation, Corps staff prioritizes projects for compliance reviews. Various factors go into prioritization, including project size, complexity, location, and history, the rareness of the resource impacted, and others. Corps staff coordinates with the Washington State Department of Ecology Wetland Regulatory Effectiveness Program staff, as time allows, to share information and avoid overlap of efforts. Corps staff reviews and approves compliance documents such as as-built reports, monitoring reports, and proof of site protection mechanisms such as deed recordings and protective easements. Corps staff also conducts compliance inspection site visits. Recommendations are provided in emails and letters following reviews and inspections. 4. Monitoring Program Time Frame Compliance has been ongoing since the inception of the Regulatory Program. However, wetland and stream mitigation started in the mid-1980s, and in 2008. With the implementation of the Federal Mitigation Rule, compliance efforts have increased. 5. Evaluation of Results and Recommendations The Corps’ compliance program has varied over the years. The Corps has hired contractors or term staff to complete compliance reviews but its compliance program mainly is the responsibility of project managers. The Corps does not have a permanent compliance team that evaluates the compliance program’s effectiveness or develops recommendations. Instead, as workload allows, project managers meet together and discuss compliance issues, failures, and successes, and internal protocols are developed to improve the effectiveness of the compliance program.

Chapter 7: Monitoring and Adaptive Management of Critical Areas Regulations 50
Data Resources for Implementation Monitoring Local governments and state agencies generate data that may be useful to local governments for implementation monitoring. One local government example and some state data collection programs are provided here.
Local Government Permit Databases or Spreadsheets Many local governments maintain a permit tracking database or spreadsheet. Some sort of permit tracking system is essential for monitoring permit implementation. It need not be complex, and can be as simple as maintaining a spreadsheet. For one example based on the City of Kirkland’s tracking program that uses an Excel spreadsheet, click here.
City of Kirkland Shoreline Tracking

Chapter 7: Monitoring and Adaptive Management of Critical Areas Regulations 51
Washington Department of Fish and Wildlife High Resolution Change Detection WDFW has produced a spatial dataset (GIS layer), High Resolution Change Detection, that shows where change has occurred over a two-year period.
WDFW High Resolution Change Detection The minimum size of change is 0.05 acres. The data has been developed for Puget Sound as follows:
2006 – 2009
2009 – 2011
2011 – 2013 WDFW is currently seeking funding for 2013 – 2015. For more information, go to WDFW’s web site at High Resolution Aerial Imagery Change Detection.
Washington Department of Natural Resources LiDAR The Washington State Legislature mandated that the Department of Natural Resources (DNR), Washington Geological Survey collect, analyze, and publicly distribute detailed information about our state’s geology using the best available technology, Light Detection and Ranging (LiDAR). The main focus of this new push for LiDAR collection is to map landslides, but there are innumerable additional benefits and applications of these data both inside and outside of the field of geology. For more information about DNR’s LiDAR program, go to the LiDAR web site.

Chapter 7: Monitoring and Adaptive Management of Critical Areas Regulations 52
Department of Ecology Wetland Change Analysis Ecology’s Wetland Change Analysis project developed a method for more accurately mapping wetlands. The resulting wetland maps will be used as a wetlands status and trends inventory to help determine if the goal of No Net Loss of wetlands is being achieved in Washington State. For more information on wetlands change analysis and the Wetland Inventory Map, go to Ecology’s Wetland Change Analysis web site.
Department of Ecology Environmental Information Management Ecology maintains an Environmental Information Management (EIM) database. The database contains data collected by Ecology and affiliates such as local governments and cleanup sites. Users can submit and access discrete and time-series environmental data for air, water, soil, sediment, aquatic animals, and plants at the EIM web site.
Ecology and Federal Emergency Management Agency Risk MAP Ecology partners with the Federal Emergency Management Agency (FEMA) to run the Risk Mapping, Assessment and Planning (Risk MAP) program in Washington. This program delivers high-quality data, risk assessment tools and mitigation expertise to communities, tribes, and State and local agencies in their efforts to reduce the risks from natural hazards including floods, earthquakes, wildfire and landslides. Washington information can be accessed at the Ecology Risk MAP web site.
Critical Areas Monitoring and Adaptive Management Workshops Commerce, Ecology and WDFW conducted a series of workshops around the state in early 2018 to provide tools for and get feedback from counties and cities on how to build local and state monitoring and adaptive management programs for protecting critical areas. Over 230 people have participated, with positive reviews. The local government and other presentations generated rich conversations around the barriers and solutions to developing and implementing effective monitoring programs. Many of the local government presentations are included in the case studies in this chapter.
Benefits of Monitoring
Participants identified many benefits to monitoring and adaptive management of critical areas regulations. Monitoring provides certainty by ensuring regulations are being implemented consistently.

Chapter 7: Monitoring and Adaptive Management of Critical Areas Regulations 53
It provides data rather than anecdotes. Monitoring data educates the public, applicants, and elected officials about efforts to protect critical areas. It provides area-wide trend data about progress on no net loss. Monitoring the permit process and tracking performance standards and mitigation identifies areas for improvement. Monitoring provides information to update the critical areas inventory and status. It creates consistent application of the regulations over time, and can lead to code clarifications and improvements. The results inform the inter-relatedness of regulations and cross-team improvements.
Challenges of Monitoring
Conversations about barriers identified common concerns such as lack of staff resources and funding. Changes in leadership and staff contribute to inconsistent application of the regulations. Balancing diverse community interests such as jobs and the environment, as well a lack of political will, creates implementation challenges for staff. Changing state mandates make it difficult to keep the code updated. Many expressed a general frustration with database challenges of sorting, monitoring, and transferring information. Baseline data is lacking, and there are delays in acquiring data from other departments or agencies. Other challenges were the loss of institutional knowledge, concerns with private property rights, and discrepancies between jurisdictions.
Problem Solving – Peer Consultation
Participants discussed challenges they are facing or might face in starting a monitoring program, and discussed with their peers on how they might address those challenges. With respect to staff and resource issues people discussed:
Copying another jurisdiction’s system;
Conducting collective monitoring for an area;
Working with Ecology on enforcement issues;
Time investment in a monitoring program with state grants;
Having the state provide technical training and support;
Taking advantage of state tools like HRCD;
State provision of one-stop shops for guidance and data to educate planners;
Charging for monitoring and use performance bonding;
Partnering with conservation districts to leverage resources. Some ideas for addressing issues of political will included:
Communicate the economic functions and values of critical areas, such as fisheries, tourism;
Use monitoring to reduce lawsuits and liability;
Develop partnerships with the state, federal agencies, and tribes to provide political support and help communicate the message.

Chapter 7: Monitoring and Adaptive Management of Critical Areas Regulations 54
Conclusions Monitoring and adaptive management is a logical next step to critical areas protection after years of developing and implementing critical areas and shoreline regulations. All interest groups have a common interest in critical areas permit processes that are transparent, fair and effective. Permit applicants want to be treated fairly. Advocacy groups, whether from an environmental or private property rights perspective, want to know if the process is being applied consistently. Consultants want the opportunity to improve the quality and speed of permits. Tribes that have asserted their treaty rights are at risk from inadequate land use management want to know if the permits are being applied effectively. We can know if we are achieving no net loss only through examining implementation over time. We should proceed with humility, recognizing that there is always uncertainty in the face of the complexity of both natural science and human nature. Curiosity should be our guide – we should be open to trying different approaches. We should respect the perspectives of all involved. The natural resources that we manage have many layers, so we must make sure to build partnerships to take advantage of our different roles and expertise. A feedback loop provides the information a local government needs to determine whether permit requirements are being written consistent with regulations, whether process improvement is needed, or whether staff need training. We hope the information provided in this chapter will help local and state efforts to assess and improve critical areas and shoreline protection permit processes.

APPENDIX 7.A
JEFFERSON COUNTY NO NET LOSS CHECKLIST

JEFFERSON COUNTY DEPARTMENT OF COMMUNITY DEVELOPMENT
Jefferson County No Net Loss Checklist
The purpose of completing this checklist is to show consistency between the policies and regulations in the Jefferson
County Shoreline Master Program and the implications for shoreline ecological functions, as it pertains to the no net
loss (NNL) requirement. This checklist is to be completed by the Planner reviewing the proposal for all development
and use applications within shoreline jurisdiction.
Is the proposal within shoreline jurisdiction? ____ Yes (Complete this form) _______ No (Form not required)
Planner Date
Application Information
MLA # SDP # or Case #
(If case number is used, has the 'Special Conditions tab/Shorelines' been checked in Tidemark? Yes _________________ No _____ )
Applicant Information
Landowner Name _________________________________________________________________________________
Applicant (if different from landowner) _____________________________________________________________________
Representative _____________________________________________________________________________________
Project Information
Project Address _____________________________________________________________________________________
Parcel Number ______________________________ Type of Ownership (if other than Private) __________________________
Proposed Project Description _____________________________________________________________________________
Shoreline Information
Shoreline Type: Marine ___________ River _______ Lake _____
Waterbody Name __________________________________________________ Shoreline Reach ______________________
Shoreline Use (based on Table 18.25.220)___________________________________________________________________
Environmental Designations: Priority Aquatic _____________ Aquatic _________ No in-water components _______
Natural ______ Conservancy _______ Shoreline Residential _________ High Intensity ____
Type of shoreline approval: Shoreline Exemption _____________ Shoreline Substantial Development _______
Conditional administrative ___________ Conditional discretionary ____________ Variance ____
\ PLANNING \GRANTS- Apps & Opportunities \ 2010 EPA GRANTS\ 2010 EPA - Enhanced Shoreline Protection NNL \ Implementation \deliverable 3c apply nnl \nnl checklist final jcc rent 072914.docx 1

PRELIMINARY NNL REVIEW
Answer all Preliminary NNL Review questions on this page. For any 'Yes' responses, also complete the Detailed
NNL Review questions (with the corresponding number 1 through 13) on the following pages.
GENERAL SHORELINE MASTER PROGRAM (SMP) REGULATIONS:
1. Will the proposed project be constructed within a standard shoreline buffer and setback (JCC 18.25.270(4)(e) and
18.25.300(2)(a)) for conforming lots or exceed the provisions of JCC 18.25.270(5) for non-conforming lots?
No ______ Yes ____ (If yes, answer Detailed Review questions on page 3)
2. Will any portion of the proposed project be constructed in a geologically hazardous area, a landslide hazard area
buffer, or a setback for a landslide hazard area or a high-risk channel migration zone (Article V, Chapter 18.22
JCC.)?
No ______ Yes ____ (If yes, answer Detailed Review questions on page 4)
3. Will any portion of the proposed project be constructed in a fish and wildlife habitat conservation area, buffer, or setback
(Article VI, Chapter 18.22 JCC)?
No _______ Yes ____ (If yes, answer Detailed Review questions on page 5)
4. Will any portion of the proposed project be constructed in a wetland or wetland buffer (Article VII, Chapter
18.22 JCC)?
No _______ Yes ___ (If yes, answer Detailed Review questions on page 6)
5. Will any portion of the proposed project be constructed in a frequently flooded area (Article IV, Chapter 15.15
JCC)?
No ______ Yes _____ (If yes, answer Detailed Review questions on page 7)
SHORELINE MODIFICATION REGULATIONS:
6. Does the proposal include Beach Access Structures (JCC 18.25.340)?
Yes _____ (if yes, answer Detailed Review questions on pages 8-9)
7. Does the proposal include Boating Facilities (JCC 18.25.350)?
Yes ____ (If yes, answer Detailed Review questions on page 10-11)
8. Does the proposal include Dredging or Disposal of Dredged Materials (JCC 18.25.360)?
Yes _____ If yes, answer Detailed Review questions on page 12)
9. Does the proposal include Filling and/or Excavation (JCC 18.25.370)?
No ______ Yes _____ (If yes, answer Detailed Review questions on page 13)
10. Does the proposal include Flood Control Structures (JCC 18.25.380)?
No ______ Yes ____ (If yes, answer Detailed Review questions on page 14)
11. Does the proposal include In-stream Structures (JCC 18.25.390)?
Yes (I f yes, answer Detai led Review quest ions on page 15)
12. Does the proposal include Restoration (JCC 18.25.400)?
No ______ Yes ____ (If yes, answer Detailed Review questions on page 16)
13. Does the proposal include Structural Shoreline Armoring and/or Shoreline Stabilization (JCC 18.25.410)?
No ______ Yes ____ (If yes, answer Detailed Review question on pages 17-19)
If the answer is 'No' to all of the above, the likelihood of the project negatively affecting shoreline ecological
functions is minimal and it is assumed that the 'No Net Loss' requirement is met. Sign page 20.
G:\PLANNING\GRANTS- Apps & Opportunities \ 2010 EPA GRANTS \ 2010 EPA - Enhanced Shoreline Protection NNL\Implementation \deliverable 3c apply nnl \ nnl checklist final jcc rey1 072914.docx 2
N o
N o
N o
N o

DETAILED NNL REVIEW
Complete the questions below if the answer is 'Yes' to Preliminary NNL Review Question 1.
1. The proposed project will be constructed within a shoreline buffer (and 10-foot
building setback) for conforming lots or will not meet the modest home provisions
for non-conforming lots.
a. How much impervious surface will be created? _________________________ square feet
b. How much ground disturbance will occur? _____________________________ square feet
c. Does the proposal avoid removal of forest habitats? Yes ______________ No ____
If no, how much forest cover will be removed? _________________________________ square feet
If no, describe the mitigation measures proposed to minimize impacts to the forest canopy within
shoreline jurisdiction. ______________________________________________________________________________
d. Does the site plan show the area of "active use" within the shoreline buffer meeting the
threshold of either 20 percent of the required buffer area or at least 15 linear feet of water frontage?
Yes No
If no, describe how the shoreline protection requirements ofJCC 18.25.310(2)(c)(ii) are met. _______________________
d. Describe the potential impacts to shoreline functions and processes and corresponding
mitigation to show NNL of shoreline functions (based on special reports and agency comments).
Any additional comments relevant to shoreline buffer requirements and NNL for this proposal:
G: \ PLANNING \GRANTS- Apps & Opportunities\ 2010 EPA GRANTS \ 2010 EPA-Enhanced Shoreline Protection NNL \ Implementation \deliverable 3c apply nnl \nnl checklist final jcc red 072914.docx

DETAILED NNL REVIEW
Complete the questions below if the answer is 'Yes' to Preliminary NNL Review Question 2.
2. The proposed project will be located partially or entirely within a geologically hazardous area, a
landslide hazard area buffer, or a setback for a landslide hazard area or a high-risk channel
migration zone (Article V, Chapter 18.22 JCC).
e. If the proposed project will be constructed within a geologically hazardous area, describe the
existing conditions, such as dominant plant community (forest, shrub, herbaceous, unvegetated), percent
vegetated, and native or non-native plant species present (dominant species). If proposal will not be
constructed within a geologically hazardous area, fill in 'N/A'. _____________________________________________
f. If the proposed project will be constructed within a landslide hazard area buffer or setback (35
feet for landslide hazard area or 5 feet for high-risk channel migration zone, unless indicated otherwise
in the geotechnical report), describe the existing conditions, such as dominant plant community (forest,
shrub, herbaceous, unvegetated), percent vegetated, and native or non-native plant species present
(dominant species). __________________________________________________________________________
g. Provide the name of the professional who prepared the report and the date of the report.
h. Describe measures proposed to minimize impacts to shoreline functions based on development
location, project design, construction methods, ongoing uses, and maintenance activities (JCC
18.25.270(2)).
i. Describe any impacts to shoreline stability and natural processes that may occur due to
permitting of the proposed use or development. ______________________________________________________
Any additional comments relevant to geologically hazardous area requirements and NNL for
this proposal:
GAPLANNING \GRANTS- Apps & Opportunities \ 2010 EPA GRANTS \ 2010 EPA - Enhanced Shoreline Protection NNL\ Implementation \deliverable 3c apply nnl \ nnl checklist final jcc rent 072914.docx 4

DETAILED NNL REVIEW
Comp le te the quest ions be low i f the answer is 'Yes ' to Pre l iminary NNL Rev iew Ques t ion 3 .
3. The proposed project will be located partially or entirely within a fish and wildlife habitat
conservation area (FWHCA), buffer, or setback (Article VI, Chapter 18.22 JCC).
a. If the proposed project will be constructed within a FWHCA, describe the existing conditions,
such as habitat type (e.g., sandy/gravely intertidal zone, freshwater lake, matu re forest), dominant plant
community cover type (forest, shrub, herbaceous, unvegetated), percent vegetated, and dominant native
or non-native plant species present. If proposal will not be constructed within a FWHCA, fill in 'N/A'.
b. If the proposed project will be constructed within a FWHCA buffer or setback, describe the
existing conditions, such as dominant plant community (forest, shrub, herbaceous, unvegetated), percent
vegetated, and native or non-native plant species present (dominant species). _________________________________
j. Describe any existing structures or other modifications currently existing on the parcel.
k. Summarize the measures proposed by the applicant to minimize impacts to shoreline functions
based on development location, project design, construction methods, ongoing uses, and maintenance
activities (JCC 18.25.270(2)). _________________________________________________________________________
l. Describe any impacts to shoreline habitats and functions that may occur due to permitting of the
proposed use or development. ________________________________________________________________________
Any additional comments relevant to FWHCA requirements and NNL for this proposal:
GAPLANNING \GRANTS- Apps & Opportunities \ 2010 EPA GRANTS \ 2010 EPA - Enhanced Shoreline Protection NNL\Implementation \deliverable 3c apply nnl \nnl checklist final jcc rey1 072914.docx 5

DETAILED NNL REVIEW
Complete the questions below if the answer is 'Yes' to Preliminary NNL Review Question 4.
4. The proposed project will be located partially or entirely within a wetland or wetland buffer
(Article VII, Chapter 18.22 JCC).
a. If the proposed project will be constructed within a wetland, describe the existing conditions,
such as dominant plant community (forest, shrub, herbaceous, unvegetated), percent vegetated, and
dominant native or non-native plant species present. If the proposal is entirely outside of the wetland
boundary, enter 'N/A'. _______________________________________________________________________________
c. If the proposed project will be constructed within a wetland buffer, describe the existing
conditions, such as dominant plant community (forest, shrub, herbaceous, unvegetated), percent
vegetated, and dominant native or non-native plant species present. __________________________________________
m. Describe any existing structures or other modifications currently existing on the parcel.
n. Describe measures proposed to minimize impacts shoreline functions based on development
location, project design, construction methods, ongoing uses, and maintenance activities (JCC
18.25.270(2)).
o. Describe any impacts to shoreline habitats and functions that may occur due to permitting of the
proposed use or development. ________________________________________________________________________
Any additional comments relevant to wetland requirements and NNL for this proposal:
GAPLANNING \GRANTS- Apps & Opportunities \ 2010 EPA GRANTS \ 2010 EPA- Enhanced Shoreline Protection NNIAImplementation \deliverable 3c apply nnl \nnl checklist final jcc rey1 072914.docx 6

DETAILED NNL REVIEW
Complete the questions below if the answer is 'Yes' to Preliminary NNL Review Question 5.
5. The proposed project will be located partially or entirely within a frequently flooded area
(Chapter 15.15 JCC).
p. Does the proposal comply with Chapter 15.15 JCC? Yes _____________ No _____
If no, explain: ______________________________________________________________________________
q. Has the applicant submitted a Habitat Assessment or documents submitted to the U.S. Army
Corps of Engineers (such as Biological Evaluation or Biological Assessment)? Yes ______________ No _____
If no, explain: ______________________________________________________________________________
r. Describe the measures proposed by the applicant to minimize impacts to shoreline functions and
habitats potentially used by federally-listed threatened and endangered species. _______________________________
s. Identify the species for each 'Effects Determination':
No effect:
May affect, not likely to adversely affect: _______________________________________________________________
Likely to adversely affect: __________________________________________________________________________
For any 'Likely to Adversely Affect' determination, have the Federal Services been contacted?
Yes No
If yes, who was contacted and when: ______________________________________________________________
If no, explain: ______________________________________________________________________________
t. Describe any impacts to shoreline functions and processes that may occur due to permitting of
the proposed use or development. ________________________________________________________________
Any additional comments relevant to frequently flooded area requirements and NNL for this proposal:
GAPLANNING \GRANTS- Apps & Opportunities \ 2010 EPA GRANTS\ 2010 EPA - Enhanced Shoreline Protection NNIAImplementation \deliverable 3c apply nnl \nnl checklist final jcc rey1 072914.docx 7

DETAILED NNL REVIEW
Complete the questions below if the answer is 'Yes' to Preliminary NNL Review Question 6.
6. The proposal includes Beach Access Structures.
a. Will any beach access structure be constructed on a feeder bluff? Yes ___________ No _____
If yes, explain how proposal complies with JCC 18.25.340(2). _________________________________________
b. Will the beach access structure be a private or public use? Private ___________ Public
If public, was the proposal reviewed against regulations in JCC 18.25.290 and was the access restriction in
JCC 18.25.340(4)(h) added to the plat? Yes No ____
If no, explain: ________________________________________________________________________________
a. Will the proposed project meet the requirements of JCC 18.25.340(4)(e), (4)(f), and (4)(g)?
Yes No
If no, explain: ________________________________________________________________________________
b. Was any information received during the course of the review indicating that the proposal should
be prohibited (JCC 18.25.340(4)(j))? Yes _________ No ____
If yes, was the permit denied? Yes _________ No
If the permit was not denied, describe how the NNL requirement will be met. ______________________________
c. Summarize information from the Special Reports submitted by the applicant that shows
compliance with JCC 18.25.340(4)(k):
i (existing conditions) ___________________________________________________________________________
ii (potential slope stability effects) _________________________________________________________________
iii (shoreline processes) _________________________________________________________________________
iv (potential future stabilization) __________________________________________________________________
CONTINUED 4 4
G: \ PLANNING \GRANTS- Apps & Opportunities\ 2010 EPA GRANTS \ 2010 EPA - Enhanced Shoreline Protection NNI. \Implementation \deliverable 3c apply nnl \ nnl checklist final jcc revl 072914.docx 8

v (long-term slope stability measures) _____________________________________________________________
f. Summarize measures to be implemented that are intended to result in NNL of shoreline
functions.
d. Describe anything in the case file that indicates that bank stabilization or shore defense work
would be needed in the future to protect this proposal. ________________________________________________
Any additional comments relevant to beach access structures and NNL for this proposal:
G: \ PLANNING \GRANTS- Apps & Opportunities \ 2010 EPA GRANTS\ 2010 EPA - Enhanced Shoreline Protection NNIAImplementation \deliverable 3c apply nnl \nnl checklist final jcc rev]. 072914.docx 9

DETAILED NNL REVIEW
Complete the questions below if the answer is 'Yes' to Preliminary NNL Review Question 7.
7. The proposal includes Boating Facilities.
a. The proposed project includes:
o public boat launches ______________________________ (answer questions a.1, and b through f)
o private boat launches _____________________________ (answer questions a.2, and b through f)
non - re s id en t i a l d o ck s , p i e r s , and f l oa t s ( an swe r que s t i ons a .3 , and b t h rough f )
residential (accessory) docks, piers,
floats, lifts, float plane moorage _________________ (answer questions a.4, a.5, and b through f)
o marinas _______________________________________ (answer questions a.6, a.7, and b through f)
mooring buoys _________________________________ (answer questions b through f)
a.1 Has the applicant for a public boat launch submitted documentation to show that JCC
18.25.350(3)(a), (3)(b), and (3)(c) are met? Yes ___________ No _____
If no, describe how proposal meets the NNL requirement. ________________________________________________
a.2 Describe the documents submitted by the applicant for a private boat launch that show
compliance with JCC 18.25.350(4)(b). ______________________________________________________________
a.3 Has the applicant for a non-residential dock, pier, and/or float submitted documentation to
show that JCC 18.25.350(5)(a), (5)(d), (5)(e), and (5)(f)? Yes ____________ No _____
If no, describe how the proposal meets the NNL requirement. ______________________________________________
a.4 Describe the documents submitted by the applicant for a dock, pier, float, and/or lift accessory
to residential development that show compliance with JCC 18.25.350(6)(d). ______________________________
a.5 Does the proposal for a dock, pier, float, and/or lift accessory to residential development
include dredging to construct or maintain? Yes _____________ No _____
If yes, describe how proposal complies with JCC 18.25.350(6)(n). ___________________________________________
CONTINUED 4 4
GAPLANNING \GRANTS- Apps & Opportunities \2010 EPA GRANTS \ 2010 EPA - Enhanced Shoreline Protection NNIAlnylementation \deliverable 3c apply nnl \nnl checklist final jcc revl 072914.docx 10

a.6 Describe the information submitted by the applicant for a marina that shows compliance with
JCC 18.25.350(7)(a). ___________________________________________________________________________
a.7 Summarize the avoidance and minimization measures proposed by the applicant to construct a
marina.
c. Is the proposal to construct an entirely new structure or an expansion of an existing structure?
Describe: ____________________________________________________________________________________
e. Will any existing man-made overwater structures be removed (and not replaced) as part of the
proposal? Yes _________ No ____
If yes, how much (provided dimensions and square footage): ___________________________________________
f. Identify all Special Reports prepared for this proposal: _________________________________________
g. Summarize measure to be implemented that are intended to result in NNL of shoreline functions
(include mitigation measures from Special Reports). __________________________________________________
h. Describe anything in the case file that indicates that bank stabilization or shore defense work
would be needed in the future to protect this proposal. ________________________________________________
Any additional comments relevant to boating facilities and NNL for this proposal:
G:\ PLANNING \GRANTS- Apps & Opportunities \ 2010 EPA GRANTS \ 2010 EPA - Enhanced Shoreline Protection NM. \Implementation \deliverable 3c apply nnl \ nnl checklist final lee revl 072914.docx 11

DETAILED NNL REVIEW
Complete the questions below if the answer is 'Yes' to Preliminary NNL Review Question 8.
8. The proposal includes dredging or dredge material disposal in shoreline jurisdiction.
u. Is there any feasible alternative to the proposal? Yes _____________ No_____
If yes, state how proposal complies with JCC 18.25.360(3)(b) and 18.25.360(4)(a). ____________________________
v. If dredging is proposed, describe how the proposal minimizes the need for new dredging and/or
maintenance dredging (JCC 18.25.360(3)(a)). ________________________________________________________
w. If dredging is proposed, identify the use or development in JCC 18.25.360(3)(c) that the proposal
meets (proposal must meet use or development i. through x., specify which one is met): _______________________
x. If dredging is proposed for flood management purposes, identify which of the criteria in JCC
18.25.360(3)(d) applies: i (comp plan requirement) _____________ ii (long-term ecological benefit) _________
y. If dredging is proposed, will the primary purpose of obtaining the materials be for use in landfill,
upland construction, or beach nourishment? Yes _____________ No ____
If yes, state how proposal complies with JCC 18.25.360(3)(f). _______________________________________________
z. If disposal of dredged materials is proposed, indicate which reason meets JCC 18.25.360(4)(d):
i (restore) ________ ii (reestablish) ________ iii (nourish) _________ iv (remediate) ______
aa. If disposal of dredge materials is proposed, has the applicant met all three requirements of JCC
18.25.360(4)(e)? Yes _________ No _____
If no, describe how the NNL requirement is met. _________________________________________________________
bb. Summarize measure to be implemented that are intended to result in NNL of shoreline functions
(include mitigation measures from Special Reports). _____________________________________________________
Any additional comments relevant to dredging or disposing of dredged materials and
NNL for this proposal:
G: \ PLANNING \GRANTS- Apps & Opportunities\ 2010 EPA GRANTS \ 2010 EPA - Enhanced Shoreline Protection NNL\Implementation \deliverable 3c apply nnl \ nnl checklist final jcc rey1 072914.docx 12

DETAILED NNL REVIEW
Complete the questions below if the answer is 'Yes' to Preliminary NNL Review Question 9.
9. The proposal involves filling and/or excavation in shoreline jurisdiction.
cc. Does the proposal meet all three requirements of JCC 18.25.370(3)(c)?
Yes No
If no, describe how the NNL requirement is met. _________________________________________________________
dd. Describe the source of the fill materials and how the applicant is ensuring that contaminated
materials will not be used (JCC 18.25.370(3)(d)). _______________________________________________________
ee. Does the proposal comply with Flood Damage Prevention regulations (Title 15.15 JCC, including
the FEMA BiOp requirements)? Yes ____________ No _____
If no, describe how the requirement in JCC 18.25.370(3)(f) is met. ___________________________________________
ff. Has the applicant fully addressed all eight requirements in JCC 18.25.370(3)(g)?
Yes No
If no, describe how the NNL requirement is met. _________________________________________________________
gg. Summarize measure to be implemented that are intended to result in NNL of shoreline functions
(include mitigation measures from Special Reports). _____________________________________________________
Any additional comments relevant to fill or excavation and NNL for this proposal:
G: \ PLANNING \GRANTS- Apps & Opportunities \ 2010 EPA GRANTS\ 2010 EPA - Enhanced Shoreline Protection NNIAImplementation \deliverable 3c apply nni \ nnl checklist final jcc revl 072914.docx 13

DETAILED NNL REVIEW
Comp le te the quest ions be low i f the answer is 'Yes ' to Pre l iminary NNL Rev iew Ques t ion 10 .
10. The proposal includes Flood Control Structures in shoreline jurisdiction.
a. Does the proposal meet all four requirements in JCC 18.25.380(3)(a)? Yes _______________ No ____
If no, describe how the NNL requirement is met. _________________________________________________________
d. Does the proposal meet all six requirements in JCC 18.25.380(3)(b)?
Yes No
If no, describe how the NNL requirement is met. __________________________________________________________
hh. Will the proposal be constructed in an estuary, embayment, point bar, channel bar, or in
salmonid spawning areas (JCC 18.25.380(3)(d))? Yes ____________ No _____
If yes, describe how the NNL requirement is met. _________________________________________________________
ii. Has any information from federal or state fish and wildlife agencies, tribes, or other qualified
professionals been received indicating that fish and wildlife resources may be damaged or that high
stages and velocities have the potential to occur as a result of the proposal? Yes ________________ No _____
If yes, describe how the JCC 18.25.380(3)(e) requirement is met. ____________________________________________
jj. List the technical reports that were submitted to comply with JCC 18.25.380(3)(k).
kk. Describe the mitigation measures to be implemented for meeting the NNL requirement.
Any additional comments relevant to flood control structures and NNL for this proposal:
G: \ PLANNING \GRANTS- Apps & Opportunities \2010 EPA GRANTS \ 2010 EPA - Enhanced Shoreline Protection NNL \ Implementation \deliverable 3c apply nnl \ nnl checklist final jcc rev1072914,docx 14

DETAILED NNL REVIEW
Complete the questions below if the answer is 'Yes' to Preliminary NNL Review Question 11.
11. The proposal includes in-stream structures.
ll. Does the proposal include construction of a dam or associated power generating facilities?
Yes No
If yes, describe how the proposal meets JCC 18.25.390(3)(a). ______________________________________________
mm. Summarize information submitted by the applicant that shows how JCC 18.25.390(3)(c) is met.
nn. Describe the measures the applicant is proposing to address natural transport of bedload
materials (JCC 18.25.390(3)(d)). __________________________________________________________________
oo. Describe the measure the applicant is proposing to address fish migration (JCC 18.25.390(3)(e)).
pp. Name and firm for project engineer: _______________________________________________________
qq. Summarize how the applicant complies with JCC 18.25.390(3)(i):
i (site suitability analysis) ________________________________________________________________________
ii (engineered hydraulic analysis) _____________________________________________________________________
iii (biological reports) _______________________________________________________________________________
iv (hydropower, if proposed) _________________________________________________________________________
v (public access/on-site recreation) ____________________________________________________________________
vi (mitigation) ____________________________________________________________________________________
vii (construction debris) _____________________________________________________________________________
Any additional comments relevant to in-stream structures and NNL for this proposal:
GAPLANNING \GRANTS- Apps & Opportunities \ 2010 EPA GRANTS \ 2010 EPA - Enhanced Shoreline Protection NNL \Implementation \deliverable 3c apply nnl \nnl checklist final jcc revl 072914.docx 15

DETAILED NNL REVIEW
Complete the questions below if the answer is 'Yes' to Preliminary NNL Review Question 12.
12. The proposal includes Restoration.
a. Summarize the restoration work proposed in the restoration plan. _______________________________
d. Does the proposal comply with all other SMP policies and regulations? Yes __________ No
If no, describe how the proposal complies with JCC 18.25.400(3). _______________________________________
i. Is the proposed development or use part of an approved plan? Yes ___________ No
If yes, name of document: ______________________________________________________________________
Any additional comments relevant to restoration and NNL for this proposal:
G: \ PLANNING \GRANTS- Apps & Opportunities \ 2010 EPA GRANTS \ 2010 EPA - Enhanced Shoreline Protection NNI. \ Implementation \deliverable 3c apply nnl \ nnl checklist final jcc revl 072914.docx 16

DETAILED NNL REVIEW
Complete the questions below if the answer is 'Yes' to Preliminary NNL Review Question 13.
13. The proposal includes shoreline armoring and/or shoreline stabilization.
a. If armoring is proposed, has the applicant submitted documentation (including environmental
assessments) showing that non-structural alternatives are infeasible (JCC 18.25.410(10)(c) and
18.25.410(1)(b))? Yes _______ No ____
If no, explain how the policies and regulations of JCC 18.25.410 are met. ______________________________
e. Indicate the person or firm that prepared biological inventory and resource document (JCC
18.25.410(10)(f): ________________________________________________________________________
j. Is the proposal in-kind replacement of existing shoreline armoring (no expansion)?
Yes (complete question below, then proceed to question f) No ____ (proceed to question d)
What information was submitted to show compliance with JCC 18.25.410(3)(a) and (3)(b)? ________________
k. Is the proposal is for a subdivision or an existing lot without any structures?
Yes _____ (complete question below, then proceed to question f) No ____ (proceed to question e)
What information was submitted to show compliance with JCC 18.25.410(4)(a) through (4)(c)? ____________
l. The proposal is for new or expanded shoreline armoring. Complete the three bulleted items below,
then proceed to question f.
Identify the waterbody, indicate the shore form type, and specify whether or not this shore form type
is prohibited in JCC 18.25.410(5)(a): ______________________________________________________
Based on permitting criteria specified in JCC 18.25.410(5)(b), check all that apply (the proposal must meet
one or more of the following):
i ii iii iv
CONTINUED 4 4
G:\PLANNING\GRANTS- Apps & Opportunities \ 2010 EPA GRANTS\ 2010 EPA - Enhanced Shoreline Protection NNIAImplementation \deliverable 3c apply nnl \nnl checklist final jcc rev]. 072914.docx 17

Summarize how the criteria in JCC 18.25.410(5)(c) are met:
i (erosion) _______________________________________________________________________________
ii (alternatives) ____________________________________________________________________________
iii (flood damage)__________________________________________________________________________
iv (mitigation) ____________________________________________________________________________
v (alternatives evaluated) ___________________________________________________________________
g. Has the proposal been designed to meet U.S. Army Corps of Engineers requirements and/or
Washington State Department of Fish and Wildlife Aquatic Habitat Guidelines? Yes _____________ No
If no, indicate how JCC 18.25.410(6)(a) requirements are met: _________________________________________
m. Summarize the measures the applicant will be implementing to prevent degradation of water
quality. ______________________________________________________________________________________
n. Are gabions proposed? Yes _________ No ___
If yes, indicate how the NNL requirement in JCC 18.25.410(6)(g) will be met. ______________________________
o. Are bulkheads proposed?
Yes No
If yes, describe the bank toe protection proposed (JCC 18.25.410(7)(b)(i)). _______________________________
p. If a revetment is proposed, will it be located in a wetland, point or channel bar, or in a salmonid
spawning areas?
Yes _________ No ______ Revetments are not proposed ______
If yes, describe how the requirements of JCC 18.25.410(8)(b) are met. ___________________________________
CONTINUED 4 4
G: \ PLANNING \GRANTS- Apps & Opportunities \ 2010 EPA GRANTS\ 2010 EPA - Enhanced Shoreline Protection NNL\Implementation \deliverable 3c apply nnl \ nnl checklist final jcc real 072914.docx 18

k. If a breakwater, jetty, or seawall is proposed, indicate which of the three criteria from JCC
18.25.410(9)(b) applies:
i _______ ii _______ iii _______ Breakwaters, jetties, and seawalls are not proposed _______
I. Summarize the information submitted by the applicant to address the following requirements in JCC
18.25.410(10), as it pertains to NNL:
c (alternative and environmental impacts) __________________________________________________________
d (revegetation) _______________________________________________________________________________
e (hydraulic analysis) ___________________________________________________________________________
f (biologist report) _____________________________________________________________________________
h (materials disposal) __________________________________________________________________________
Any additional comments relevant to shoreline armoring/stabilization and NNL for this proposal:
G: \ PLANNING \GRANTS- Apps & Opportunities \ 2010 EPA GRANTS \ 2010 EPA - Enhanced Shoreline Protection NNIAImplementation \deliverable 3c apply nnl \nnl checklist final jcc revl 072914.docx 19

SUMMARY
Applicant:
I agree with the responses to the completed sections of this 'No Net Loss' form.
Signature ________________________________________________________ Date: _______________________
County Reviewer (signs after applicant has returned form with his/her signature):
Based on available information, the project is not expected to result in a net loss of shoreline ecological
functions. Yes No
Signature _________________________________________________________ Date: ________________________
G:\ PLANNING \GRANTS- Apps & Opportunities \ 2010 EPA GRANTS\ 2010 EPA - Enhanced Shoreline Protection NNIAImplementation \deliverable 3c apply nnl \ nnl checklist final jcc real 072914.docx 20


APPENDIX 7.B
THURSTON COUNTY SMP-HRCD PROJECT RECOMMENDATIONS FOR APPLYING THE HRCD DATA SET TO TRACK LAND COVER CHANGE

Thurston SMP-HRCD Project
Recommendations for Applying the HRCD Data Set to Track Land Cover
Change
Background
Land cover is a vital element to environmental management in both science and land-use planning. Land
cover, which is what is covering the land (e.g., forest, impervious surface, grassland), is distinct from
land use, which is how the land is used (e.g., residential, forestry, row crops). Landscape ecologists often
use land cover as a coarse filter evaluation of habitat quantity, quality, and configuration.
Most current land cover products are derived from Landsat satellite data that lack resolution to capture
land cover elements smaller than ~2 hectares. Human dominated landscapes, like those of the Puget
Sound region, change through many small events over time that are not effectively observed by Landsat.
Standard 30-meter resolution Landsat data is useful for large extents of homogenous landscapes. With
more than 30 years of data available, Landsat data still remains an important source of land cover
information, yet its low resolution limits applicability to heterogeneous landscapes.
Overview of the HRCD Data
Funded by multiple grants from EPA (2012, 2013), WA Dept. of Ecology (2010), and the Salmon Recovery
Funding Board (2009), the HRCD dataset is based on a process that compares high-resolution (1 m)
National Agriculture Imagery Program (NAIP) aerial photography between two time periods. NAIP
imagery was first available for Washington statewide in 2006 serving as the baseline for the dataset.
Once the next set of imagery was available in 2009, comparisons between the two could then be made.
The procedure, developed by Dr. Ken Pierce (WDFW), of generating the land cover changes has two
primary phases: a set of automated processes meant to assign the segmented landscape with a
prescribed chance of change and a manual process that confirms the change event and assigns
attributes.
What the computer does
The automated phase of generating the HRCD data is complex and it is beyond the scope of this report
to describe the process in detail. To summarize, through a process known as segmentation, the
computer divides the georeferenced imagery into polygons by homogenous pixels. The computer takes
these segmented polygons and assesses the probability that the images are different (i.e. the area
experienced a land cover change event). The polygons with a probability of change higher than the
prescribed minimum probability threshold for change are then sent to an analyst to verify if the area has
indeed changed.
What the WDFW Staff does
The segmented polygons that are identified as likely to have changed are checked by an analyst to
confirm that the area has indeed changed. This is done by visually inspecting each polygon through a
custom built viewer that loads the potential change event to compare with its baseline image. The

analyst also assigns attributes to each confirmed change event including the amount of the change
within the polygon (0, 25, 50, 75, or 100%), the initial land class, and likely change agent (Table 1).
Table 1. List of initial land classes (left) and change agents (right) in the HRCD dataset.
Initial Land Class Change Agents
Built Impervious (>90%) Development
Bare Ground (>90%) Forestry
Mixed built (<25% or >25% tree cover) Tree Removal
Mixed Non-built (including natural rock) Stream/Hydrologic change
Tree/Shrub (>90%) Redevelopment
Grass/Herb (>90%) Retention Pond
Other – Natural
Other – Non-Natural
What the data do
The completed HRCD dataset quantifies land cover change through time in Puget Sound. Specifically, the
HRCD quantifies total land cover change, including canopy loss, impervious surface increase and semi-
pervious increase. Currently, the data does not quantify tree growth or identify restoration events. The
extent is the entire Puget Sound Watershed separated by Watershed Resource Inventory Areas (WRIAs)
1 through 19 in Washington State. There are currently two iterations of the HRCD data available for
distribution, 2006 to 2009 and 2009 to 2011 with 2011 to 2013 available late 2015. The data can be
readily manipulated in ArcGIS and intersected with other spatial data.
HRCD Limitations
HRCD error assessment
There are two types of error associated with HRCD, commission error (locations mapped as change that
did not actually change) and omission error (locations that actually changed but not mapped as change).
Commission error is virtually eliminated by the analyst visually inspecting each location predicted to be
change based on the prescribed minimum probability threshold in the computer model. Omission error
rates are estimated by sampling and manually interpreting a large number of polygons below the
minimum probability threshold. Lowering the minimum probability threshold will push more error into
the commission side and increase accuracy. Lowering the probability threshold however exponentially
increases the number of polygons reviewed by analysts and therefore has a point of diminishing returns.
For a more detailed looked at the HRCD generation process, definitions for land class, change agents,
change types, error assessment:
Final Report on High Resolution Change Detection Project (2011):
http://wdfw.wa.gov/publications/01454/wdfw01454.pdf
Quality Assurance Project Plan: Puget Sound High Resolution Change Detection (2013):
http://www.ecy.wa.gov/programs/eap/qa/docs/NEPQAPP/SampleQAPPHighDefChangeAnalysis.pdf

Accuracy Optimization for High Resolution Object-Based Change Detection: An Example Mapping
Regional Urbanization with 1-m Aerial Imagery (2015):
http://www.mdpi.com/2072-4292/7/10/12654
HRCD omission rate case: Thurston County Marine SMP
Independent of the HRCD Quality Assurance Project Plan that estimated omission rates, the Thurston
County marine Shoreline Master Program area was manually assessed for omissions from the HRCD data
set. The results showed a significant improvement between the 2006 to 2009 and 2009 to 2011
iterations in omission rates.
In the Thurston marine SMP area, the HRCD captured approximately 51% of the canopy loss and 31% of
new impervious surface between 2006 and 2009. However, the HRCD captured approximately 88% of
the canopy loss and 87% of the new impervious surface between 2009 and 2011. Manual assessment of
the latest iteration, 2011 to 2013, is currently underway.
Generally, the HRCD data set captures larger events (greater than 1/5th acre) with more reliability than
smaller events. Small land cover changes, such as house additions, driveways, individual tree removals,
and other changes less than 1/5th of an acre, are routinely missed, especially as change polygons smaller
than 2000 ft2 (about a 1/20th acre) are removed from analysis prior to modeling. Also, the HRCD is not
designed to capture some other change events such as demolitions, tree or greenspace restorations,
over-water structures (e.g. docks), and vertical structures (i.e. bulkheads).
0%
10%
20%
30%
40%
50%
60%
70%
80%
90%
100%
2006-2009 2009-2011
Portion of Total Actual Change Identified by HRCD methodology, Thurston County Marine
SMP Area
Impervious Surface (ac) Canopy Cover (ac)

Even though the HRCD does not track restoration events or tree growth, interested users can submit
spatial data for known restoration events or other areas of interest to WDFW via the HRCD website
(available late 2015). These locations will be monitored for change with each new iteration of the NAIP
photography. A corresponding report will be generated summarizing the land cover change, including
any activity observed outside of the regular HRCD attributes such as canopy gain.
How to Get the HRCD Data Set
There are currently two primary means of data distribution:
1) ArcGIS Online Map Service (http://arcg.is/1KltjEU) allows users to view and filter the HRCD
dataset in a web browser.
2) A shared folder with invitations manually sent by WDFW staff upon request. This folder contains
the most current HRCD editions ready for download via a shapefile.
For more information on this report, the HRCD dataset, applications, local partner full-reports, or to receive the
data itself, please contact:
Keith Folkerts Priority Habitat and Species Land Use Policy Lead Habitat Program Washington Department of Fish and Wildlife 600 Capital Way N Olympia, WA 98501 Phone: (360) 902-2390 Email: [email protected]

Simple HRCD Application Method
While there are many ways to analyze the HRCD dataset with other spatial data, one of the more simple
methods is an intersection in ArcGIS then exporting to a spreadsheet program like Excel. The following
method uses ArcGIS 10.2.2 and Microsoft Excel.
Steps:
1. Request access to the WDFW HRCD folder by contacting WDFW Staff, then download HRCD data
from the folder.
In ArcGIS:
2. Add HRCD data and other relevant spatial data using the “Add Data” button on the “Standard”
tool bar (also available on the File drop-down menu);
3. Under the “Geoprocessing” drop-down, select “Intersect”;

4. In “Input Features” select HRCD and other spatial data. Select where to store the new file in
“Output Feature Class”. Select “OK”.
5. Because the Intersection function will create HRCD change event polygons spliced by the spatial
data used, new area of the HRCD polygons need to be calculated.
a. Right-click on the HRCD layer in the table of contents and open the Attribute Table.
b. Right-click the “Area (acres)” button on the attribute labels, and select “Calculate
Geometry”. Select “Acres” in the dropdown list. Select “Ok”.

a. If you get a dialogue box saying you are about to edit outside of an edit session, click yes
to continue.
Export the data to Excel:
6. Right-click the newly created layer in the “Table of Contents” window and select “Open
Attribute Table”

7. On the “Table Options” button, select “Export”;
8. Select the browse button next to the “Output table” box. Select where to store the exported
data and change the file type to “Text File”.

In Excel:
9. Open the file (be sure to select either “All File types” or “Text File types” in the dropdown menu
adjacent to file name).

10. On Step 1 of 3 in the Text Import Wizard, select “Next”.
11. On Step 2 of 3 in the Text Import Wizard, check the “Comma” box, select Finish

12. To account for the change percentages (0, 0.25, 0.5, 0.75, or 1.0) for each change type (total,
canopy loss, impervious surface increase, and semi-pervious increase), multiply the change
percentages by the Area (acres) column.
a. Create new columns 4 new columns and label them: Calculated Total Change, Tree
Decrease, Impervious Increase, and Semi-pervious Increase.
b. Multiply the respective change percentage type by the Area (acres) column.

13. Under the Insert ribbon, select Pivot Table and select the data range of interest for analysis.
14. Sort and filter the data as needed.
By using this simple method of intersecting the HRCD, each change event is combined with the
attributes of the other spatial data used in the intersection. In Excel, the pivot table function is
extremely useful for filtering and sorting the intersected HRCD data by the attributes found in the other
spatial data used in the analysis

Using HRCD for Program Implementation
HRCD data should prove useful for counties and cities implementing critical area programs adopted
under the Growth Management Act (GMA) and Shoreline Master Programs (SMPs) adopted under the
Shoreline Management Act (SMA).
Intersecting the HRCD with the appropriate spatial data can show rates of land cover change. The data
can give insight into the effectiveness of environmental policies and regulations, their implementation,
and/or enforcement practices. For example, jursidictions can intersect the HRCD with SMP areas and
sort by environmental designation to determine if the observed rates of change are acceptable as per
their land use management goals.
One example is to cross-reference the HRCD with critical area or shoreline layers together with relevant
land use permits to understand where permitted and non-permitted activities took place. In the past,
most local governments relied solely on complaints to determine the extent of non-permitted activity.
The HRCD has potential to provide a neutral and objective base of information to inform evaluations of
program compliance.
The data could also be used to help prepare forward-looking projections of change. For example, rates
of change calculated for given periods in the past can be projected into the future to inform cumulative
impact assessments.
The HRCD data may also be useful for regional or watershed entities to compare rates of change
between different areas subject to different regulatory regimes or different rates of growth. For
example, jurisdictions can gain insight into how efficiently they manage growth by measuring new
impervious surface area per new person over a specified time.
It is important to note that while the HRCD quantifies canopy loss, the dataset does not record tree
growth and restoration and thus does not provide information on mitigation or restoration
improvements.
Spatial Data Resources
Some resources with downloadable spatial data:
- Public Lands Database (USGS)
o Official inventory of protected open space in the United States. With over 715 million
acres in thousands of holdings, the spatial data in PAD-US include public lands held in
trust by national, State, and some local governments, and by some nonprofit
conservation organizations.
o http://gapanalysis.usgs.gov/padus/data/download/
- National Wetland Inventory (USFWS)
o http://www.fws.gov/wetlands/NWI/Overview.html
- WA Department of Ecology
o Ecology maintains the spatial datasets described here in order to better describe the
diverse natural and cultural environment that we live and work in.

APPENDIX 7.C
KIRKLAND LANDOWNER TEMPLATES The City of Kirkland has two landowner agreements that it records on projects along the shoreline. The “Perpetual Maintenance Agreement Native Shoreline Vegetation” is a standard vegetation maintenance agreement completed with all new single-family development, major remodels, or Substantial Development Permit along the shoreline. The “5-Year Maintenance Agreement for Shoreline Structural Stabilization” is for those few projects that have installed new soft shoreline stabilization.

S:\Gmu\GRANTS & CONTRACTS\11-13 Grant Cycle\11-13 Puget Sound NEP Grant\CAO guidebook update 2016-2018\Chapter Drafts\7. Monitoring and Adaptive Management\Resources\Local examples\Kirkland\Kirkland
Perpetual Maintenance Agreement.docx09-16-11\TS:da Page ______ of _______ Official City Document
PERPETUAL MAINTENANCE AGREEMENT NATIVE SHORELINE VEGETATION
Parcel No: Project Name: Project Address: This agreement is entered into between each of the undersigned owners of real property, and the City of Kirkland, in consideration of approval by the City of a permit under City of Kirkland File/Permit No. for the hereinafter described real property in Kirkland, King County, Washington. Each undersigned owner hereby agrees to regularly maintain the required native shoreline vegetation as illustrated on the landscape plan contained in Exhibit A, as approved by the City, on the real property described below in Exhibit B, owned by such owner, pursuant to Chapter 83 of the Kirkland Zoning Code. Vegetation that dies or is removed must be replaced in kind or with similar plants contained on the City’s Native Plant List or other native species approved by the City Planning Official. For the application of pesticides, herbicides and fertilizers, each undersigned owner hereby agrees to follow the measures in Section 83.480 of the Kirkland Zoning Code, including the use of best management practices (BMPs) outlined in the BMPs for Landscaping and Lawn/Vegetation Management Section of the 2005 Stormwater Management Manual of Western Washington to prevent contamination of surface and ground water and/or soils, and adverse effects on shoreline ecological functions and values. Each of the undersigned agree to defend, pay, and save harmless the City of Kirkland, its officers, agents, and employees from any and all claims of every nature whatsoever, real or imaginary, which may be made against the City, its officers, agents, or employees for any damage to property or injury to any person arising out of the maintenance of said native shoreline vegetation on said owner's property or out of the actions of the undersigned in carrying out the responsibilities under this agreement, excepting therefrom only such claims as may arise solely out of the negligence of the City of Kirkland, its officers, agents, or employees. This Agreement shall be binding upon the heirs, successors and assigns of each of the undersigned and shall run with the land. This Agreement shall, at the expense of the undersigned owners, be recorded by the City of Kirkland with the King County Department of Elections and Records. The approved shoreline vegetation plan on the subject property of this Agreement is described as follows:
See Exhibit A The real property owned by the undersigned and the subject property of this Agreement is situated in Kirkland, King County, Washington and described as follows:

S:\Gmu\GRANTS & CONTRACTS\11-13 Grant Cycle\11-13 Puget Sound NEP Grant\CAO guidebook update 2016-2018\Chapter Drafts\7. Monitoring and Adaptive Management\Resources\Local examples\Kirkland\Kirkland
Perpetual Maintenance Agreement.docx09-16-11\TS:da Page ______ of _______ Official City Document
See Exhibit B
DATED at Kirkland, Washington, this ________ day of ________________________, _______.

S:\Gmu\GRANTS & CONTRACTS\11-13 Grant Cycle\11-13 Puget Sound NEP Grant\CAO guidebook update 2016-2018\Chapter Drafts\7. Monitoring and Adaptive Management\Resources\Local examples\Kirkland\Kirkland
Perpetual Maintenance Agreement.docx09-16-11\TS:da Page ______ of _______ Official City Document
(Sign in blue ink)
(Individuals Only)
OWNER(S) OF REAL PROPERTY (INCLUDING SPOUSE)
(Individuals Only)
STATE OF WASHINGTON ) ) SS.
County of King )
On this _____ day of ____________, _____, before me, the undersigned, a Notary Public in and for the State of Washington, duly commissioned and sworn, personally appeared _________________________________________________and ________________________________________to me known to be the individual(s) described herein and who executed the Perpetual Maintenance Agreement Native Shoreline Vegetation and acknowledged that _______ signed the same as ______free and voluntary act and deed, for the uses and purposes therein mentioned. WITNESS my hand and official seal hereto affixed the day and year first above written.
________________________________________ Notary's Signature
________________________________________ Print Notary's Name Notary Public in and for the State of Washington, Residing at: __________________________________________ My commission expires: ______________________

S:\Gmu\GRANTS & CONTRACTS\11-13 Grant Cycle\11-13 Puget Sound NEP Grant\CAO guidebook update 2016-2018\Chapter Drafts\7. Monitoring and Adaptive Management\Resources\Local examples\Kirkland\Kirkland
Perpetual Maintenance Agreement.docx09-16-11\TS:da Page ______ of _______ Official City Document
(Partnerships Only)
OWNER(S) OF REAL PROPERTY (Name of Partnership or Joint Venture) By General Partner By General Partner By General Partner
(Partnerships Only)
STATE OF WASHINGTON ) ) SS.
County of King )
On this _____ day of ____________, _____, before me, the undersigned, a Notary Public in and for the State of Washington, duly commissioned and sworn, personally appeared _________________________________________________and _________________________________________ to me, known to be general partners of ______________________________, the partnership that executed the Perpetual Maintenance Agreement Native Shoreline Vegetation and acknowledged the said instrument to be the free and voluntary act and deed of each personally and of said partnership, for the uses and purposes therein set forth, and on oath stated that they were authorized to sign said instrument.
WITNESS my hand and official seal hereto affixed the day and year first above written.
__________________________________ Notary's Signature
__________________________________ Print Notary's Name Notary Public in and for the State of Washington, Residing at: __________________________________________ My commission expires: ________________

S:\Gmu\GRANTS & CONTRACTS\11-13 Grant Cycle\11-13 Puget Sound NEP Grant\CAO guidebook update 2016-2018\Chapter Drafts\7. Monitoring and Adaptive Management\Resources\Local examples\Kirkland\Kirkland
Perpetual Maintenance Agreement.docx09-16-11\TS:da Page ______ of _______ Official City Document
(Corporations Only)
OWNER(S) OF REAL PROPERTY (Name of Corporation) By President By Secretary
(Corporations Only)
STATE OF WASHINGTON ) ) SS. County of King )
On this _____ day of ____________, _____, before me, the undersigned, a Notary Public in and for the State of Washington, duly commissioned and sworn, personally appeared ________________________________________________and _________________________________________ to me, known to be the President and Secretary, respectively, of _______________________________________, the corporation that executed the Perpetual Maintenance Agreement Native Shoreline Vegetation and acknowledged the said instrument to be the free and voluntary act and deed of said corporation, for the uses and purposes therein set forth, and on oath stated that they were authorized to sign said instrument and that the seal affixed is the corporate seal of said corporation.
WITNESS my hand and official seal hereto affixed the day and year first above written.
__________________________________ Notary's Signature
__________________________________ Print Notary's Name Notary Public in and for the State of Washington, Residing at: __________________________________________ My commission expires: ________________

Vol1\Templates\OCDs\OCD-100 ef.dotx Page ______ of _______ Official City Document
5-YEAR MAINTENANCE AGREEMENT FOR SHORELINE STRUCTURAL STABILIZATION
Parcel No: Project Name: Project Address: This agreement is entered into between each of the undersigned owners of real property, and the City of Kirkland, in consideration of approval by the City of a permit under City of Kirkland File/Permit No. for the hereinafter described real property in Kirkland, King County, Washington. Each undersigned owner jointly and severally hereby agrees to maintain the shoreline structural stabilization measures installed on the real property described below, in accordance to the final approved shoreline stabilization plan contained in the City’s official file, pursuant to Chapter 83 of the Kirkland Zoning Code (“KZC”), for a period of five (5) years after the date of final occupancy of the site or final inspection of the shoreline stabilization measure, which is [enter date]. Thereafter, maintenance will continue pursuant to Chapter 83 KZC requirements. Each of the undersigned agree to defend, pay, and save harmless the City of Kirkland, its officers, agents, and employees from any and all claims of every nature whatsoever, real or imaginary, which may be made against the City, its officers, agents, or employees for any damage to property or injury to any person arising out of the maintenance of said shoreline structural stabilization measure on said owner's property or out of the actions of the undersigned in carrying out the responsibilities under this agreement, excepting therefrom only such claims as may arise solely out of the negligence of the City of Kirkland, its officers, agents, or employees. This Agreement shall be binding upon the heirs, successors and assigns of each of the undersigned and shall run with the land. This Agreement shall, at the expense of the undersigned owners, be recorded by the City of Kirkland with the King County Department of Elections and Records. The real property owned by the undersigned and the subject property of this Agreement is situated in Kirkland, King County, Washington and described as follows:
Exhibit A DATED at Kirkland, Washington, this ________ day of ________________________, _______.
Vol1\Templates\OCDs\OCD-100 ef.dotx Page ______ of _______ Official City Document
(Sign in blue ink)
(Individuals Only)
OWNER(S) OF REAL PROPERTY (INCLUDING SPOUSE)
(Individuals Only)
STATE OF WASHINGTON ) ) SS.
County of King )
On this _____ day of ____________, _____, before me, the undersigned, a Notary Public in and for the State of Washington, duly commissioned and sworn, personally appeared _________________________________________________and ________________________________________to me known to be the individual(s) described herein and who executed the 5-Year Maintenance Agreement For Shoreline Structural Stabilization and acknowledged that _______ signed the same as ______free and voluntary act and deed, for the uses and purposes therein mentioned. WITNESS my hand and official seal hereto affixed the day and year first above written.
________________________________________ Notary's Signature
________________________________________ Print Notary's Name Notary Public in and for the State of Washington, Residing at: __________________________________________ My commission expires: ______________________

Vol1\Templates\OCDs\OCD-100 ef.dotx Page ______ of _______ Official City Document
(Partnerships Only)
OWNER(S) OF REAL PROPERTY (Name of Partnership or Joint Venture) By General Partner By General Partner By General Partner
(Partnerships Only)
STATE OF WASHINGTON ) ) SS.
County of King )
On this _____ day of ____________, _____, before me, the undersigned, a Notary Public in and for the State of Washington, duly commissioned and sworn, personally appeared _________________________________________________and _________________________________________ to me, known to be general partners of ______________________________, the partnership that executed the 5-Year Maintenance Agreement For Shoreline Structural Stabilization and acknowledged the said instrument to be the free and voluntary act and deed of each personally and of said partnership, for the uses and purposes therein set forth, and on oath stated that they were authorized to sign said instrument.
WITNESS my hand and official seal hereto affixed the day and year first above written.
__________________________________ Notary's Signature
__________________________________ Print Notary's Name Notary Public in and for the State of Washington, Residing at: __________________________________________ My commission expires: ________________

Vol1\Templates\OCDs\OCD-100 ef.dotx Page ______ of _______ Official City Document
(Corporations Only)
OWNER(S) OF REAL PROPERTY (Name of Corporation) By President By Secretary
(Corporations Only)
STATE OF WASHINGTON ) ) SS. County of King )
On this _____ day of ____________, _____, before me, the undersigned, a Notary Public in and for the State of Washington, duly commissioned and sworn, personally appeared ________________________________________________and _________________________________________ to me, known to be the President and Secretary, respectively, of _______________________________________, the corporation that executed the 5-Year Maintenance Agreement For Shoreline Structural Stabilization and acknowledged the said instrument to be the free and voluntary act and deed of said corporation, for the uses and purposes therein set forth, and on oath stated that they were authorized to sign said instrument and that the seal affixed is the corporate seal of said corporation.
WITNESS my hand and official seal hereto affixed the day and year first above written.
__________________________________ Notary's Signature
__________________________________ Print Notary's Name Notary Public in and for the State of Washington, Residing at: __________________________________________ My commission expires: ________________