CRITERIA FOR ACCEPTING PRECOATED … Testing Laboratory Pennsylvania Department of Transportation...
33
277 Technology Parkway • Auburn, AL 36830 NCAT Report 91-02 CRITERIA FOR ACCEPTING PRECOATED AGGREGATES FOR SEAL COATS AND SURFACE TREATMENTS By Prithvi S. Kandhal John B. Motter January 1991
-
Upload
nguyennhan -
Category
Documents
-
view
217 -
download
3
Transcript of CRITERIA FOR ACCEPTING PRECOATED … Testing Laboratory Pennsylvania Department of Transportation...

277 Technology Parkway • Auburn, AL 36830
NCAT Report 91-02
CRITERIA FOR ACCEPTINGPRECOATED AGGREGATESFOR SEAL COATS ANDSURFACE TREATMENTS
By
Prithvi S. KandhalJohn B. Motter
January 1991

CRITERIA FOR ACCEPTING PRECOATED AGGREGATES FOR SEALCOATS AND SURFACE TREATMENTS
By
Prithvi S. KandhalAssistant Director
National Center for Asphalt TechnologyAuburn University, Alabama
John B. MotterSupervisor
Bituminous Testing LaboratoryPennsylvania Department of Transportation
Pennsylvania
NCAT Report 91-02
January 1991

i
DISCLAIMER
The contents of this report reflect the views of the authors who are solely responsible forthe facts and the accuracy of the data presented herein. The contents do not necessarily reflectthe official views and policies of the National Center for Asphalt Technology of AuburnUniversity. This report does not constitute a standard, specification, or regulation.
ii
ABSTRACT
One of the most common causes of seal coat failures is the presence of dust on the coveraggregate which prevents good adhesion between the applied bituminous binder and theaggregate. Precoating the aggregate with a very thin film of bituminous binder usually solves thedust problem and provides good adhesion.
This research was undertaken (a) to evaluate the adhesion of aggregates precoated to varyingdegree so that the optimum precoating requirement can be established, and (b) to develop anend-result type test in lieu of the subjective visual test for accepting precoated aggregates.
Five AASHTO No. 8 aggregates of different mineralogical compositions and absorptivecharacteristics were used. These aggregates were precoated with MC-30 cutback asphalt tovarying degree (from salt & pepper effect to 90+ percent coating). Pennsylvania AggregateRetention Test developed in this study was used to evaluate the effect of precoating on aggregateretention loss.
Immediate adhesion of the cover aggregate with the bituminous binder was best obtained at 90+percent precoating. The agreement (reproducibility) between different evaluators who madesubjective visual evaluation of the percent precoating was also by far the best at 90+ percentlevel. Of the three end-result type tests attempted, dry gradation test of the precoated aggregatewas determined to be most appropriate with an acceptance criteria of 0.5 percent maximumminus 200 (dust).
It has been recommended to use AC-20 asphalt cement as a precoating material in lieu of MC-30cutback asphalt, because it can be mixed at higher temperatures in a hot mix asphalt (HMA)plant, does not need any curing, and will cause better aggregate retention.

Kandhal & Motter
1
CRITERIA FOR ACCEPTING PRECOATED AGGREGATES FOR SEAL COATS ANDSURFACE TREATMENTS
Prithvi S. Kandhal and John B. Motter
INTRODUCTION
Pennsylvania Department of Transportation (PennDOT) is responsible for the maintenance of43,000 miles of roadway. PennDOT’s projected maintenance program for 1987 included placingseal coat applications over 5,000 miles of roadway requiring over 14 million gallons ofemulsified asphalt. One of the most common causes of seal coat failures is the presence of duston the cover aggregate which prevents good adhesion between the aggregate and the appliedbituminous binder. Precoating the aggregate with a very thin film of bituminous binder usuallysolves the dust problem and provides good adhesion. PennDOT recommends the use ofprecoated aggregates in seal coats and surface treatments on the roads carrying more than 1500average daily traffic (ADT).
The current PennDOT specifications require that “at least 90 percent of the total visible area ofthe aggregates shall be coated with a bituminous film—any thin, brownish, translucent areas willbe considered full coated.” Questions have been raised about the minimum degree of precoatingrequired and its subjective determination. Some people believe that a lesser degree of coating(even a salt and pepper effect) will be as effective as 90 percent coating. A need was felt todevelop an end-result type test in lieu of the subjective visual test for accepting the precoatedaggregates for Department work.
The objectives of this research are (i) to evaluate the adhesion of aggregates precoated to varyingdegree so that the optimum precoating requirement can be established, and (ii) to develop anend-result type test in lieu of the subjective visual test for accepting precoated aggregates.
REVIEW OF LITERATURE AND CURRENT PRACTICES
PennDOT uses a rational design method (l, 2) to establish the application rates of bituminousbinder and cover aggregate. This was done in 1975 to have a uniform practice throughout thestate and to minimize failures resulting from improper application rates. However, thespecification allowed up to 2 percent of minus 200 material (hereinafter called ‘dust’) in thecover aggregate. This was considered excessive for applications on high volume roads and,therefore, specifications for precoated aggregates were developed in 1980 based on theexperience in other States and overseas (particularly in Australia, New Zealand and UnitedKingdom).
Review of Literature
Before commencing this research, a review of literature on precoated aggregates was conducted.Highway Research Board’s Special Report No. 96 (3) on “State-of-the-Art: Surface Treatments”summarized the existing literature in 1968 on this subject. It was mentioned that “one cannotoveremphasize the importance of the physical condition (dusty) of the cover aggregate, thesuccess or failure of a particular surface treatment might well depend solely upon the conditionof the cover material.” Benson and Gallaway (4)’s research indicated that for the presence of onepercent dust there was a loss in aggregate retention of 12 percent by weight per unit area. Onemethod of dealing with the dust problem is washing and drying the aggregate by mechanicalmeans before application which solves the problem almost entirely. The other methods includecoating the aggregate with either a bituminous material or a kerosene film before application.Precoating with a bituminous material almost guarantees good adhesion. Longer life experiencedwith precoated aggregates justifies the increased cost.
Kandhal & Motter
2
Harris (5) recommended the use of precoated aggregates in 1955 mentioning that “on heavilytraveled roads, the trend is definitely towards the use of precoated aggregates, and probably asmuch as one hundred thousand tons will be used in Texas during 1955.” Parr (6) reported about asurface treatment project over 33 miles long in Michigan, which gave 17 years of service withoutmaintenance. The aggregate was precoated with an SC-1 oil (approximately one percent). Whilethe cost of precoating is something to be considered, still the long life of the surface treatmenthad more than paid for the extra cost of precoating.
The Asphalt Institute (7) recommends that precoating the aggregate with a very thin film ofasphalt usually solves the dust problem and provides good adhesion of the asphalt to theaggregate. The aggregate is run through a hot mix asphalt (HMA) plant dryer, cooled to under200°F, then mixed in the pugmill with about one percent MC-70 to coat each particlethoroughly. The small amount of asphalt does not change the aggregate from a free flowingmaterial which can still be applied with aggregate spreaders. The precoating adds to the cost ofthe aggregate but the additional cost is often justified by the better results obtained.
The Transport and Road Research Laboratory (TRRL) of the United Kingdom also suggests theuse of precoated chippings to overcome the problem of dust (8). Coated chippings adhereimmediately to the binder compared to dry uncoated chippings especially when the binderviscosity is relatively high. The most common technique is to heat the chippings to between220°F and 300°F and to coat them with more normal grades of tar or bitumen. The hightemperature used hardens the coating and makes the chippings easy to handle. A binder contentof about 0.75 to 1 percent by weight of the chippings is suitable.
McLeod (9) has stated that rapid development of good adhesion between cover aggregate andbituminous binder is highly desirable. To achieve this, the National Roads Board of NewZealand requires all cover aggregates on state roads must be washed to remove dust and thenprecoated. Precoating is done by a special cationic emulsion or cutback asphalt at the rate of onegallon per cubic yard of chips. In Australia, to promote adhesion, stone chips are often similarlyprecoated with diesel fuel oil at the rate of 1-2 gallons per cubic yard of cover stone or with onepercent of MC-30 or MC-70.
Precoated sandstone cover aggregate was used successfully on Interstate 81 in Pennsylvania inFederal Highway Administration Demonstration Project 55 (10). The seal coat job wascompleted in August 1980 using MC-30 Cutback as a precoating material, and CRS-2(Pennsylvania Designation E-3) Emulsified Asphalt as the application binder.
Epps, Gallaway and Hughes (11) have prepared a field manual on design and construction ofseal coats. They have stated that “precoated aggregates are more expensive than untreatedaggregates but have been utilized to reduce the effect of a dusty aggregate, to reduce automobileglass damage due to flying stone and to promote bond with asphalt.”
Current Practices
A questionnaire was sent to all 50 states of the United States and various highway agencies inAustralia, New Zealand and United Kingdom. Australia and New Zealand are considered to beleading countries in obtaining most successful seal coat jobs in the world.
The questionnaire and the summary of the responses of 44 responding states from the UnitedStates on general seal coat practices such as, most commonly used aggregate gradation andapplied bituminous materials, tests and specifications for minus 200 material (dust) in the coveraggregate are given in Reference 12. Table 1 summarizes the response of highway agencies fromthe United States and abroad which use precoated aggregates in seal coats.

Kandhal & Motter
3
Only six states (Illinois, Oregon, Pennsylvania, Texas, Utah and Virginia) use precoatedaggregates. Cutbacks, emulsions, and asphalt cements of different grades are used for precoatingas shown in Table 1. Hot mix asphalt (HMA) plants are normally used for precoating inPennsylvania. Lower mix temperatures are used when MC-30 is the precoating material. Threestates specify minimum percentage of coating ranging from 85 to 100 percent. Five statesevaluate th precoating by visual examination. Four states believe in specifying minimumpercentage of coating.
Most of the seven agencies from abroad use petroleum distillates (such as, diesel) for precoatingthe cover aggregates (Table 1). Asphalt cements (bitumen) of different penetrations and cutbackasphalts are also used for precoating. Six of the seven agencies either recommend specificationson minimum percentage of coating or specify minimum percentage of binder. Ministry of Works& Development, Auckland, New Zealand, has a test criteria for accepting the extent ofprecoating (Table 1). It should be noted that most of these agencies use single size coveraggregates whereas graded aggregates are quite commonly used in the United States. Also, theseagencies use straight run asphalt cements (bitumen) and cutback asphalts in addition toemulsified asphalts as application bituminous materials.
Table 1a. Responses to the Questionnaire on Precoated Aggregates (United States)Responding
StateBituminous Material Used for
Precoating% Precoating of Aggregate
SurfaceMinimum
%Coating
NecessaryGrade(s) Used % TotalBitumen
Specified? HowDetermined?
Illinois Emulsion SS-1 1.0-2.0 100% Visual YesOregon Asphalts AR-2000
AR-40000.5-1.0 No Visual No
Pennsylvania Cutbacks MC-30MC-70
Asphalt AC-20
0.5-1.20.6-1.2
90%+ Visual Yes
Texas Emulsions MS-1SS-1
Asphalts AC-10AC-20
1.0 No Visual No
Utah Asphalts AC-5AC-10
--- No --- Yes
Virginia Emulsion CMS-2Asphalt AC-20
1.0-1.5 85%+ Visual Yes

Kandhal & Motter
4
Table 1b. Responses to the Questionnaire on Precoated Aggregates (Abroad)Responding Agency
& CountryBituminous Material Used for
Precoating% Precoating of Aggregate
SurfaceMinimum
%Coating
NecessaryGrade(s) Used % TotalBitumen
Specified? HowDetermined?
Ministry of Work& DevelopmentAuckland, NewZealand
180/200 Pen.Bitumen +
60% Kerosene
NotSpecified
75%+ Visual* Yes
Main Roads Dept.AutomotiveWelshpool,Western Australia
AutomotiveDistillate
0.5+ No Visual Yes
Road ConstructionAuthorityVictoria, Australia
CutbackAsphalt
Distillate
0.5-1.00.4-1.0
No** Visual No
Main Roads Dept.Queensland,Australia
20-25%Bitumen +Diesel Flux
0.7 75%+ Visual Yes
Dept. of MainRoadsTasmania,Australia
Diesel Fuel +1-2% adhesionagent (amine)
--- 100% Visual Yes
Dept. of MainRoads N.S.W. Sydney,Australia
ProprietaryProducts
--- 100% Visual ---
Transport & RoadResearchLaboratory (TRRL)Berkshire, U.K.
70 or 100 Pen.Bitumen
0.5-1.0 No Visual No
* 100 chips are evaluated visually. No more than 2 chips shall have no precoating, no more than 5 chips shall haveless than 50% coating, and the remainder shall have more than 75% coating.** Engineering judgement used to assess uniformity and adequacy of precoating.
MATERIALS
Aggregates
Five AASHTO No. 8 (PennDOT’s lB) cover aggregates of different mineralogical compositionsand absorptive characteristics were used in this study. Table 2 gives the sources and properties ofthese aggregates. Table 3 gives the specified and as received gradations. llvo gradations (gradedand single-size) as shown in Table 3 were used in the study for all five aggregates. Thesegradations were held consistent to eliminate gradation as a variable. The gradation of AASHTONo. 8 aggregate was based on the average of 425 samples of aggregates in Pennsylvania.

Kandhal & Motter
5
Table 2. Sources and Properties of Aggregates UsedAggregate Number
1 2 3 4 5Producer New
EnterpriseStone &Lime Co.Ashcom
Obtainedfrom Dist. 5-
0
WyomingSand &
Stone Co.Eaton Twp.
ColumbiaAsphaltCorp.
Bloomsburg
StateAggregates
Clifford
Type Limestone Limestone Gravel Siltstone SandstoneBulk Sp. Gr. 2.795 2.758 2.559 2.678 2.639% WaterAbsorption
0.31 0.97 1.95 1.69 1.66
FlakinessIndex
27.2 54.2 15.9 28.0 16.0
Median Size,Inch
0.26 0.26 0.26 0.26 0.26
AverageLeastDimension,in.
0.185 0.15 0.20 0.185 0.20
ParticleIndex(ASTMD3398)
15.9 --- 12.3 14.7 13.9
Table 3. Gradation of AggregatesSieve Specification Aggregate Gradation as Received Gradation Used in
Study1 2 3 4 5 Graded* Single-
Size% Pass.
1/2" 100 100 100 100 100 100 100 1003/8" 85-100 94 84 91 93 97 90 100
No. 4 10-30 27 15 26 30 27 18 0No. 8 0-10 4.2 6.0 3.0 2.8 5.1 2.5 0
No. 200 0-2.4 0.2 1.4 0.6 0.4 1.0 Variable Variable* Based on the average of 425 samples of aggregates in Pennsylvania.
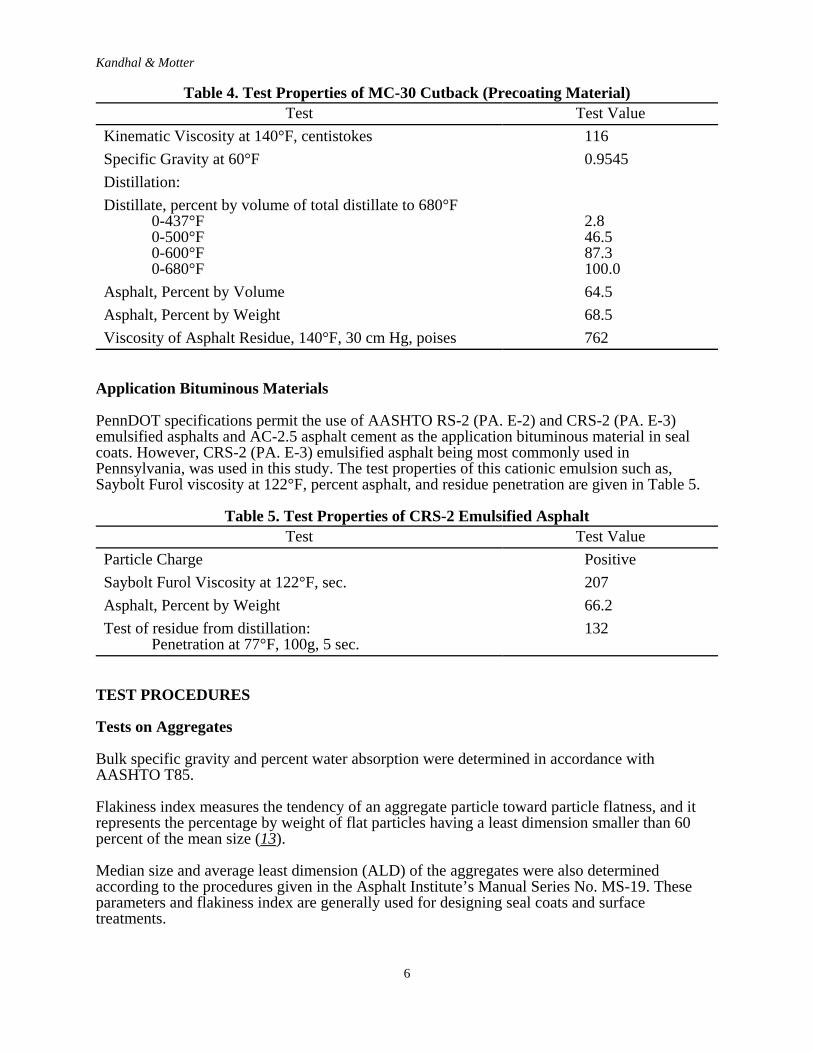
Precoating Bituminous Material
PennDOT specifications permit the use of MC-30 & MC-70 cutback asphalts and AC-20 asphaltcement as a precoating bituminous material. MC-30 Cutback asphalt (AASHTO M82) which ismost commonly used in Pennsylvania, was used. The test properties of MC-30 such as,kinematic viscosity at 140°F, distillate volumes at various temperatures, percent asphalt andasphalt residue viscosity at 140°F, are given in Table 4.
Kandhal & Motter
6
Table 4. Test Properties of MC-30 Cutback (Precoating Material)Test Test Value
Kinematic Viscosity at 140°F, centistokes 116Specific Gravity at 60°F 0.9545Distillation:Distillate, percent by volume of total distillate to 680°F
0-437°F0-500°F0-600°F0-680°F
2.846.587.3100.0
Asphalt, Percent by Volume 64.5Asphalt, Percent by Weight 68.5Viscosity of Asphalt Residue, 140°F, 30 cm Hg, poises 762
Application Bituminous Materials
PennDOT specifications permit the use of AASHTO RS-2 (PA. E-2) and CRS-2 (PA. E-3)emulsified asphalts and AC-2.5 asphalt cement as the application bituminous material in sealcoats. However, CRS-2 (PA. E-3) emulsified asphalt being most commonly used inPennsylvania, was used in this study. The test properties of this cationic emulsion such as,Saybolt Furol viscosity at 122°F, percent asphalt, and residue penetration are given in Table 5.
Table 5. Test Properties of CRS-2 Emulsified AsphaltTest Test Value
Particle Charge PositiveSaybolt Furol Viscosity at 122°F, sec. 207Asphalt, Percent by Weight 66.2Test of residue from distillation:
Penetration at 77°F, 100g, 5 sec.132
TEST PROCEDURES
Tests on Aggregates
Bulk specific gravity and percent water absorption were determined in accordance withAASHTO T85.
Flakiness index measures the tendency of an aggregate particle toward particle flatness, and itrepresents the percentage by weight of flat particles having a least dimension smaller than 60percent of the mean size (13).
Median size and average least dimension (ALD) of the aggregates were also determinedaccording to the procedures given in the Asphalt Institute’s Manual Series No. MS-19. Theseparameters and flakiness index are generally used for designing seal coats and surfacetreatments.
Kandhal & Motter
7
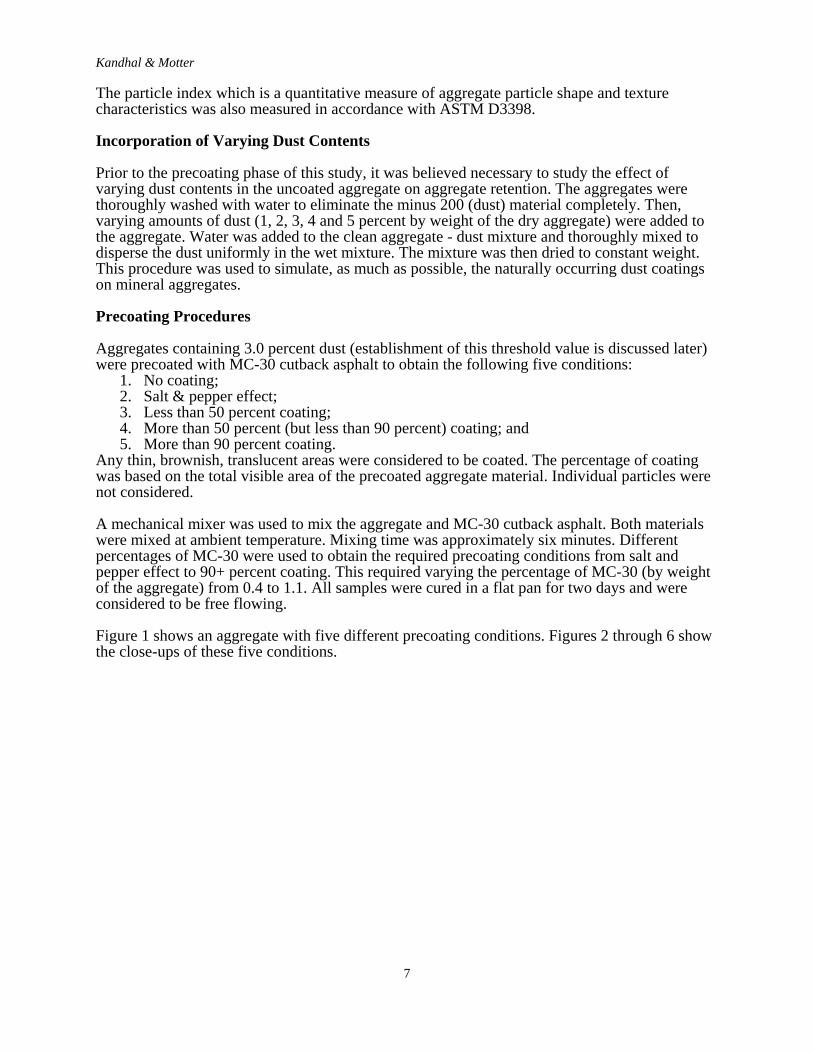
The particle index which is a quantitative measure of aggregate particle shape and texturecharacteristics was also measured in accordance with ASTM D3398.
Incorporation of Varying Dust Contents
Prior to the precoating phase of this study, it was believed necessary to study the effect ofvarying dust contents in the uncoated aggregate on aggregate retention. The aggregates werethoroughly washed with water to eliminate the minus 200 (dust) material completely. Then,varying amounts of dust (1, 2, 3, 4 and 5 percent by weight of the dry aggregate) were added tothe aggregate. Water was added to the clean aggregate - dust mixture and thoroughly mixed todisperse the dust uniformly in the wet mixture. The mixture was then dried to constant weight.This procedure was used to simulate, as much as possible, the naturally occurring dust coatingson mineral aggregates.
Precoating Procedures
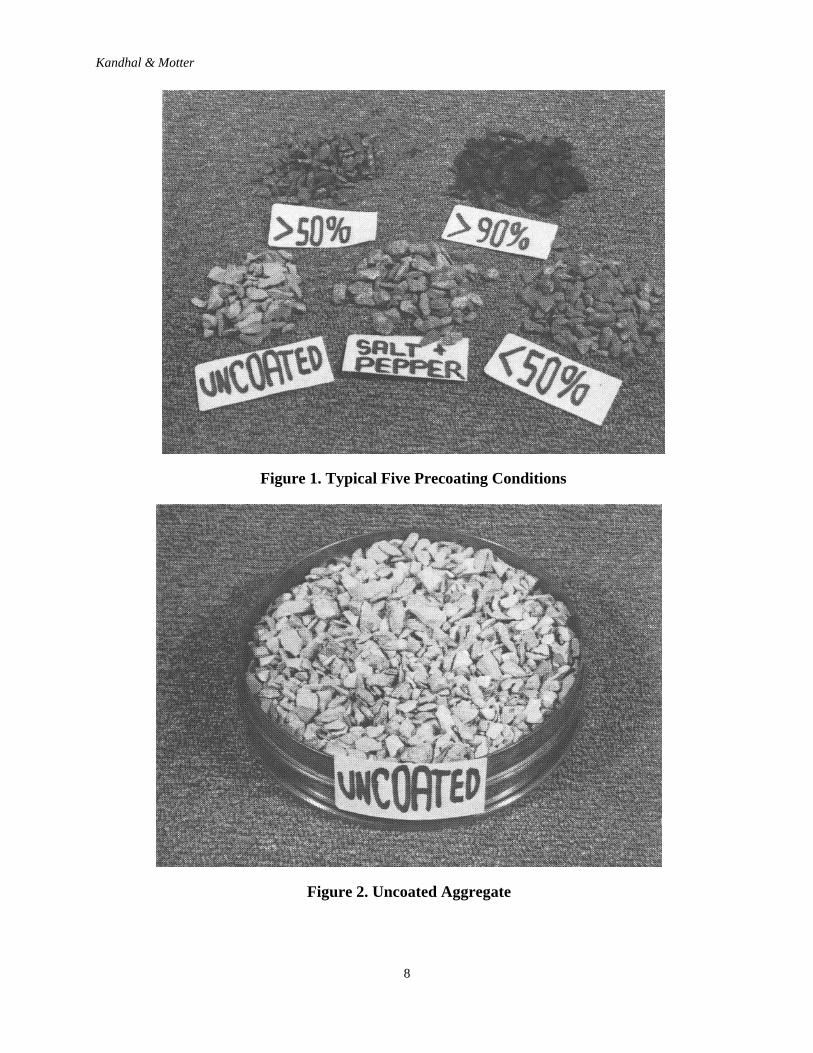
Aggregates containing 3.0 percent dust (establishment of this threshold value is discussed later)were precoated with MC-30 cutback asphalt to obtain the following five conditions:
1. No coating;2. Salt & pepper effect;3. Less than 50 percent coating;4. More than 50 percent (but less than 90 percent) coating; and5. More than 90 percent coating.
Any thin, brownish, translucent areas were considered to be coated. The percentage of coatingwas based on the total visible area of the precoated aggregate material. Individual particles werenot considered.
A mechanical mixer was used to mix the aggregate and MC-30 cutback asphalt. Both materialswere mixed at ambient temperature. Mixing time was approximately six minutes. Differentpercentages of MC-30 were used to obtain the required precoating conditions from salt andpepper effect to 90+ percent coating. This required varying the percentage of MC-30 (by weightof the aggregate) from 0.4 to 1.1. All samples were cured in a flat pan for two days and wereconsidered to be free flowing.
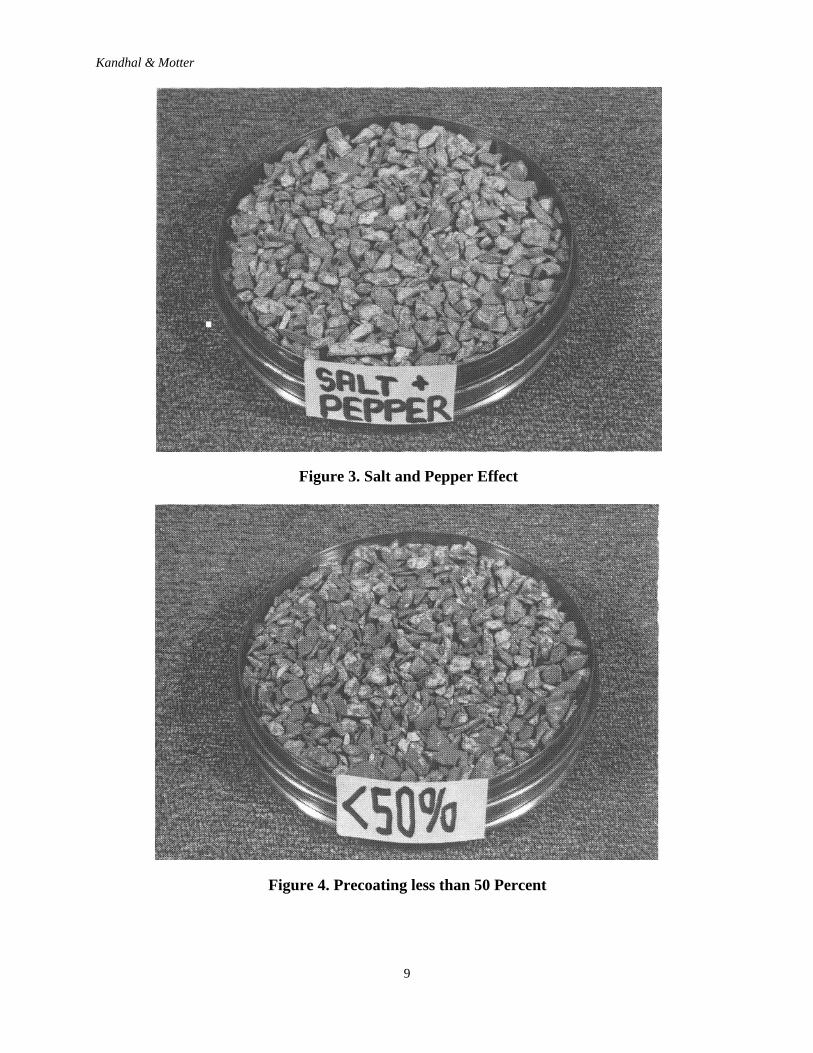
Figure 1 shows an aggregate with five different precoating conditions. Figures 2 through 6 showthe close-ups of these five conditions.
Kandhal & Motter
8
Figure 2. Uncoated Aggregate
Figure 1. Typical Five Precoating Conditions
Kandhal & Motter
9
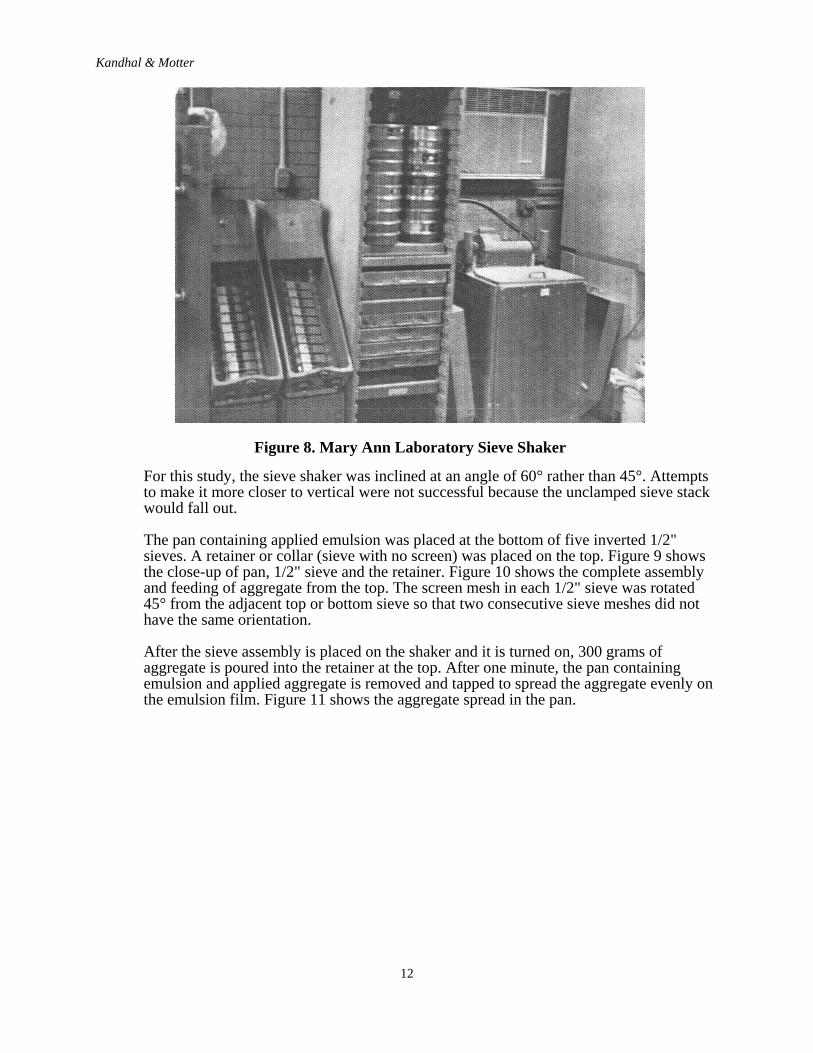
Figure 3. Salt and Pepper Effect
Figure 4. Precoating less than 50 Percent

Kandhal & Motter
10
Figure 6. Precoating More Than 90 Percent
Figure 5. Precoating more than 50 Percent

Kandhal & Motter
11
Pennsylvania Aggregate Retention Test
This test method was developed by trial and error during this study. It is a very simple method.The testing equipment needed is available in most highway materials testing laboratories. Theequipment primarily consists of 8" sieves, 8" pans, a sieve shaker (sifter), rubber pads, acompression machine and a balance.
The procedure is described below:
1. Application of Bituminous Material: The emulsified asphalt (CRS-2) was poured on theback side of an 8" separator pan to obtain an application rate of 0.25 gallon per sq. yd.The emulsion was applied at 140 ± 5°F, and its weight was 36.8 grams to give the desiredapplication rate in an 8" diameter pan. Figure 7 shows a pan with applied emulsion. Theemulsion is exhibiting some curling because the pan was tilted for taking the picture.
2. Application of Cover Aggregate: It was established by trials that 300 grams of aggregateis sufficient to obtain a single particle layer in the 8" diameter pan. This corresponds to17.4 lbs. per sq. yd. In the field the aggregate is applied by a chip spreader. It is difficultto simulate the field application in the laboratory. However, an attempt was made tomechanize the process to minimize the variation in applications.
A Mary Ann laboratory sieve shaker (or sifter) as shown in Figure 8 was used. It ismanufactured by Rainhart Co., Austin, Texas. It can take an unclamped stack of 8"diameter x 2" deep standard laboratory sieves and pans. These are laid on a pair of 45°inclined rubber-covered power-driven rollers which revolve the stack. The pan bottomrests on a free-wheeling turntable. The aggregate is tumbled, mixed and passed as it iscarried up on the revolving inclined screen wire. To encourage clearing the openings, thesieve frames are tapped laterally (from below) by hardwood faced aluminum hammers.These cam-cocked and spring thrown hammers are pivoted on nylon sleeve bearing.
Figure 7. Pan with applied Emulsified Asphalt
Kandhal & Motter
12
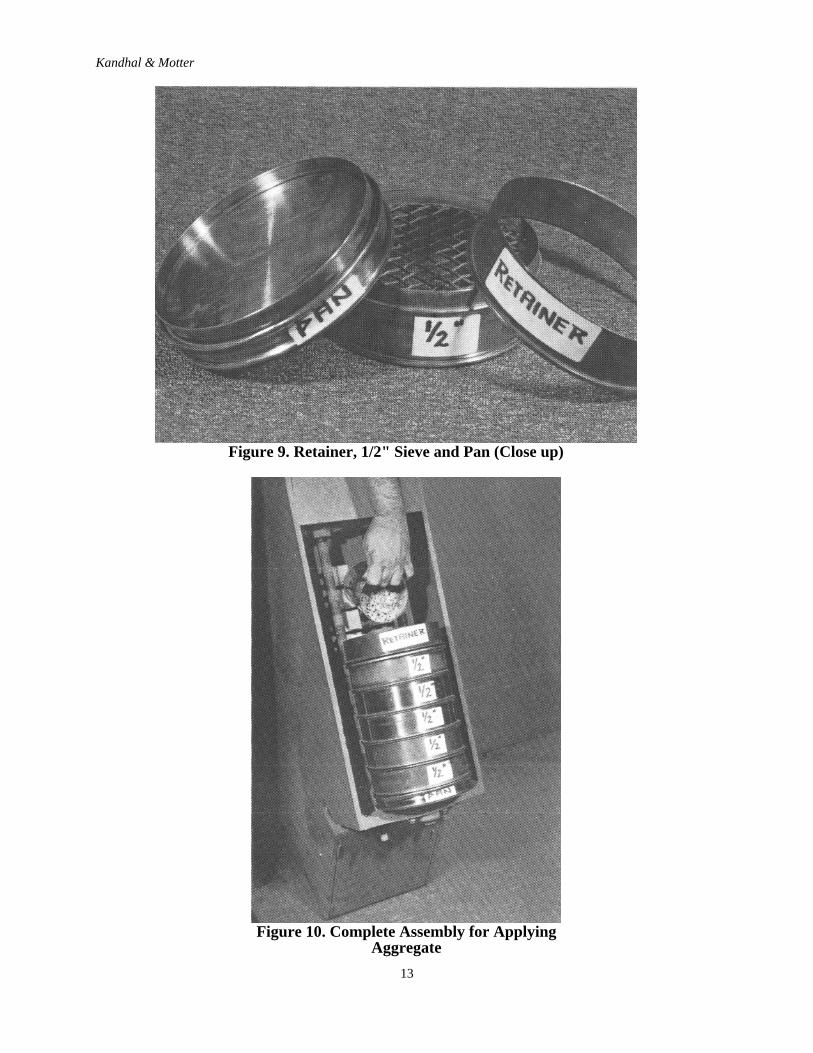
For this study, the sieve shaker was inclined at an angle of 60° rather than 45°. Attemptsto make it more closer to vertical were not successful because the unclamped sieve stackwould fall out.
The pan containing applied emulsion was placed at the bottom of five inverted 1/2"sieves. A retainer or collar (sieve with no screen) was placed on the top. Figure 9 showsthe close-up of pan, 1/2" sieve and the retainer. Figure 10 shows the complete assemblyand feeding of aggregate from the top. The screen mesh in each 1/2" sieve was rotated45° from the adjacent top or bottom sieve so that two consecutive sieve meshes did nothave the same orientation.
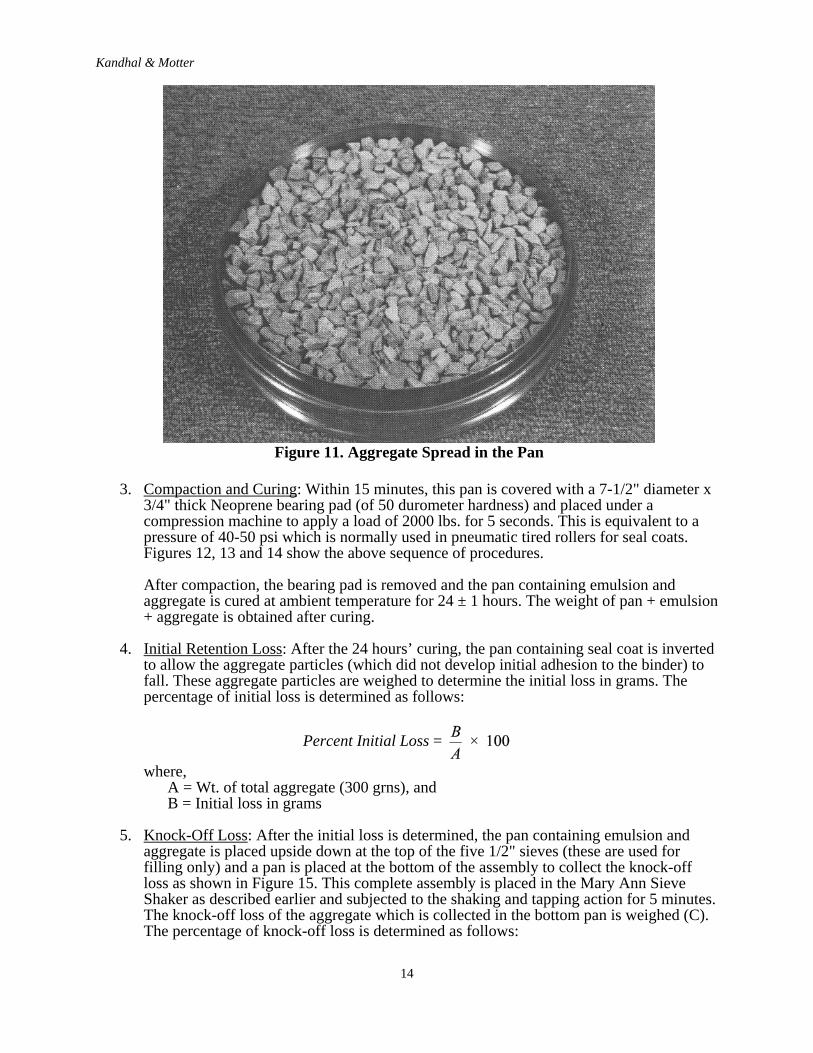
After the sieve assembly is placed on the shaker and it is turned on, 300 grams ofaggregate is poured into the retainer at the top. After one minute, the pan containingemulsion and applied aggregate is removed and tapped to spread the aggregate evenly onthe emulsion film. Figure 11 shows the aggregate spread in the pan.
Figure 8. Mary Ann Laboratory Sieve Shaker
Kandhal & Motter
13
Figure 10. Complete Assembly for ApplyingAggregate
Figure 9. Retainer, 1/2" Sieve and Pan (Close up)
Kandhal & Motter
14
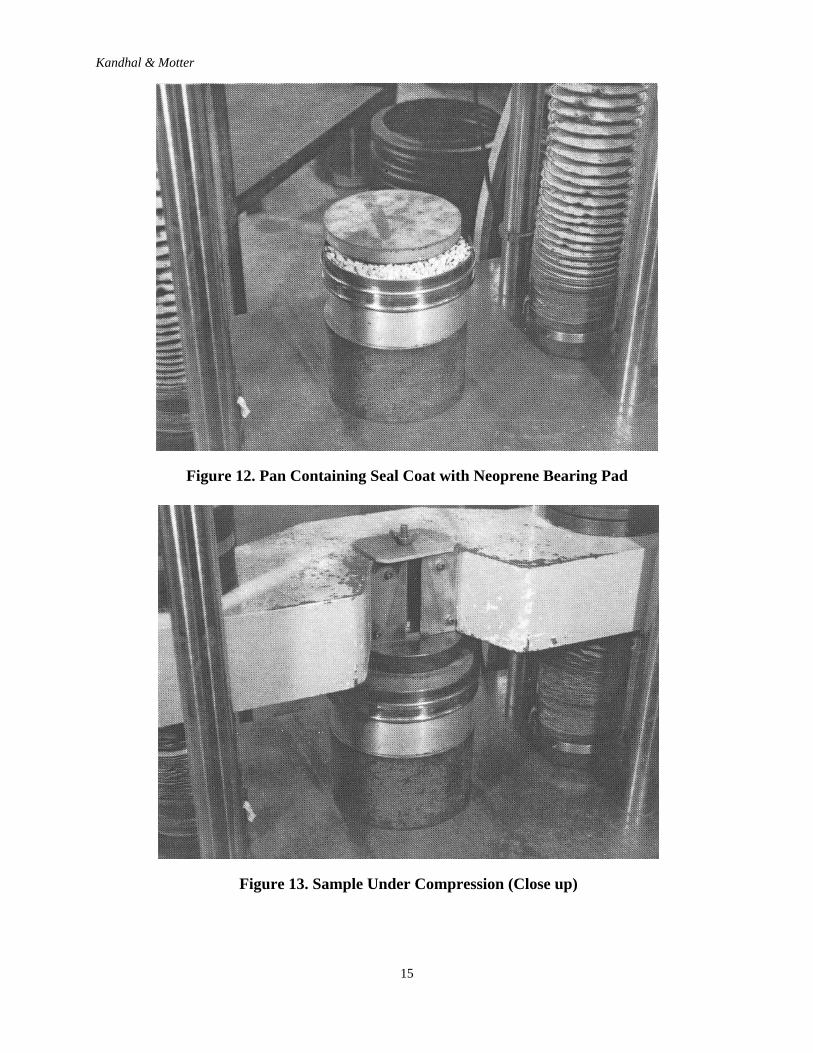
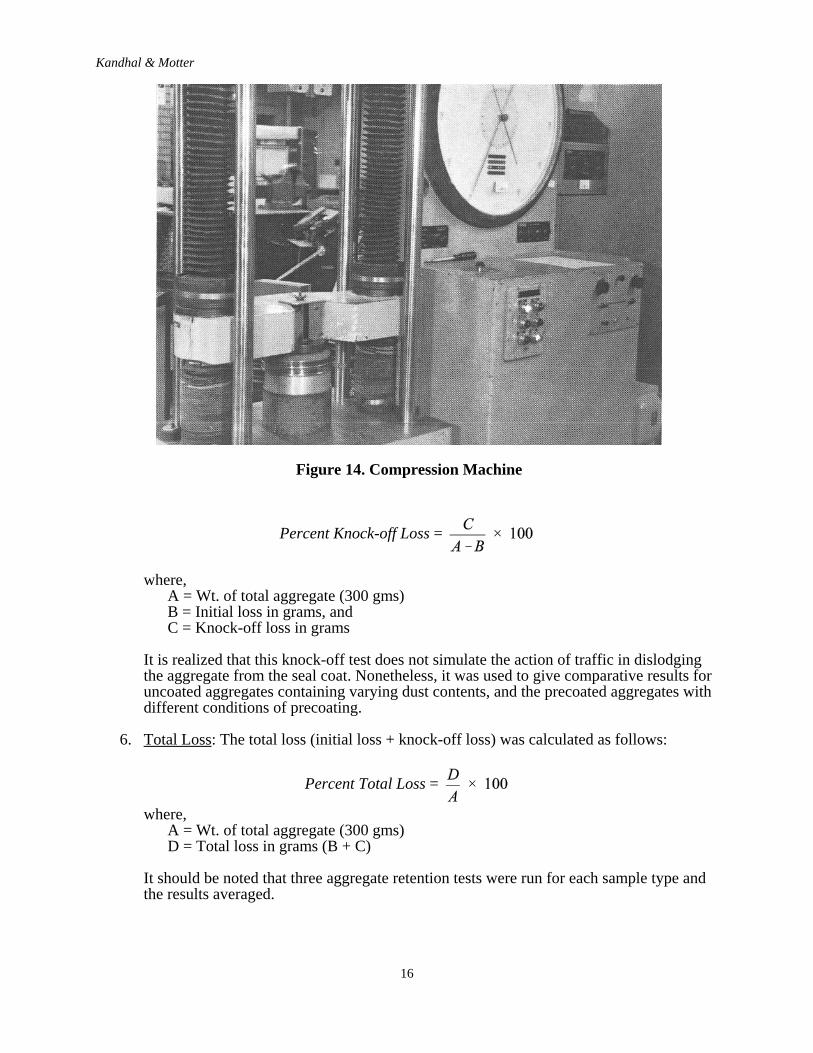
3. Compaction and Curing: Within 15 minutes, this pan is covered with a 7-1/2" diameter x3/4" thick Neoprene bearing pad (of 50 durometer hardness) and placed under acompression machine to apply a load of 2000 lbs. for 5 seconds. This is equivalent to apressure of 40-50 psi which is normally used in pneumatic tired rollers for seal coats.Figures 12, 13 and 14 show the above sequence of procedures.
After compaction, the bearing pad is removed and the pan containing emulsion andaggregate is cured at ambient temperature for 24 ± 1 hours. The weight of pan + emulsion+ aggregate is obtained after curing.
4. Initial Retention Loss: After the 24 hours’ curing, the pan containing seal coat is invertedto allow the aggregate particles (which did not develop initial adhesion to the binder) tofall. These aggregate particles are weighed to determine the initial loss in grams. Thepercentage of initial loss is determined as follows:
Percent Initial Loss =
where, A = Wt. of total aggregate (300 grns), andB = Initial loss in grams
5. Knock-Off Loss: After the initial loss is determined, the pan containing emulsion andaggregate is placed upside down at the top of the five 1/2" sieves (these are used forfilling only) and a pan is placed at the bottom of the assembly to collect the knock-offloss as shown in Figure 15. This complete assembly is placed in the Mary Ann SieveShaker as described earlier and subjected to the shaking and tapping action for 5 minutes.The knock-off loss of the aggregate which is collected in the bottom pan is weighed (C).The percentage of knock-off loss is determined as follows:
Figure 11. Aggregate Spread in the Pan
Kandhal & Motter
15
Figure 12. Pan Containing Seal Coat with Neoprene Bearing Pad
Figure 13. Sample Under Compression (Close up)
Kandhal & Motter
16
Percent Knock-off Loss =
where,A = Wt. of total aggregate (300 gms)B = Initial loss in grams, andC = Knock-off loss in grams
It is realized that this knock-off test does not simulate the action of traffic in dislodgingthe aggregate from the seal coat. Nonetheless, it was used to give comparative results foruncoated aggregates containing varying dust contents, and the precoated aggregates withdifferent conditions of precoating.
6. Total Loss: The total loss (initial loss + knock-off loss) was calculated as follows:
Percent Total Loss =
where,A = Wt. of total aggregate (300 gms)D = Total loss in grams (B + C)
It should be noted that three aggregate retention tests were run for each sample type andthe results averaged.
Figure 14. Compression Machine

Kandhal & Motter
17
TEST RESULTS AND DISCUSSION
Aggregate Test Results
As mentioned earlier, the five aggregates (AASHTO No. 8 size) had different mineralogicalcompositions and absorptive characteristics. Tables 2 and 3 give the properties of the aggregatesused. Limestone, gravel, siltstone and sandstone aggregates ranged in water absorption from 0.31to 1.95 percent.
The flakiness index ranged from 15.9 percent (Aggregate 3 - gravel) to 54.2 percent (Aggregate2 - limestone). The National Association of Australian State Road Authorities specifies 35 as themaximum permissible flakiness index for surface treatment.
The median size of 0.26" was same for all aggregates because the same gradation was used. Theaverage least dimension (ALD) determined from median size and flakiness index ranged from0.15 to 0.20".
The particle index ranged from 12.3 (Aggregate 3 - gravel) to 15.9 (Aggregate 1 - limestone).
Figure 15. Knock-off Test Assembly
Kandhal & Motter
18
Effect of Dust Contents on Aggregate Retention
Prior to precoating all aggregates, it was believed necessary to establish the dust content to beused consistently throughout the study. Therefore, varying amounts of dust (1, 2, 3, 4 and 5percent) were added to the aggregates as described earlier.
The single size (3/8" - No. 4) gradation rather than the total (1/2" - No. 8) gradation was used toobtain better and more consistent results. Pennsylvania Aggregate Retention Test describedearlier was used.
Figure 16 gives the plots of percent dust content versus percent knock-off loss for all aggregates.The following trends have been observed in this figure:
1. The rate of increase in knock-off loss with increasing dust contents (slope of the percentdust content versus percent knock-off loss line) becomes significantly greater after about3 percent dust content in most cases. Therefore, this was considered a threshold value forall practical purposes and was used prior to precoating in the next phase of this study.
2. Most states specify a maximum of 2 percent (or 2.4 percent rounded off to 2) dust forunwashed aggregates. This seems to be reasonable for low volume roads particularly ifthe cost of washing or precoating the aggregate is very high.
3. No correlation was observed between the percent knock-off loss and percent waterabsorption or particle index of the aggregate. However, a good relationship was observedwhen the flakiness indices of the aggregates and the corresponding aggregate retentionlosses were ranked (12). It shows the trend that the aggregate retention loss increaseswith increasing values of flakiness index. It is quite possible that the flaky (flat) particlesdid not get pressed down well into the bituminous binder when compressed with theNeoprene bearing pad (pneumatic tired roller in the field) because of the surroundingprotruding cubical particles. Therefore, when the percentage of flat particles in thesample (or flakiness index) increases the corresponding retention loss also increases.
Effect of Degree of Precoating on Aggregate Retention
All aggregates containing 3.0 percent dust contents were precoated to obtain five differentconditions as described earlier in precoating procedures. Ten evaluators made subjective visualdeterminations of the percentage of coating on all aggregates for three conditions: less than 50percent, more than 50 percent (but less than 90 percent), and more than 90 percent. The data isgiven in Table 6. It should be noted from the average data that it was difficult to achieve thecondition of less than 50 percent precoating in actual practice because then the precoatedaggregate tended to border on salt and pepper effect. The average observed coating obtained forthis condition actually ranged from 45 to 54 percent. This can reasonably be considered about 50percent although the tables will indicate it to be less than 50 percent.

Kandhal & Motter
19
Figure 16. Percent Dust Content vs. Knock-off Loss (All Aggregates/One Size)

Kandhal & Motter
20
Table 6. Subjective Evaluation of Percent coating (10 Evaluators)
Evalu-ator
Percent Coating by ObservationAggregate 1 Aggregate 2 Aggregate 3 Aggregate 4 Aggregate 5<50 >50 90+ <50 >50 90+ <50 >50 90+ <50 >50 90+ <50 >50 90+
1 60 80 95 50 90 98 50 80 98 50 80 98 60 90 982 50 75 99 35 75 99 40 65 99 35 65 99 80 90 993 40 70 98 40 80 95 30 50 98 30 50 92 40 80 974 50 75 95 60 80 98 50 70 98 50 75 98 60 75 985 60 75 98 55 85 98 65 85 99 55 75 97 50 75 976 55 70 98 60 80 99 50 80 99 45 80 99 55 85 997 50 80 100 60 90 100 55 75 97 45 70 94 50 85 98
8 40 60 97 40 70 98 40 55 99 40 65 97 40 70 989 50 70 96 30 60 98 50 60 97 40 65 96 40 65 95
10 65 75 100 65 70 96 75 85 98 60 70 92 60 75 930 52 73 98 50 78 98 50 70 98 45 70 96 54 79 97
Std.Dev.
8.2 5.9 1.8 12.4 9.5 1.4 12.8 12.6 0.8 9.1 9.0 2.7 12.5 8.4 1.9
Note: It was difficult to obtain less than 50 percent coating because then it approached salt & pepper effect.
Table 6 gives the mean and standard deviations of percent coating on 15 precoated aggregatesamples observed by 10 evaluators. It is quite evident from the data that the standard deviationdecreases as the percentage of coating increases. In other words, the agreement between differentevaluators becomes increasingly better when the percentage of coating is increased from 50 to90+, the best agreement being for 90+ percent coating. It should be noted that the currentPennDOT specifications require 90+ percent precoating and few, if any, problems have beenexperienced in judging this specified minimum percentage of precoating. It has been recognizedby the American Society for Testing and Materials (ASTM) based on cooperative tests that onlyat 95 percent level can a reasonable degree of the reproducibility be obtained when rating thesame sample by visual estimation. ASTM specifies 95 percent level in ASTM D 1664-80“Coating and Stripping of Bitumen-Aggregate Mixtures” as a go-no-go test because theprecision is not satisfactory for applications at lower levels (14).
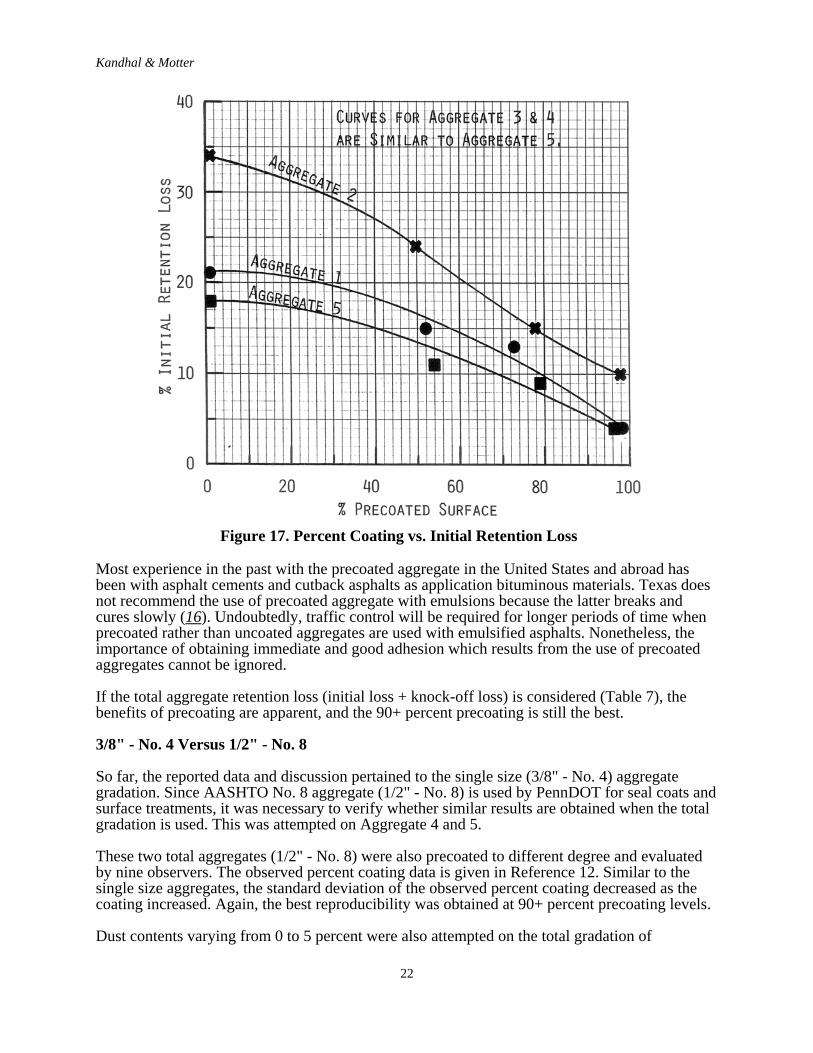
All five aggregate precoated to different degrees were subjected to the Pennsylvania AggregateRetention Test. Table 7 gives the aggregate retention loss data in percentages. Figure 17 givesthe plots of percent precoated surface versus percent initial retention loss. The followingobservations are made:
1. Considering the percent initial loss, the 90+ percent precoating is by far the best. Thismeans that immediate adhesion of the cover aggregate with the bituminous binder is bestobtained with 90+ percent precoating. The primary function of precoating is to obtainimmediate adhesion as discussed earlier in the review of literature.
2. Increasing the percentage of precoating decreased the initial aggregate retention loss. Saltand pepper condition is better than uncoated aggregate and so forth.
3. Initial aggregate retention loss was reduced by as much as 80 percent when the uncoatedaggregate (containing 3 percent dust) was precoated with 90+ percent coating.
Kandhal & Motter
21
Table 7. Effect of Precoating on Aggregate Retention Loss (Percent)Coating Aggregate Number
1 2 3 4 5% Initial Loss
No Coating 21 34 18 21 18S. & P. 18 30 14 17 12
Less than 50% 15 24 10 11 11More than 50% 13 15 10 10 9
90%+ 4 10 4 3 4% Knock-off Loss
No Coating 12 13 10 16 11S. & P. 10 19 10 15 7
Less than 50% 10 17 7 10 5More than 50% 11 19 6 8 4
90%+ 15 27 9 13 8% Total Loss
No Coating 31 43 26 34 27S. & P. 26 44 22 29 19
Less than 50% 23 37 17 21 16More than 50% 22 31 15 17 13
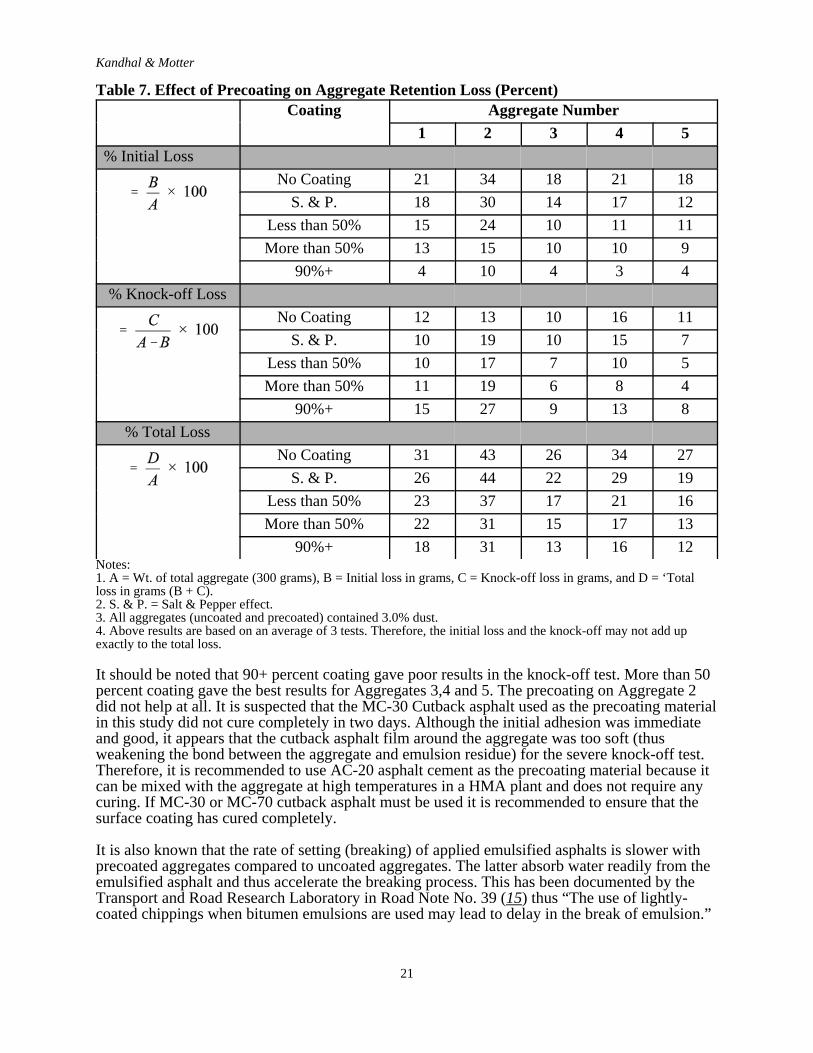
90%+ 18 31 13 16 12Notes: 1. A = Wt. of total aggregate (300 grams), B = Initial loss in grams, C = Knock-off loss in grams, and D = ‘Totalloss in grams (B + C).2. S. & P. = Salt & Pepper effect.3. All aggregates (uncoated and precoated) contained 3.0% dust.4. Above results are based on an average of 3 tests. Therefore, the initial loss and the knock-off may not add upexactly to the total loss.
It should be noted that 90+ percent coating gave poor results in the knock-off test. More than 50percent coating gave the best results for Aggregates 3,4 and 5. The precoating on Aggregate 2did not help at all. It is suspected that the MC-30 Cutback asphalt used as the precoating materialin this study did not cure completely in two days. Although the initial adhesion was immediateand good, it appears that the cutback asphalt film around the aggregate was too soft (thusweakening the bond between the aggregate and emulsion residue) for the severe knock-off test.Therefore, it is recommended to use AC-20 asphalt cement as the precoating material because itcan be mixed with the aggregate at high temperatures in a HMA plant and does not require anycuring. If MC-30 or MC-70 cutback asphalt must be used it is recommended to ensure that thesurface coating has cured completely.
It is also known that the rate of setting (breaking) of applied emulsified asphalts is slower withprecoated aggregates compared to uncoated aggregates. The latter absorb water readily from theemulsified asphalt and thus accelerate the breaking process. This has been documented by theTransport and Road Research Laboratory in Road Note No. 39 (15) thus “The use of lightly-coated chippings when bitumen emulsions are used may lead to delay in the break of emulsion.”
Kandhal & Motter
22
Most experience in the past with the precoated aggregate in the United States and abroad hasbeen with asphalt cements and cutback asphalts as application bituminous materials. Texas doesnot recommend the use of precoated aggregate with emulsions because the latter breaks andcures slowly (16). Undoubtedly, traffic control will be required for longer periods of time whenprecoated rather than uncoated aggregates are used with emulsified asphalts. Nonetheless, theimportance of obtaining immediate and good adhesion which results from the use of precoatedaggregates cannot be ignored.
If the total aggregate retention loss (initial loss + knock-off loss) is considered (Table 7), thebenefits of precoating are apparent, and the 90+ percent precoating is still the best.
3/8" - No. 4 Versus 1/2" - No. 8
So far, the reported data and discussion pertained to the single size (3/8" - No. 4) aggregategradation. Since AASHTO No. 8 aggregate (1/2" - No. 8) is used by PennDOT for seal coats andsurface treatments, it was necessary to verify whether similar results are obtained when the totalgradation is used. This was attempted on Aggregate 4 and 5.
These two total aggregates (1/2" - No. 8) were also precoated to different degree and evaluatedby nine observers. The observed percent coating data is given in Reference 12. Similar to thesingle size aggregates, the standard deviation of the observed percent coating decreased as thecoating increased. Again, the best reproducibility was obtained at 90+ percent precoating levels.
Dust contents varying from 0 to 5 percent were also attempted on the total gradation of
Figure 17. Percent Coating vs. Initial Retention Loss
Kandhal & Motter
23
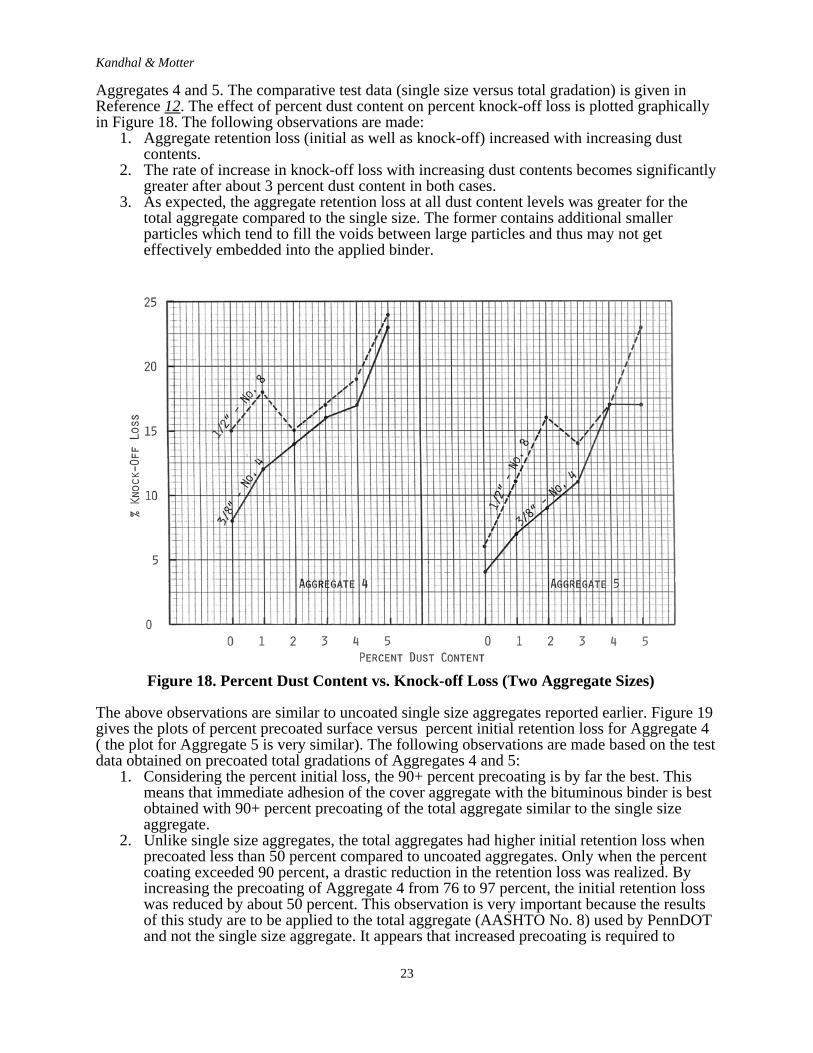
Aggregates 4 and 5. The comparative test data (single size versus total gradation) is given inReference 12. The effect of percent dust content on percent knock-off loss is plotted graphicallyin Figure 18. The following observations are made:
1. Aggregate retention loss (initial as well as knock-off) increased with increasing dustcontents.
2. The rate of increase in knock-off loss with increasing dust contents becomes significantlygreater after about 3 percent dust content in both cases.
3. As expected, the aggregate retention loss at all dust content levels was greater for thetotal aggregate compared to the single size. The former contains additional smallerparticles which tend to fill the voids between large particles and thus may not geteffectively embedded into the applied binder.
The above observations are similar to uncoated single size aggregates reported earlier. Figure 19gives the plots of percent precoated surface versus percent initial retention loss for Aggregate 4( the plot for Aggregate 5 is very similar). The following observations are made based on the testdata obtained on precoated total gradations of Aggregates 4 and 5:
1. Considering the percent initial loss, the 90+ percent precoating is by far the best. Thismeans that immediate adhesion of the cover aggregate with the bituminous binder is bestobtained with 90+ percent precoating of the total aggregate similar to the single sizeaggregate.
2. Unlike single size aggregates, the total aggregates had higher initial retention loss whenprecoated less than 50 percent compared to uncoated aggregates. Only when the percentcoating exceeded 90 percent, a drastic reduction in the retention loss was realized. Byincreasing the precoating of Aggregate 4 from 76 to 97 percent, the initial retention losswas reduced by about 50 percent. This observation is very important because the resultsof this study are to be applied to the total aggregate (AASHTO No. 8) used by PennDOTand not the single size aggregate. It appears that increased precoating is required to
Figure 18. Percent Dust Content vs. Knock-off Loss (Two Aggregate Sizes)

Kandhal & Motter
24
effectively bind the dust to the graded aggregate particles. This will be more evidentwhen the end result test data are discussed later.
End Result Tests
It has been demonstrated in the previous discussions that the subjective visual evaluation test issuitable and reasonably reproducible for 90+ percent precoated aggregates. However, thefollowing end result type tests were attempted on the precoated total aggregate (1/2" - No. 8) toeliminate the subjective evaluation for final acceptance:
1. Dry Gradation Test: Since the precoated aggregates are free flowin , the samples weresubjected to dry gradation test using 1/2", 3/8", No. 4, 8, 16, 30, 50, 100 and 200 sieves(sieving time was 10 minutes). This was attempted to quantify the presence of unboundfine material (passing No. 8) and dust (passing No. 200) in the sample. Table 8 containsthe dry gradation data for all five aggregates precoated to different degree.
Figure 19. Percent Precoating vs. Initial Retention Loss (Two Aggregate Sizes)

Kandhal & Motter
25
Table 8. Dry Gradation, Wash and Decantation Test Data (Precoated Total Aggregate)Test Aggregate 1 Aggregate 2 Aggregate 3
S&P <50 >50 90+ S&P <50 >50 90+ S&P <50 >50 90+
I. Dry Grada-tion% Pass. 1/2" 100 100 100 100 100 100 100 100 100 100 100 1003/8" 91 92 92 92 93 92 93 92 92 92 90 93No. 4 21 22 23 19 22 21 21 17 21 21 20 19No. 8 2.1 2.1 2.1 0.2 2.8 2.3 1.9 0.6 3.1 3.0 2.3 1.0No. 16 1.8 1.7 1.7 0.03 2.2 1.8 1.4 0.07 2.0 2.0 1.2 0.20No. 30 1.7 1.7 1.6 0 2.2 1.7 1.3 0.05 1.9 2.0 1.2 0.09No. 50 1.7 1.6 1.6 0 2.1 1.7 1.2 0 1.9 1.9 1.2 0.08No. 100 1.6 1.5 1.5 0 2.0 1.6 1.1 0 1.8 1.9 1.1 0.07No. 200 1.4 1.4 1.3 0 1.8 1.4 0.9 0 1.7 1.8 0.9 0.06II. Wash Test% Pass No. 200 1.4 1.4 1.2 0.2 1.9 1.5 1.2 0.2 1.4 1.1 0.7 0.2III. DecantationTest% Loss 2.1 2.3 2.4 0.2 2.7 2.2 2.1 0.2 2.5 1.4 1.5 0.2
Test Aggregate 4 Aggregate 5S&P <50 >50 90+ S&P <50 >50 90+
I. Dry Gradation% Pass. 1/2" 100 100 100 100 100 100 100 1003/8" 91 93 91 92 95 93 96 96No. 4 22 20 18 15 21 21 21 22No. 8 2.1 1.7 1.1 0.26 2.0 2.1 1.2 0.7No. 16 1.7 1.4 0.8 0.04 1.4 1.5 0.5 0.1No. 30 1.7 1.3 0.8 0.02 1.4 1.4 0.5 0.1No. 50 1.7 1.2 0.7 0.01 1.3 1.3 0.4 0.04No. 100 1.6 1.1 0.6 0 1.2 1.3 0.4 0.01No. 200 1.5 1.0 0.4 0 1.0 1.0 0.3 0.01II. Wash Test% Pass No. 200 1.4 1.4 0.9 0.2 0.8 0.9 0.4 0.3III. DecantationTest% Loss 2.1 2.1 1.4 0.2 1.5 1.5 0.5 0.1
Kandhal & Motter
26
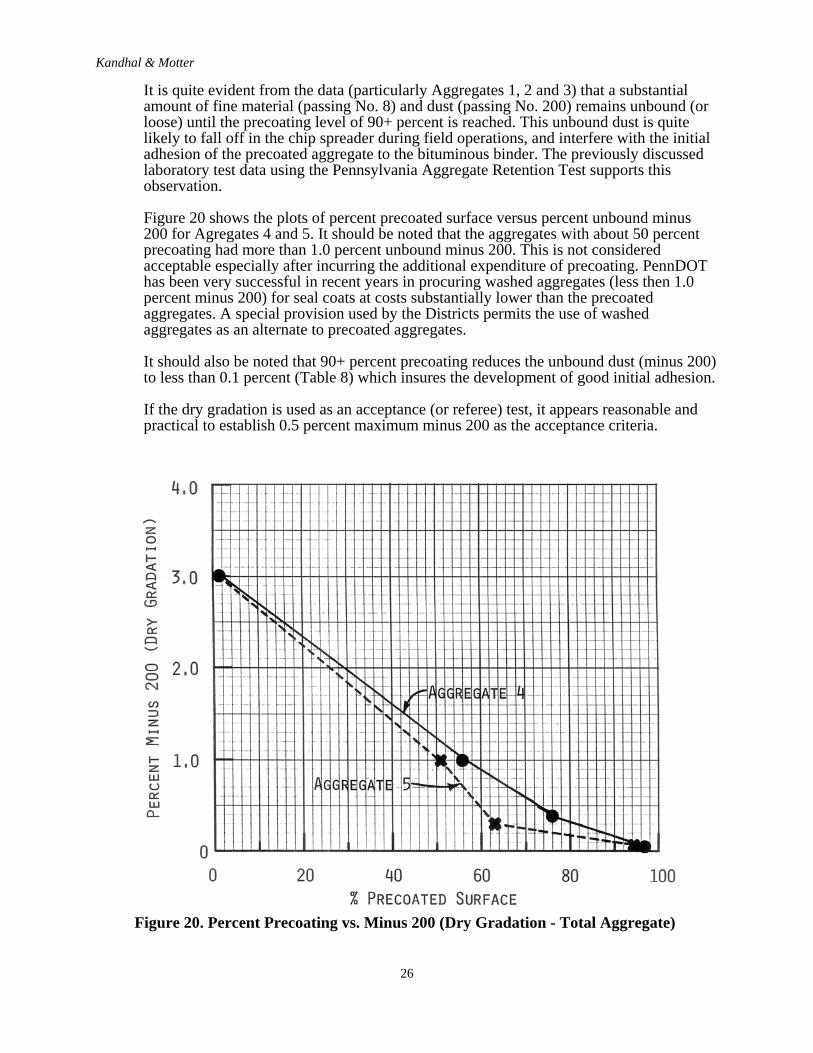
It is quite evident from the data (particularly Aggregates 1, 2 and 3) that a substantialamount of fine material (passing No. 8) and dust (passing No. 200) remains unbound (orloose) until the precoating level of 90+ percent is reached. This unbound dust is quitelikely to fall off in the chip spreader during field operations, and interfere with the initialadhesion of the precoated aggregate to the bituminous binder. The previously discussedlaboratory test data using the Pennsylvania Aggregate Retention Test supports thisobservation.
Figure 20 shows the plots of percent precoated surface versus percent unbound minus200 for Agregates 4 and 5. It should be noted that the aggregates with about 50 percentprecoating had more than 1.0 percent unbound minus 200. This is not consideredacceptable especially after incurring the additional expenditure of precoating. PennDOThas been very successful in recent years in procuring washed aggregates (less then 1.0percent minus 200) for seal coats at costs substantially lower than the precoatedaggregates. A special provision used by the Districts permits the use of washedaggregates as an alternate to precoated aggregates.
It should also be noted that 90+ percent precoating reduces the unbound dust (minus 200)to less than 0.1 percent (Table 8) which insures the development of good initial adhesion.
If the dry gradation is used as an acceptance (or referee) test, it appears reasonable andpractical to establish 0.5 percent maximum minus 200 as the acceptance criteria.
Figure 20. Percent Precoating vs. Minus 200 (Dry Gradation - Total Aggregate)
Kandhal & Motter
27
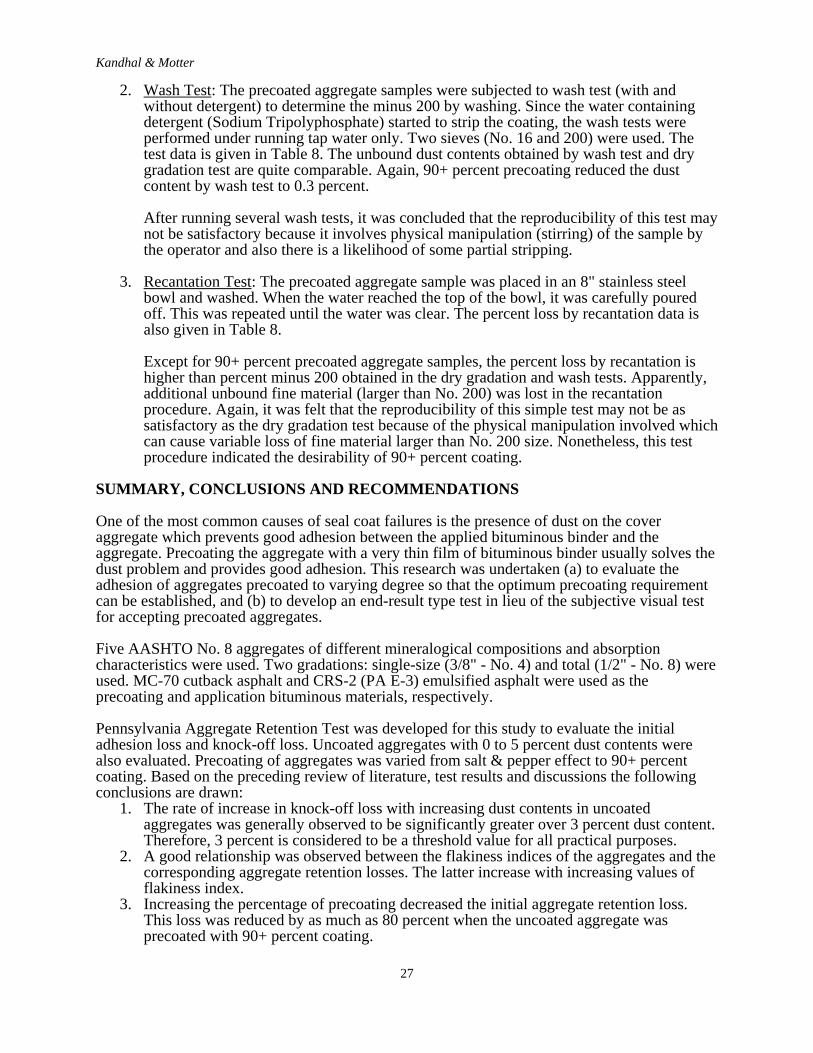
2. Wash Test: The precoated aggregate samples were subjected to wash test (with andwithout detergent) to determine the minus 200 by washing. Since the water containingdetergent (Sodium Tripolyphosphate) started to strip the coating, the wash tests wereperformed under running tap water only. Two sieves (No. 16 and 200) were used. Thetest data is given in Table 8. The unbound dust contents obtained by wash test and drygradation test are quite comparable. Again, 90+ percent precoating reduced the dustcontent by wash test to 0.3 percent.
After running several wash tests, it was concluded that the reproducibility of this test maynot be satisfactory because it involves physical manipulation (stirring) of the sample bythe operator and also there is a likelihood of some partial stripping.
3. Recantation Test: The precoated aggregate sample was placed in an 8" stainless steelbowl and washed. When the water reached the top of the bowl, it was carefully pouredoff. This was repeated until the water was clear. The percent loss by recantation data isalso given in Table 8.
Except for 90+ percent precoated aggregate samples, the percent loss by recantation ishigher than percent minus 200 obtained in the dry gradation and wash tests. Apparently,additional unbound fine material (larger than No. 200) was lost in the recantationprocedure. Again, it was felt that the reproducibility of this simple test may not be assatisfactory as the dry gradation test because of the physical manipulation involved whichcan cause variable loss of fine material larger than No. 200 size. Nonetheless, this testprocedure indicated the desirability of 90+ percent coating.
SUMMARY, CONCLUSIONS AND RECOMMENDATIONS
One of the most common causes of seal coat failures is the presence of dust on the coveraggregate which prevents good adhesion between the applied bituminous binder and theaggregate. Precoating the aggregate with a very thin film of bituminous binder usually solves thedust problem and provides good adhesion. This research was undertaken (a) to evaluate theadhesion of aggregates precoated to varying degree so that the optimum precoating requirementcan be established, and (b) to develop an end-result type test in lieu of the subjective visual testfor accepting precoated aggregates.
Five AASHTO No. 8 aggregates of different mineralogical compositions and absorptioncharacteristics were used. Two gradations: single-size (3/8" - No. 4) and total (1/2" - No. 8) wereused. MC-70 cutback asphalt and CRS-2 (PA E-3) emulsified asphalt were used as theprecoating and application bituminous materials, respectively.
Pennsylvania Aggregate Retention Test was developed for this study to evaluate the initialadhesion loss and knock-off loss. Uncoated aggregates with 0 to 5 percent dust contents werealso evaluated. Precoating of aggregates was varied from salt & pepper effect to 90+ percentcoating. Based on the preceding review of literature, test results and discussions the followingconclusions are drawn:
1. The rate of increase in knock-off loss with increasing dust contents in uncoatedaggregates was generally observed to be significantly greater over 3 percent dust content.Therefore, 3 percent is considered to be a threshold value for all practical purposes.
2. A good relationship was observed between the flakiness indices of the aggregates and thecorresponding aggregate retention losses. The latter increase with increasing values offlakiness index.
3. Increasing the percentage of precoating decreased the initial aggregate retention loss.This loss was reduced by as much as 80 percent when the uncoated aggregate wasprecoated with 90+ percent coating.
Kandhal & Motter
28
4. Considering the percent initial retention loss, the 90+ percent precoating was observed byfar the best. This means that immediate adhesion of the cover aggregate with thebituminous binder is best obtained with 90+ percent precoating.
5. Use of AC-20 asphalt cement (in lieu of MC-30 cutback asphalt) as a precoating materialis recommended because it can be mixed with hot dry aggregate in a HMA plant, doesnot need any curing, and will cause better aggregate retention. If MC-30 or MC-70cutback asphalt must be used it should be ensured that the coating has cured completelybefore the precoated aggregate is used.
6. Effects of dust content and extent of precoating on the aggregate retention loss weresimilar for the two gradations: 3/8" - No. 4 (single size) and 1/2" - No. 8 (total). Howeverthe corresponding retention losses were greater in the latter gradation as expectedbecause it contained additional smaller particles.
7. Ten observers made 150 subjective visual examinations of the precoated aggregatesamples. The agreement between different evaluators becomes increasingly better whenthe percentage of coating is increased from 50 to 90+, by far the best agreement(reproducibility) being for 90+ percent coating. The current PennDOT specificationsrequire 90+ percent coating. Few, if any, problems have been experienced in judging thisspecified minimum coating except during the first two years when the precoatedaggregate specifications were introduced in 1980.
8. Three simple end-result type tests: dry gradation test, wash test and recantation test wereattempted on the precoated aggregates in this study. Dry gradation test was determined tobe most appropriate with an acceptance criteria of 0.5 percent maximum minus 200(dust).
The following recommendations are made:1. Continue the current PennDOT specification (17) on the minimum coating of precoated
aggregate (Section 471.2d) which reads as follows:“Provide a precoating of 0.6 to 1.2 percent of residual bituminous binder (by weightof the mix) when using asphalt cement and 0.4 percent to 1.090 when using otherbituminous material. Provide a selected rate sufficient to precoat particles with a thinfilm of bitumen. Coat at least 90 percent of the total visible area of aggregates with abituminous film. Thin, brownish, translucent areas will be considered fully coated. Asample of uncoated aggregate will be used for coating determinations.”
2. Use the dry gradation test as a referee or final acceptance test if the precoating bysubjective visual evaluation is determined to be less than 90 percent. Add the followingto the current specification quoted above:
“If the coating by visual examination is determined to be less than 90 percent by theEngineer, the precoated aggregate will be acceptable if on dry sieving for 10 minutesthe material passing No. 200 sieve does not exceed 0.5 percent.”
3. Caution the construction and maintenance personnel that the setting (breaking) of theemulsified asphalt will take longer time with precoated aggregate compared to uncoatedaggregate and, therefore, traffic control is necessary for longer periods of time.
4. Add the following to Section 471.3(d) Protection of Surface:“Emulsified asphalt, when used in conjunction with precoated aggregates, cure at aslower rate compared to uncoated aggregates. Allow sufficient time to ensure thatcomplete curing has taken place prior to opening to vehicular traffic.”
ACKNOWLEDGMENTS
This research project was undertaken by the Pennsylvania Department of Transportation(PennDOT) with the cooperation of the Federal Highway Administration (FHWA), U.S.Department of Transportation. The opinions, findings, and conclusions expressed here are thoseof the authors and not necessarily those of the Pennsylvania DOT and FHWA. Mr. Thomas

Kandhal & Motter
29
Schmidt obtained most of the test data with assistance of Mr. Morter. Edward Macko preparedthe illustrations. Karen Siegfried and Mary Kathryn Gaylor assisted in the preparation of themanuscript. Messrs. Davis, Koehler, Casner, Nicholas, Ollinger, Lubold, Chilek and Merrillassisted in reviewing the work plan and the research report.
REFERENCES
1. P.S. Kandhal. Simplified Design Approach to Surface Treatments for Low-Volume Roads.Transportation Research Board, Research Record No. 898, 1983.
2. Design of Seal Coats and Surface Treatments. Pennsylvania Department of Transportation,Bulletin No. 27, May 1983.
3. M. Herrin, C.R. Marek and K. Majidzadeh. State of the Art: Surface Treatments-Summary ofExisting Literature. Highway Research Board, Special Report 96, 1968.
4. F.J. Benson and B.M. Gallaway. Retention of Coverstone by Asphalt Surface Treatments.Texas Engineering Experiment Station, Texas A & M College, Bulletin 133, 1953.
5. J.R. Harris. Surface Treatments of Existing Bituminous Surfaces. Proc. Assoc. of AsphaltPaving Technologists, Vol. 24, 1955.
6. W.K Parr. Discussion in Symposium on Seal Coats and Surface Treatments. Proc. Assoc. ofAsphalt Paving Technologists, Vol. 24, 1955.
7. Asphalt Surface Treatments. The Asphalt Institute, Manual Series No. 13, November 1969.8. Bituminous Materials in Road Construction. Department of Scientific and Industrial
Research, Road Research Laboratog, London, 1962.9. N.W. McLeod. Seal Coat and Surface Treatment Design and Construction Using Asphalt
Emulsions. Paper presented at the First Annual Meeting of the Asphalt EmulsionManufacturers Association, Washington, D.C., January 1974.
10. G.L. Hoffman and N.E. Knight. Asphalt Emulsions for Highway Construction (FHWADemonstration Project 55). Pennsylvania Department of Transportation, Research Project80-13, Research Report, October 1980.
11. J.A. Epps, B.M. Gallaway and C.H. Hughes. Field Manual on Design and Construction ofSeal Coats. Texas Transportation Institute, Research Project 214-25, July 1981.
12. P.S. Kandhal and J.B. Motter. Criteria for Accepting Precoated Aggregates for Seal Coatsand Surface Treatments. Pennsylvania Department of Transportation, Research Project 83-19, Final Report, August 1987.
13. N.W. McLeod. A General Method of Design for Seal Coats and Surface Treatments. Proc.Assoc. of Asphalt Paving Technologists, Vol. 38, 1969.
14. Standard Test Method for Coating and Stripping of Bitumen-Aggregate Mixtures. ASTM D1664-80. American Society for Testing and Materials, Vol. 04.03, 1986.
15. A Guide to Surface Dressing in Tropical and Subtropical Countries. Transport and RoadResearch Laboratory, Overseas Road Note 3, 1982.
16. Responses to the Questionnaire on Durable Asphalt Emulsion Seal coats Compiled by AREInc. - Communication dated March 12, 1987.
17. Specifications. Pennsylvania Department of Transportation, Publication 408, 1987.