Criteo 101criteo.investorroom.com/download/CRTO+101+Presentation...Investor Presentation November...
83
Criteo 101 Investor Presentation November 2017
Transcript of Criteo 101criteo.investorroom.com/download/CRTO+101+Presentation...Investor Presentation November...

1
Criteo 101Investor PresentationNovember 2017
2
This presentation contains “forward-looking” statements that are based on our management’s beliefs and assumptions and on information currently available to management. Forward-looking statements include information concerning our possible or assumed future results of operations, business strategies, financing plans, projections, competitive position, industry environment, potential growth opportunities, potential market opportunities and the effects of competition. Forward-looking statements include all statements that are not historical facts and can be identified by terms such as “anticipates,” “believes,” “could,” “seeks,” “estimates,” “intends,” “may,” “plans,” “potential,” “predicts,” “projects,” “should,” “will,” “would” or similar expressions and the negatives of those terms. Forward-looking statements involve known and unknown risks, uncertainties and other factors that may cause our actual results, performance or achievements to be materially different from any future results, performance or achievements expressed or implied by the forward-looking statements. Forward-looking statements represent our management’s beliefs and assumptions only as of the date of this presentation. You should read the Company’s most recent Annual Report on Form 10-K filed on March 1, 2017, including the Risk Factors set forth therein and the exhibits thereto, completely and with the understanding that our actual future results may be materially different from what we expect. Except as required by law, we assume no obligation to update these forward-looking statements publicly, or to update the reasons actual results could differ materially from those anticipated in the forward-looking statements, even if new information becomes available in the future.This presentation includes certain non-GAAP financial measures as defined by SEC rules. As required by Regulation G, we have provided a reconciliation of those measures to the most directly comparable GAAP measures, which is available in the Appendix slides.
Safe harbor statement

3
• Ticker: CRTO
• Stock Exchange: NASDAQ Global Market
• CUSIP: 226718104
• Number of shares
outstanding: 65.3M
• Stock Ownership*:
* As of June 30, 2016
• 2016 Financials
• Revenue: $1,799M, +36% at cc
• Revenue ex-TAC: $730M, +37% at cc
• Adjusted EBITDA: $225M, +55% at cc
• Adj. EBITDA margin: 30.8% of Revenue ex-TAC
93%
4% 3%
Free float
Founders & mgmt
VCs
Stock information and selected financials

4
17,000+ retailer and
brand clients
campaigns in 95+
markets
2,700+ employees
30 officesworldwide
1.2B+ active
monthly shoppers
$550B+annual
commerce sales
$27B annual
post-click sales
Selected KPIs

5
Jean-Baptiste RudelleExecutive Chairman and Co-Founder, 47K-Mobile, Lucent, Roland Berger
Eric EichmannChief Executive Officer, 49Living Social, Rosetta Stone, McKinsey & Co.
Dan TeodosiuChief Technology Officer, 50Google, Microsoft, Hewlett-Packard
Mollie SpilmanChief Operating Officer, 49Millenial Media, Yahoo, Advertising.com, Time Warner
Benoit FouillandChief Financial Officer, 52SAP, Business Objects
Jonathan OpdykeChief Strategy Officer, 40HookLogic, Xerox, Beyond Interactive
Tom AurelioExecutive Vice President, Human Resources, 51Priceline, GE, Symantec, CheerNetworks
Management team
Patrick WyattSenior Vice President, 34Yahoo, Estin & Co.

6
Build the highest performing and open commerce marketing ecosystem
Connect shoppers to the things they need and love
Deliver performance at scale to the retailers and brandswho participate
Our vision
7
Technology Performance
Scale Global Presence
Commerce marketing is deeply rooted in our DNA
8
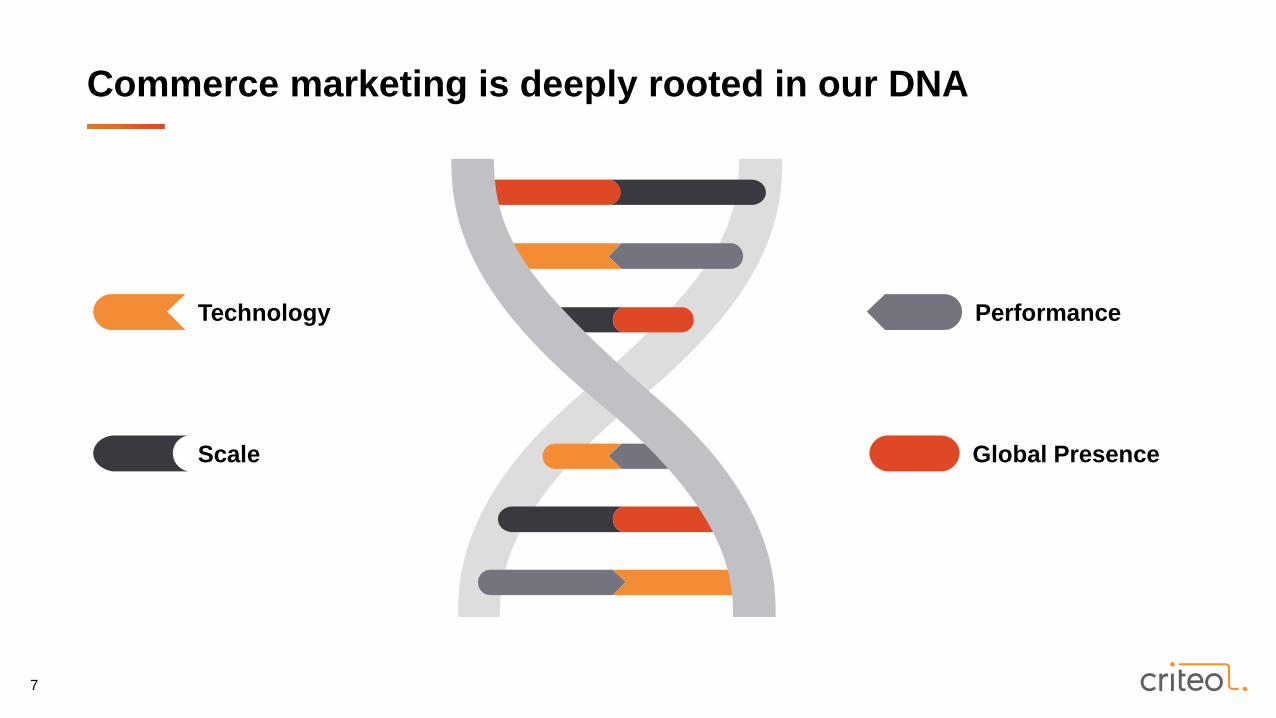
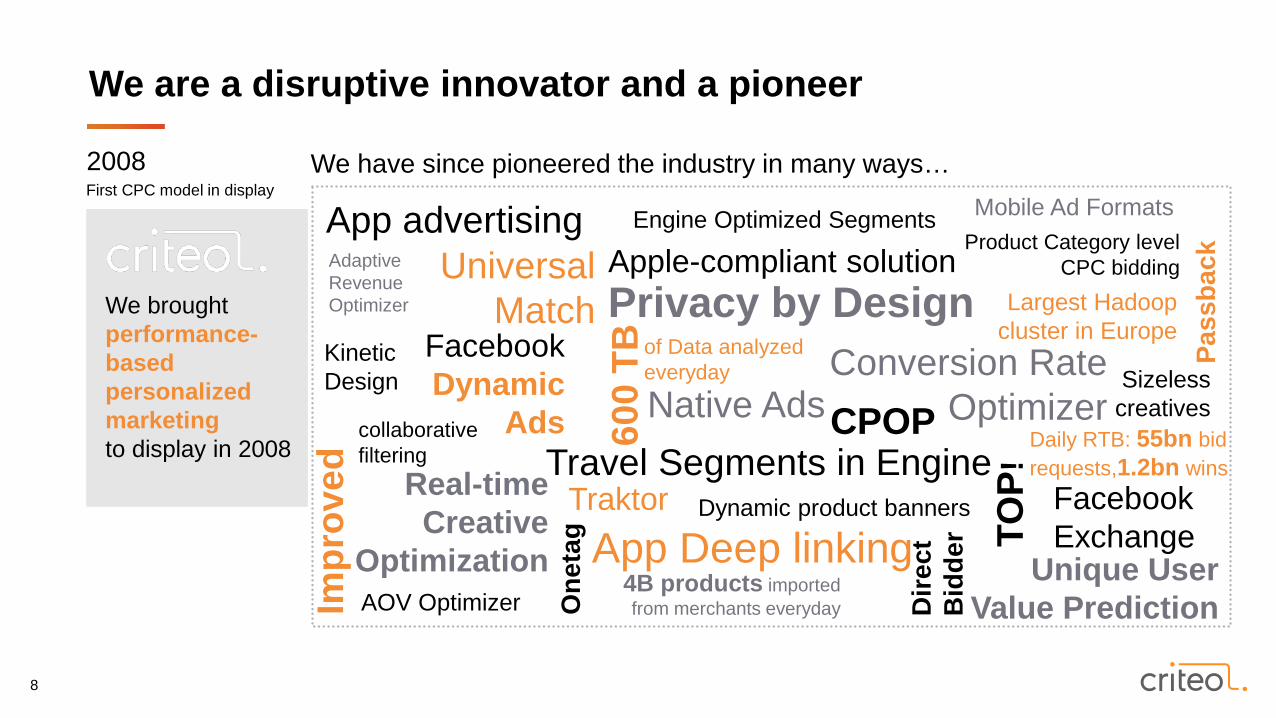
We broughtperformance-based personalized marketing to display in 2008
We have since pioneered the industry in many ways…2008First CPC model in display
We are a disruptive innovator and a pioneer
Real-time Creative
OptimizationAOV Optimizer
Privacy by Design
Facebook Exchange
Universal Match
Apple-compliant solution
Travel Segments in Engine
Conversion Rate Optimizer
4B products imported from merchants everyday
TOP!
Daily RTB: 55bn bid requests,1.2bn wins
Product Category level CPC bidding
600
TB of Data analyzed everyday
Largest Hadoop cluster in Europe
Impr
oved
collaborative filtering
Dynamic product bannersTraktor
Engine Optimized Segments
Pass
back
Sizelesscreatives
One
tag App Deep linking Unique User
Value Prediction
Mobile Ad FormatsApp advertising
Native Ads
AdaptiveRevenue Optimizer
Kinetic Design
Facebook Dynamic
Ads CPOP
Dire
ct
Bid
der
9
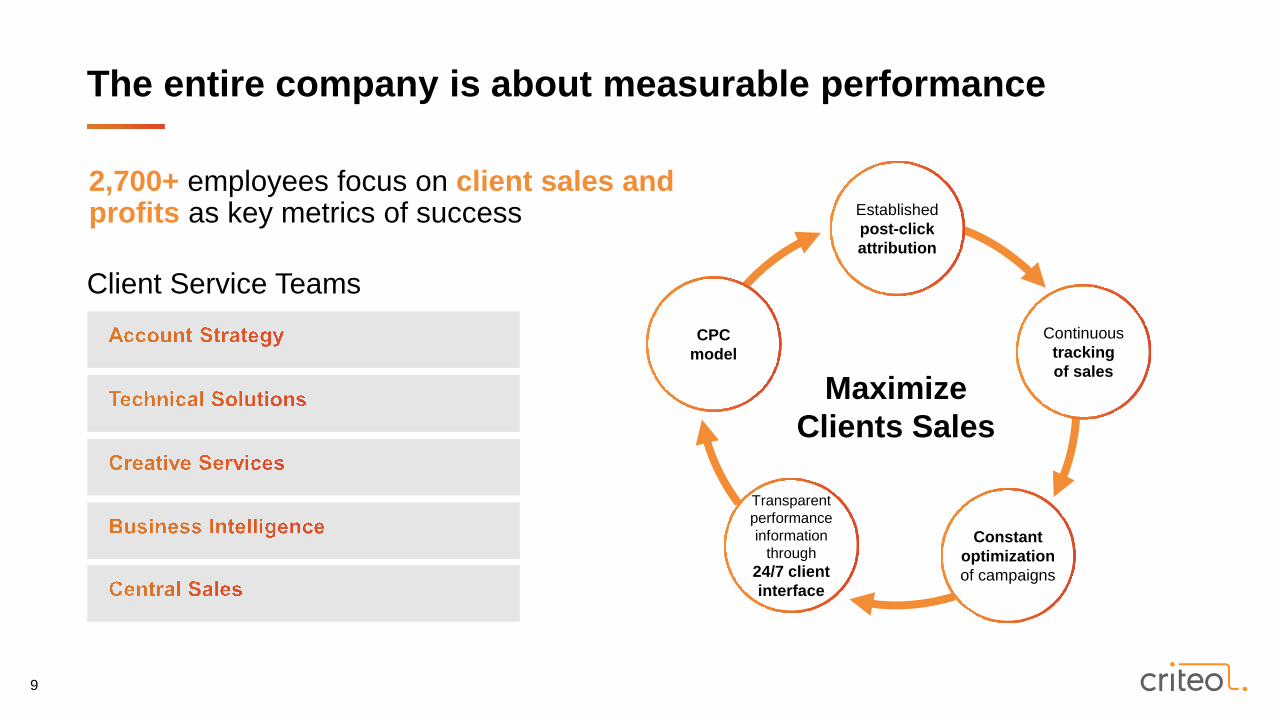
2,700+ employees focus on client sales and profits as key metrics of success
CPC model
Transparent performance information
through24/7 client interface
Constant optimization of campaigns
Continuous tracking of sales
Established post-click attribution
Maximize Clients Sales
The entire company is about measurable performance
Client Service Teams
10
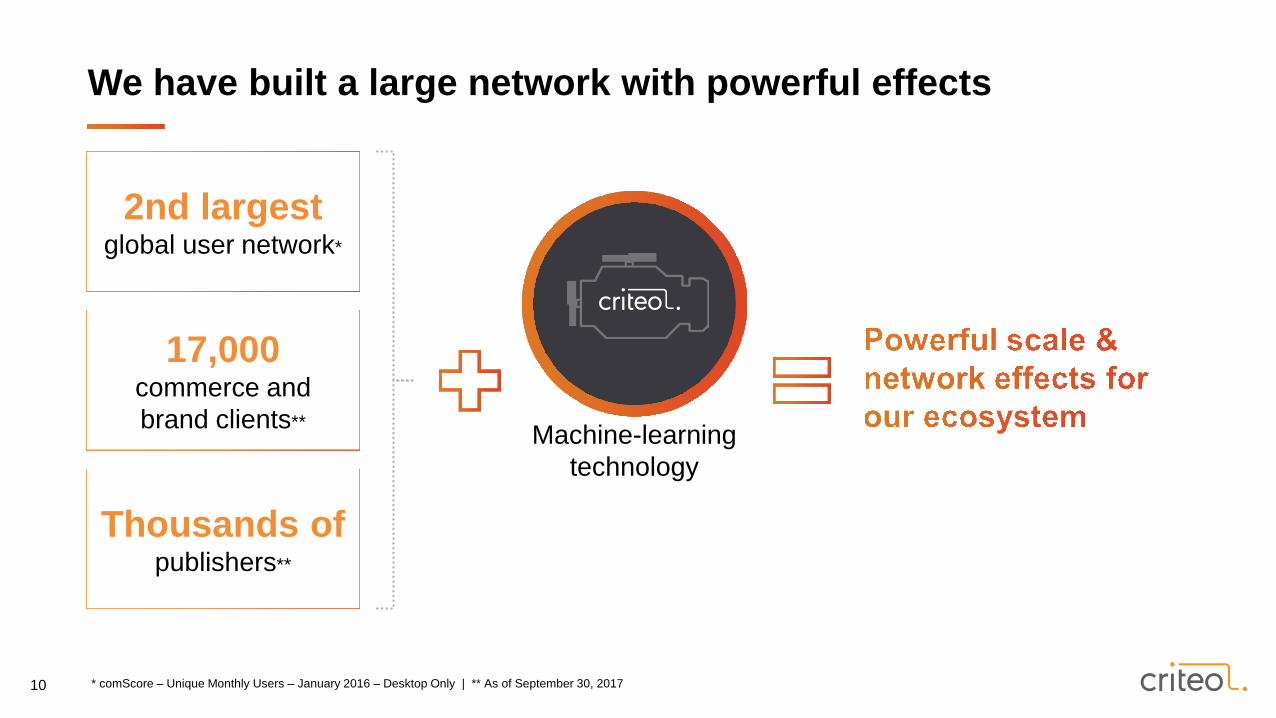
2nd largestglobal user network*
17,000commerce and brand clients**
Thousands ofpublishers**
* comScore – Unique Monthly Users – January 2016 – Desktop Only | ** As of September 30, 2017
Machine-learning technology
We have built a large network with powerful effects
11
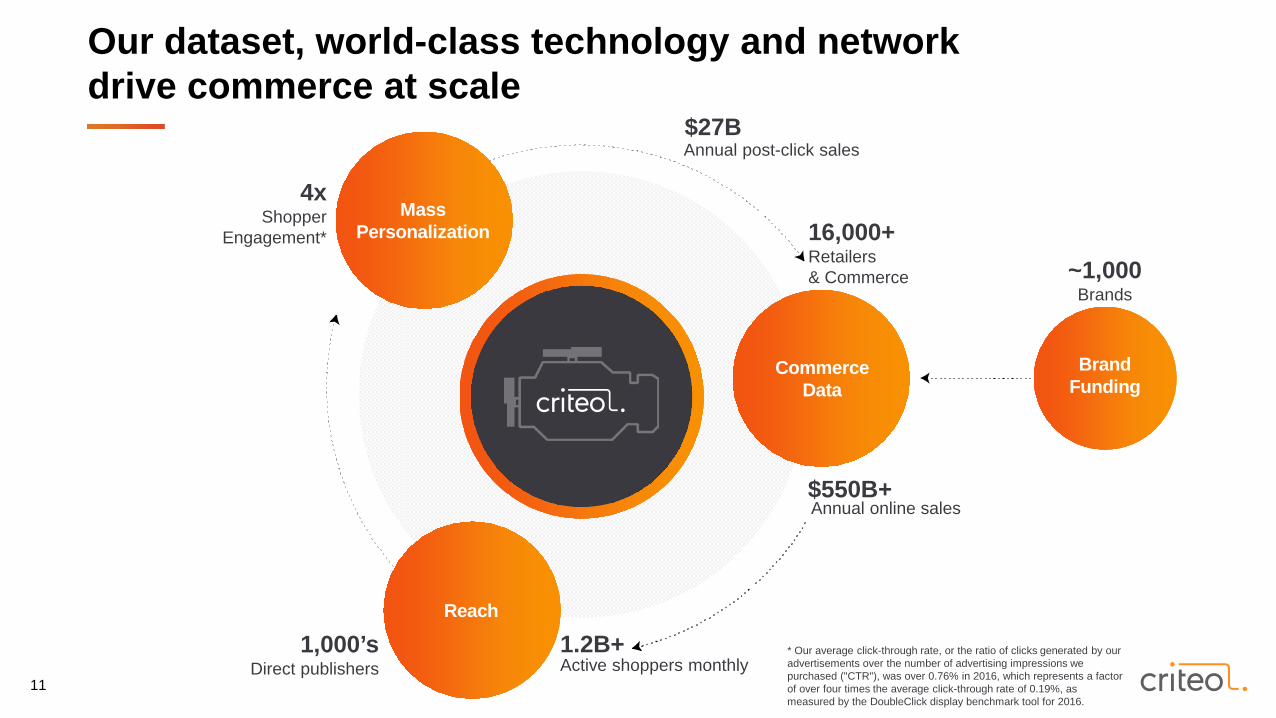
Our dataset, world-class technology and network drive commerce at scale
CommerceData
Reach
16,000+ Retailers & Commerce ~1,000
Brands
1,000’sDirect publishers
4xShopper
Engagement*
$550B+Annual online sales
1.2B+Active shoppers monthly
Brand Funding
$27BAnnual post-click sales
MassPersonalization
* Our average click-through rate, or the ratio of clicks generated by ouradvertisements over the number of advertising impressions we purchased ("CTR"), was over 0.76% in 2016, which represents a factor of over four times the average click-through rate of 0.19%, as measured by the DoubleClick display benchmark tool for 2016.
12
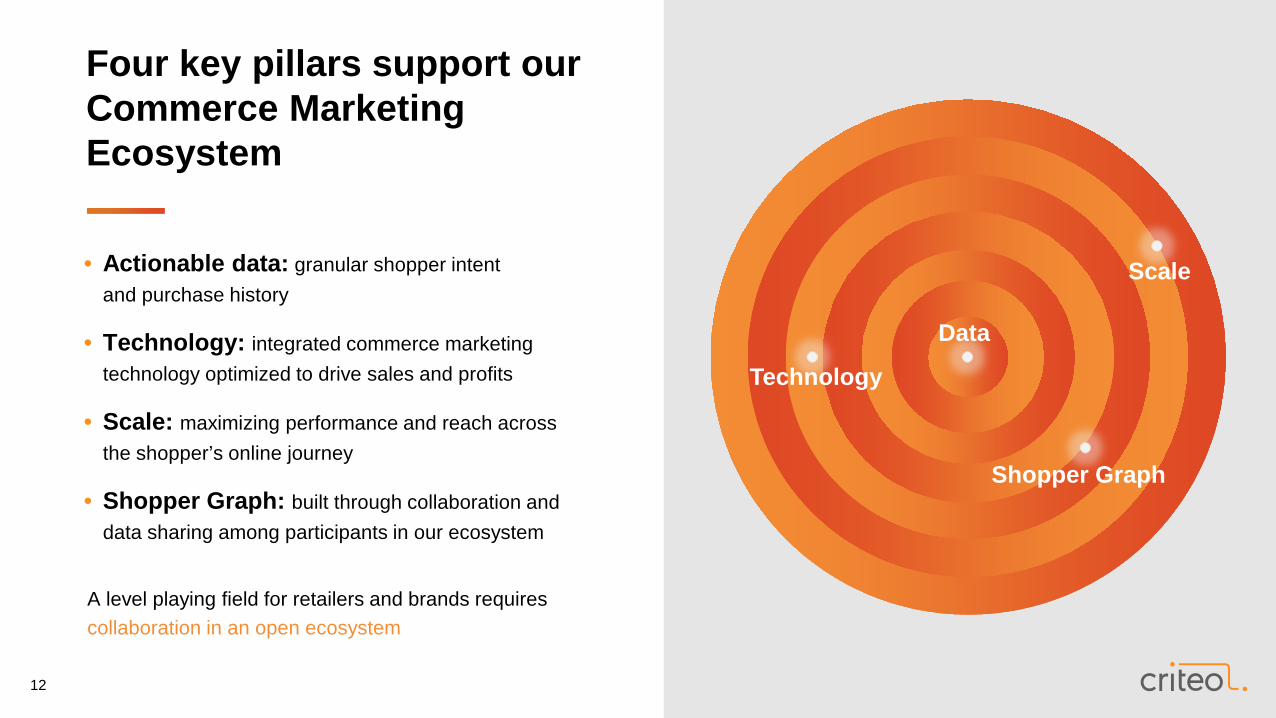
• Actionable data: granular shopper intent and purchase history
• Technology: integrated commerce marketing technology optimized to drive sales and profits
• Scale: maximizing performance and reach across the shopper’s online journey
• Shopper Graph: built through collaboration and data sharing among participants in our ecosystem
A level playing field for retailers and brands requires collaboration in an open ecosystem
Four key pillars support our Commerce Marketing Ecosystem
Data
Technology
Scale
Shopper Graph
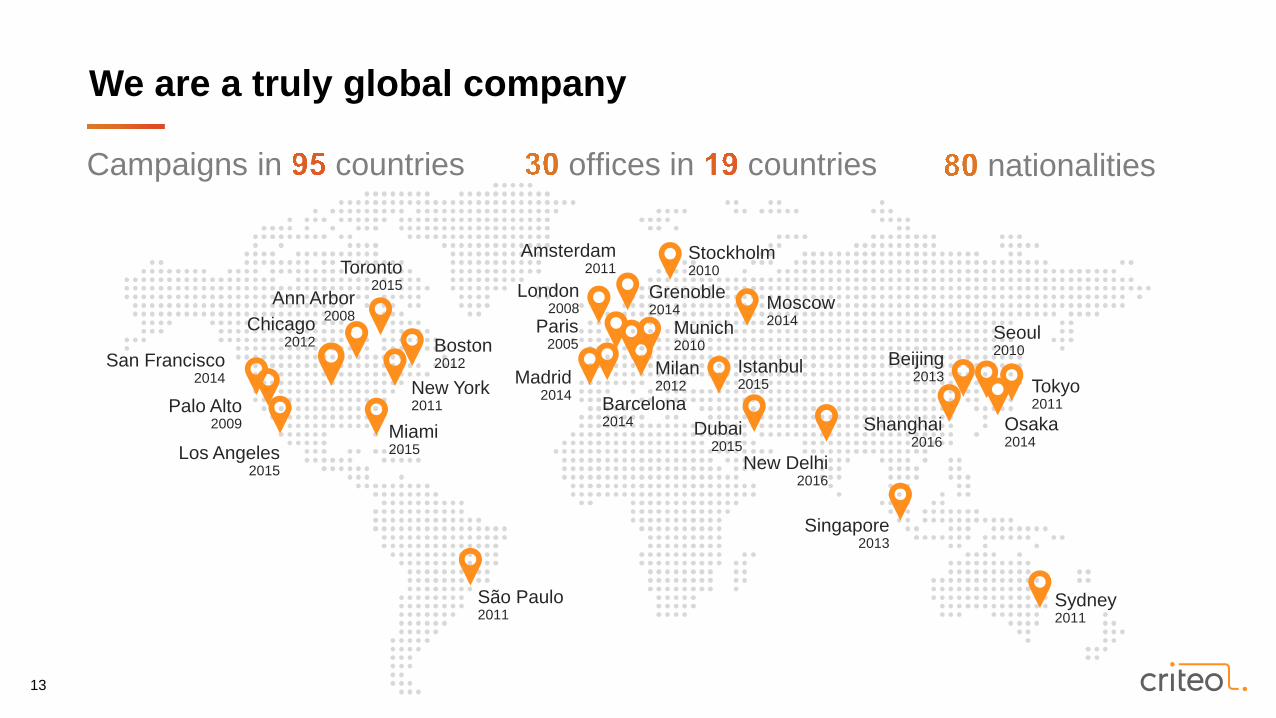
13
Boston2012
Barcelona2014
Tokyo 2011
Singapore 2013
São Paulo 2011
Shanghai 2016
Palo Alto2009
New York 2011
Chicago2012
London2008
Madrid 2014
Paris2005
Stockholm 2010
Milan 2012
Munich 2010
Amsterdam2011
Beijing 2013
Seoul 2010
Sydney 2011
Dubai2015
Moscow 2014
San Francisco2014
Osaka 2014Los Angeles
2015
Miami2015
Istanbul2015
Toronto2015
New Delhi2016
nationalities
Grenoble2014
offices in countriesCampaigns in countries
We are a truly global company
Ann Arbor2008

14
Market and Trends
15
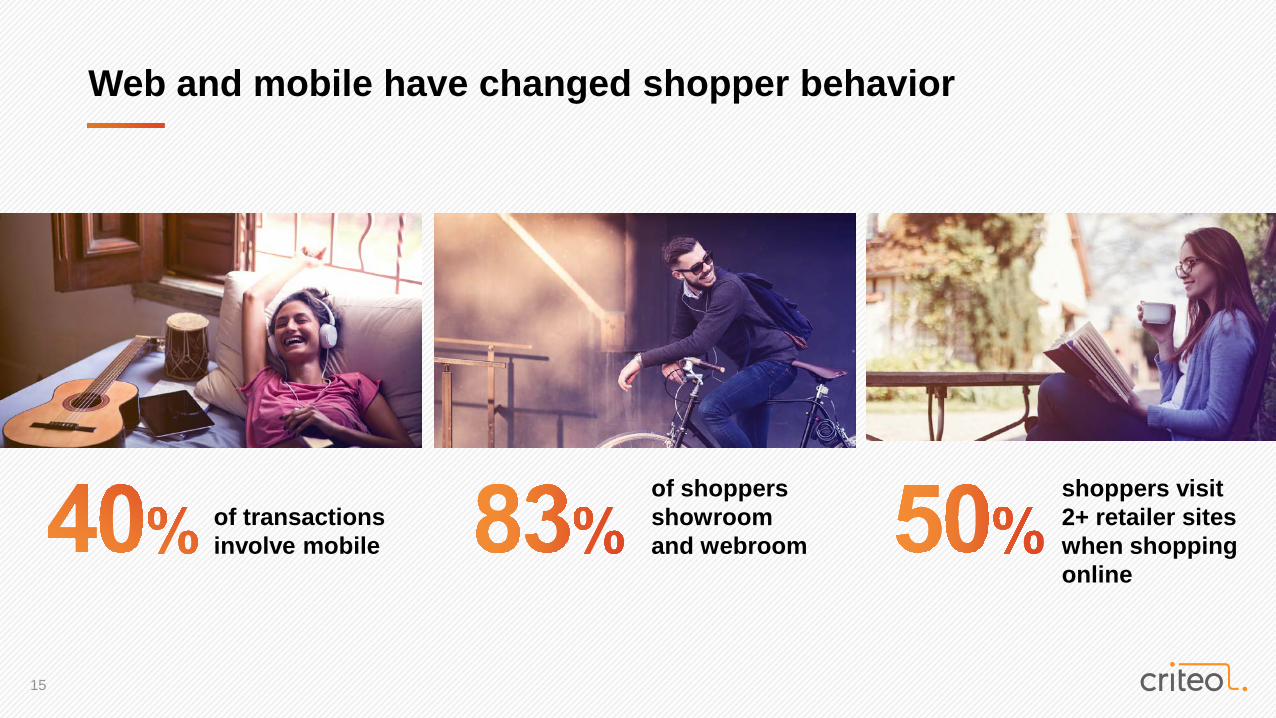
of shoppers showroomand webroom
shoppers visit 2+ retailer sites when shopping online
of transactionsinvolve mobile
Web and mobile have changed shopper behavior

16
Shopper Data• Mass Scale
• Granularity
• Real-Time Accessibility
Activation of Data• Predictive Technology
• Real-time Dynamic Optimization
• Reach at Scale
• Great Real Estate
• Merchandising
Success factors have changed for retailers (and brands)
YESTERDAY TODAY
17
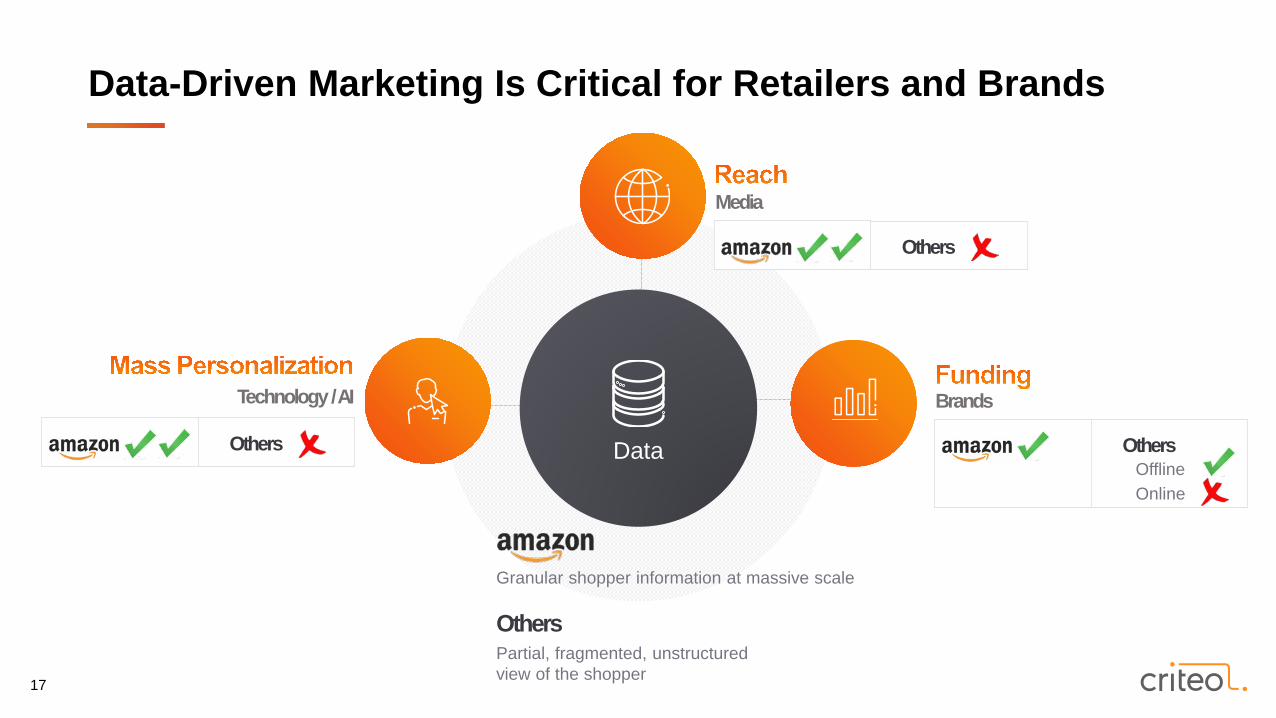
Technology / AI
Media
Brands
Others
Others
Others
Granular shopper information at massive scale
Partial, fragmented, unstructuredview of the shopper
Data OthersOfflineOnline
Data-Driven Marketing Is Critical for Retailers and Brands

18
We are theleader in Commerce Marketing.

is quickly emerging as the next big digital marketing category after Search and Social
Centers on inspiring people to buy things
Measured by performance – directly driving sales and profits
Not limited to digital

20
Commerce marketing has always been our core
Criteo’s original technology was a product recommendation engine for retail
This engine formed the basis of Criteo Dynamic Retargeting
Primarily applied to online commerce: retail, travel and classified
Expanding to include data cooperative across retailers to build an omni-retailer solution
Expanding to include offline data for a full omnichannel solution

21
Products and Technology
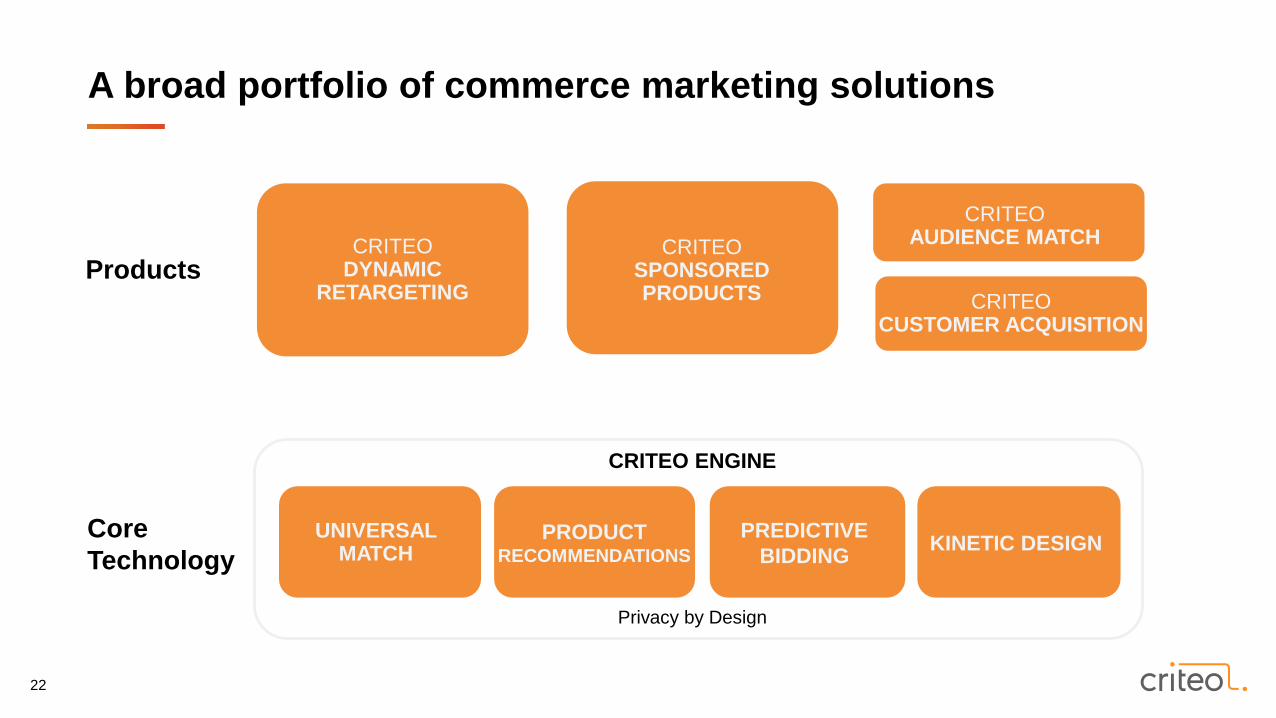
22
CRITEODYNAMIC
RETARGETING
CRITEOAUDIENCE MATCH
CoreTechnology
Privacy by Design
Products
UNIVERSAL MATCH
PRODUCTRECOMMENDATIONS
PREDICTIVE BIDDING KINETIC DESIGN
CRITEO ENGINE
A broad portfolio of commerce marketing solutions
CRITEOSPONSOREDPRODUCTS CRITEO
CUSTOMER ACQUISITION
23
publisher.com
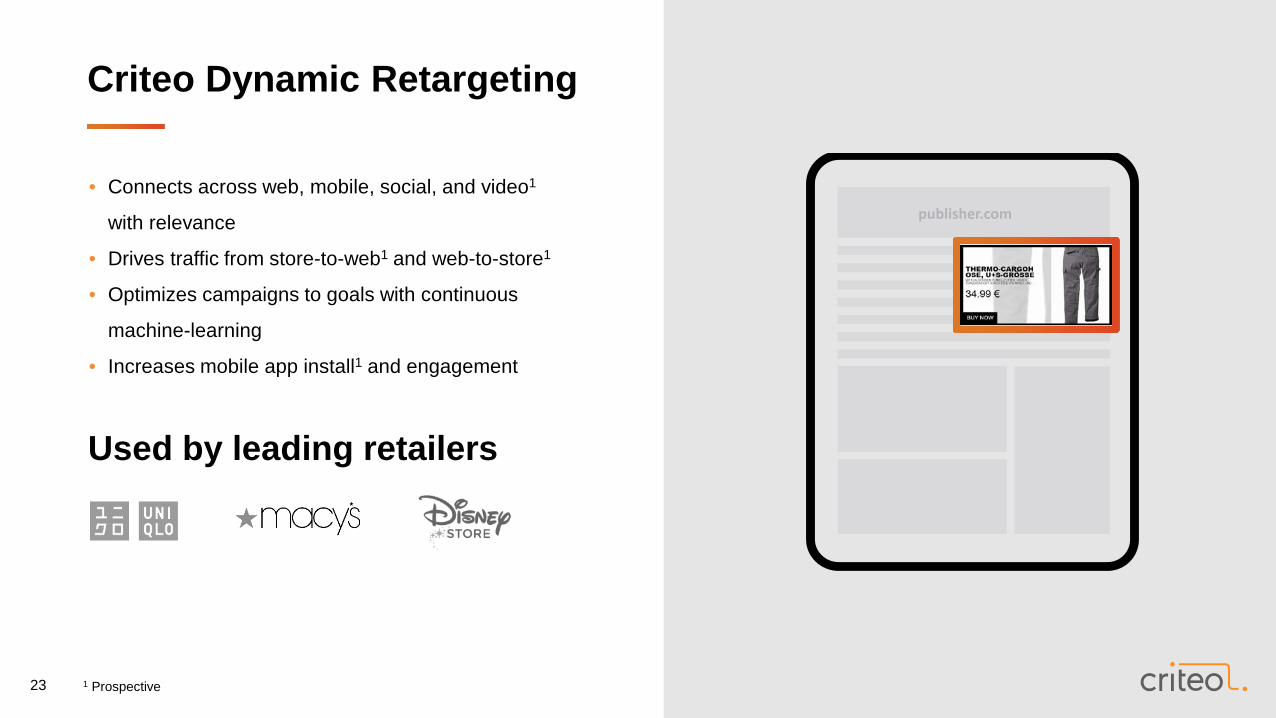
Criteo Dynamic Retargeting
1 Prospective
Used by leading retailers
• Connects across web, mobile, social, and video1
with relevance
• Drives traffic from store-to-web1 and web-to-store1
• Optimizes campaigns to goals with continuous
machine-learning
• Increases mobile app install1 and engagement

24
Criteo Sponsored Products
1 Prospective
• Monetizes brand partners via native ads across
web and app
• Retains shoppers in retailer store to buy
Participating brands
25
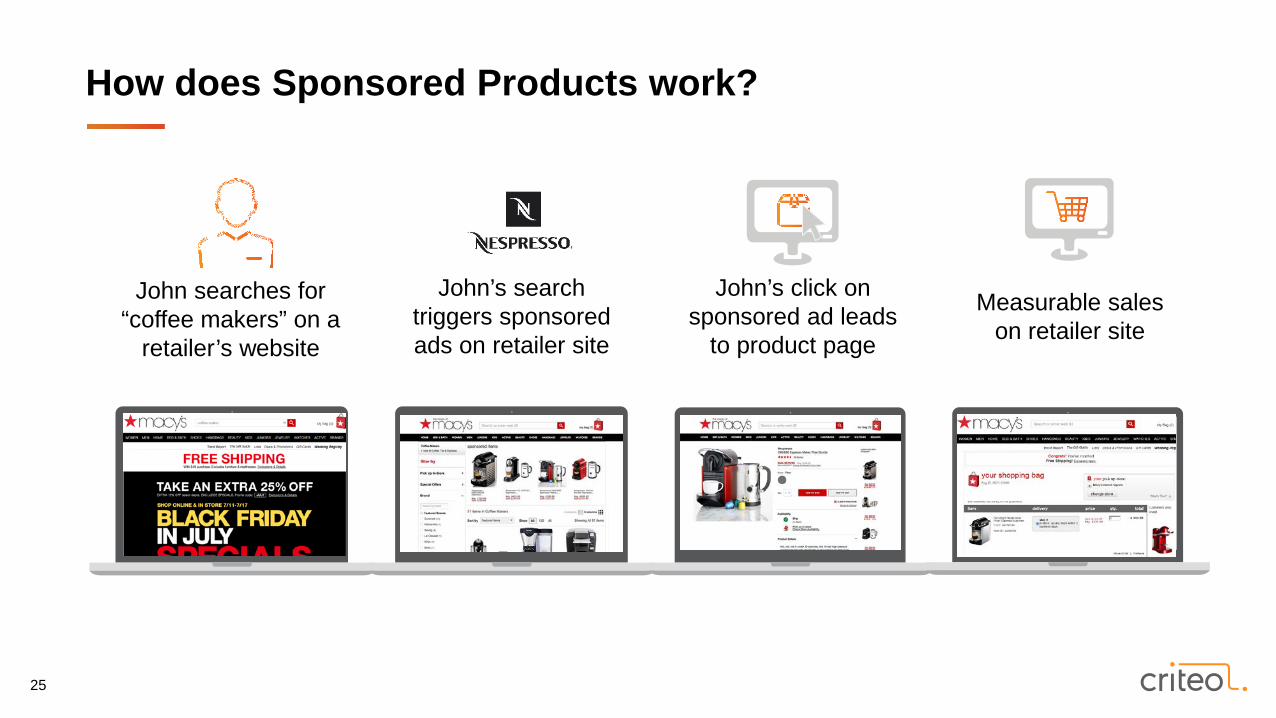
John searches for “coffee makers” on a
retailer’s website
John’s search triggers sponsored ads on retailer site
John’s click on sponsored ad leads
to product page
Measurable sales on retailer site
How does Sponsored Products work?

26
Criteo Audience MatchBETA
What it does• Identify your audience and campaign objective• Pass the audience list you want to target• Match your audience in Criteo’s identity graph• Deliver personalized ads to drive engaged traffic to your store
Benefits• Drive new sales by re-engaging shoppers• Bring qualified traffic to your site
27
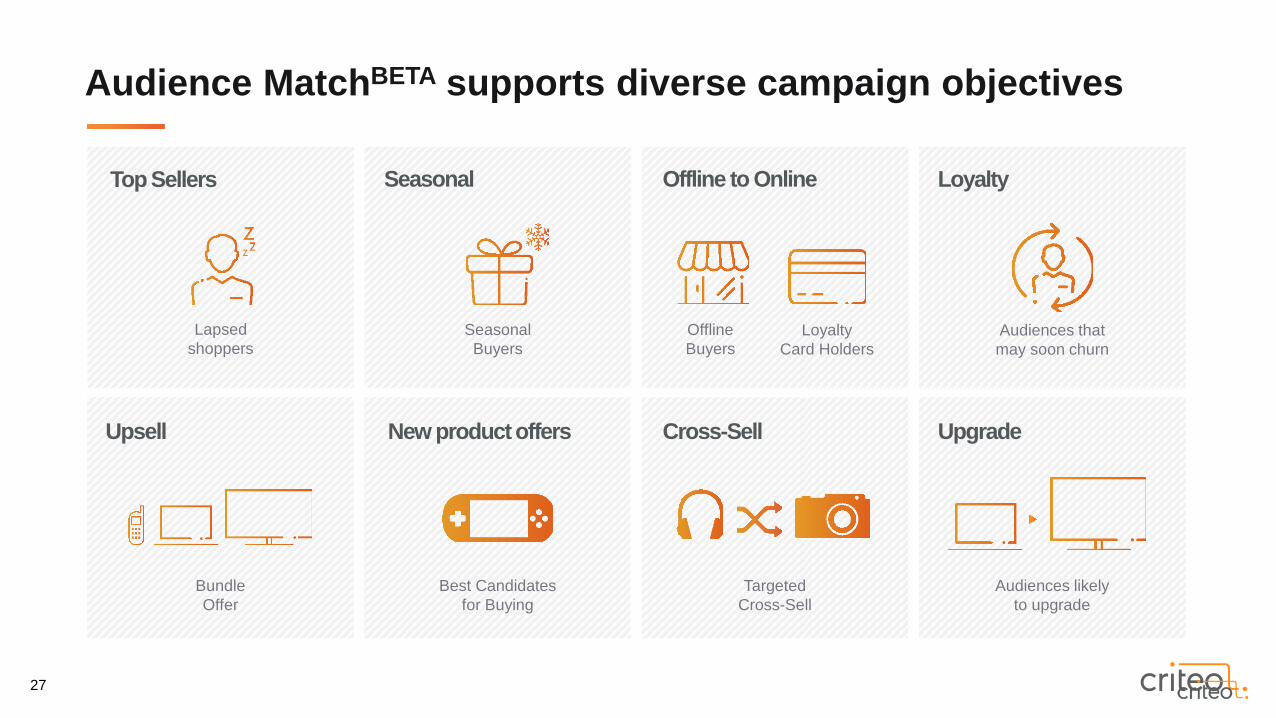
Audience MatchBETA supports diverse campaign objectives
Top Sellers Offline to Online Loyalty
Upsell New product offers Cross-Sell Upgrade
Seasonal
Lapsed shoppers
OfflineBuyers
LoyaltyCard Holders
Audiences that may soon churn
BundleOffer
Best Candidates for Buying
TargetedCross-Sell
Audiences likelyto upgrade
SeasonalBuyers
28
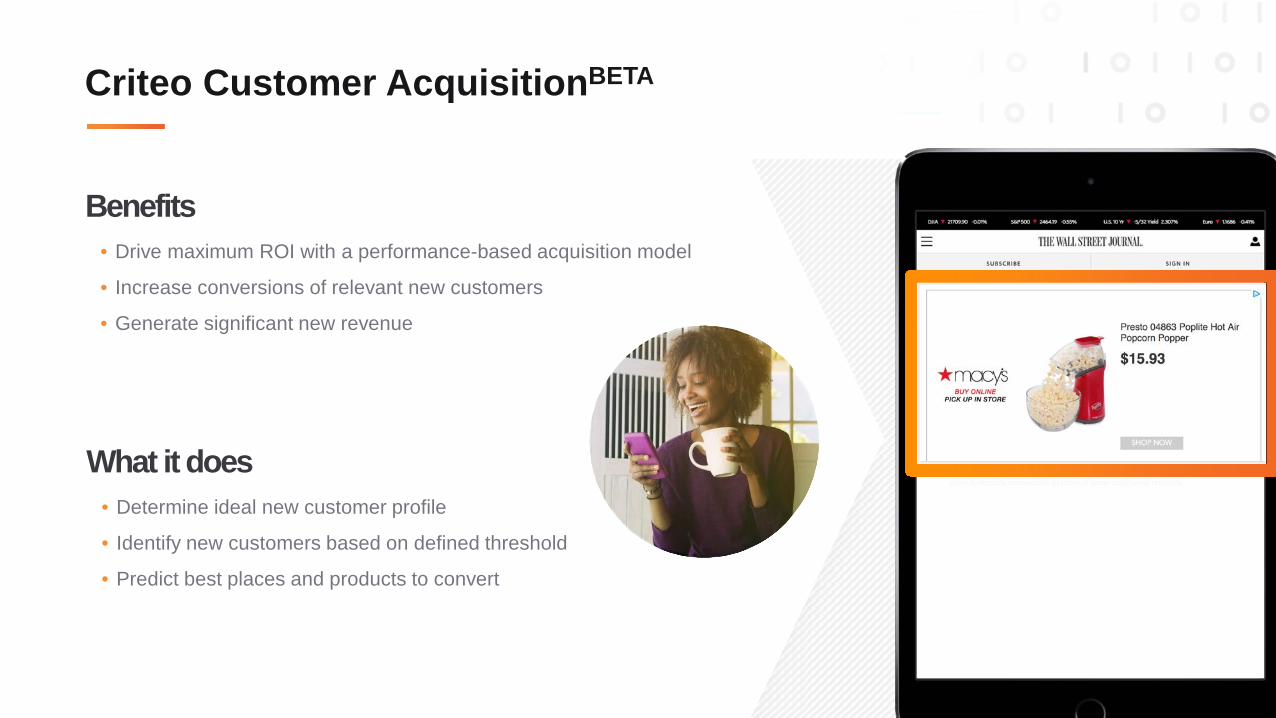
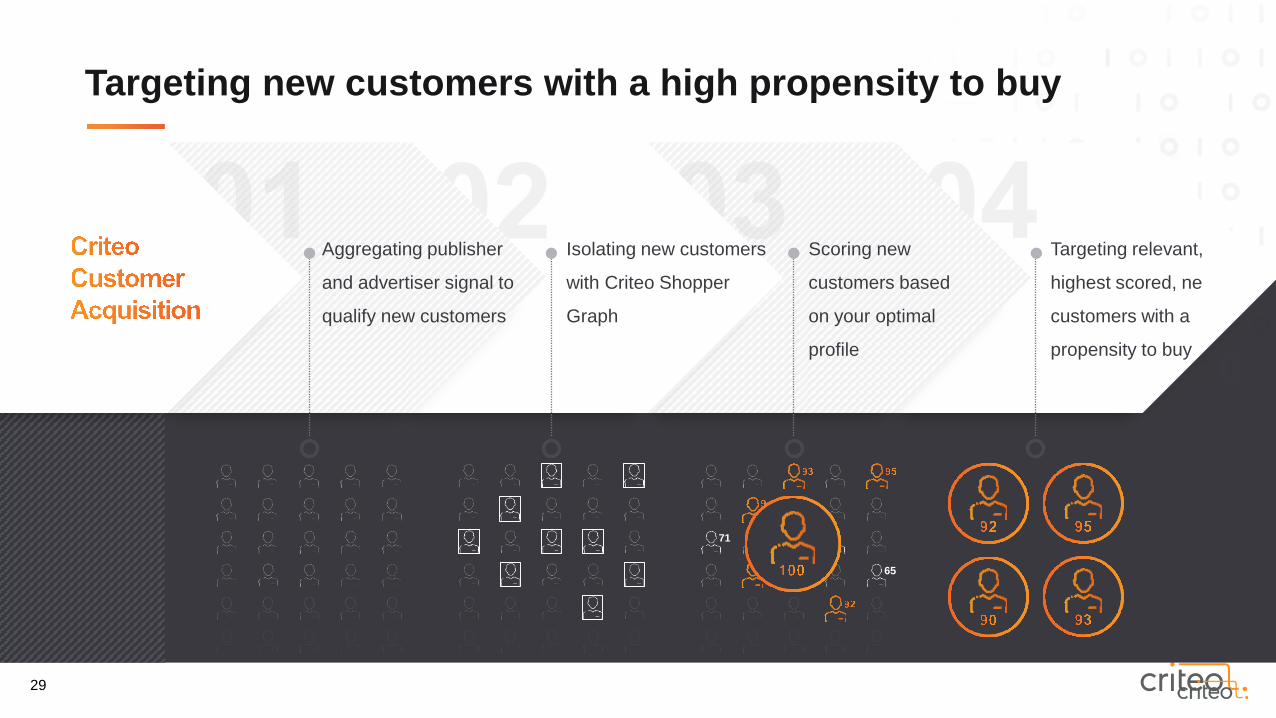
Criteo Customer AcquisitionBETA
What it does• Determine ideal new customer profile
• Identify new customers based on defined threshold
• Predict best places and products to convert
Benefits• Drive maximum ROI with a performance-based acquisition model
• Increase conversions of relevant new customers
• Generate significant new revenue
29
Targeting new customers with a high propensity to buy
Targeting relevant,
highest scored, ne
customers with a
propensity to buy
Scoring new
customers based
on your optimal
profile
Isolating new customers
with Criteo Shopper
Graph
Aggregating publisher
and advertiser signal to
qualify new customers
71
65

30
Creates Product
Recommendation
Personalized creative
Unique user value
predictionClient 2Client 3Client 4Client 5
For each user
Internal advertiser
auctionPublisher/
platform bidCustom ad
serving
Less than 100ms to perform the entire process 37,000 ads served/sec600,000+ RTB bids/sec
Client 1Creates Product
Recommendation
Personalized creative
Unique user value
predictionCreates Product
Recommendation Personalized
creative
Unique user value
predictionCreates Product
Recommendation Personalized
creative
Unique user value
prediction
Our Engine solves highly complex problems in real time
31
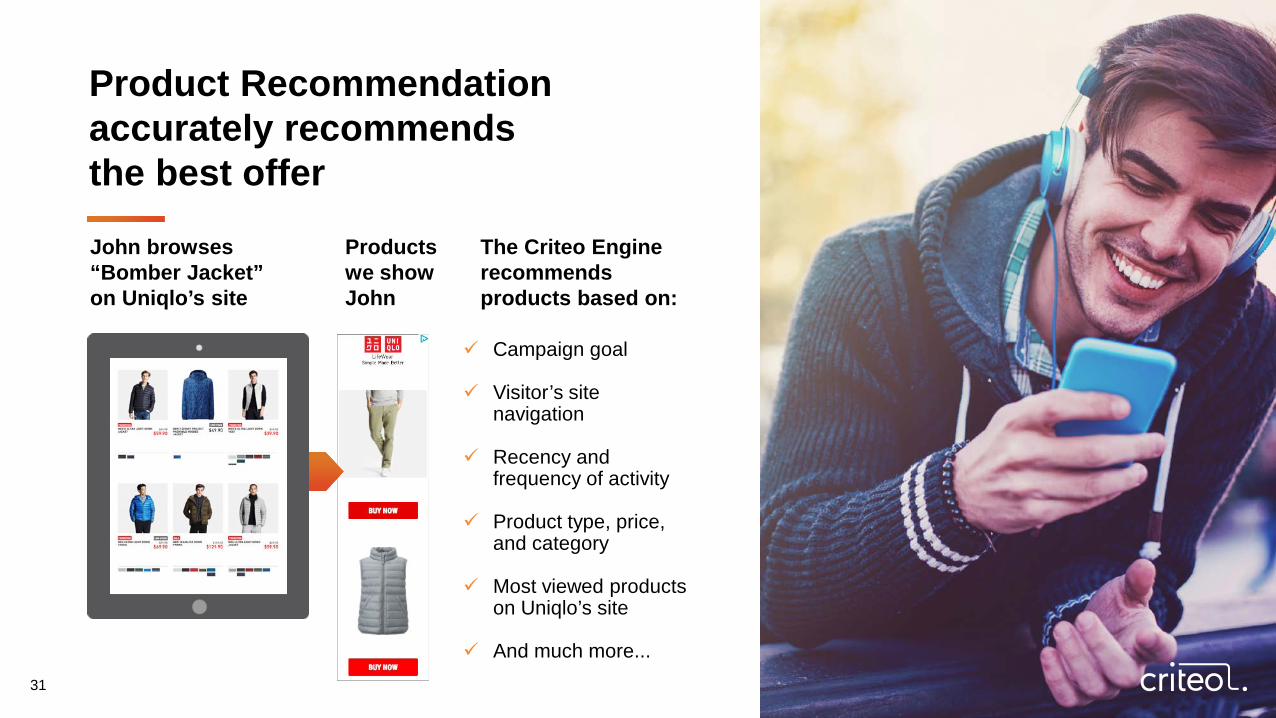
Campaign goal
Visitor’s site navigation
Recency and frequency of activity
Product type, price, and category
Most viewed products on Uniqlo’s site
And much more...
The Criteo Enginerecommends products based on:
Productswe showJohn
John browses“Bomber Jacket”on Uniqlo’s site
Product Recommendationaccurately recommendsthe best offer
32
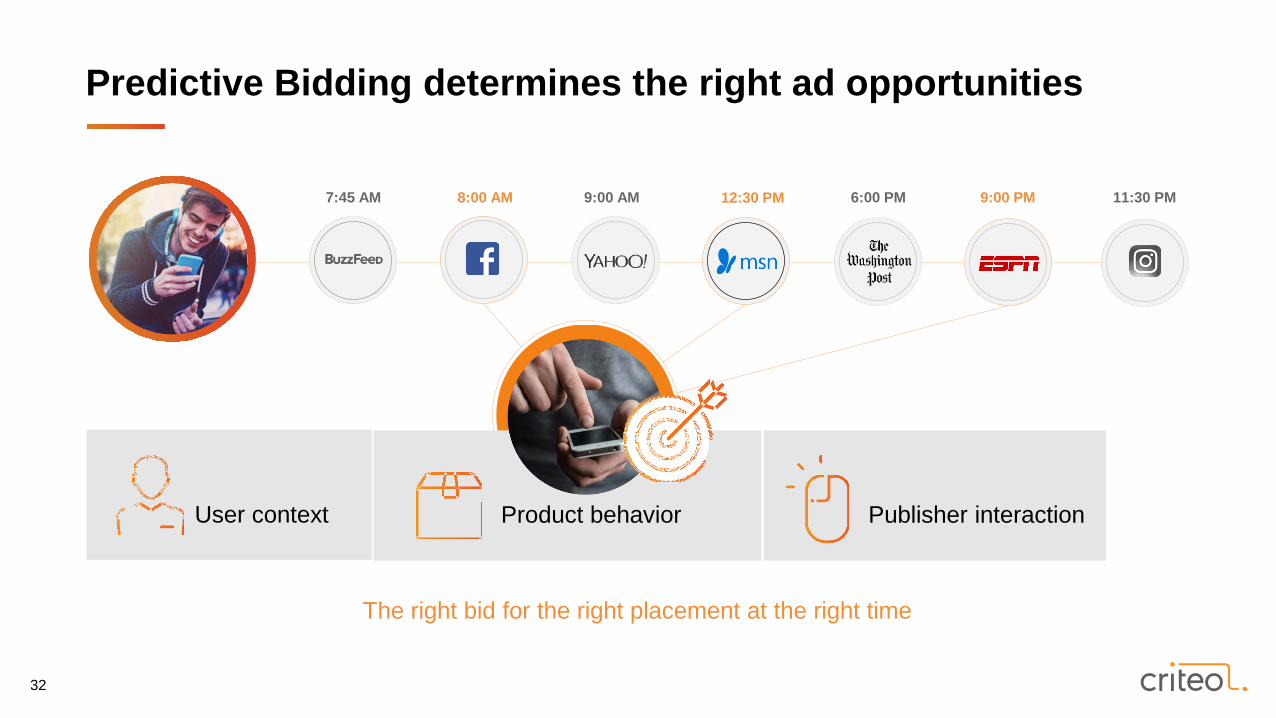
7:45 AM 8:00 AM 9:00 AM 12:30 PM 6:00 PM 9:00 PM 11:30 PM
The right bid for the right placement at the right time
User context Publisher interactionProduct behavior
Predictive Bidding determines the right ad opportunities
33
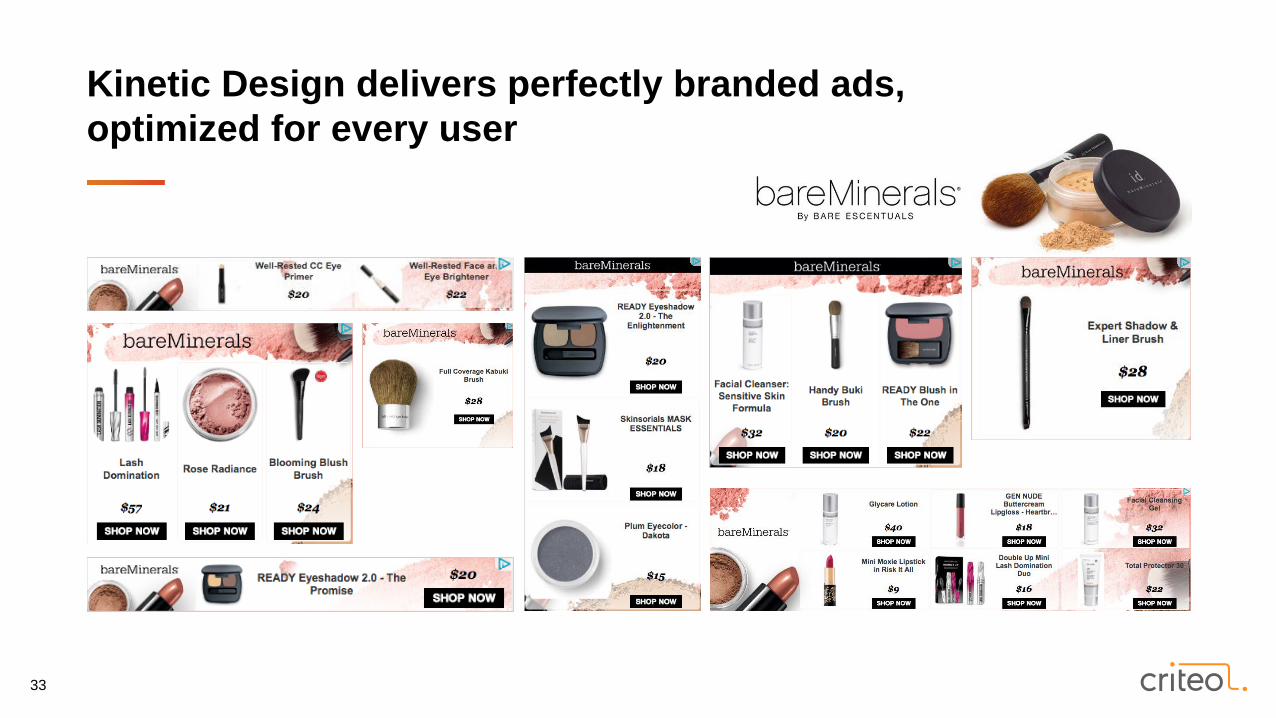
Kinetic Design delivers perfectly branded ads, optimized for every user

34
We are creating the Criteo Shopper Graph
Three trusted data collectives
Carefully designed using our guiding principles
OpenTwo-way exchange of data
TransparentClear and permission-based usage
SecureHighest data security and privacy
FairValue gained exceeds contribution
One of the World’s Largest Data Sets on Shoppers

35
Identity Graph: Matching of cross-device, same device, and online/offline
Already available
Criteo’s advantages• 75%+ of commerce clients participate: 10,000+ partners
• 2B+ IDs and growing
• Global coverage
• Already one of the best identity graphs
• Similar match rates as Google and Facebook
• Bridge between online and offline
36
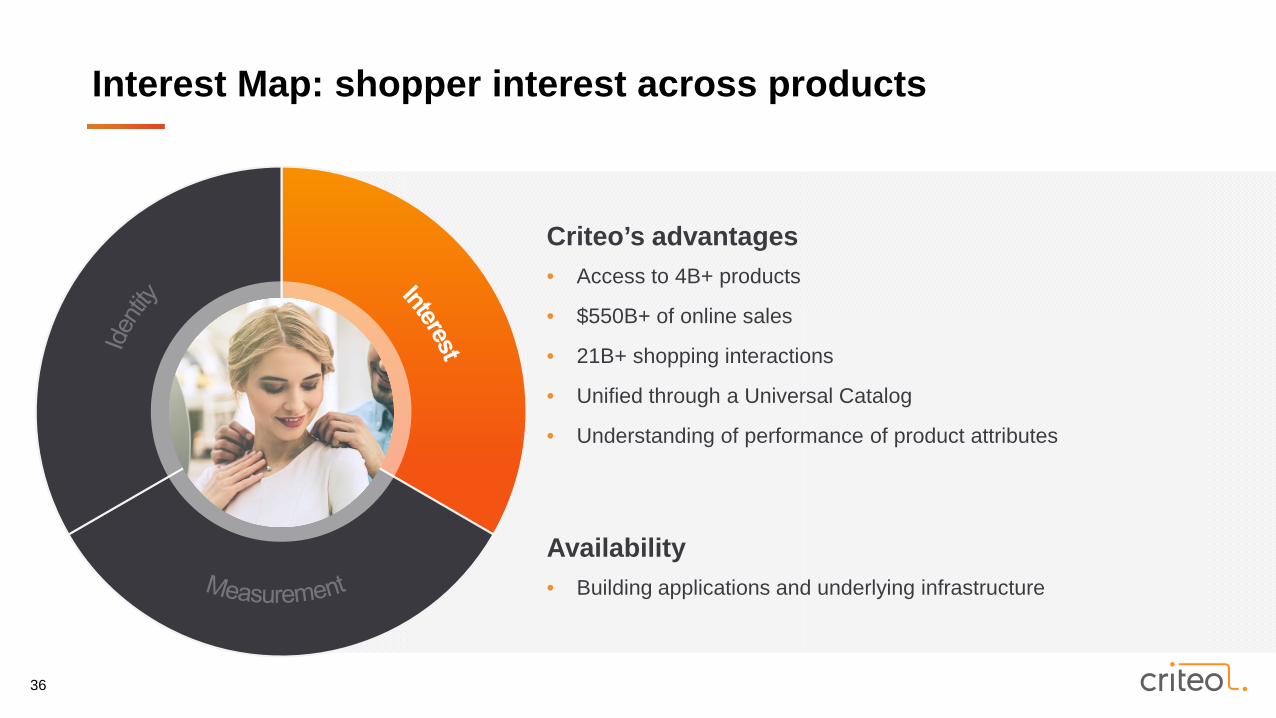
Interest Map: shopper interest across products
Criteo’s advantages• Access to 4B+ products
• $550B+ of online sales
• 21B+ shopping interactions
• Unified through a Universal Catalog
• Understanding of performance of product attributes
Availability• Building applications and underlying infrastructure

37
Measurement Network: brand conversion and sales across retailers
Criteo’s advantages• SKU-level sales attribution for brands across retailers
• Deterministic measurement, not extrapolated panels
• Nearly 100 retailers participating via Sponsored Products
• Plans to widen to all Criteo retailers with new applications
• Beginning to add offline sales attribution
Already available

38
Business Model
39
All our products are performance based.
We deliver measurable sales and profits for retailer and brand clients.
40
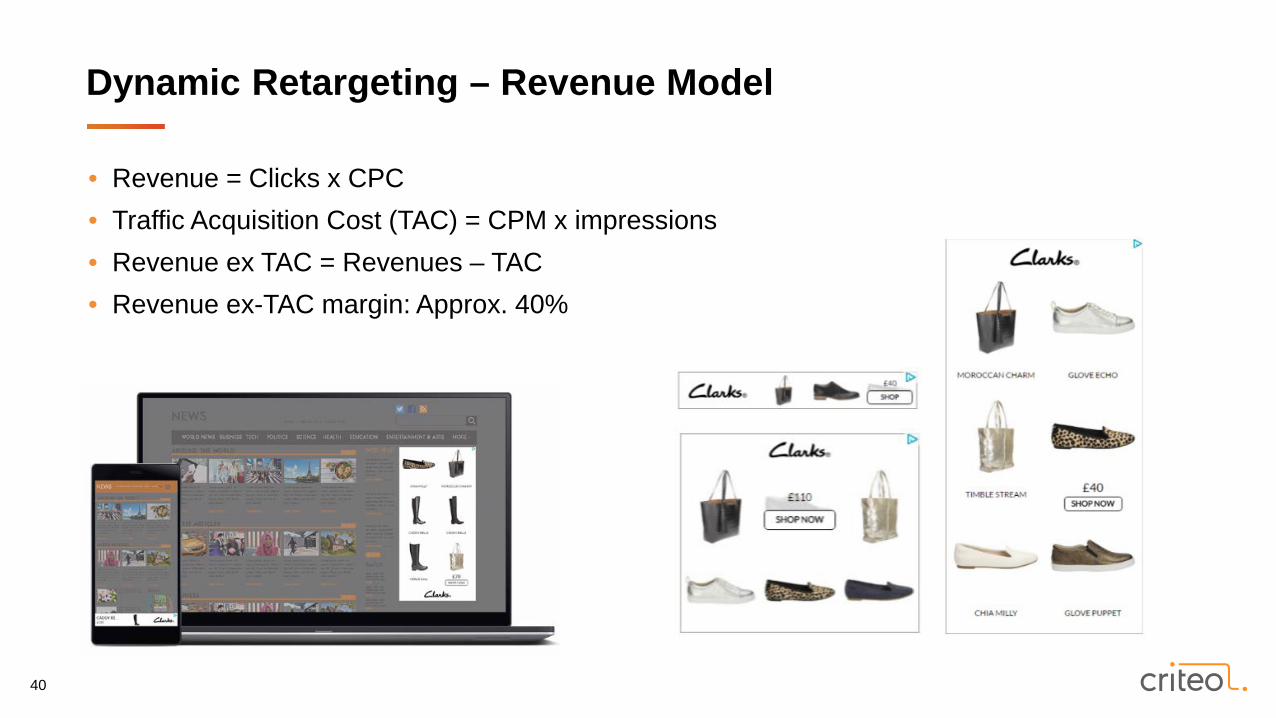
• Revenue = Clicks x CPC• Traffic Acquisition Cost (TAC) = CPM x impressions• Revenue ex TAC = Revenues – TAC• Revenue ex-TAC margin: Approx. 40%
Dynamic Retargeting – Revenue Model

41 CPM = Cost per Thousand impressions, CTR = Click-through rate, CR = Conversion rate, AOV = Average Order Value
Client 4
We take CPC bids from clients
Clients
$0.30 x 0.95% = $2.85
We convert those bids into pCPM (predicted CPM)
CPC x CTR = pCPM(predicted CPM) Publishers
$0.50 x 0.75% = $3.75
$0.40 x 0.61% = $2.44
$0.80 x 0.45% = $3.60
$2.00
Clearing Price (CPM)
Highest bidder
Predicting the right bid for the highest value client
Bid = α × CPC × pCTR × pCR × pAOV
Client 1
Client 2
Client 3We buy
inventory in real time from
publishers
42
• Revenue = Clicks x CPC • TAC = Revenue share with Retailer • Revenue ex TAC = Revenue – TAC• Revenue ex-TAC margin = 26%-28%
Sponsored Products – Revenue Model

43
Differentiated in Marketing
Attractive Direct
Sticky Elastic Demand
1 On average over the last four quarters through Q3 2017; Criteo Dynamic Retargeting only2 Last twelve months to Q3 2017; Criteo Dynamic Retargeting only3 On average over the last 24 quarters through Q3 2017; Criteo Dynamic Retargeting only4 On average over the last four quarters through Q3 2017. Criteo Dynamic Retargeting only: Represents uncapped budgets of our clients, which are either contractually uncapped or so large that the budget constraint does not restrict ad buys
Our business model hasunique attributes
87%Direct relationships
with clients2
920Net client additions
per quarter1
90%Client retention rate3
78%Of Revenue ex-TAC from
uncapped budgets4

44
Clients
45 * 17,299 clients at the end of Q3 2017
Direct relationships with many premium commerce and brand clients
Commerce | Retail, Travel and Classifieds Brands

46 UV: Unique Visitors
• Field sales & account management
• High value, low volume
• Longer sales cycles
• White glove service
• Local in-market sales teams
• Inside sales & account management
• High volume, lower value
• Shorter sales cycles
• High degree of automation
• Regional hubs and satellite offices
Top-tier comScore sites(typically top-100)
Min. ~40k UV/month
A tiered go-to-market approach

47 Internal Criteo estimates
<25%Midmarket penetration
~60,000 addressable clients worldwide in Retail, Travel and Classifieds (excluding CSP)
50%Tier 1
penetration
A large opportunity to win new clients

48
PublisherInventory

49
PREFERRED ACCESS TO PREMIUM MEDIA INVENTORY
PREFERRED ACCESS TO RETAILER INVENTORY
ALL MAJOR PUBLIC EXCHANGES, GLOBAL AND LOCAL
Direct partnerships with large high-quality publishers worldwide
50
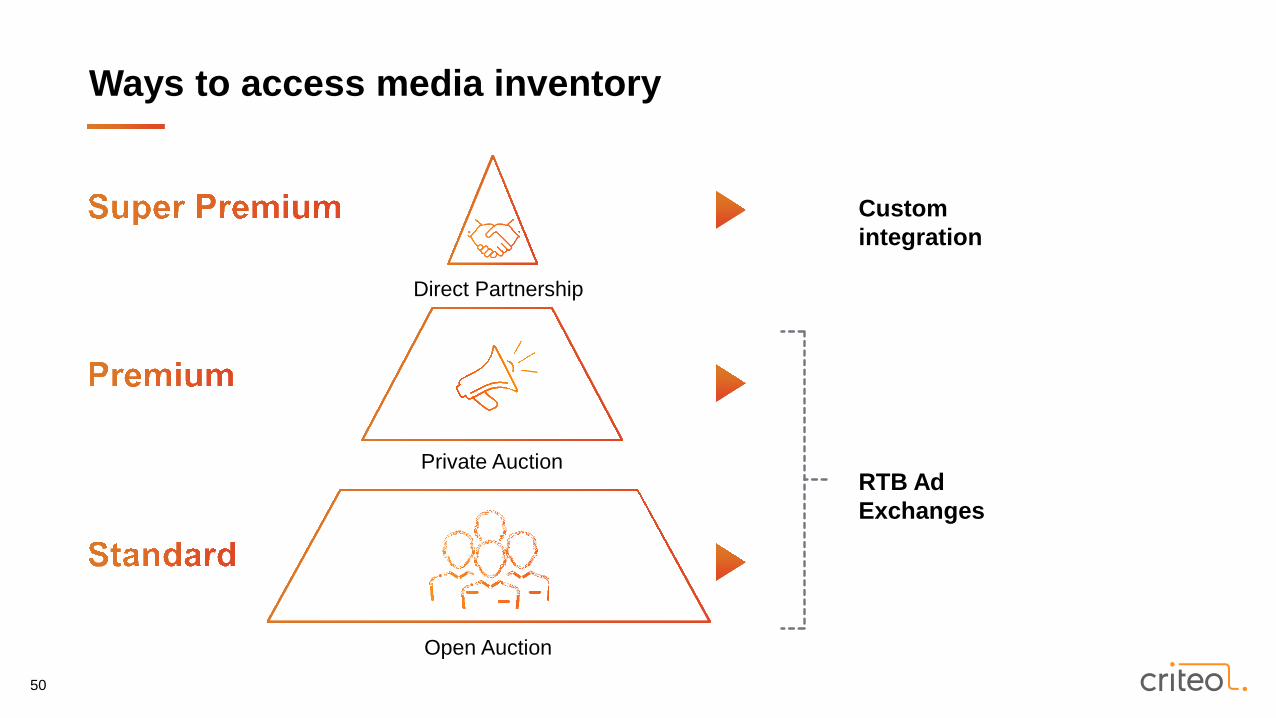
Direct Partnership
Private Auction
Open Auction
RTB Ad Exchanges
Custom integration
Ways to access media inventory

51
Our two-tiered publisher organization

52
Transition to Mobile Social Native
Multiple Devices Header BiddingAd Blocking
Changing consumer behavior Evolving technology
Programmatic
Our sophisticated technology drives more value for publishers
In App
The publisher environment is constantly evolving

53
Ad blocking is an opportunity for players with:• The right business model
• The right technology stack
• The right expertise in user privacy
• Premium demand
Our Position • Promote acceptable ad programs
• Invest in native
• Support an open tracking standard
• Define standards for retargeting
We have always delivered user-friendly ads
54
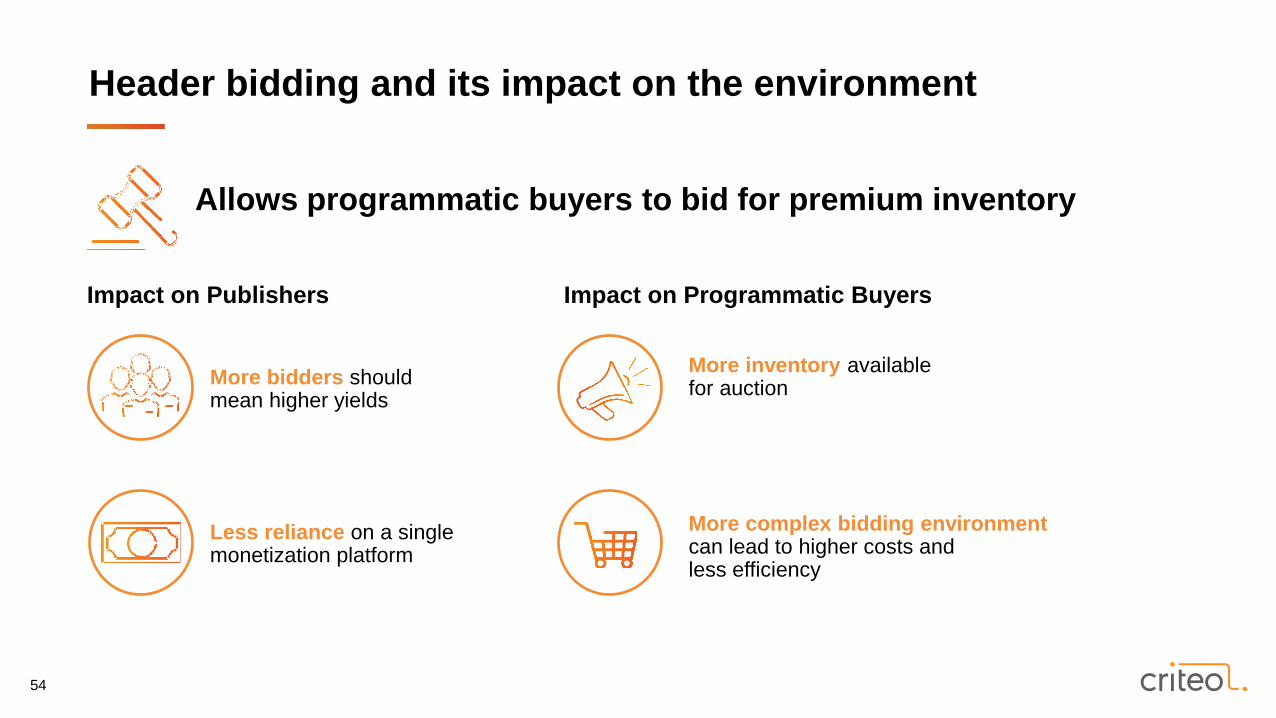
More bidders should mean higher yields
Less reliance on a single monetization platform
Allows programmatic buyers to bid for premium inventory
Impact on Publishers Impact on Programmatic Buyers
More inventory available for auction
More complex bidding environment can lead to higher costs andless efficiency
Header bidding and its impact on the environment
55
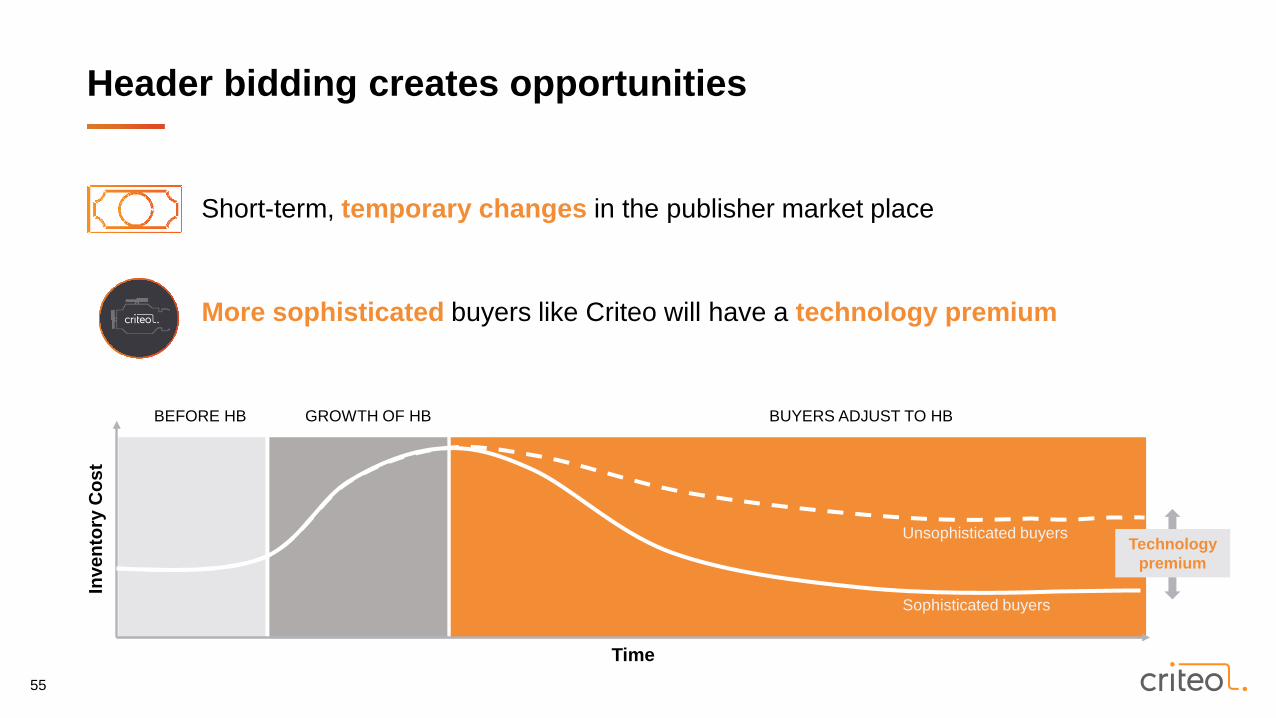
Short-term, temporary changes in the publisher market place
More sophisticated buyers like Criteo will have a technology premium
Time
BEFORE HB GROWTH OF HB
Inve
ntor
y C
ost
BUYERS ADJUST TO HB
Unsophisticated buyers
Sophisticated buyers
Technology premium
Header bidding creates opportunities
56
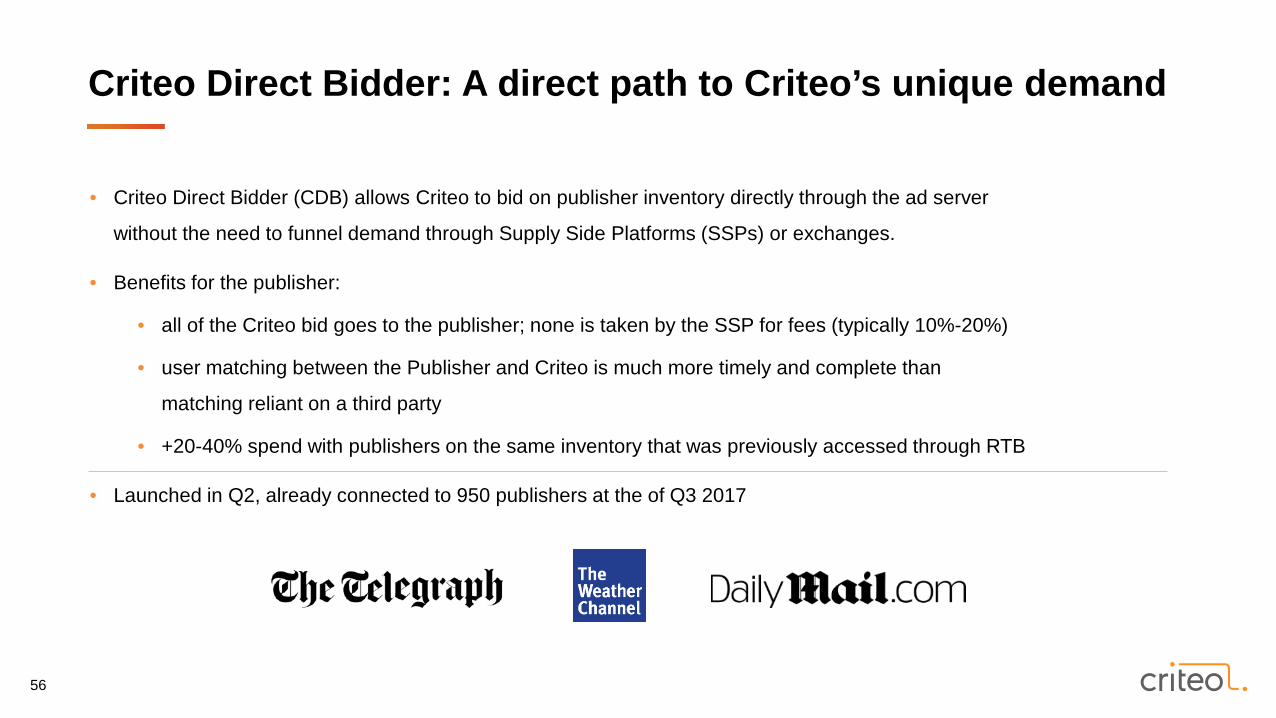
• Criteo Direct Bidder (CDB) allows Criteo to bid on publisher inventory directly through the ad server
without the need to funnel demand through Supply Side Platforms (SSPs) or exchanges.
• Benefits for the publisher:
• all of the Criteo bid goes to the publisher; none is taken by the SSP for fees (typically 10%-20%)
• user matching between the Publisher and Criteo is much more timely and complete than
matching reliant on a third party
• +20-40% spend with publishers on the same inventory that was previously accessed through RTB
• Launched in Q2, already connected to 950 publishers at the of Q3 2017
Criteo Direct Bidder: A direct path to Criteo’s unique demand

57
Competitive Position
58
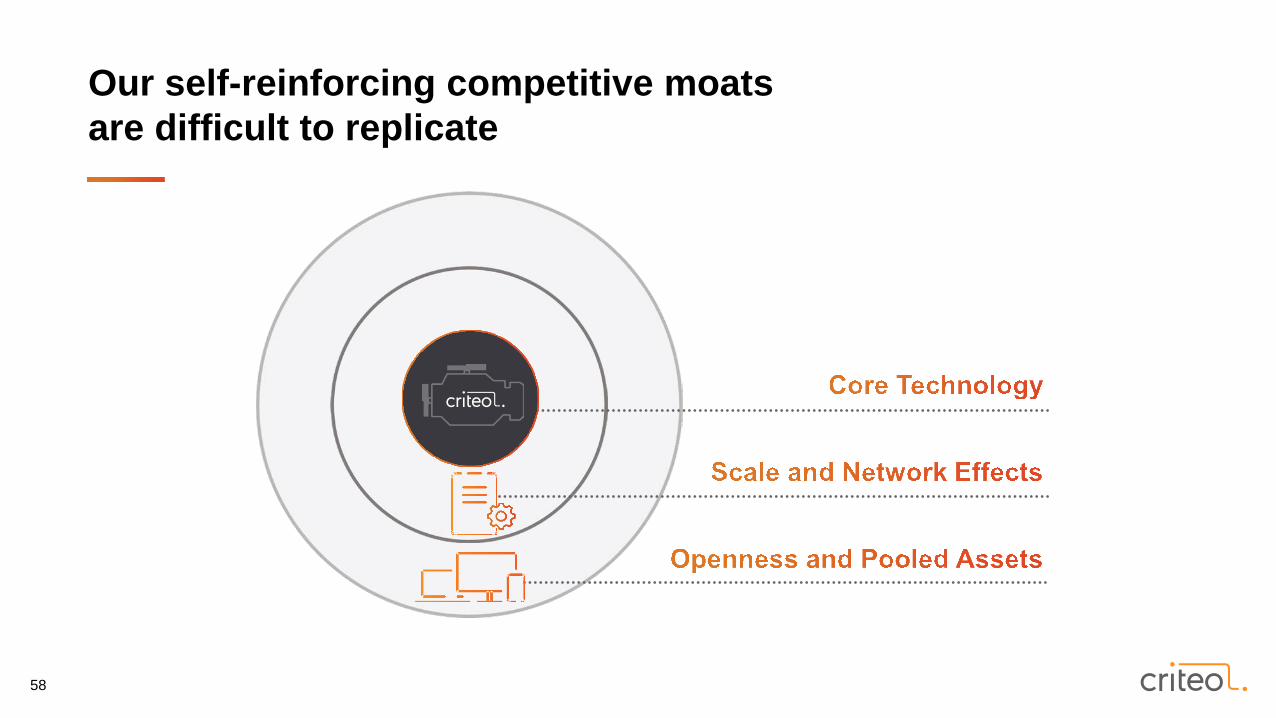
Our self-reinforcing competitive moats are difficult to replicate
59
Criteo Shopper Graph for the benefit of all participants
Our powerful Shopper Graph includes:
• The Criteo Identity Graph, which connects user identities across devices and environments;
• The Criteo Interest Map, which provides shopper intent and purchasing data across retailers in our ecosystem;
• And, the Criteo Measurement Network, which measures sales attribution for brands across our many retail partners.
Openness, transparency, security and fairness are the cornerstones of our commerce marketing ecosystem, where every participant gets more than what they contribute.

60
CLOSED
OPEN
WORKFLOW AUTOMATION PREDICTIVE PERFORMANCE
Criteo’s Position in Commerce Marketing
Note: based solely on Criteo’s qualitative assessment
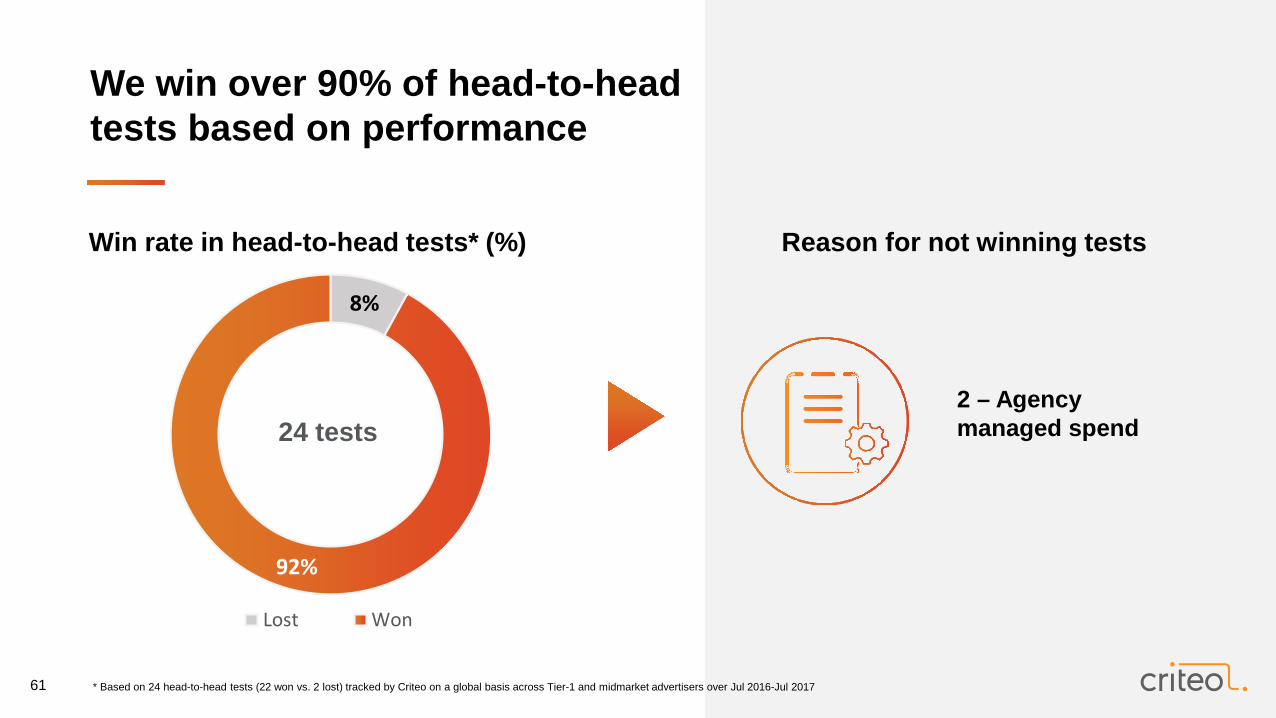
61 * Based on 24 head-to-head tests (22 won vs. 2 lost) tracked by Criteo on a global basis across Tier-1 and midmarket advertisers over Jul 2016-Jul 2017
8%
92%
Lost Won
Win rate in head-to-head tests* (%) Reason for not winning tests
2 – Agency managed spend24 tests
We win over 90% of head-to-head tests based on performance

62
Solid track record of execution

63 * Annual average of quarterly client retention rates, defined as the percentage of live clients during the previous quarter that continued to be live during the current quarter
0
2,000
4,000
6,000
8,000
10,000
12,000
14,000
16,000
18,000
0%
10%
20%
30%
40%
50%
60%
70%
80%
90%
100%
Q3 11Q4 11Q1 12Q2 12Q3 12Q4 12Q1 13Q2 13Q3 13Q4 13Q1 14Q2 14Q3 14Q4 14Q1 15Q2 15Q3 15Q4 15Q1 16Q2 16Q3 16Q4 16Q1 17Q2 17Q3 17
Clients Retention rate
Client retention rate* (%) Clients Revenue ex-TAC ($ millions)
0
50
100
150
200
250
Q1 14 Q2 14 Q3 14 Q4 14 Q1 15 Q2 15 Q3 15 Q4 15 Q1 16 Q2 16 Q3 16 Q4 16 Q1 17 Q2 17 Q3 17
World class client retention and fast growth

64
Revenue ex-TAC ($ millions)
0
10
20
30
40
50
60
70
80
90
Q1 14 Q2 14 Q3 14 Q4 14 Q1 15 Q2 15 Q3 15 Q4 15 Q1 16 Q2 16 Q3 16 Q4 16 Q1 17 Q2 17 Q3 17
Adjusted EBITDA ($ millions)
Strong profitability and high predictability
50
70
90
110
130
150
170
190
210
230
250
Q4 13 Q1 14 Q2 14 Q3 14 Q4 14 Q1 15 Q2 15 Q3 15 Q4 15 Q1 16 Q2 16 Q3 16 Q4 16 Q1 17 Q2 17 Q3 17
Actuals Guidance

65
Financials

66
147
238
403
534
730
889
FY 2012 FY 2013 FY 2014 FY 2015 FY 2016 LTM Q32017
1 We define Revenue ex-TAC as our revenue excluding traffic acquisition costs, or TAC, generated over the applicable measurement period. Revenue ex-TAC is not a measure calculated in accordance with U.S. GAAP. Please see the Appendices for a reconciliation of Revenue ex-TAC to Revenue, the most directly comparable GAAP measure. 2 We define Adjusted EBITDA as our consolidated earnings before financial income (expense), income taxes, depreciation and amortization, adjusted to eliminate the impact of equity awards compensation expense, pension service costs, acquisition-related costs and deferred price consideration. Adjusted EBITDA is not a measure calculated in accordance with U.S. GAAP. Please see the Appendices for a reconciliation of Adjusted EBITDA to net income, the most directly comparable GAAP measure.
Revenue ex-TAC1 ($M) Adjusted EBITDA2 ($M)
+43%CAGRHigh
growthExpandingprofitability
2242
105
143
225
273
FY 2012 FY 2013 FY 2014 FY 2015 FY 2016 LTM Q32017
Solid financial track record since IPO

67
REVENUE EX-TAC ($M) ADJUSTED EBITDA ($M) FREE CASH FLOW ($M)
+31%* +34%* +206%
* At constant currency
Rapid, profitable growth and strong cash flow
142
190
9M 2016 9M 2017
27
83
9M 2016 9M 2017
505
664
9M 2016 9M 2017
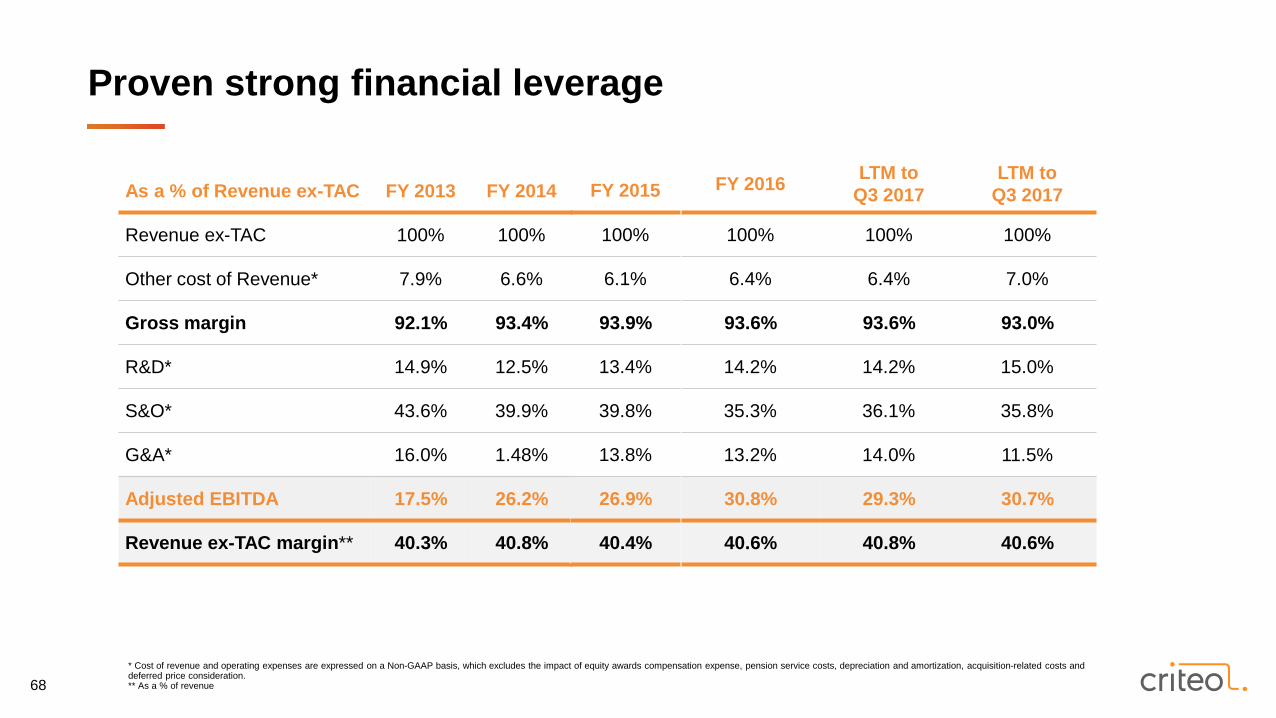
68* Cost of revenue and operating expenses are expressed on a Non-GAAP basis, which excludes the impact of equity awards compensation expense, pension service costs, depreciation and amortization, acquisition-related costs and deferred price consideration. ** As a % of revenue
Proven strong financial leverage
As a % of Revenue ex-TAC FY 2013 FY 2014
Revenue ex-TAC 100% 100%
Other cost of Revenue* 7.9% 6.6%
Gross margin 92.1% 93.4%
R&D* 14.9% 12.5%
S&O* 43.6% 39.9%
G&A* 16.0% 1.48%
Adjusted EBITDA 17.5% 26.2%
Revenue ex-TAC margin** 40.3% 40.8%
FY 2015
100%
6.1%
93.9%
13.4%
39.8%
13.8%
26.9%
40.4%
FY 2016 LTM to Q3 2017
LTM to Q3 2017
100% 100% 100%
6.4% 6.4% 7.0%
93.6% 93.6% 93.0%
14.2% 14.2% 15.0%
35.3% 36.1% 35.8%
13.2% 14.0% 11.5%
30.8% 29.3% 30.7%
40.6% 40.8% 40.6%
69
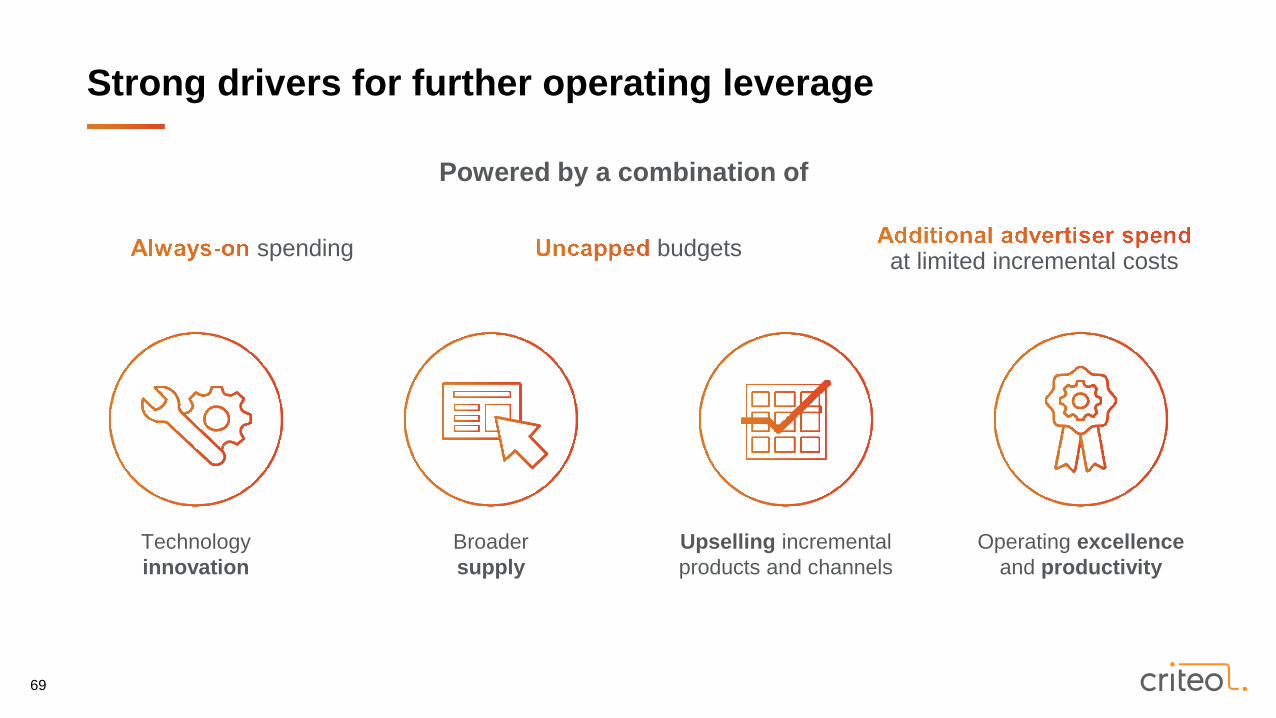
Technology innovation
Broadersupply
Upselling incremental products and channels
Operating excellence and productivity
spending budgets at limited incremental costs
Powered by a combination of
Strong drivers for further operating leverage

70
SMARTINVESTING
Robust operating cash flow enables smart investment

71* Based on a $3B+ market capitalization, pursuant to the 2017 AGM authorization to issue up to 15,6m shares** Only for M&A
Strong balance sheet
1,211
1,358
Dec. 2016 Sep. 2017
Total assets (in $M) Financial liabilities(in $M)
Very low debt
Dec. 2016 Sep. 2017
868
Cash & cashequivalents (in $M)
Significantcash pile
270
358
Dec. 2016 Sep. 2017
>20% of assets
$358Mcash
As of September 30, 2017
€350M committed financing
$750M equity raise capacity*
Share buy-back authorization**
Our financial structure offers significant flexibility
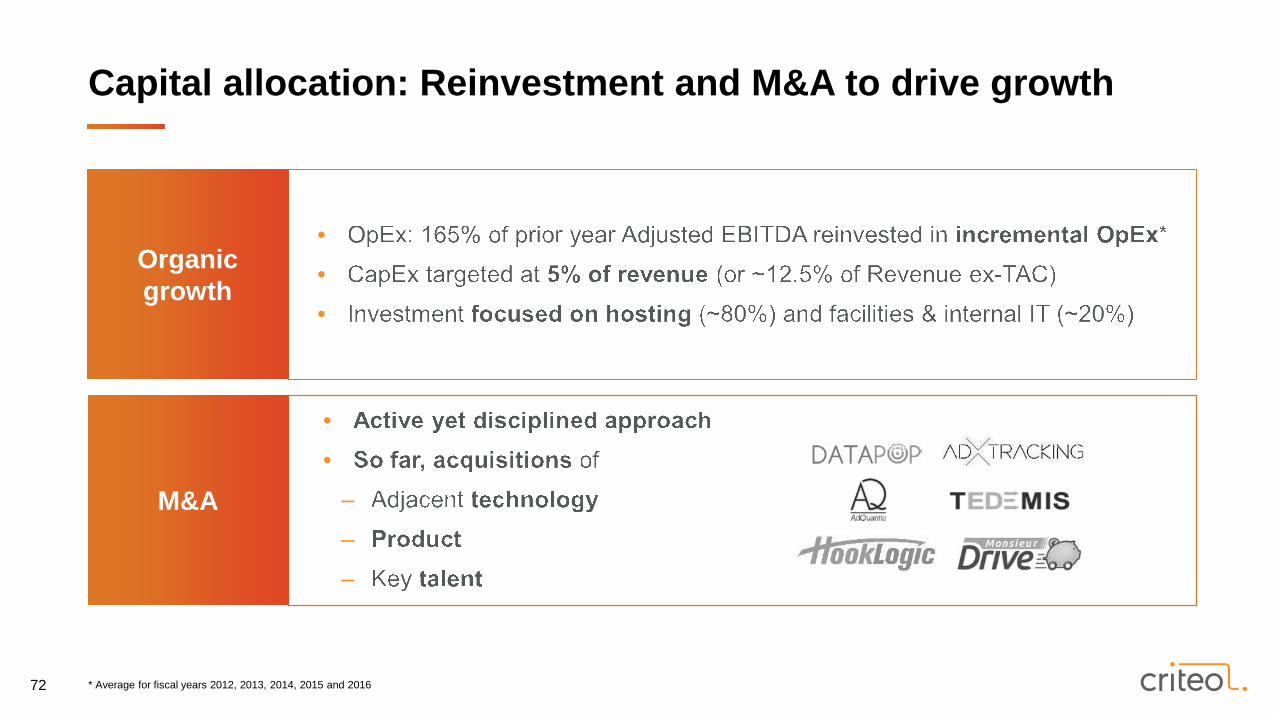
72
••
–––
•••
Organicgrowth
M&A
Capital allocation: Reinvestment and M&A to drive growth
* Average for fiscal years 2012, 2013, 2014, 2015 and 2016

73
Growth Strategy
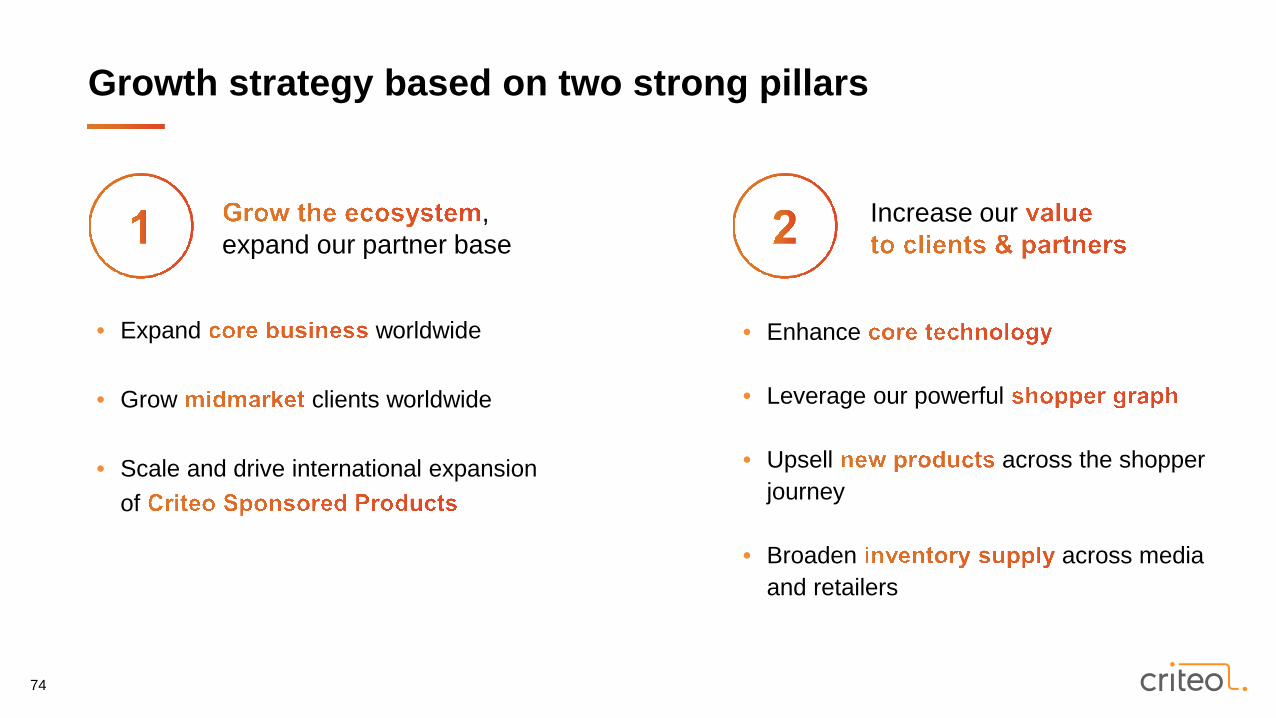
74
Growth strategy based on two strong pillars
, expand our partner base
Increase our
• Expand worldwide
• Grow clients worldwide
• Scale and drive international expansion of
• Enhance
• Leverage our powerful
• Upsell across the shopper journey
• Broaden across mediaand retailers
75
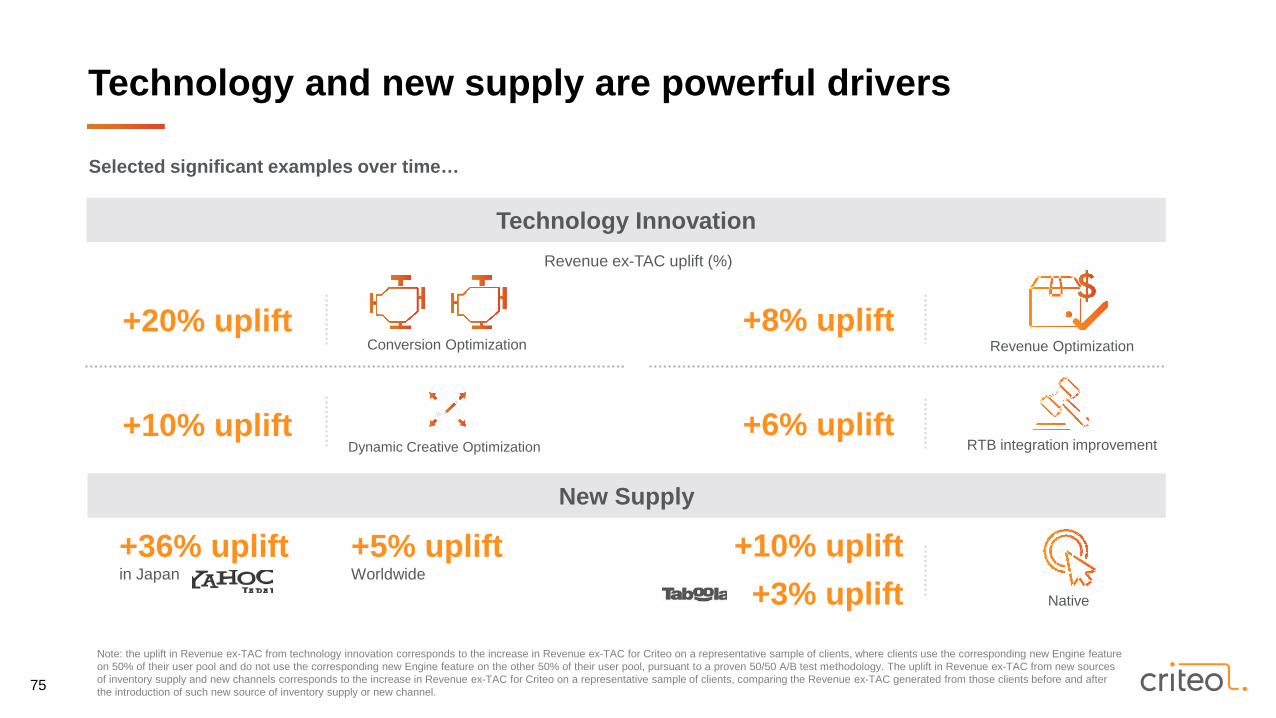
Technology Innovation
New Supply
Revenue ex-TAC uplift (%)
Conversion Optimization+20% uplift
Dynamic Creative Optimization+10% uplift
+8% upliftRevenue Optimization
+6% upliftRTB integration improvement
+36% uplift in Japan
+5% uplift Worldwide
+10% upliftNative+3% uplift
Selected significant examples over time…
Note: the uplift in Revenue ex-TAC from technology innovation corresponds to the increase in Revenue ex-TAC for Criteo on a representative sample of clients, where clients use the corresponding new Engine feature on 50% of their user pool and do not use the corresponding new Engine feature on the other 50% of their user pool, pursuant to a proven 50/50 A/B test methodology. The uplift in Revenue ex-TAC from new sources of inventory supply and new channels corresponds to the increase in Revenue ex-TAC for Criteo on a representative sample of clients, comparing the Revenue ex-TAC generated from those clients before and after the introduction of such new source of inventory supply or new channel.
Technology and new supply are powerful drivers
76
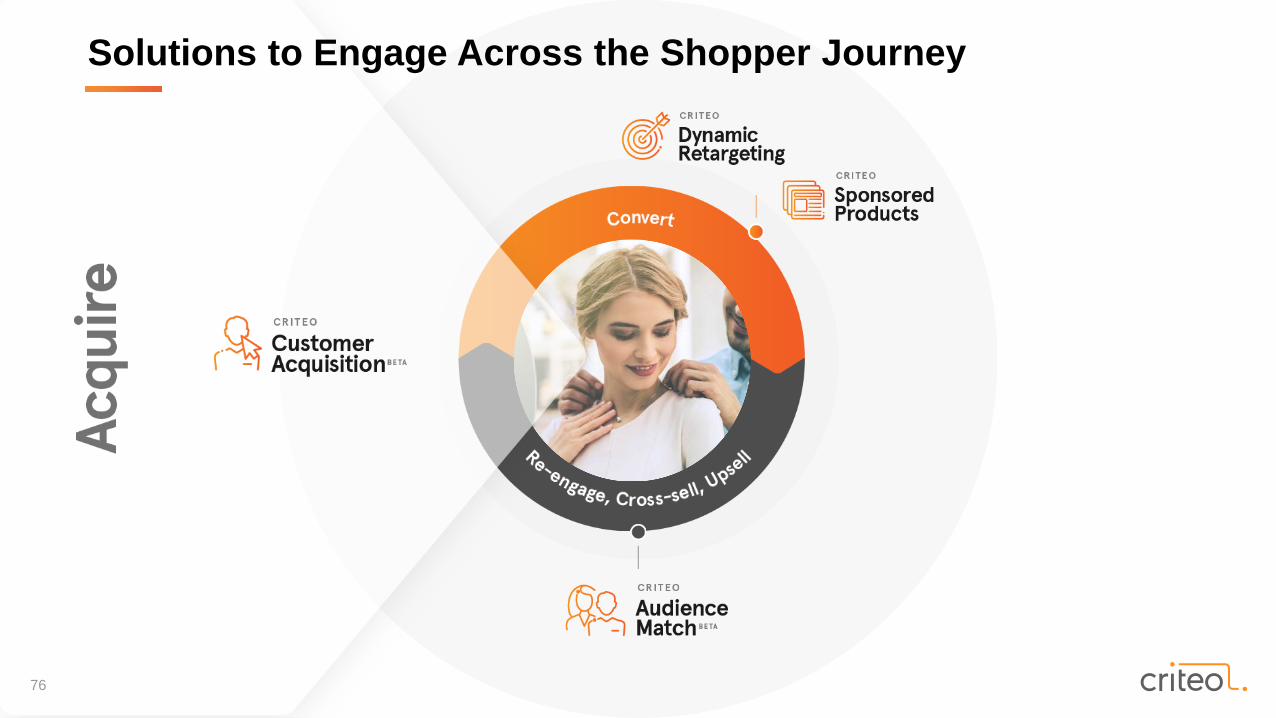
Solutions to Engage Across the Shopper Journey

77
We Are Working to Cover the Full Shopper Journey for Retailers and Brands
1. Feature of Criteo Dynamic Retargeting
Acquire Convert Re-engage, Cross-sell Upsell
ONLINE
OMNICHANNEL
• Criteo Customer Acquisition BETA • Criteo Dynamic Retargeting • Criteo Audience MatchBETA
• Criteo Sponsored Products OffsiteBETA
• Criteo Sponsored Products • Criteo Sponsored Products OffsiteBETA
• Criteo Dynamic Retargeting Store-to-web Retargeting1BETA
• Criteo Audience MatchBETA

78
Investment SummaryLarge market opportunityCommerce Marketing is quickly emerging as the next big digital marketing category after Search and Social
Clear strategyBuild the highest performing and open commerce marketing ecosystem
Strong competitive moatsTechnology, scale and network effects, openness and shopper graph
Proven track-recordStrong client growth while maintaining 90% retention*
Exceeded expectations for 16 consecutive quarter
Attractive financial profileStrong growth, increasing profitability and cash flow
* Dynamic Retargeting

79
IR Contacts
Edouard LassalleVP, Head of Investor Relations32, rue Blanche75009 Paris+33 1 7621 [email protected]
Friederike EdelmannDirector, Investor Relations387 Park Ave South, 12th FloorNew York, NY 10016+1 917 837 8617 [email protected]
ir.criteo.com

80
Appendices
81
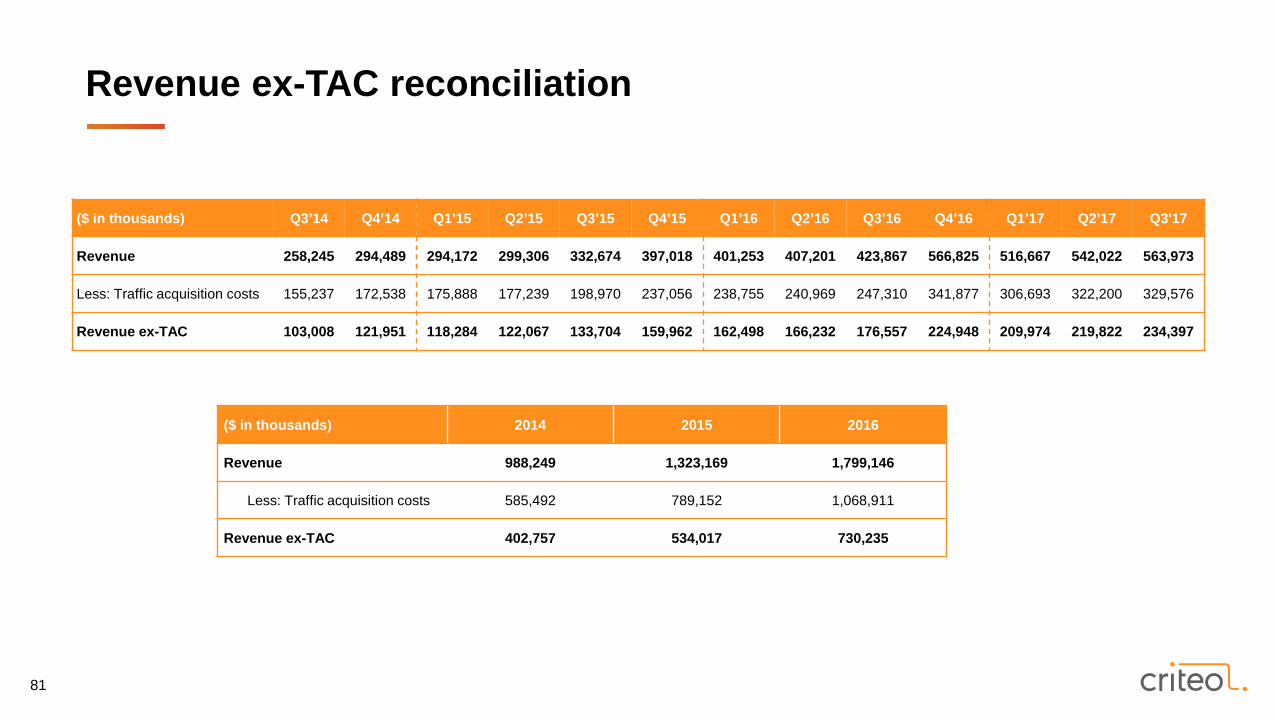
($ in thousands) 2014 2015 2016
Revenue 988,249 1,323,169 1,799,146
Less: Traffic acquisition costs 585,492 789,152 1,068,911
Revenue ex-TAC 402,757 534,017 730,235
Revenue ex-TAC reconciliation
($ in thousands) Q3’14 Q4’14 Q1’15 Q2’15 Q3’15 Q4’15 Q1’16 Q2’16 Q3’16 Q4’16 Q1’17 Q2’17 Q3'17
Revenue 258,245 294,489 294,172 299,306 332,674 397,018 401,253 407,201 423,867 566,825 516,667 542,022 563,973
Less: Traffic acquisition costs 155,237 172,538 175,888 177,239 198,970 237,056 238,755 240,969 247,310 341,877 306,693 322,200 329,576
Revenue ex-TAC 103,008 121,951 118,284 122,067 133,704 159,962 162,498 166,232 176,557 224,948 209,974 219,822 234,397

82
Adjusted EBITDA reconciliation
($ in thousands) Q3’14 Q4’14 Q1’15 Q2’15 Q3’15 Q4’15 Q1’16 Q2’16 Q3’16 Q4’16 Q1’17 Q2’17 Q3'17 2014 2015 2016
Net income 15,439 22,893 13,617 3,929 5,793 38,938 18,527 13,339 14,724 40,740 14,518 7,505 22,269 46,896 62,276 87,329
Adjustments:
Financial (income) expense (7,502) (1,473) (3,920) 2,546 6,650 (735) 1,317 94 570 (1,435) 2,333 2,094 2,886 (11,390) 4,541 546
Provision for income taxes 4,205 4,118 7,143 1,365 5,388 (4,378) 7,944 4,450 7,574 13,161 4,201 3,665 7,858 17,578 9,517 33,129
Equity awards compensation expense
5,754 6,142 6,317 5,325 4,600 7,748 8,370 7,695 13,965 13,229 14,940 14,918 22,028 19,601 23,989 43,259
Pension service costs 125 129 112 110 110 109 129 131 132 133 290 299 320 504 441 524
Depreciation and amortization expense 8,256 9,001 8,428 10,278 11,892 13,967 12,516 13,300 14,771 16,190 20,167 22,306 23,755 31,213 44,565 56,779
Acquisition-related costs - - - - - - - 148 1,793 980 6 - - - - 2,921
Acquisition-related deferred price consideration 128 110 109 115 54 (2,172) 40 44 3 (3) - - - 950 (1,894) 85
Restructuring - - - - - - - - - - - 3,299 - - - -
Total net adjustments 10,966 18,027 18,189 19,739 28,694 14,539 30,316 25,862 38,808 42,255 41,936 46,581 56,847 58,456 81,159 137,243
Adjusted EBITDA 26,405 40,920 31,806 23,668 34,487 53,477 48,843 39,201 53,532 82,995 56,454 54,086 79,116 105,352 143,435 224,572

83
($ in thousands) Q3 2016 Q3 2017
CASH FROM OPERATING ACTIVITIES 43,631 61,727
Acquisition of intangible assets, property, plant and equipment (15,792) (20,999)
Change in accounts payable related to intangible assets, property, plant and equipment (4,115) (6,774)
FREE CASH FLOW 23,724 33,954
Free Cash Flow reconciliation