Crisis Mapping during Natural Disasters via Text Analysis ... 2015, Crisis Mapping during...
8
Crisis Mapping during Natural Disasters via Text Analysis of Social Media Messages Stefano Cresci 1,2 , Andrea Cimino 3 , Felice Dell’Orletta 3 , and Maurizio Tesconi 2 1 Bell Labs, Alcatel-Lucent, Paris, France 2 Institute for Informatics and Telematics, IIT-CNR, Pisa, Italy {stefano.cresci, maurizio.tesconi}@iit.cnr.it 3 Institute for Computational Linguistics, ILC-CNR, Pisa, Italy {andrea.cimino, felice.dellorletta}@ilc.cnr.it Abstract. Recent disasters demonstrated the central role of social me- dia during emergencies thus motivating the exploitation of such data for crisis mapping. We propose a crisis mapping system that addresses lim- itations of current state-of-the-art approaches by analyzing the textual content of disaster reports from a twofold perspective. A damage detec- tion component employs a SVM classifier to detect mentions of damage among emergency reports. A novel geoparsing technique is proposed and used to perform message geolocation. We report on a case study to show how the information extracted through damage detection and message geolocation can be combined to produce accurate crisis maps. Our crisis maps clearly detect both highly and lightly damaged areas, thus opening up the possibility to prioritize rescue efforts where they are most needed. Keywords: Twitter; social media mining; emergency management; cri- sis mapping; geoparsing 1 Introduction Nowadays, a large number of people turns to social media in the aftermath of disasters to seek and publish critical and up to date information [13]. This emerg- ing role of social media as a privileged channel for live information is favored by the pervasive diffusion of mobile devices, often equipped with advanced sensing and communication capabilities [20]. Recently, decision makers and emergency responders have envisioned innovative approaches to exploit the information shared on social media during disasters such as earthquakes and floods [16]. However, such information is often unstructured, heterogeneous and fragmented over a large number of messages in such a way that it cannot be directly used. It is therefore mandatory to turn that messy data into a number of clear and concise messages for emergency responders. Academia showed great interest for such an issue [14], setting up studies and developing experimental solutions along several research directions, such as emergency event detection [19,2], situational awareness [6] and crisis mapping [5,18]. Among these, the task of crisis mapping is of the utmost importance [12], as demonstrated during recent disasters such as
-
Upload
phamnguyet -
Category
Documents
-
view
216 -
download
0
Transcript of Crisis Mapping during Natural Disasters via Text Analysis ... 2015, Crisis Mapping during...

Crisis Mapping during Natural Disastersvia Text Analysis of Social Media Messages
Stefano Cresci1,2, Andrea Cimino3, Felice Dell’Orletta3, and Maurizio Tesconi2
1 Bell Labs, Alcatel-Lucent, Paris, France2 Institute for Informatics and Telematics, IIT-CNR, Pisa, Italy
{stefano.cresci, maurizio.tesconi}@iit.cnr.it3 Institute for Computational Linguistics, ILC-CNR, Pisa, Italy
{andrea.cimino, felice.dellorletta}@ilc.cnr.it
Abstract. Recent disasters demonstrated the central role of social me-dia during emergencies thus motivating the exploitation of such data forcrisis mapping. We propose a crisis mapping system that addresses lim-itations of current state-of-the-art approaches by analyzing the textualcontent of disaster reports from a twofold perspective. A damage detec-tion component employs a SVM classifier to detect mentions of damageamong emergency reports. A novel geoparsing technique is proposed andused to perform message geolocation. We report on a case study to showhow the information extracted through damage detection and messagegeolocation can be combined to produce accurate crisis maps. Our crisismaps clearly detect both highly and lightly damaged areas, thus openingup the possibility to prioritize rescue efforts where they are most needed.
Keywords: Twitter; social media mining; emergency management; cri-sis mapping; geoparsing
1 Introduction
Nowadays, a large number of people turns to social media in the aftermath ofdisasters to seek and publish critical and up to date information [13]. This emerg-ing role of social media as a privileged channel for live information is favored bythe pervasive diffusion of mobile devices, often equipped with advanced sensingand communication capabilities [20]. Recently, decision makers and emergencyresponders have envisioned innovative approaches to exploit the informationshared on social media during disasters such as earthquakes and floods [16].However, such information is often unstructured, heterogeneous and fragmentedover a large number of messages in such a way that it cannot be directly used.It is therefore mandatory to turn that messy data into a number of clear andconcise messages for emergency responders. Academia showed great interest forsuch an issue [14], setting up studies and developing experimental solutions alongseveral research directions, such as emergency event detection [19,2], situationalawareness [6] and crisis mapping [5,18]. Among these, the task of crisis mappingis of the utmost importance [12], as demonstrated during recent disasters such as

2 S. Cresci et al.
Fig. 1. Tweets shared in the aftermath of the 6.0 magnitude earthquake occurred inthe South Napa region, California, US – August 24, 2014. These messages convey bothsituation assessments (green and red colored) and position information (blue colored).
the the Tohoku earthquake and tsunami (Japan – 2011), the Emilia earthquake(Italy – 2012) and the Hurricane Sandy (US – 2012).
In order to produce crisis maps, traditional systems only rely on geotag meta-data of social media messages [18]. However, statistics report that only 1% to4% of all social media messages natively carry geotag metadata [7]. This lim-itation drastically reduces the number of useful messages and results in verysparse maps. Recent work have instead demonstrated that emergency reportsfrequently carry textual references to locations and places [3,4], as shown in Fig-ure 1. Therefore, a fundamental challenge of novel crisis mapping systems is thatof geoparsing the textual content of emergency reports to extract mentions toplaces/locations thus increasing the number of messages to exploit. Geoparsinginvolves binding a textual document to a likely geographic location which ismentioned in the document itself. State-of-the-art systems, such as [18], performthe geoparsing task by resorting to a number of preloaded geographic resourcescontaining all the possible matches between a set of place names (toponyms)and their geographic coordinates. This approach requires an offline phase wherethe system is specifically set to work in a geographically-limited region. Indeed,it would be practically infeasible to load associations between toponyms and co-ordinates for a wide region or for a whole country. Moreover, all crisis mappingsystems detect the most stricken areas by considering the number of messagesshared and by following the assumption that more emergency reports equals tomore damage [18]. Although this relation exists when considering densely anduniformly populated areas [15], it becomes gradually weaker when consideringwider regions or rural areas.
Contributions. Our proposed system exploits both situation assessments andposition information contained in Twitter emergency reports. Figure 1 shows anexample of Twitter emergency reports, highlighting the pieces of information weaim to extract. Overall, the main contributions of this work are summarized asin the following:

Crisis Mapping during Natural Disasters 3
– We train and validate a machine learning classifier to detect messages con-veying information about damage to infrastructures or communities. Theclassifier exploits a wide set of linguistic features qualifying the lexical andgrammatical structure of a text. To our knowledge this is the first workemploying a damage detection component in a crisis mapping task.
– We propose a novel geoparsing technique which exploits semantic annotationtools. By resorting to the Wikipedia and DBpedia collaborative knowledge-bases, it potentially allows to geocode messages from all over the world,thus overcoming the restriction of working on a specific geographic area.The semantic annotation process also alleviates the problem of toponymicpolysemy (the word “Washington” may refer to the first US president, tothe US capital, to the US state, etc.) by disambiguating the textual contentof emergency reports. We propose and validate 2 implementations of thistechnique which respectively exploit TagMe [10] and DBpedia Spotlight [17].
– We leverage information visualization techniques and combine message ge-olocation and damage detection to produce crisis maps. We exploit D3.js4
to build interactive, Web-based visualizations where geographic regions arecolored according to the likelihood of damage. Our crisis maps can be easilyembedded into Web emergency management systems, such as [3].
– We investigate a real case study to demonstrate the effectiveness of oursystem in detecting both highly and lightly damaged areas.
2 The Text Analysis system
The dataset exploited for this work is an improvement of the dataset originallyused in [8], which is freely available for research purposes5. It is composed of Ital-ian tweets, collected in the aftermath of 3 natural disasters. Tweets have beenmanually annotated for mentions of damage according to 3 classes: (i) tweetsrelated to the disaster and carrying information about damage to infrastruc-tures/communities (damage); (ii) tweets related to the disaster but not carryingrelevant information for the assessment of damage (no damage); (iii) tweets notrelated to the disaster (not relevant). The inclusion of a class for tweets that arenot related to a disaster (not relevant) is necessary because the automatic datacollection strategy we adopted does not guarantee that all the tweets collectedare actually related to the disaster under investigation.
Damage detection. The goal of this component is that of automatically de-tecting mentions of damage in tweets. To perform this task we trained a ma-chine learning classifier operating on morpho-syntactically tagged and depen-dency parsed texts. Given a set of features and a learning corpus (i.e. the anno-tated dataset), the classifier trains a statistical model using the feature statisticsextracted from the corpus. This trained model is then employed in the classifica-tion of unseen tweets and, for each tweet, it assigns the probability of belonging
4http://d3js.org/
5http://socialsensing.eu/datasets
4 S. Cresci et al.
damage no damage not relevant
Dataset Accuracy Prec. Rec. F-M. Prec. Rec. F-M. Prec. Rec. F-M.
L’Aquila 0.83 0.92 0.87 0.89 0.81 0.87 0.84 0.77 0.71 0.74
Emilia 0.82 0.91 0.88 0.90 0.85 0.89 0.87 0.54 0.46 0.50
Sardegna 0.78 0.86 0.93 0.89 0.50 0.46 0.48 0.31 0.14 0.19
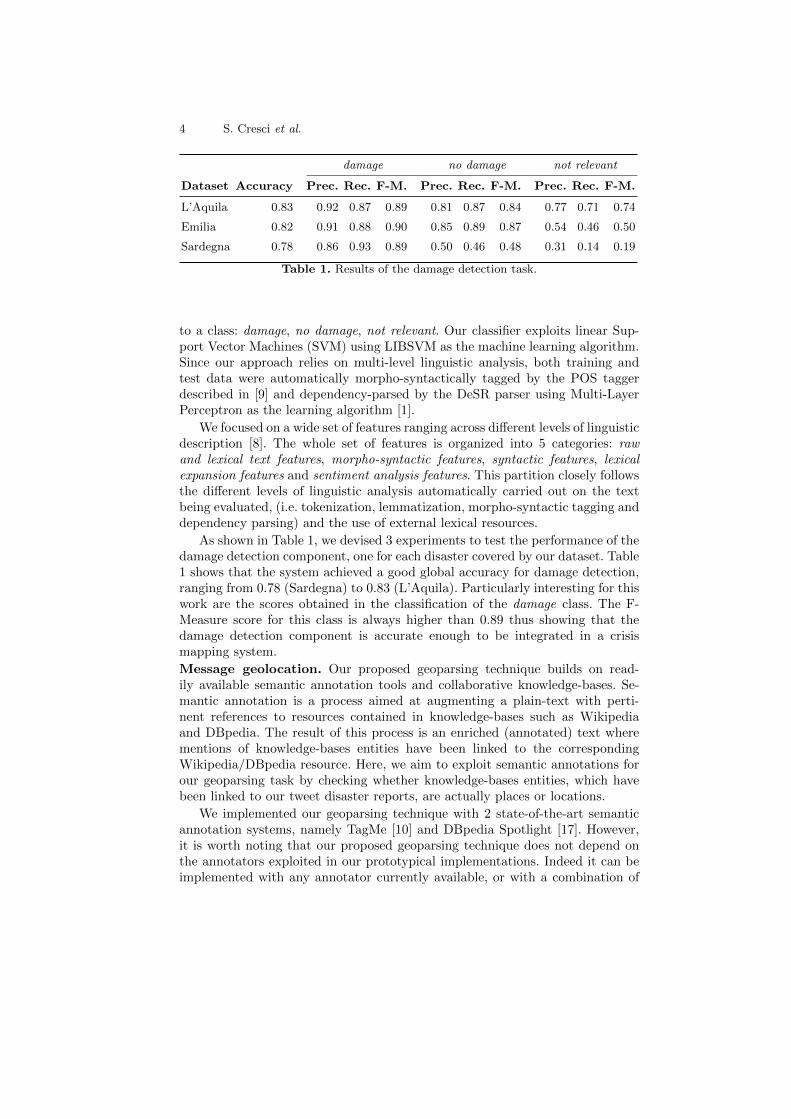
Table 1. Results of the damage detection task.
to a class: damage, no damage, not relevant. Our classifier exploits linear Sup-port Vector Machines (SVM) using LIBSVM as the machine learning algorithm.Since our approach relies on multi-level linguistic analysis, both training andtest data were automatically morpho-syntactically tagged by the POS taggerdescribed in [9] and dependency-parsed by the DeSR parser using Multi-LayerPerceptron as the learning algorithm [1].
We focused on a wide set of features ranging across different levels of linguisticdescription [8]. The whole set of features is organized into 5 categories: rawand lexical text features, morpho-syntactic features, syntactic features, lexicalexpansion features and sentiment analysis features. This partition closely followsthe different levels of linguistic analysis automatically carried out on the textbeing evaluated, (i.e. tokenization, lemmatization, morpho-syntactic tagging anddependency parsing) and the use of external lexical resources.
As shown in Table 1, we devised 3 experiments to test the performance of thedamage detection component, one for each disaster covered by our dataset. Table1 shows that the system achieved a good global accuracy for damage detection,ranging from 0.78 (Sardegna) to 0.83 (L’Aquila). Particularly interesting for thiswork are the scores obtained in the classification of the damage class. The F-Measure score for this class is always higher than 0.89 thus showing that thedamage detection component is accurate enough to be integrated in a crisismapping system.
Message geolocation. Our proposed geoparsing technique builds on read-ily available semantic annotation tools and collaborative knowledge-bases. Se-mantic annotation is a process aimed at augmenting a plain-text with perti-nent references to resources contained in knowledge-bases such as Wikipediaand DBpedia. The result of this process is an enriched (annotated) text wherementions of knowledge-bases entities have been linked to the correspondingWikipedia/DBpedia resource. Here, we aim to exploit semantic annotations forour geoparsing task by checking whether knowledge-bases entities, which havebeen linked to our tweet disaster reports, are actually places or locations.
We implemented our geoparsing technique with 2 state-of-the-art semanticannotation systems, namely TagMe [10] and DBpedia Spotlight [17]. However,it is worth noting that our proposed geoparsing technique does not depend onthe annotators exploited in our prototypical implementations. Indeed it can beimplemented with any annotator currently available, or with a combination of
Crisis Mapping during Natural Disasters 5
Precision Recall Accuracy F-Measure MCC
TagMe [10] 0.88 0.80 0.86 0.84 0.72
DBpedia Spotlight [17] 0.85 0.51 0.74 0.64 0.49
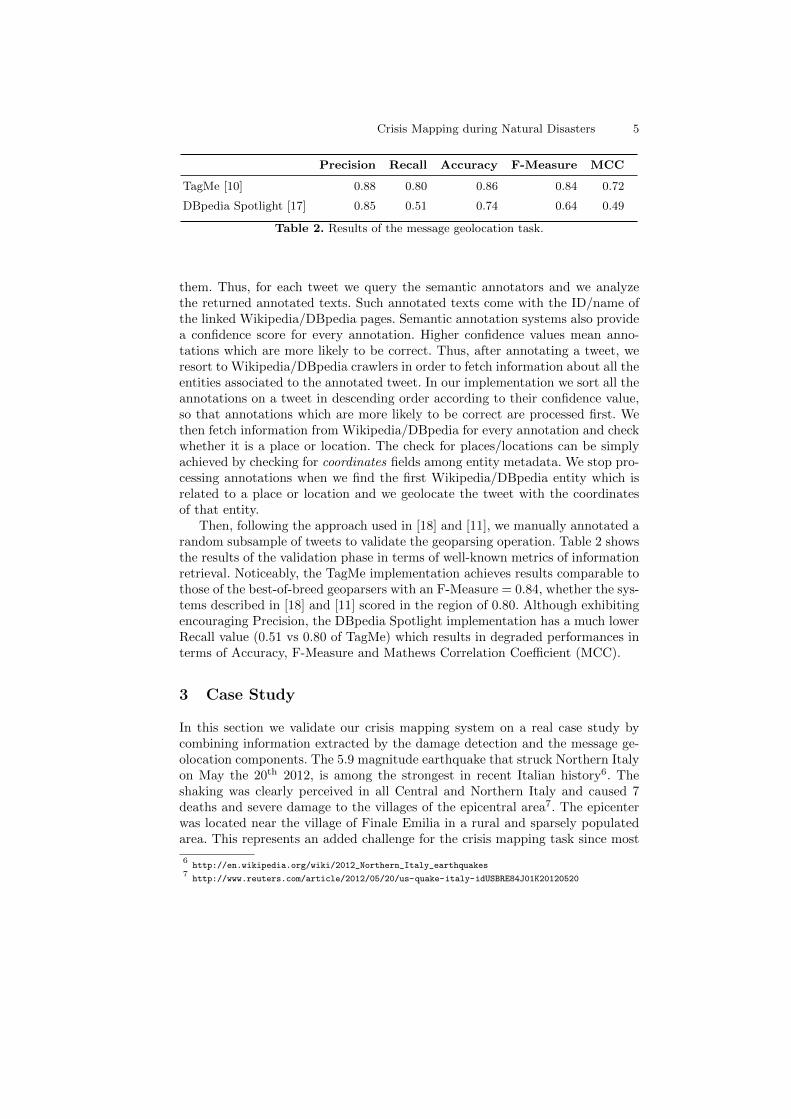
Table 2. Results of the message geolocation task.
them. Thus, for each tweet we query the semantic annotators and we analyzethe returned annotated texts. Such annotated texts come with the ID/name ofthe linked Wikipedia/DBpedia pages. Semantic annotation systems also providea confidence score for every annotation. Higher confidence values mean anno-tations which are more likely to be correct. Thus, after annotating a tweet, weresort to Wikipedia/DBpedia crawlers in order to fetch information about all theentities associated to the annotated tweet. In our implementation we sort all theannotations on a tweet in descending order according to their confidence value,so that annotations which are more likely to be correct are processed first. Wethen fetch information from Wikipedia/DBpedia for every annotation and checkwhether it is a place or location. The check for places/locations can be simplyachieved by checking for coordinates fields among entity metadata. We stop pro-cessing annotations when we find the first Wikipedia/DBpedia entity which isrelated to a place or location and we geolocate the tweet with the coordinatesof that entity.
Then, following the approach used in [18] and [11], we manually annotated arandom subsample of tweets to validate the geoparsing operation. Table 2 showsthe results of the validation phase in terms of well-known metrics of informationretrieval. Noticeably, the TagMe implementation achieves results comparable tothose of the best-of-breed geoparsers with an F-Measure = 0.84, whether the sys-tems described in [18] and [11] scored in the region of 0.80. Although exhibitingencouraging Precision, the DBpedia Spotlight implementation has a much lowerRecall value (0.51 vs 0.80 of TagMe) which results in degraded performances interms of Accuracy, F-Measure and Mathews Correlation Coefficient (MCC).
3 Case Study
In this section we validate our crisis mapping system on a real case study bycombining information extracted by the damage detection and the message ge-olocation components. The 5.9 magnitude earthquake that struck Northern Italyon May the 20th 2012, is among the strongest in recent Italian history6. Theshaking was clearly perceived in all Central and Northern Italy and caused 7deaths and severe damage to the villages of the epicentral area7. The epicenterwas located near the village of Finale Emilia in a rural and sparsely populatedarea. This represents an added challenge for the crisis mapping task since most
6http://en.wikipedia.org/wiki/2012_Northern_Italy_earthquakes
7http://www.reuters.com/article/2012/05/20/us-quake-italy-idUSBRE84J01K20120520

6 S. Cresci et al.
of the tweets came from the big urban centers in Northern Italy, such as Milan,Venice and Genoa.
Fig. 2. Choropleth map for the Emilia 2012 earthquake showing the distribution ofdamage tweets among the municipalities of Northern Italy.
Figure 2 shows a choropleth map of Northern Italy where municipalities arecolored so as to represent mentions of damage among tweet reports. Specifically,a color is assigned to a municipality according to the log number of tweets ofthe damage class geolocated in that municipality, normalized by its population.Data about the population of municipalities has been automatically fetched fromWikipedia and DBpedia during the crawling and query operations described inSection 2. The normalization allows to highlight the risk of damage also for ruraland sparsely populated municipalities, where the number of available tweets isvery low. Areas in which our system did not geolocate any damage tweet are greycolored in Figure 2. As shown, despite geolocating tweets in all Northern Italy,our system only highlighted municipalities around the epicenter, clearly pointingto the damaged area. In figure, reddish colors are assigned to the municipalitiesof Bondeno, Ferrara, Finale Emilia and San Felice sul Panaro, thus accuratelymatching the most damaged locations.
Figure 3 shows 2 polar (radar) plots in which tweets of both the damageand no damage classes are considered. The plots are centered on the epicenterand present dotted concentric circles marking distances from the epicenter witha step of 50 kilometers. To avoid overplotting, we used an hexagonal binning(hexbinning) technique: the plot’s surface is divided into hexagons whose area isproportional to the number of tweets geolocated in that space. Thus, areas withmore tweets have bigger hexagons (e.g.: Milan, Bologna). On the left-hand sideof Figure 3 is a polar plot showing the spatial distribution of natively (GPS) ge-olocated tweets. The low number of natively geolocated tweets is represented byboth the sparsity and the small size of the hexagons. This was the starting situ-ation for our work, with a small number of geolocated messages and no damagelabel. Instead, on the right-hand side of Figure 3 is the polar plot produced by

Crisis Mapping during Natural Disasters 7
Fig. 3. Polar plots showing the hexbinned spatial distribution of tweets in NorthernItaly for the Emilia 2012 earthquake.
our system in which hexagons are colored according the ratio of damagedamage+no damage
tweets. Big urban centers, such as Milan, Venice and Genoa, are represented byclusters of big sized hexagons reflecting the high number of tweets geolocated inthose areas. However, despite the number of tweets, only the areas that actuallysuffered damage are yellow- and red-colored.
4 Conclusions and Future Work
In this work we proposed a novel crisis mapping system that overcomes the mainlimitations of current state-of-the-art solutions while still producing accuratemaps. By introducing damage detection and by proposing a novel geoparsingtechnique, we are confident that our system represents a seminal work in theresearch field of crisis mapping. As such, possible directions for future work aremanifold. The linguistic analysis carried out as part of the damage detection taskcould be brought to a deeper level. In fact, the damage detection classifier couldbe trained to detect the object that suffered the damage and such informationcould be used to enrich the maps. Results for the message geolocation task arealready promising, but the validation process showed that there is still spacefor considerable improvements, especially regarding the Recall metric. Recentdevelopments of semantic annotation tools open up the possibility to providemore implementations of our proposed geoparsing technique. Therefore we envi-sion the possibility to simultaneously exploit multiple semantic annotators in avoting system. Finally, we are currently working to embed the hereby discussedsystem into the Web emergency management system described in [3].
8 S. Cresci et al.
Acknowledgements. The authors would like to thank Matteo Abrate and Salvatore
Rinzivillo, for their insightful suggestions about data visualization. This research was
supported by the .it domain registration authority (Registro .it) funded project SoS -
Social Sensing (http://socialsensing.it/en).
References
1. G. Attardi, F. Dell’Orletta, M. Simi, and J. Turian. Accurate dependency parsingwith a stacked multilayer perceptron. In Evalita’09.
2. M. Avvenuti, S. Cresci, M. La Polla, A. Marchetti, and M. Tesconi. Earthquakeemergency management by social sensing. In PERCOM’14 Workshops. IEEE.
3. M. Avvenuti, S. Cresci, A. Marchetti, C. Meletti, and M. Tesconi. EARS (earth-quake alert and report system): a real time decision support system for earthquakecrisis management. In KDD’14. ACM.
4. M. Avvenuti, F. Del Vigna, S. Cresci, A. Marchetti, and M. Tesconi. Pullinginformation from social media in the aftermath of unpredictable disasters. In ICT-DM’15. IEEE.
5. B. Birregah, T. Top, C. Perez, E. Chatelet, N. Matta, M. Lemercier, and H. Snoussi.Multi-layer crisis mapping: a social media-based approach. In WETICE’12. IEEE.
6. M. A. Cameron, R. Power, B. Robinson, and J. Yin. Emergency situation awarenessfrom twitter for crisis management. In WWW’12 companion. ACM.
7. Z. Cheng, J. Caverlee, and K. Lee. You are where you tweet: a content-basedapproach to geo-locating twitter users. In CIKM’10. ACM.
8. S. Cresci, M. Tesconi, A. Cimino, and F. Dell’Orletta. A linguistically-drivenapproach to cross-event damage assessment of natural disasters from social mediamessages. In WWW’15 companion. ACM.
9. F. Dell’Orletta. Ensemble system for part-of-speech tagging. In Evalita’09.10. P. Ferragina and U. Scaiella. Tagme: on-the-fly annotation of short text fragments
(by wikipedia entities). In CIKM’10. ACM.11. J. Gelernter and S. Balaji. An algorithm for local geoparsing of microtext. GeoIn-
formatica, 2013.12. R. Goolsby. Social media as crisis platform: The future of community maps/crisis
maps. ACM Transactions on Intelligent Systems and Technology, 2010.13. A. L. Hughes and L. Palen. Twitter adoption and use in mass convergence and
emergency events. International Journal of Emergency Management, 2009.14. M. Imran, C. Castillo, F. Diaz, and S. Vieweg. Processing social media messages
in mass emergency: A survey. ACM Computing Surveys, 2015.15. Y. Liang, J. Caverlee, and J. Mander. Text vs. images: On the viability of social
media to assess earthquake damage. In WWW’13 companion. ACM.16. P. Meier. New information technologies and their impact on the humanitarian
sector. International review of the Red Cross, 2011.17. P. N. Mendes, M. Jakob, A. Garcıa-Silva, and C. Bizer. Dbpedia spotlight: shedding
light on the web of documents. In Semantics’11. ACM.18. S. E. Middleton, L. Middleton, and S. Modafferi. Real-time crisis mapping of
natural disasters using social media. IEEE Intelligent Systems, 2014.19. T. Sakaki, M. Okazaki, and Y. Matsuo. Earthquake shakes twitter users: real-time
event detection by social sensors. In WWW’10. ACM.20. A. M. Segura, J. de Lara, and J. S. Cuadrado. Rapid development of interactive
applications based on online social networks. In WISE’14. Springer.