CRISIL IERIndependentEquityResearch - ISMT
28
M A K IN G M A R K E T S F U N C T I O N B E T T E R YEARS CRISIL IERIndependentEquityResearch Enhancing investment decisions ISMT Ltd Initiating coverage
Transcript of CRISIL IERIndependentEquityResearch - ISMT
MAKING MARK
ETS
FU
NC
TIO
NB
ET
TE
R
YEARS
Apollo Hospitals Enterprise Ltd
CRISIL IERIndependentEquityResearch
Enhancing investment decisions
Detailed Report
ISMT Ltd
Initiating coverage

CRISIL IERIndependentEquityResearch
Explanation of CRISIL Fundamental and Valuation (CFV) matrix
The CFV Matrix (CRISIL Fundamental and Valuation Matrix) addresses the two important analysis of an investment making process – Analysis of Fundamentals (addressed through Fundamental Grade) and Analysis of Returns (Valuation Grade) The fundamental grade is assigned on a five-point scale from grade 5 (indicating Excellent fundamentals) to grade 1 (Poor fundamentals) The valuation grade is assigned on a five-
point scale from grade 5 (indicating strong upside from the current market price (CMP)) to grade 1 (strong downside from the CMP).
CRISIL Fundamental Grade Assessment
CRISIL Valuation Grade Assessment
5/5 Excellent fundamentals 5/5 Strong upside (>25% from CMP) 4/5 Superior fundamentals 4/5 Upside (10-25% from CMP) 3/5 Good fundamentals 3/5 Align (+-10% from CMP) 2/5 Moderate fundamentals 2/5 Downside (negative 10-25% from CMP) 1/5 Poor fundamentals 1/5 Strong downside (<-25% from CMP)
About CRISIL Limited CRISIL is a global analytical company providing ratings, research, and risk and policy advisory services. We are India's leading ratings agency.We are also the foremost provider of high-end research to the world's largest banks and leading corporations. About CRISIL Research CRISIL Research is India's largest independent and integrated research house.We provide insights, opinions, and analysis on the Indian economy, industries, capital markets and companies. We are India's most credible provider of economy and industry research. Our industry research covers 70 sectors and is known for its rich insights and perspectives. Our analysis is supported by inputs from our network of more than 4,500 primary sources, including industry experts, industry associations, and trade channels. We play a key role in India's fixed income markets.We are India's largest provider of valuations of fixed income securities, serving the mutual fund, insurance, and banking industries. We are the sole provider of debt and hybrid indices to India's mutual fund and life insurance industries.We pioneered independent equity research in India, and are today India's largest independent equity research house. Our defining trait is the ability to convert information and data into expert judgements and forecasts with complete objectivity. We leverage our deep understanding of the macroeconomy and our extensive sector coverage to provide unique insights on micromacro and cross-sectoral linkages. We deliver our research through an innovative web-based research platform. Our talent pool comprises economists, sector experts, company analysts, and information management specialists. CRISIL Privacy CRISIL respects your privacy. We use your contact information, such as your name, address, and email id, to fulfill your request and service your account and to provide you with additional information from CRISIL and other parts of The McGraw-Hill Companies, Inc. you may find of interest. For further information, or to let us know your preferences with respect to receiving marketing materials, please visit www.crisil.com/privacy. You can view McGraw-Hill's Customer Privacy Policy at http://www.mcgrawhill.com/site/tools/privacy/privacy_english. Last updated: 31 March, 2011 Analyst Disclosure Each member of the team involved in the preparation of the grading report, hereby affirms that there exists no conflict of interest that can bias the grading recommendation of the company. Disclaimer: This Company-commissioned CRISIL IER report is based on data publicly available or from sources considered reliable. CRISIL Ltd. (CRISIL) does not represent that it is accurate or complete and hence, it should not be relied upon as such. The data / report is subject to change without any prior notice. Opinions expressed herein are our current opinions as on the date of this report. Nothing in this report constitutes investment, legal, accounting or tax advice or any solicitation, whatsoever. The subscriber / user assume the entire risk of any use made of this data / report. CRISIL especially states that, it has no financial liability whatsoever, to the subscribers / users of this report. This report is for the personal information only of the authorised recipient in India only. This report should not be reproduced or redistributed or communicated directly or indirectly in any form to any other person – especially outside India or published or copied in whole or in part, for any purpose.
MAKING MARK
ETS
FU
NC
TIO
NB
ET
TE
R
YEARS ISMT Ltd
Pushing for seamless growth
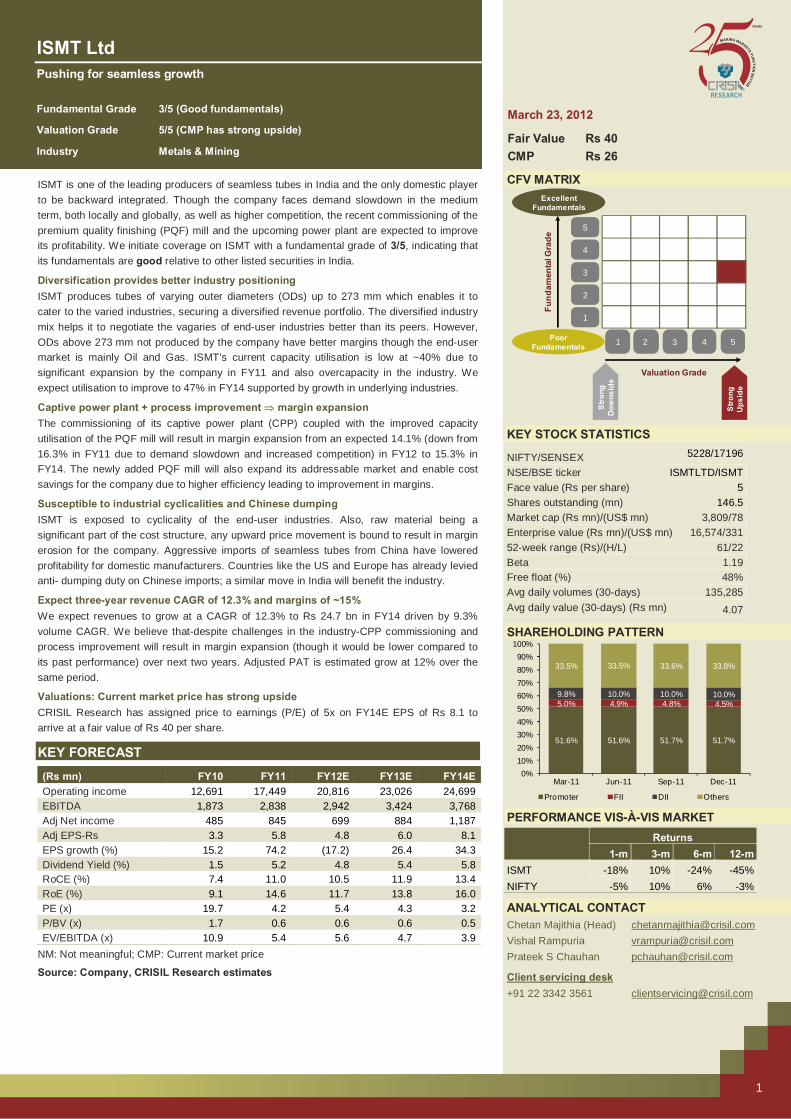
Fundamental Grade 3/5 (Good fundamentals)
Valuation Grade 5/5 (CMP has strong upside)
Industry Metals & Mining
1
ISMT is one of the leading producers of seamless tubes in India and the only domestic player to be backward integrated. Though the company faces demand slowdown in the medium term, both locally and globally, as well as higher competition, the recent commissioning of the premium quality finishing (PQF) mill and the upcoming power plant are expected to improve its profitability. We initiate coverage on ISMT with a fundamental grade of 3/5, indicating that its fundamentals are good relative to other listed securities in India.
Diversification provides better industry positioning ISMT produces tubes of varying outer diameters (ODs) up to 273 mm which enables it to cater to the varied industries, securing a diversified revenue portfolio. The diversified industry mix helps it to negotiate the vagaries of end-user industries better than its peers. However, ODs above 273 mm not produced by the company have better margins though the end-user market is mainly Oil and Gas. ISMT’s current capacity utilisation is low at ~40% due to significant expansion by the company in FY11 and also overcapacity in the industry. We expect utilisation to improve to 47% in FY14 supported by growth in underlying industries.
Captive power plant + process improvement ⇒ margin expansion The commissioning of its captive power plant (CPP) coupled with the improved capacity utilisation of the PQF mill will result in margin expansion from an expected 14.1% (down from 16.3% in FY11 due to demand slowdown and increased competition) in FY12 to 15.3% in FY14. The newly added PQF mill will also expand its addressable market and enable cost savings for the company due to higher efficiency leading to improvement in margins.
Susceptible to industrial cyclicalities and Chinese dumping ISMT is exposed to cyclicality of the end-user industries. Also, raw material being a significant part of the cost structure, any upward price movement is bound to result in margin erosion for the company. Aggressive imports of seamless tubes from China have lowered profitability for domestic manufacturers. Countries like the US and Europe has already levied anti- dumping duty on Chinese imports; a similar move in India will benefit the industry.
Expect three-year revenue CAGR of 12.3% and margins of ~15% We expect revenues to grow at a CAGR of 12.3% to Rs 24.7 bn in FY14 driven by 9.3% volume CAGR. We believe that-despite challenges in the industry-CPP commissioning and process improvement will result in margin expansion (though it would be lower compared to its past performance) over next two years. Adjusted PAT is estimated grow at 12% over the same period.
Valuations: Current market price has strong upside CRISIL Research has assigned price to earnings (P/E) of 5x on FY14E EPS of Rs 8.1 to arrive at a fair value of Rs 40 per share.
KEY FORECAST
(Rs mn) FY10 FY11 FY12E FY13E FY14EOperating income 12,691 17,449 20,816 23,026 24,699EBITDA 1,873 2,838 2,942 3,424 3,768Adj Net income 485 845 699 884 1,187Adj EPS-Rs 3.3 5.8 4.8 6.0 8.1EPS growth (%) 15.2 74.2 (17.2) 26.4 34.3Dividend Yield (%) 1.5 5.2 4.8 5.4 5.8RoCE (%) 7.4 11.0 10.5 11.9 13.4RoE (%) 9.1 14.6 11.7 13.8 16.0PE (x) 19.7 4.2 5.4 4.3 3.2P/BV (x) 1.7 0.6 0.6 0.6 0.5EV/EBITDA (x) 10.9 5.4 5.6 4.7 3.9
NM: Not meaningful; CMP: Current market price
Source: Company, CRISIL Research estimates
CFV MATRIX
KEY STOCK STATISTICS
NIFTY/SENSEX 5228/17196
NSE/BSE ticker ISMTLTD/ISMTFace value (Rs per share) 5Shares outstanding (mn) 146.5Market cap (Rs mn)/(US$ mn) 3,809/78Enterprise value (Rs mn)/(US$ mn) 16,574/33152-week range (Rs)/(H/L) 61/22Beta 1.19Free float (%) 48%Avg daily volumes (30-days) 135,285Avg daily value (30-days) (Rs mn) 4.07
SHAREHOLDING PATTERN
PERFORMANCE VIS-À-VIS MARKET
Returns
1-m 3-m 6-m 12-mISMT -18% 10% -24% -45%NIFTY -5% 10% 6% -3%
ANALYTICAL CONTACT Chetan Majithia (Head) [email protected] Vishal Rampuria [email protected] Prateek S Chauhan [email protected]
Client servicing desk +91 22 3342 3561 [email protected]
1 2 3 4 5
1
2
3
4
5
Valuation Grade
Fund
amen
tal G
rade
Poor Fundamentals
ExcellentFundamentals
Str
ong
Dow
nsid
e
Str
ong
Ups
ide
51.6% 51.6% 51.7% 51.7%
5.0% 4.9% 4.8% 4.5%9.8% 10.0% 10.0% 10.0%
33.5% 33.5% 33.6% 33.8%
0%10%20%30%40%50%60%70%80%90%
100%
Mar-11 Jun-11 Sep-11 Dec-11
Promoter FII DII Others
March 23, 2012
Fair Value Rs 40 CMP Rs 26
CRISIL IERIndependentEquityResearch
2
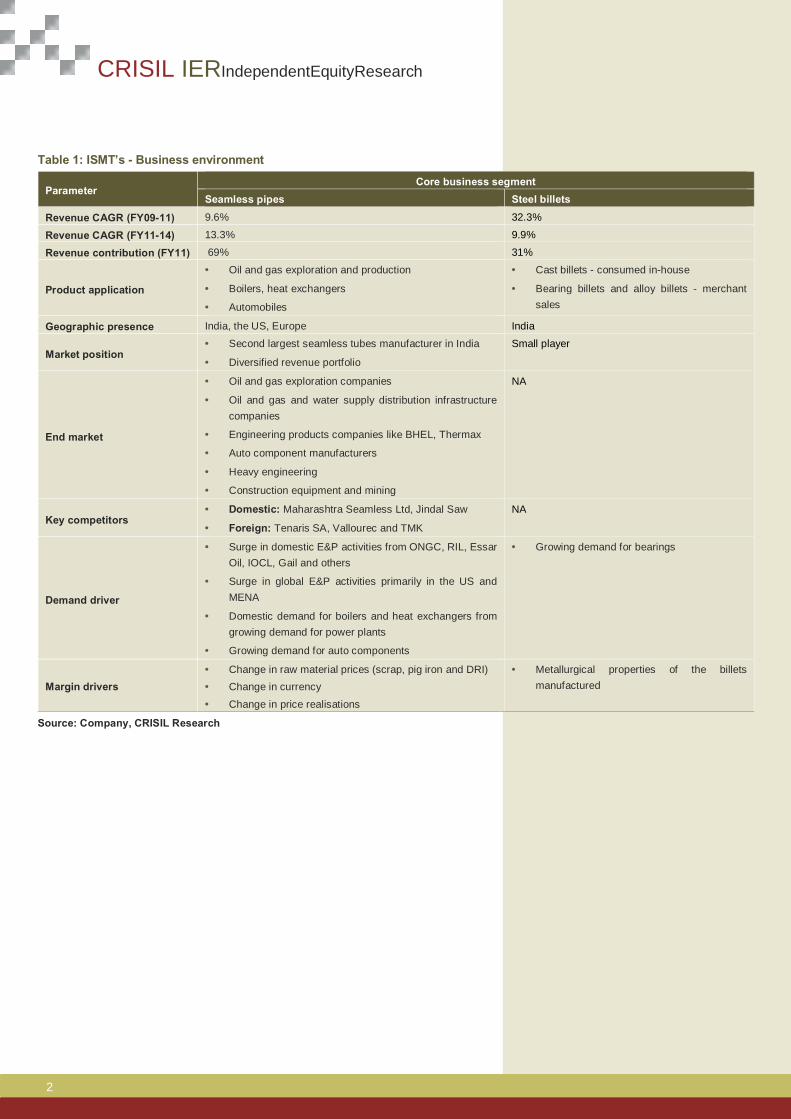
Table 1: ISMT’s - Business environment
Parameter Core business segment
Seamless pipes Steel billets
Revenue CAGR (FY09-11) 9.6% 32.3%
Revenue CAGR (FY11-14) 13.3% 9.9%
Revenue contribution (FY11) 69% 31%
Product application
• Oil and gas exploration and production
• Boilers, heat exchangers
• Automobiles
• Cast billets - consumed in-house
• Bearing billets and alloy billets - merchant sales
Geographic presence India, the US, Europe India
Market position • Second largest seamless tubes manufacturer in India
• Diversified revenue portfolio
Small player
End market
• Oil and gas exploration companies
• Oil and gas and water supply distribution infrastructure companies
• Engineering products companies like BHEL, Thermax
• Auto component manufacturers
• Heavy engineering
• Construction equipment and mining
NA
Key competitors • Domestic: Maharashtra Seamless Ltd, Jindal Saw
• Foreign: Tenaris SA, Vallourec and TMK
NA
Demand driver
• Surge in domestic E&P activities from ONGC, RIL, Essar Oil, IOCL, Gail and others
• Surge in global E&P activities primarily in the US and MENA
• Domestic demand for boilers and heat exchangers from growing demand for power plants
• Growing demand for auto components
• Growing demand for bearings
Margin drivers • Change in raw material prices (scrap, pig iron and DRI) • Change in currency
• Change in price realisations
• Metallurgical properties of the billets manufactured
Source: Company, CRISIL Research

MAKING MARK
ETS
FU
NC
TIO
NB
ET
TE
R
YEARS
3
ISMT Ltd
Grading Rationale
A leading seamless tube player in India ISMT is a leading producer of precision seamless tubes in India, behind Maharashtra
Seamless, with an installed capacity of 4.65 lakh tonnes per annum (ltpa). The company
produces tubes which are below 10.75’’ (273 mm) diameter and, therefore, have varied
usage. The company also has a separate division whereby it produces value-added precision
products from seamless tubes like cold rolled rings for bearings, components, couplings,
constant velocity cages, etc. ISMT has a well-diversified revenue portfolio with an exposure to
different segments which insulates it from vagaries of any particular sector (Refer Figure 2).
Competitors like Maharashtra Seamless focus on higher dimension tubes, which are mainly
used in oil and gas exploration. Though Jindal Saw has a sizeable exposure to seamless
tubes, it is primarily focussed on large diameter longitudinal submerged arc welded (LSAW)
and ductile iron (DI) pipes. Figure 1: Sales volume growth Figure 2: ISMT’s revenue portfolio
Source: Company, Prowess, CRISIL Research Source: Company data, CRISIL Research
To benefit from growth in underlying industries
Demand for seamless tubes to be driven by:
1. Ramp-up in global E&P activity CRISIL Research believes that the medium-term outlook of global demand for seamless pipes
is significantly positive on the back of increased demand for crude oil. Oil exploration and
production (E&P) activity has a positive correlation with crude oil prices. We believe the firm
oil price in conjunction with depleting resources and growing demand would require oil majors
to go for incremental exploration activities.
CRISIL Research expects crude oil demand to clock 92.6 mn barrels per day (mbpd) in 2015
vs. 87.4 mbpd in 2010 at a CAGR of 1.2%. Demand growth will primarily be driven by
emerging economies such as China and India in the Asia Pacific, Saudi Arabia in the Middle
East and Brazil. However, with OD’s above 10.75’’ finding major applications in E&P activity
2.3
1.4
2.1
1.3
2.2
1.7
0.0
0.5
1.0
1.5
2.0
2.5
MSL ISMT
(ltpa)
FY09 FY10 FY11
OCTG & Projects, 24%
Auto & General
Engg, 15%
Others, 19%Power, 15%
Construction Equipments,
14%
Bearings, 13%
ISMT is the second largest
producer of seamless tubes in
India.
Only company in the domestic
sphere to be backward
integrated
CRISIL IERIndependentEquityResearch
4
and ISMT being in the sub 10.75’’ diameter, the benefits accrued from the same will be
limited.
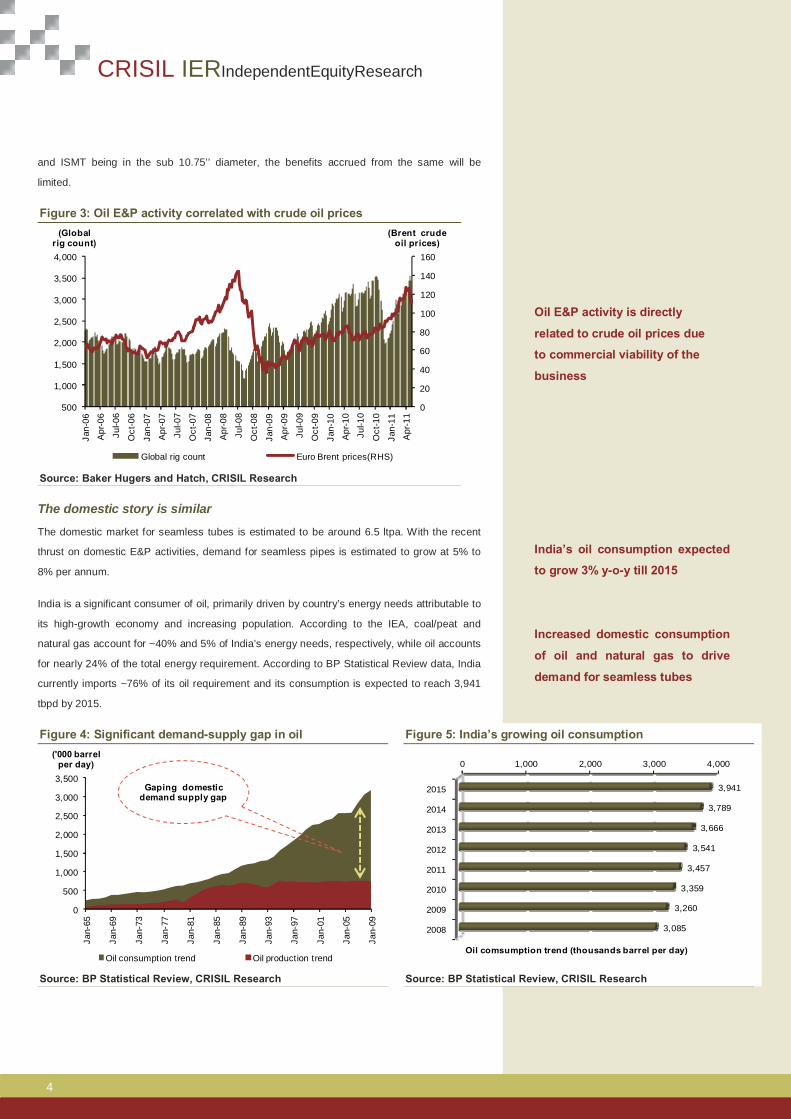
Figure 3: Oil E&P activity correlated with crude oil prices
Source: Baker Hugers and Hatch, CRISIL Research The domestic story is similar
The domestic market for seamless tubes is estimated to be around 6.5 ltpa. With the recent
thrust on domestic E&P activities, demand for seamless pipes is estimated to grow at 5% to
8% per annum.
India is a significant consumer of oil, primarily driven by country’s energy needs attributable to
its high-growth economy and increasing population. According to the IEA, coal/peat and
natural gas account for ~40% and 5% of India’s energy needs, respectively, while oil accounts
for nearly 24% of the total energy requirement. According to BP Statistical Review data, India
currently imports ~76% of its oil requirement and its consumption is expected to reach 3,941
tbpd by 2015.
Figure 4: Significant demand-supply gap in oil Figure 5: India’s growing oil consumption
Source: BP Statistical Review, CRISIL Research Source: BP Statistical Review, CRISIL Research
0
20
40
60
80
100
120
140
160
500
1,000
1,500
2,000
2,500
3,000
3,500
4,000
Jan-
06
Apr
-06
Jul-0
6
Oct
-06
Jan-
07
Apr
-07
Jul-0
7
Oct
-07
Jan-
08
Apr
-08
Jul-0
8
Oct
-08
Jan-
09
Apr
-09
Jul-0
9
Oct
-09
Jan-
10
Apr
-10
Jul-1
0
Oct
-10
Jan-
11
Apr
-11
(Brent crude oil prices)
(Global rig count)
Global rig count Euro Brent prices(RHS)
0
500
1,000
1,500
2,000
2,500
3,000
3,500
Jan-
65
Jan-
69
Jan-
73
Jan-
77
Jan-
81
Jan-
85
Jan-
89
Jan-
93
Jan-
97
Jan-
01
Jan-
05
Jan-
09
('000 barrel per day)
Oil consumption trend Oil production trend
Gaping domestic demand supply gap
0 1,000 2,000 3,000 4,000
2015
2014
2013
2012
2011
2010
2009
2008
3,941
3,789
3,666
3,541
3,457
3,359
3,260
3,085
Oil comsumption trend (thousands barrel per day)
Oil E&P activity is directly
related to crude oil prices due
to commercial viability of the
business
India’s oil consumption expected
to grow 3% y-o-y till 2015
Increased domestic consumption
of oil and natural gas to drive
demand for seamless tubes

MAKING MARK
ETS
FU
NC
TIO
NB
ET
TE
R
YEARS
5
ISMT Ltd
2. Huge capacity additions in power sector CRISIL Research expects capacity additions of 87 GW in the domestic power sector over
FY11-16, with coal-based capacities accounting for about 80%. With 90 tonnes of boiler tubes
required for setting up 1 MW of power plant, 7.8 MT (mn tonnes) of seamless tubes will be
required over FY11-16. Also, replacement demand coupled with increasing usage of premium
tubes (premium tubes comply with stringent environmental norms and are instrumental in
increasing the efficiency of power plants on the back of certain chemical properties, viz.,
corrosion resistance) will entail a huge demand for seamless tubes and will provide ISMT a
lucrative revenue potential. Figure 6: Power demand snapshot
Source: CEA, CRISIL Research 3. Strong growth in auto component industry CRISIL Research expects the auto component industry to grow by 14-16% over FY11-16.
Strong demand growth coupled with ISMT’s thrust on value-added products for the industry
viz., stabiliser bars, piston pins, steering linkages, clutch parts, airbag canisters, etc. augurs
well. Also, competitive delivery timelines will ensure a better positioning in the segment. Table 2: Size and growth of auto component industry
FY12E FY13E
Size (Rs bn) Growth Size (Rs bn) Growth Domestic consumption OEM 1,334 18% 1,516 14% Replacement 557 10% 624 12% Total 1,891 15% 2,140 26% Domestic production OEM 1,334 18% 1,516 14% Replacement 283 8% 299 6% Exports 221 23% 276 25% Total 1,838 17% 2,091 14%
Source: CRISIL Research
632
691
740
777
831
862
911
978
1,05
2
1,12
6
1,18
7
7%
9%
7%
5%
7%
4%
6%7%
8%7%
5%
0%
2%
4%
6%
8%
10%
0
200
400
600
800
1,000
1,200
1,400
2005
-06
2006
-07
2007
-08
2008
-09
2009
-10
2010
-11
2011
-12
P
2012
-13
P
2013
-14
P
2014
-15
P
2015
-16
P
(%)(Bn units)
Demand YoY Growth (RHS)
CAGR: 6.4%
CAGR: 6.6%
87 GW of domestic power
capacity addition over FY11-16
to result in demand for 7.8 MT
of seamless tubes
Strong growth in the auto
component industry to aid
demand for seamless tubes
CRISIL IERIndependentEquityResearch
6
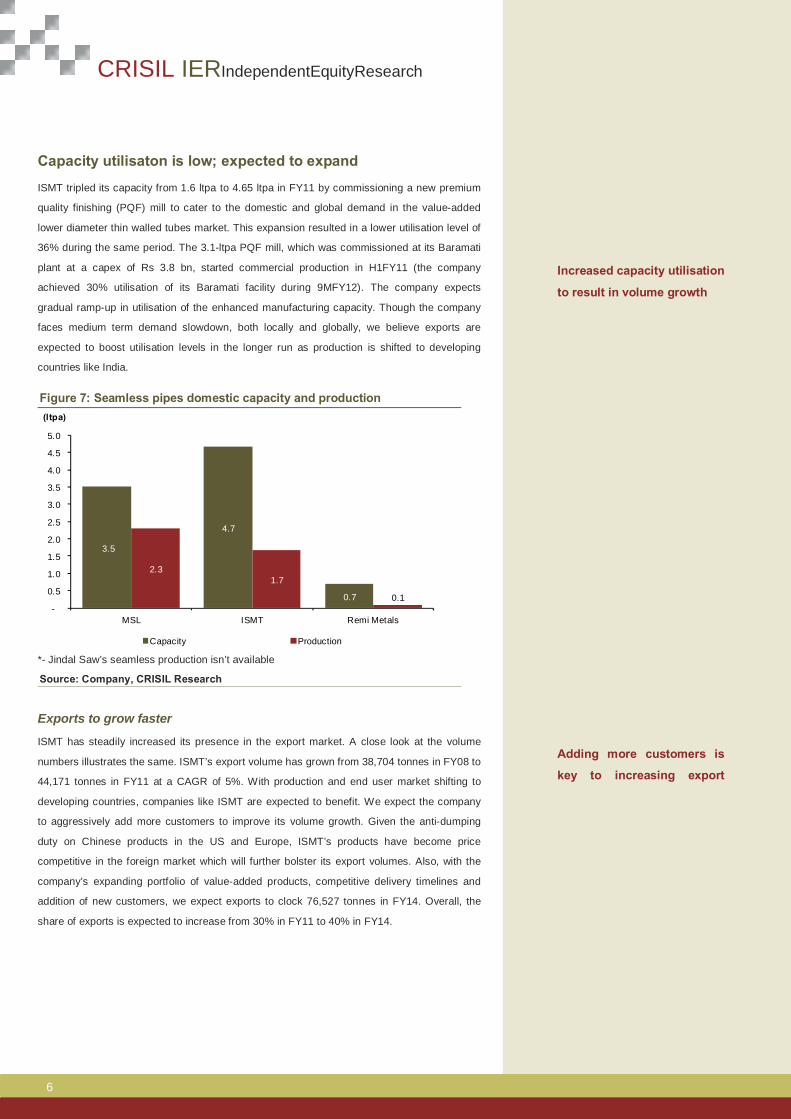
Capacity utilisaton is low; expected to expand
ISMT tripled its capacity from 1.6 ltpa to 4.65 ltpa in FY11 by commissioning a new premium
quality finishing (PQF) mill to cater to the domestic and global demand in the value-added
lower diameter thin walled tubes market. This expansion resulted in a lower utilisation level of
36% during the same period. The 3.1-ltpa PQF mill, which was commissioned at its Baramati
plant at a capex of Rs 3.8 bn, started commercial production in H1FY11 (the company
achieved 30% utilisation of its Baramati facility during 9MFY12). The company expects
gradual ramp-up in utilisation of the enhanced manufacturing capacity. Though the company
faces medium term demand slowdown, both locally and globally, we believe exports are
expected to boost utilisation levels in the longer run as production is shifted to developing
countries like India. Figure 7: Seamless pipes domestic capacity and production
*- Jindal Saw’s seamless production isn’t available
Source: Company, CRISIL Research
Exports to grow faster
ISMT has steadily increased its presence in the export market. A close look at the volume
numbers illustrates the same. ISMT’s export volume has grown from 38,704 tonnes in FY08 to
44,171 tonnes in FY11 at a CAGR of 5%. With production and end user market shifting to
developing countries, companies like ISMT are expected to benefit. We expect the company
to aggressively add more customers to improve its volume growth. Given the anti-dumping
duty on Chinese products in the US and Europe, ISMT’s products have become price
competitive in the foreign market which will further bolster its export volumes. Also, with the
company’s expanding portfolio of value-added products, competitive delivery timelines and
addition of new customers, we expect exports to clock 76,527 tonnes in FY14. Overall, the
share of exports is expected to increase from 30% in FY11 to 40% in FY14.
3.5
4.7
0.7
2.31.7
0.1-
0.5
1.0
1.5
2.0
2.5
3.0
3.5
4.0
4.5
5.0
MSL ISMT Remi Metals
(ltpa)
Capacity Production
Adding more customers is
key to increasing export
Increased capacity utilisation
to result in volume growth

MAKING MARK
ETS
FU
NC
TIO
NB
ET
TE
R
YEARS
7
ISMT Ltd
Figure 8: Geographical break-down of tube volume
Source: Company, CRISIL Research
The company has produced 0.8 ltpa of seamless tubes in H1FY12 and we expect production
to reach 1.86 ltpa (H2 expected to fare better than H1) in FY12, 2.09 ltpa in FY13 and 2.19
ltpa in FY14, at a utilisation rate of 40%, 45% and 47%, respectively. This will result in sales
volume growing at a CAGR of 9.3% from FY11 to FY14.
Figure 9: Volume growth to play out
Source: Company, CRISIL Research
Power plant, process improvement to boost margins We believe that the commissioning of the captive power plant (CPP) coupled with optimisation
of its various processes will result in margin expansion from an expected 14.1% in FY12 to
15.3% in FY14.
CPP to reduce power cost
ISMT is in the process of commissioning its CPP of 40 MW capacity in Chandrapur,
Maharashtra in FY13 at an estimated cost of Rs 2.1 bn. Grid synchronisation for the same has
already happened in January 2012. The power plant is expected to produce ~175 MU and
72%67%
79%
70%65%
60% 60%
28%33%
21%
30%35%
40% 40%
0%
10%
20%
30%
40%
50%
60%
70%
80%
90%
FY08 FY09 FY10 FY11 FY12E FY13E FY14E
(%)
Domestic Exports
92%86%
36% 40% 45% 47%
0%
10%
20%
30%
40%
50%
60%
70%
80%
90%
100%
0.0
0.5
1.0
1.5
2.0
2.5
3.0
3.5
4.0
4.5
5.0
FY09 FY10 FY11 FY12E FY13E FY14E
(%)(ltpa)
Capacity Production Utilisation (RHS)
Anti-dumping duty on
Chinese products in the USA
and Europe provides
potential for export volume
expansion
Benefit of CPP to accrue from
FY13

CRISIL IERIndependentEquityResearch
8
245 MU of power operating at 50% and 70% PLF in FY13 and FY14 respectively. In FY11,
the average price for procuring grid power was Rs 5.85 per unit. With the rates having
appreciated by 11% in H1FY12, we believe after the commissioning of the plant in Q1FY13,
the average power generation cost is expected to be close to Rs 5 per unit in FY13 (having
factored in coal procurement at Rs 4,000-4,500 per tonne and total coal requirement of
0.2-0.3 mn tonnes). We believe this will translate into cost savings of Rs 385 mn and
Rs 516 mn for FY13 and FY14 respectively. Though ISMT has already applied for coal
linkage, given the shortage of linkage coal for major power utilities, we believe the company
has to resort to e-auction and imported coal to meet its requirement. Table 3: CPP commissioning to result in power savings
FY11 FY12E FY13E FY14E Total units consumed (MU) 285 315 341 360 Rate per unit - external (A) (Rs) 5.9 6.5 6.7 6.8 Total cost (Rs mn) 1,667 2,050 2,284 2,456 Power plant capacity (MW) 40 40 PLF 50% 70% MU generated (B) 175 245 Cost/unit (C) 4.5 4.7 Savings = (A-C)*B (Rs mn) 385 516
Source: Company, CRISIL Research
New PQF mill to optimise manufacturing process
The company currently operates two mills - Assel and PQF. The former is used to
manufacture tubes in the OD (outer diameter) range of 168-273 mm while the latter is
employed for OD lower than 168 mm. The PQF mill, which was commissioned by the
company in FY11, will enable it to cater to the niche market while resulting in cost savings.
Also, this expansion has been awarded the “Mega Project” status by the state government
making ISMT eligible for fiscal benefits ( involves sales tax and electricity duty exemption for
production from the new PQF mill) of up to Rs 2 bn over a period of seven years from the date
of commencement of production. The new mill will help thus:
• Expand the addressable market with the capability to produce small diameter thin-walled
tubes with OD of 38 mm and wall thickness of 3.2 mm.
• Lower costs resulting from elimination of upstream and downstream processes and
improved economies of scale to result in cost savings of ~Rs 2,000/ tonne.
• Cast billets of standard diameter can be used as inputs in the mill instead of rolled billets
of varying diameters, resulting in elimination of process of rolling billets, which will result in
cost savings to the tune of Rs 1,500/tonne.
• Ability to produce longer length tubes and less redundant deformation, to result in lower
wastages.
As a result, we estimate potential average cost saving of Rs 3,500-3,700 per tonne on tube
processing on the back of improved capacity utilization, the benefit of which is expected to be
partially passed on to its customers.
PQF mill to increase the size of
addressable market available to
the company, in addition to
potential cost savings
MAKING MARK
ETS
FU
NC
TIO
NB
ET
TE
R
YEARS
9
ISMT Ltd
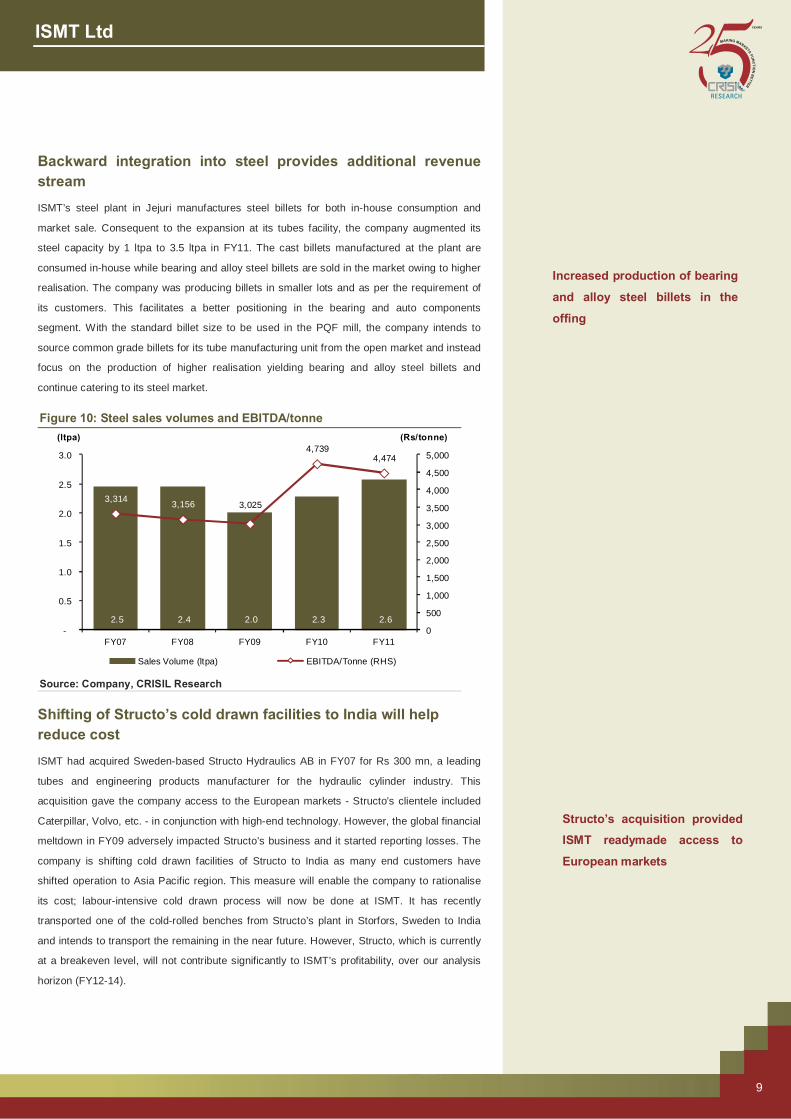
Backward integration into steel provides additional revenue stream ISMT’s steel plant in Jejuri manufactures steel billets for both in-house consumption and
market sale. Consequent to the expansion at its tubes facility, the company augmented its
steel capacity by 1 ltpa to 3.5 ltpa in FY11. The cast billets manufactured at the plant are
consumed in-house while bearing and alloy steel billets are sold in the market owing to higher
realisation. The company was producing billets in smaller lots and as per the requirement of
its customers. This facilitates a better positioning in the bearing and auto components
segment. With the standard billet size to be used in the PQF mill, the company intends to
source common grade billets for its tube manufacturing unit from the open market and instead
focus on the production of higher realisation yielding bearing and alloy steel billets and
continue catering to its steel market. Figure 10: Steel sales volumes and EBITDA/tonne
Source: Company, CRISIL Research
Shifting of Structo’s cold drawn facilities to India will help reduce cost ISMT had acquired Sweden-based Structo Hydraulics AB in FY07 for Rs 300 mn, a leading
tubes and engineering products manufacturer for the hydraulic cylinder industry. This
acquisition gave the company access to the European markets - Structo’s clientele included
Caterpillar, Volvo, etc. - in conjunction with high-end technology. However, the global financial
meltdown in FY09 adversely impacted Structo’s business and it started reporting losses. The
company is shifting cold drawn facilities of Structo to India as many end customers have
shifted operation to Asia Pacific region. This measure will enable the company to rationalise
its cost; labour-intensive cold drawn process will now be done at ISMT. It has recently
transported one of the cold-rolled benches from Structo’s plant in Storfors, Sweden to India
and intends to transport the remaining in the near future. However, Structo, which is currently
at a breakeven level, will not contribute significantly to ISMT’s profitability, over our analysis
horizon (FY12-14).
2.5 2.4 2.0 2.3 2.6
3,314 3,156 3,025
4,7394,474
0
500
1,000
1,500
2,000
2,500
3,000
3,500
4,000
4,500
5,000
-
0.5
1.0
1.5
2.0
2.5
3.0
FY07 FY08 FY09 FY10 FY11
(Rs/tonne)(ltpa)
Sales Volume (ltpa) EBITDA/Tonne (RHS)
Structo’s acquisition provided
ISMT readymade access to
European markets
Increased production of bearing
and alloy steel billets in the
offing

CRISIL IERIndependentEquityResearch
10
Exports provide natural hedge to its forex exposure
Export revenues in US dollar and Euro provide a natural hedge to the overseas raw material
sourcing for the company as well as debt installment and interest on foreign loans. Exports
accounted for ~30% of the tube sales volumes and Rs 3.28 bn in FY11. Going forward, we
believe that with increased penetration of Indian players on the back of anti-dumping duty on
Chinese equipment, the company’s export sale volumes will clock 35% and 40% of the total
tube sales volume in FY12 and FY13, respectively. Table 4: Foreign currency exposure
$ mn FY11 FY12E FY13E FY14E Net foreign currency inflow 10 12 15 17 Principal+Interest Outgo 20 20 20 20
Source: Company, CRISIL Research
The company’s exports provide a natural hedge for its raw material sourcing. However,
depreciation of the Indian rupee will result in ISMT reporting mark-to-market losses of
~Rs 498 mn in FY12 (assumption is based on 1USD= Rs 48) on the back of its unhedged
exposure to foreign currency loan.
Raw material price volatilities + Chinese competition ⇒ margin pressure to continue The company uses scrap (50%), pig iron (20%), DRI (Direct Reduced Iron) (20%) and others
(10%) as raw materials for its steel plant in Jejuri. It sources pig iron and DRI from Sesa Goa
and Welspun Ltd, while it imports scrap. Since raw material is a significant part of the cost
structure (~53% of sales in FY11), any upward price movement is bound to result in margin
erosion.
The anti-dumping duty in the US and Europe has resulted in aggressive dumping of seamless
tubes by Chinese players in India. This has resulted in increased competition and has
impacted profitability. However, ISMT’s move to add CPP and process improvement through
the PQF mill will help it increase its overall margins.

MAKING MARK
ETS
FU
NC
TIO
NB
ET
TE
R
YEARS
11
ISMT Ltd
Figure 11: EBITDA per tonne for tubes segment
Source: Company, CRISIL Research
Capacity expansion by MSL to result in increased competition in the near term Maharashtra Seamless Ltd (MSL) is ISMT’s major competitor in the seamless tubes space.
However, MSL primarily caters to the higher OD of more than 10 inches, which finds
applications in the E&P activity. MSL is adding 2 ltpa capacity to its existing capacity of 3.5
ltpa which is expected to be operational by Q2FY13. The 2 ltpa plant was acquired on an
asset purchase basis from Romania at a total cost (including set-up costs) of Rs 3 bn. With its
new capacity, MSL will be able to manufacture seamless pipes up to 7 inches, which finds
application in the shale gas exploration and production. Given the production facility to
manufacture tubes up to 7 inches, we believe MSL will enter into ISMT’s domain resulting in
increased competition in the domestic market. ISMT vs. MSL
Particulars ISMT MSL Capacity Seamless tubes: 4.65 ltpa Seamless tubes: 3.5 ltpa; ERW pipes ( 6''- 20'' OD): 2 ltpa
Capacity expansion plans
None 2 ltpa
Seamless End markets
Diversified portfolio with an exposure to segments like oil exploration and drilling (24%), boiler in power generation units (15%), construction equipment (14%), bearing and alloy steel (13%) and auto and general engineering (15%)
Primary focus on OCTG segment (~60%)
Clientele Hydrocarbon and process industry: IOCL, BPCL, HPCL, EIL, RPL, MRPL, BRPL, CPCL Power: BHEL, BGR Energy Systems, Thermax Bearings: FAG Bearings, NRB Bearings Auto: TATA Motors, Komatsu, Rani Madras, Force Motors Construction equipment and mining: Wipro Ltd, Sandvick Asia, BEML
Oil and gas: ONGC, OIL, GAIL, RIL, Indraprastha Gas, Cairn Energy, Mahanagar Gas Ltd, British Gas (India) Hydrocarbon and process Industry: IOCL, HPCL, BPCL, EIL, RPL, MRPL, BRPL, CPCL Automotive industry: Bajaj Auto, LML, Mahindra & Mahindra, Telco, Scooter India
Source: Company, CRISIL Research
11,317 10,419
12,303
6,345
10,796 10,400 11,000
11,550
-
2,000
4,000
6,000
8,000
10,000
12,000
14,000
FY07 FY08 FY09 FY10 FY11 FY12E FY13E FY14E
(Rs/tonne)
EBITDA/Tonne
EBITDA/tonne dropped
significantly in FY10 on
account of loss reported at
EBITDA level by Structo

CRISIL IERIndependentEquityResearch
12
Peer comparison: ISMT enjoys better realisations but lower margins MSL is the largest manufacturer of seamless tubes followed by ISMT. MSL primarily caters to
the higher OD of more than 10 inches, which enjoys higher margins, though the end-user
market is mainly oil and gas. On the other hand, ISMT’s focus on value-added products
enables it to garner higher realisations than its competitors. The company’s EBITDA margin is
lower than that of MSL due to the latter’s presence in higher diameter tubes and better
operational efficiency. Higher interest cost on account of capital expenditure funded through
substantial debt has resulted in subdued PAT margins for ISMT. On account of revaluation of
its assets in FY10, the asset turnover and return ratios of MSL dropped from 7.5x in FY09 to
2.5x in FY10. Return ratios are lower due to competition pressure and lower utilisation levels. Table 5: Peer comparison: Seamless tubes and pipes
MSL ISMT
Rs mn FY07 FY08 FY09 FY10 FY11 FY07 FY08 FY09 FY10 FY11 Capacity (seamless tubes- ltpa) 3.5 3.5 3.5 3.5 3.5 1.6 1.6 1.6 1.6 4.7 CU 65% 70% 64% 58% 65% 102% 103% 92% 86% 36% Revenues 13,994 15,104 20,776 16,146 17,153 10,658 13,682 14,522 12,691 17,449 Sales Realisation 52,081 49,849 50,023 72,641 57,636 67,124 76,704 67,309 74,668 67,124
MSL ISMT
Cost (as a % of sales) FY07 FY08 FY09 FY10 FY11 FY07 FY08 FY09 FY10 FY11 Raw material cost 64% 67% 69% 62% 64% 53% 54% 53% 52% 52% Employee cost 1.2% 1.5% 1.2% 1.7% 1.8% 4.8% 8.2% 8.9% 9.2% 7.1% Power and fuel cost 6.6% 7.2% 6.3% 6.8% 8.4% 12.9% 13.1% 12.3% 17.3% 16.5%
MSL ISMT
Key ratios FY07 FY08 FY09 FY10 FY11 FY07 FY08 FY09 FY10 FY11 EBITDA Margin (%) 25.1 21.1 17.9 26.2 22.4 23.1 16.9 16.7 14.8 16.3 EBITDA/Tonne (Rs/tonne) 13,295 12,229 14,882 16,450 17,971 11,317 10,419 12,303 6,345 10,796 Debt-equity Ratio (x) 0.12 0.09 0.06 0.04 0.03 2.2 1.8 2.4 2.1 2.1 Adj PAT margin (%) 16.7 12.9 12.5 17.6 16.6 9.0 7.4 2.9 3.8 4.8 Asset turnover ratio (x) 5.1 5.5 7.5 2.5 1.7 1.3 1.7 1.9 1.7 1.8 RoE (%) 35.0 19.3 21.6 15.8 11.8 22.9 22.2 8.1 9.1 14.6
Source: Company, Prowess, CRISIL Research
ISMT’s net working capital days appear to be on the lower side owing to its highest creditor
days; the company converts its import obligation to buyer’s credit. Table 6: Working capital days comparison
Inventory days Debtor days Creditor days
FY09 FY10 FY11 FY09 FY10 FY11 FY09 FY10 FY11 ISMT Ltd 116 137 128 51 76 82 108 161 181
Maharashtra Seamless 101 164 174 45 49 47 96 54 88
Source: Company, Prowess, CRISIL Research

MAKING MARK
ETS
FU
NC
TIO
NB
ET
TE
R
YEARS
13
ISMT Ltd
Key risks
Global slowdown = low demand, realisations With the global economic slowdown exacerbating in future, ISMT’s volumes and realisations
will be adversely impacted. ISMT derives a sizeable portion of its revenues from exports
(~20% of total sales) and any unfavourable demand scenario will lead to lower export
revenues and, hence, a reduced topline.
Delay in ramping-up production, CPP commissioning Delay in addition of new customers would lead to lower volume growth than projected. Also, a
delay in commissioning and stabilisation of the power plant coupled with a delay in securing
linkage coal will result in lower savings and, hence, lower margins.
Reduced export incentives = margin erosion
The new DEPB (Duty Entitlement Pass Book) scheme introduced by the Indian government
during FY12 has lowered the incentives on export sales. Any further reduction/absence of
such incentives coupled with slackening global demand will result in margin erosion for the
company.
Anti-dumping duty on Chinese products in India The levying of anti-dumping duty on Chinese products in India, which is absent, will provide a
huge upside potential for the company to significantly improve its utilisation level. The
company along with other industry participants has also applied for a safeguard duty which is
under consideration by the government.
CRISIL IERIndependentEquityResearch
14
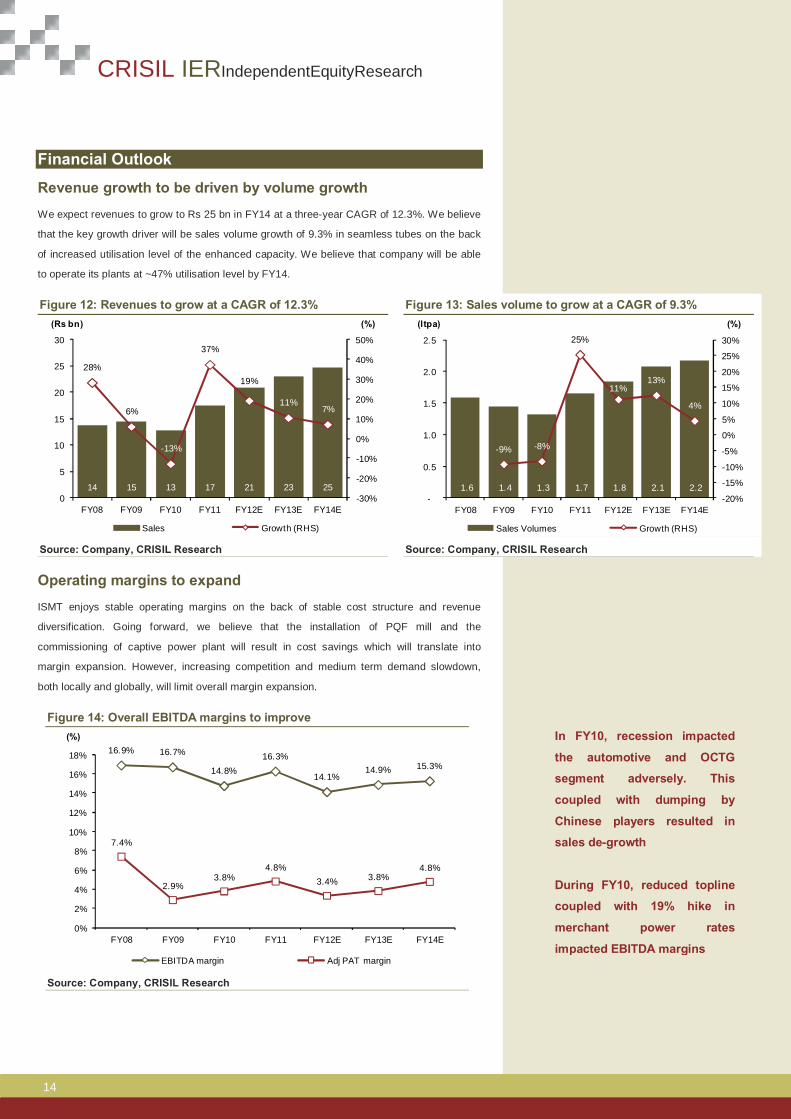
Financial Outlook
Revenue growth to be driven by volume growth We expect revenues to grow to Rs 25 bn in FY14 at a three-year CAGR of 12.3%. We believe
that the key growth driver will be sales volume growth of 9.3% in seamless tubes on the back
of increased utilisation level of the enhanced capacity. We believe that company will be able
to operate its plants at ~47% utilisation level by FY14. Figure 12: Revenues to grow at a CAGR of 12.3% Figure 13: Sales volume to grow at a CAGR of 9.3%
Source: Company, CRISIL Research Source: Company, CRISIL Research
Operating margins to expand ISMT enjoys stable operating margins on the back of stable cost structure and revenue
diversification. Going forward, we believe that the installation of PQF mill and the
commissioning of captive power plant will result in cost savings which will translate into
margin expansion. However, increasing competition and medium term demand slowdown,
both locally and globally, will limit overall margin expansion.
Figure 14: Overall EBITDA margins to improve
Source: Company, CRISIL Research
14 15 13 17 21 23 25
28%
6%
-13%
37%
19%
11%7%
-30%
-20%
-10%
0%
10%
20%
30%
40%
50%
0
5
10
15
20
25
30
FY08 FY09 FY10 FY11 FY12E FY13E FY14E
(%)(Rs bn)
Sales Growth (RHS)
1.6 1.4 1.3 1.7 1.8 2.1 2.2
-9% -8%
25%
11%13%
4%
-20%
-15%
-10%
-5%
0%
5%
10%
15%
20%
25%
30%
-
0.5
1.0
1.5
2.0
2.5
FY08 FY09 FY10 FY11 FY12E FY13E FY14E
(%)(ltpa)
Sales Volumes Growth (RHS)
16.9% 16.7%
14.8%16.3%
14.1%14.9% 15.3%
7.4%
2.9%3.8%
4.8%3.4% 3.8%
4.8%
0%
2%
4%
6%
8%
10%
12%
14%
16%
18%
FY08 FY09 FY10 FY11 FY12E FY13E FY14E
(%)
EBITDA margin Adj PAT margin
In FY10, recession impacted
the automotive and OCTG
segment adversely. This
coupled with dumping by
Chinese players resulted in
sales de-growth
During FY10, reduced topline
coupled with 19% hike in
merchant power rates
impacted EBITDA margins
MAKING MARK
ETS
FU
NC
TIO
NB
ET
TE
R
YEARS
15
ISMT Ltd
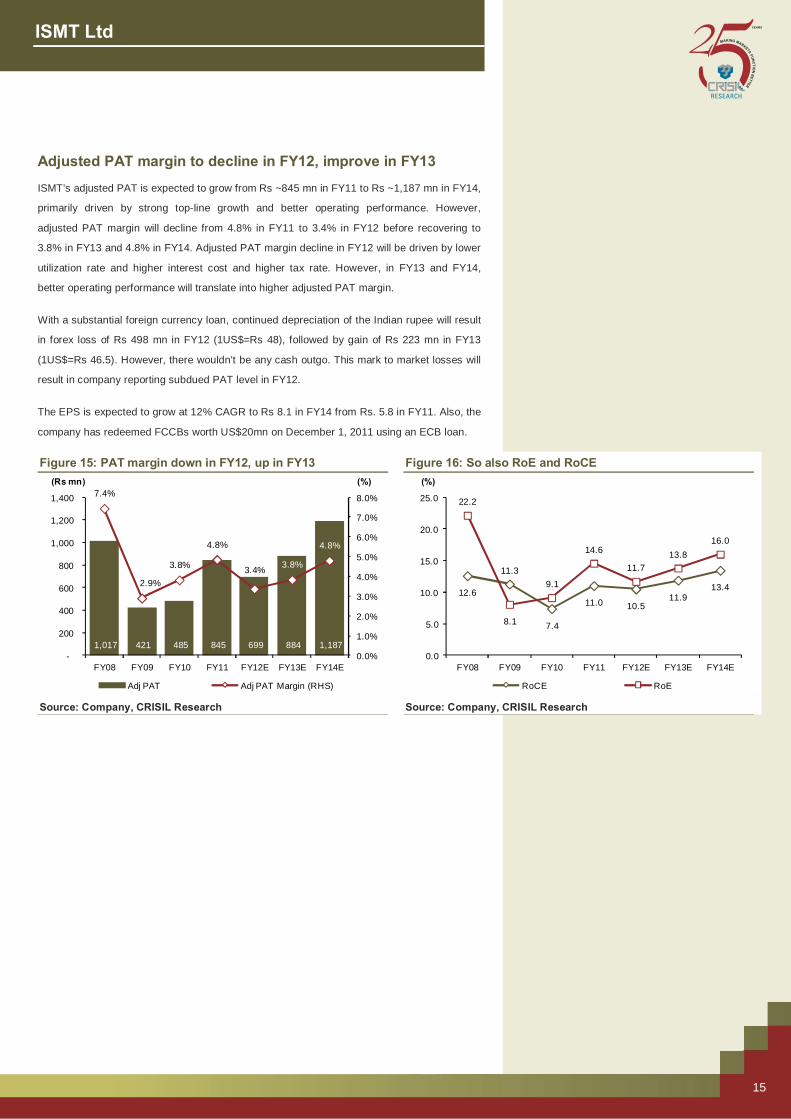
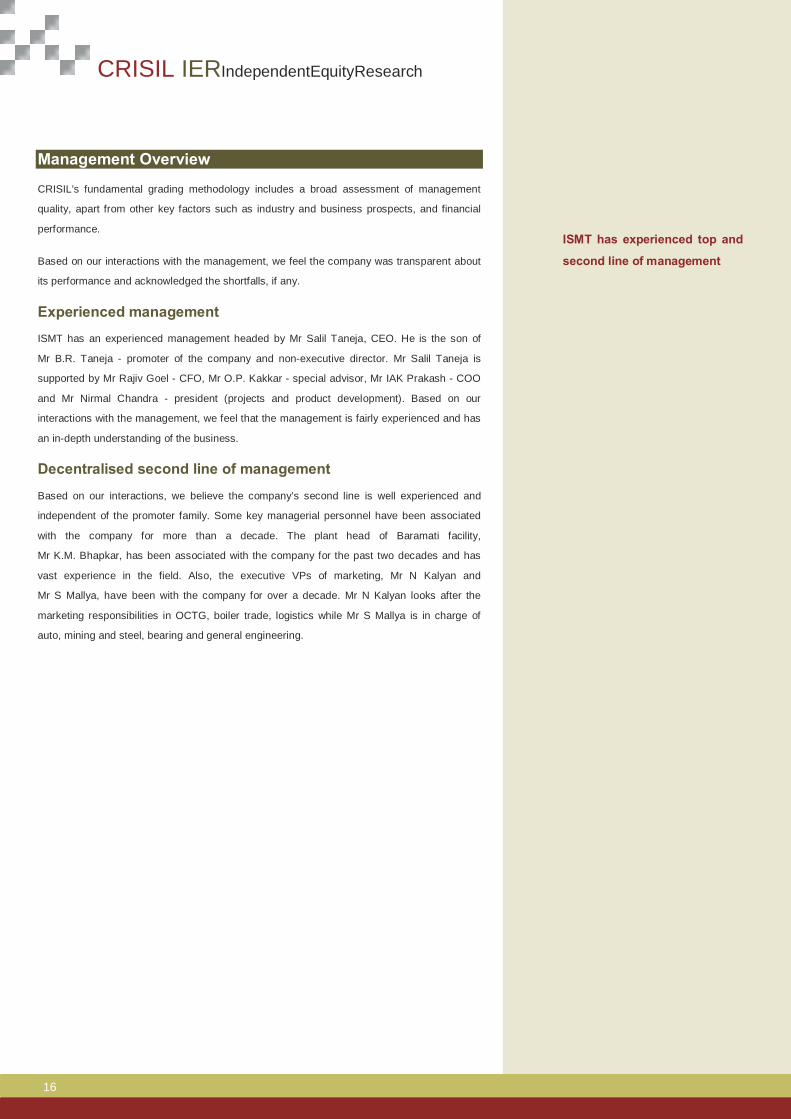
Adjusted PAT margin to decline in FY12, improve in FY13
ISMT’s adjusted PAT is expected to grow from Rs ~845 mn in FY11 to Rs ~1,187 mn in FY14,
primarily driven by strong top-line growth and better operating performance. However,
adjusted PAT margin will decline from 4.8% in FY11 to 3.4% in FY12 before recovering to
3.8% in FY13 and 4.8% in FY14. Adjusted PAT margin decline in FY12 will be driven by lower
utilization rate and higher interest cost and higher tax rate. However, in FY13 and FY14,
better operating performance will translate into higher adjusted PAT margin.
With a substantial foreign currency loan, continued depreciation of the Indian rupee will result
in forex loss of Rs 498 mn in FY12 (1US$=Rs 48), followed by gain of Rs 223 mn in FY13
(1US$=Rs 46.5). However, there wouldn’t be any cash outgo. This mark to market losses will
result in company reporting subdued PAT level in FY12.
The EPS is expected to grow at 12% CAGR to Rs 8.1 in FY14 from Rs. 5.8 in FY11. Also, the
company has redeemed FCCBs worth US$20mn on December 1, 2011 using an ECB loan.
Figure 15: PAT margin down in FY12, up in FY13 Figure 16: So also RoE and RoCE
Source: Company, CRISIL Research Source: Company, CRISIL Research
1,017 421 485 845 699 884 1,187
7.4%
2.9%
3.8%
4.8%
3.4% 3.8%
4.8%
0.0%
1.0%
2.0%
3.0%
4.0%
5.0%
6.0%
7.0%
8.0%
-
200
400
600
800
1,000
1,200
1,400
FY08 FY09 FY10 FY11 FY12E FY13E FY14E
(%)(Rs mn)
Adj PAT Adj PAT Margin (RHS)
12.6
11.3
7.4
11.0 10.511.9
13.4
22.2
8.1
9.1
14.6
11.713.8
16.0
0.0
5.0
10.0
15.0
20.0
25.0
FY08 FY09 FY10 FY11 FY12E FY13E FY14E
(%)
RoCE RoE
CRISIL IERIndependentEquityResearch
16
Management Overview
CRISIL's fundamental grading methodology includes a broad assessment of management
quality, apart from other key factors such as industry and business prospects, and financial
performance.
Based on our interactions with the management, we feel the company was transparent about
its performance and acknowledged the shortfalls, if any.
Experienced management ISMT has an experienced management headed by Mr Salil Taneja, CEO. He is the son of
Mr B.R. Taneja - promoter of the company and non-executive director. Mr Salil Taneja is
supported by Mr Rajiv Goel - CFO, Mr O.P. Kakkar - special advisor, Mr IAK Prakash - COO
and Mr Nirmal Chandra - president (projects and product development). Based on our
interactions with the management, we feel that the management is fairly experienced and has
an in-depth understanding of the business.
Decentralised second line of management
Based on our interactions, we believe the company’s second line is well experienced and
independent of the promoter family. Some key managerial personnel have been associated
with the company for more than a decade. The plant head of Baramati facility,
Mr K.M. Bhapkar, has been associated with the company for the past two decades and has
vast experience in the field. Also, the executive VPs of marketing, Mr N Kalyan and
Mr S Mallya, have been with the company for over a decade. Mr N Kalyan looks after the
marketing responsibilities in OCTG, boiler trade, logistics while Mr S Mallya is in charge of
auto, mining and steel, bearing and general engineering.
ISMT has experienced top and
second line of management

MAKING MARK
ETS
FU
NC
TIO
NB
ET
TE
R
YEARS
17
ISMT Ltd
Corporate Governance
CRISIL’s fundamental grading methodology includes a broad assessment of corporate
governance and management quality, apart from other key factors such as industry and
business prospects, and financial performance. In this context, CRISIL Research analyses the
shareholding structure, board composition, typical board processes, disclosure standards and
related-party transactions. Any qualifications by regulators or auditors also serve as useful
inputs while assessing a company’s corporate governance.
Overall, corporate governance at ISMT meets the minimum levels supported by reasonably
good board practices and involvement of an independent board.
Board composition
ISMT’s board consists of 10 members, of whom four are independent directors, which is in
line with the requirements under Clause 49 of SEBI’s listing guidelines. The board is chaired
by Mr S.C. Gupta who is a non-executive, independent director. Mr S.C. Gupta has worked as
CMD of Punjab National Bank and Indian Overseas Bank. The other independent directors:
• Mr K.K. Rai has held senior positions at Vijaya Bank and has also served as executive
director of Allahabad Bank.
• Mr Vinod Sethi has worked as managing director of Morgan Stanley Investment
Management, Inc, New York and currently runs his own investment firm.
• Mr V Gourishankar is an IDBI nominee on the board.
Board’s processes The company’s quality of disclosure can be considered good judged by the level of
information and details furnished in the annual report, websites and other publicly available
data. The company has all necessary committees in place to support corporate governance
practices. The audit committee is chaired by an independent director, Mr Vinod Sethi. The
committee meets at timely and regular intervals. The remuneration committee is chaired by
Mr K.K. Rai, another independent director.
Corporate governance
practices at ISMT conform to
regulatory requirement

CRISIL IERIndependentEquityResearch
18
Valuation Grade: 5/5
The tubes sector, especially seamless tubes, is heavily dependent on capital expenditure of
oil and gas, power, auto components and other end-user industries. As a result, sales volume,
capacity utilisation and price realisation for tube companies is volatile in nature. Additionally,
due to dependence on steel / steel-based products, which are its key raw material, any
fluctuations in the same results in volatility in margins of tube manufacturers. Thus, we believe
that P/E (price to earnings multiple) is the best method to value a tube company like ISMT.
Due to large over-capacities, especially in case of submerged arc welded (SAW) pipes, Indian
pipe manufacturing companies have been trading at a low PER. Since April 2009, large Indian
pipe manufacturers (excluding APL Apollo tubes) have traded at a median one-year forward
PER of between 4.6x and 9.7x. Though ISMT has traded at a higher multiple in the past
(median of last five years is 10x), we believe given the local overcapacity, competition and
demand slowdown in the medium term both locally and globally, and its ability to add new
customers will limit a significant ramp-up of its enhanced capacity. This will, in turn, limit
profitability expansion.
We assign P/E of 5x to ISMT’s FY14 EPS of Rs 8.1. We initiate coverage on ISMT with a one-
year fair value of Rs 40. Based on the current market price of Rs 26, we assign a valuation
grade of ‘5/5’ indicating that the market price has strong upside from current levels. At our fair
value, the implied EV/EBITDA for ISMT is 4.5x on FY14 earnings estimate. One-year forward P/E band One-year forward EV/EBITDA band
Source: NSE, CRISIL Research Source: NSE, CRISIL Research
0
20
40
60
80
100
120
140
160
Sep-
07
Dec
-07
Mar
-08
Jun-
08
Sep-
08
Dec
-08
Mar
-09
Jun-
09
Sep-
09
Dec
-09
Mar
-10
Jun-
10
Sep-
10
Dec
-10
Mar
-11
Jun-
11
Sep-
11
Dec
-11
Mar
-12
(Rs)
ISMT 4x 8x 12x 16x 20x
0
5,000
10,000
15,000
20,000
25,000
30,000
35,000
Sep-
07
Dec
-07
Mar
-08
Jun-
08
Sep-
08
Dec
-08
Mar
-09
Jun-
09
Sep-
09
Dec
-09
Mar
-10
Jun-
10
Sep-
10
Dec
-10
Mar
-11
Jun-
11
Sep-
11
Dec
-11
Mar
-12
(Rs mn)
EV 4x 6x 8x 10x

MAKING MARK
ETS
FU
NC
TIO
NB
ET
TE
R
YEARS
19
ISMT Ltd
P/E – premium / discount to NIFTY P/E movement
Source: NSE, CRISIL Research Source: NSE, CRISIL Research One-year forward PER trend for Indian seamless manufacturers
Source: NSE, CRISIL Research Peer comparison
Companies M.cap EBITDA Margin PAT Margin RoE (%) P/E (x)
(Rs mn) FY11 FY12E FY13E FY11 FY12E FY13E FY11 FY12E FY13E FY11 FY12E FY13E ISMT Ltd 3,809 16.3 14.1 14.9 4.8 3.4 3.8 14.6 11.7 13.8 4.2 5.4 4.3 Jindal Saw 47,414 18.7 13.6 14.9 9.7 6.1 7.3 na 8.3 11.8 12.8 14.1 9.3 Maharastra seamless 26,521 25.4 20.0 20.1 19.4 14.7 14.6 14.2 12.6 13.0 6.7 8.5 7.7 Global Peers Vallourec 5,971* 17.7 16.8 20.3 7.6 6.5 9.0 8.6 7.6 10.8 15.2 15.9 10.1 Tenaris 23,398** 24.6 26.2 27.1 13.4 14.8 15.6 13.1 14.0 14.1 16.4 13.6 12.3
*- in Euro, **- in USD
Source: CRISIL Research, Industry sources
-80%
-60%
-40%
-20%
0%
20%
40%
60%
Sep
-07
Dec
-07
Mar
-08
Jun-
08
Sep
-08
Dec
-08
Mar
-09
Jun-
09
Se p
-09
Dec
-09
Mar
-10
Jun-
10
Sep
-10
Dec
-10
Mar
-11
Jun-
11
Sep
-11
Dec
-11
Mar
-12
Premium/Discount to NIFTY Median premium/discount to NIFTY
0
5
10
15
20
25
30
35
40
Sep-
07
Dec
-07
Mar
-08
Jun-
08
Sep-
08
Dec
-08
Mar
-09
Jun-
09
Sep-
09
Dec
-09
Mar
-10
Jun-
10
Sep-
10
Dec
-10
Mar
-11
Jun-
11
Sep-
11
Dec
-11
Mar
-12
(Times)
1yr Fwd PE (x) Median PE
+1 std dev
-1 std dev
0
2
4
6
8
10
12
14
16
18
20
Sep-
08
Dec
-08
Mar
-09
Jun-
09
Sep-
09
Dec
-09
Mar
-10
Jun-
10
Sep-
10
Dec
-10
Mar
-11
Jun-
11
Sep-
11
Dec
-11
Mar
-12
(x)
Jindal Saw Maharashtra Seamless ISMT

CRISIL IERIndependentEquityResearch
20
Company Overview
ISMT is the second largest integrated manufacturer with the largest manufacturing capacity of
seamless tubes in India. It manufactures and supplies a wide range of seamless tubes
(38 mm to 279 mm OD). It also produces more than 330 grades of alloy bearing and carbon
steel. ISMT’s products are certified by the American Petroleum Institute (API). ISMT is
promoted by Baldev Raj Taneja, the promoter of Taneja Aerospace.
Figure 17: Seamless tubes capacity and production Figure 18: Steel capacity and production
Source: Company, CRISIL Research Source: Company, CRISIL Research Milestones
1980 The Indian Seamless Metal Tubes Ltd started operations. Commissioned first seamless tubes capacity of 15,000 tpa
1990 Added second mill and increased capacity 50,000 tpa
1995 Started Indian Seamless Steels and Alloys Ltd (ISSAL) to produce alloy steel, the raw material used for seamless tubes
2000 Acquired Kalyani Seamless tubes Ltd, with a capacity of 90,000 tpa
2005 The Indian Seamless Metal Tubes Ltd and Indian Seamless Steels and Alloys Ltd merged to form ISMT Ltd
2007 ISMT acquired Structo Hydraulics AB, based in Sweden
2010 Commissioned new PQF mill
2010 Steel capacity increased to 350,000 tpa
92%86%
36% 40% 45% 47%
0%
10%
20%
30%
40%
50%
60%
70%
80%
90%
100%
0.0
0.5
1.0
1.5
2.0
2.5
3.0
3.5
4.0
4.5
5.0
FY09 FY10 FY11 FY12E FY13E FY14E
(%)(ltpa)
Capacity Production Utilisation (RHS)
85%94%
99% 95%
81%
93%
73%
0%
20%
40%
60%
80%
100%
120%
0
50,000
100,000
150,000
200,000
250,000
300,000
350,000
400,000
2005 2006 2007 2008 FY09 FY10 FY11
(%)(tpa)
Capacity Production Utilisation (RHS)
MAKING MARK
ETS
FU
NC
TIO
NB
ET
TE
R
YEARS
21
ISMT Ltd
Annexure: Financials
Source: CRISIL Research
Income statement Balance Sheet(Rs mn) FY10 FY11 FY12E FY13E FY14E (Rs mn) FY10 FY11 FY12E FY13E FY14EOperating income 12,691 17,449 20,816 23,026 24,699 LiabilitiesEBITDA 1,873 2,838 2,942 3,424 3,768 Equity share capital 733 733 733 733 733 EBITDA margin 14.8% 16.3% 14.1% 14.9% 15.3% Reserves 4,892 5,251 5,239 6,107 7,262 Depreciation 615 864 947 1,094 1,121 Minorities - - - - - EBIT 1,258 1,974 1,995 2,330 2,647 Net worth 5,624 5,983 5,971 6,840 7,994 Interest 741 980 1,128 1,164 1,059 Convertible debt - - - - - Operating PBT 517 994 867 1,167 1,588 Other debt 11,557 12,628 13,428 13,028 11,528 Other income 45 59 66 61 61 Total debt 11,557 12,628 13,428 13,028 11,528 Exceptional inc/(exp) - (63) (498) 223 223 Deferred tax liability (net) 356 684 684 684 684 PBT 562 989 434 1,450 1,872 Total liabilities 17,538 19,295 20,083 20,551 20,206 Tax provision 77 208 233 344 462 AssetsMinority interest - - - - - Net f ixed assets 7,555 11,539 13,892 13,297 12,676 PAT (Reported) 485 781 201 1,107 1,410 Capital WIP 5,114 2,480 280 190 110 Less: Exceptionals - (63) (498) 223 223 Total fixed assets 12,668 14,018 14,171 13,487 12,786 Adjusted PAT 485 845 699 884 1,187 Investments - - - - -
Current assetsRatios Inventory 3,898 4,860 4,848 5,678 6,090
FY10 FY11 FY12E FY13E FY14E Sundry debtors 2,813 4,098 4,719 5,220 5,599 Growth Loans and advances 2,280 2,789 3,539 3,914 4,199 Operating income (%) (12.6) 37.5 19.3 10.6 7.3 Cash & bank balance 637 715 664 666 537 EBITDA (%) (22.8) 51.5 3.6 16.4 10.0 Marketable securities - - - - - Adj PAT (%) 15.2 74.2 (17.2) 26.4 34.3 Total current assets 9,628 12,461 13,769 15,477 16,424 Adj EPS (%) 15.2 74.2 (17.2) 26.4 34.3 Total current liabilities 5,101 7,570 8,242 8,799 9,390
Net current assets 4,528 4,891 5,526 6,679 7,034 Profitability Intangibles/Misc. expenditure 342 386 386 386 386 EBITDA margin (%) 14.8 16.3 14.1 14.9 15.3 Total assets 17,538 19,295 20,083 20,551 20,206 Adj PAT Margin (%) 3.8 4.8 3.4 3.8 4.8 RoE (%) 9.1 14.6 11.7 13.8 16.0 Cash flowRoCE (%) 7.4 11.0 10.5 11.9 13.4 (Rs mn) FY10 FY11 FY12E FY13E FY14ERoIC (%) 7.7 10.9 10.3 11.1 12.1 Pre-tax prof it 562 1,052 932 1,228 1,649
Total tax paid 126 120 (233) (344) (462) Valuations Depreciation 615 864 947 1,094 1,121 Price-earnings (x) 19.7 4.2 5.4 4.3 3.2 Working capital changes 240 (286) (686) (1,150) (484) Price-book (x) 1.7 0.6 0.6 0.6 0.5 Net cash from operations 1,543 1,751 960 828 1,824 EV/EBITDA (x) 10.9 5.4 5.6 4.7 3.9 Cash from investmentsEV/Sales (x) 1.6 0.9 0.8 0.7 0.6 Capital expenditure (1,333) (2,258) (1,100) (410) (420) Dividend payout ratio (%) 30.2 23.4 91.1 18.5 15.6 Investments and others 0 - - - - Dividend yield (%) 1.5 5.2 4.8 5.4 5.8 Net cash from investments (1,333) (2,258) (1,100) (410) (420)
Cash from financingB/S ratios Equity raised/(repaid) - - - - - Inventory days 137 128 104 111 112 Debt raised/(repaid) (368) 1,071 800 (400) (1,500) Creditors days 161 181 158 154 154 Dividend (incl. tax) (171) (213) (213) (238) (255) Debtor days 76 82 79 80 80 Others (incl extraordinaries) 313 (273) (498) 223 223 Working capital days 115 84 79 86 92 Net cash from financing (226) 585 89 (415) (1,532) Gross asset turnover (x) 1.1 1.2 1.1 1.1 1.2 Change in cash position (16) 78 (51) 2 (129) Net asset turnover (x) 1.7 1.8 1.6 1.7 1.9 Closing cash 637 715 664 666 537 Sales/operating assets (x) 1.0 1.3 1.5 1.7 1.9 Current ratio (x) 1.9 1.6 1.7 1.8 1.7 Quarterly financials (Standalone)Debt-equity (x) 2.1 2.1 2.2 1.9 1.4 (Rs mn) Q3FY11 Q4FY11 Q1FY12 Q2FY12 Q3FY12Net debt/equity (x) 1.9 2.0 2.1 1.8 1.4 Net Sales 3,886 4,929 4,716 5,122 4,645 Interest coverage 1.7 2.0 1.8 2.0 2.5 Change (q-o-q) -4% 27% -4% 9% -9%
EBITDA 668 632 694 693 536 Per share Change (q-o-q) -10% -5% 10% 0% -23%
FY10 FY11 FY12E FY13E FY14E EBITDA margin 17% 13% 15% 14% 12%Adj EPS (Rs) 3.3 5.8 4.8 6.0 8.1 PAT 146 170 186 105 18 CEPS 7.5 11.7 11.2 13.5 15.8 Adj PAT 142 201 207 229 87 Book value 38.4 40.8 40.8 46.7 54.6 Change (q-o-q) -16% 41% 3% 11% -62%Dividend (Rs) 1.0 1.2 1.3 1.4 1.5 Adj PAT margin 3.7% 4.1% 4.4% 4.5% 1.9%Actual o/s shares (mn) 146.5 146.5 146.5 146.5 146.5 Adj EPS 1.0 1.4 1.4 1.6 0.6
CRISIL IERIndependentEquityResearch
22
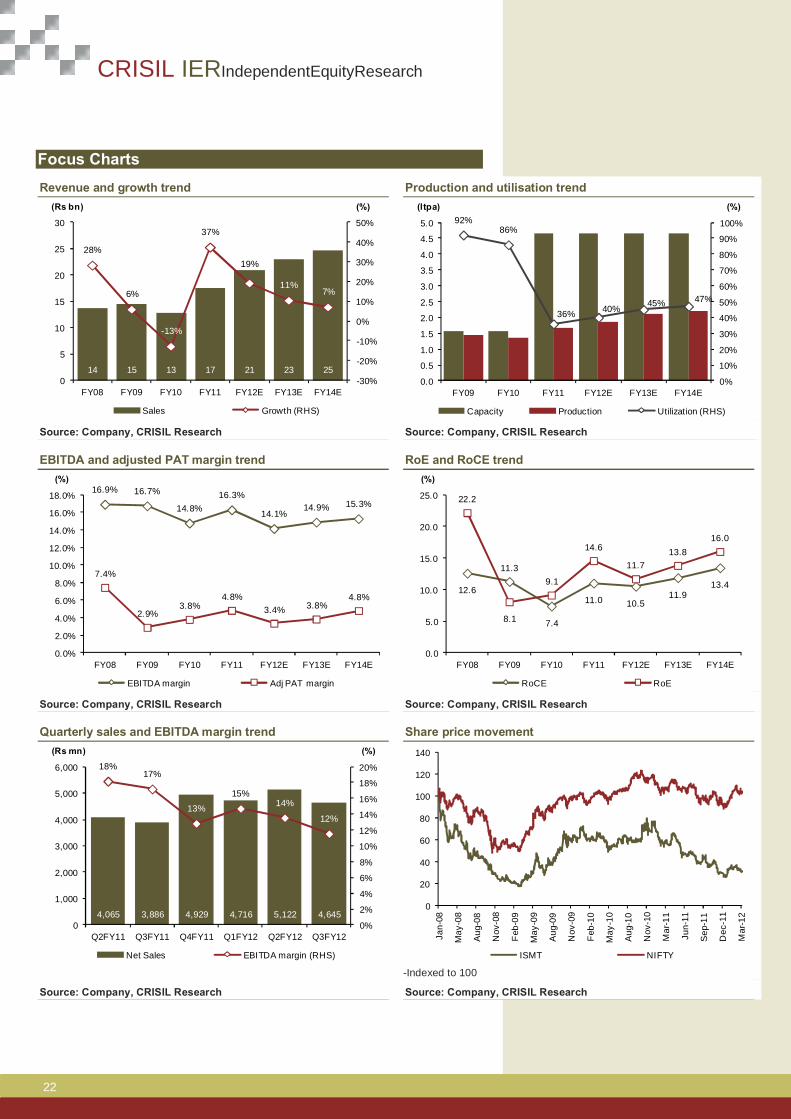
Focus Charts Revenue and growth trend Production and utilisation trend
Source: Company, CRISIL Research Source: Company, CRISIL Research
EBITDA and adjusted PAT margin trend RoE and RoCE trend
Source: Company, CRISIL Research Source: Company, CRISIL Research
Quarterly sales and EBITDA margin trend Share price movement
-Indexed to 100
Source: Company, CRISIL Research Source: Company, CRISIL Research
14 15 13 17 21 23 25
28%
6%
-13%
37%
19%
11%7%
-30%
-20%
-10%
0%
10%
20%
30%
40%
50%
0
5
10
15
20
25
30
FY08 FY09 FY10 FY11 FY12E FY13E FY14E
(%)(Rs bn)
Sales Growth (RHS)
92%86%
36% 40% 45% 47%
0%
10%
20%
30%
40%
50%
60%
70%
80%
90%
100%
0.0
0.5
1.0
1.5
2.0
2.5
3.0
3.5
4.0
4.5
5.0
FY09 FY10 FY11 FY12E FY13E FY14E
(%)(ltpa)
Capacity Production Utilization (RHS)
16.9% 16.7%
14.8%16.3%
14.1%14.9% 15.3%
7.4%
2.9%3.8%
4.8%3.4% 3.8%
4.8%
0.0%
2.0%
4.0%
6.0%
8.0%
10.0%
12.0%
14.0%
16.0%
18.0%
FY08 FY09 FY10 FY11 FY12E FY13E FY14E
(%)
EBITDA margin Adj PAT margin
12.6
11.3
7.4
11.0 10.511.9
13.4
22.2
8.1
9.1
14.6
11.713.8
16.0
0.0
5.0
10.0
15.0
20.0
25.0
FY08 FY09 FY10 FY11 FY12E FY13E FY14E
(%)
RoCE RoE
4,065 3,886 4,929 4,716 5,122 4,645
18%17%
13%
15%14%
12%
0%
2%
4%
6%
8%
10%
12%
14%
16%
18%
20%
0
1,000
2,000
3,000
4,000
5,000
6,000
Q2FY11 Q3FY11 Q4FY11 Q1FY12 Q2FY12 Q3FY12
(%)(Rs mn)
Net Sales EBITDA margin (RHS)
0
20
40
60
80
100
120
140
Jan-
08
May
-08
Aug
-08
Nov
-08
Feb
-09
May
-09
Aug
-09
Nov
-09
Feb
-10
May
-10
Aug
-10
Nov
-10
Mar
-11
Jun-
11
Sep
-11
Dec
-11
Mar
-12
ISMT NIFTY

MAKING MARK
ETS
FU
NC
TIO
NB
ET
TE
R
YEARS
This page intentionally left blank

CRISIL IERIndependentEquityResearch
CRISIL Research Team
Senior Director
Mukesh Agarwal +91 22 3342 3035 [email protected]
Analytical Contacts
Tarun Bhatia Director, Capital Markets +91 22 3342 3226 [email protected]
Prasad Koparkar Head, Industry & Customised Research +91 22 3342 3137 [email protected]
Chetan Majithia Head, Equities +91 22 3342 4148 [email protected]
Jiju Vidyadharan Head, Funds & Fixed Income Research +91 22 3342 8091 [email protected]
Ajay D'Souza Head, Industry Research +91 22 3342 3567 [email protected]
Ajay Srinivasan Head, Industry Research +91 22 3342 3530 [email protected]
Sridhar C Head, Industry Research +91 22 3342 3546 [email protected]
Manoj Mohta Head, Customised Research +91 22 3342 3554 [email protected]
Sudhir Nair Head, Customised Research +91 22 3342 3526 [email protected]
Business Development
Vinaya Dongre Head, Industry & Customised Research +91 22 33428025 [email protected]
Ashish Sethi Head, Capital Markets +91 22 33428023 [email protected]

MAKING MARK
ETS
FU
NC
TIO
NB
ET
TE
R
YEARS
Our Capabilities
Making Markets Function Better
Economy and Industry Research
▪ Largest team of economy and industry research analysts in India ▪ Coverage on 70 industries and 139 sub-sectors; provide growth forecasts, profitability analysis, emerging trends,
expected investments, industry structure and regulatory frameworks ▪ 90 per cent of India’s commercial banks use our industry research for credit decisions ▪ Special coverage on key growth sectors including real estate, infrastructure, logistics, and financial services ▪ Inputs to India’s leading corporates in market sizing, demand forecasting, and project feasibility ▪ Published the first India-focused report on Ultra High Net-worth Individuals ▪ All opinions and forecasts reviewed by a highly qualified panel with over 200 years of cumulative experience ▪ Largest independent equity research house in India, focusing on small and mid-cap companies; coverage
exceeds 100 companies ▪ Released company reports on all 1,401 companies listed and traded on the National Stock Exchange; a global
first for any stock exchange ▪ First research house to release exchange-commissioned equity research reports in India ▪ Assigned the first IPO grade in India
Funds and Fixed Income Research
▪ Largest and most comprehensive database on India’s debt market, covering more than 14,000 securities ▪ Largest provider of fixed income valuations in India ▪ Value more than Rs.33 trillion (USD 650 billion) of Indian debt securities, comprising 85 per cent of outstanding
securities ▪ Sole provider of fixed income and hybrid indices to mutual funds and insurance companies; we maintain 12
standard indices and over 80 customised indices ▪ Ranking of Indian mutual fund schemes covering 73 per cent of assets under management and Rs.5 trillion
(USD100 billion) by value ▪ Retained by India’s Employees’ Provident Fund Organisation, the world’s largest retirement scheme ▪ covering over 50 million individuals, for selecting fund managers and monitoring their performance
Equity and Company Research
▪ Largest independent equity research house in India, focusing on small and mid-cap companies; coverage exceeds 100 companies
▪ Released company reports on all 1,401 companies listed and traded on the National Stock Exchange; a global first for any stock exchange
▪ First research house to release exchange-commissioned equity research reports in India ▪ Assigned the first IPO grade in India
Our Office
Ahmedabad 706, Venus Atlantis Nr. Reliance Petrol Pump Prahladnagar, Ahmedabad, India Phone: +91 79 4024 4500 Fax: +91 79 2755 9863
Kolkata Horizon, Block 'B', 4th Floor 57 Chowringhee Road Kolkata - 700 071, India Phone: +91 33 2289 1949/50 Fax: +91 33 2283 0597
Bengaluru W-101, Sunrise Chambers, 22, Ulsoor Road, Bengaluru - 560 042, India Phone:+91 80 2558 0899
+91 80 2559 4802 Fax: +91 80 2559 4801
New Delhi The Mira, G-1, 1st Floor, Plot No. 1 & 2 Ishwar Nagar, Mathura Road, New Delhi - 110 065, India Phone: +91 11 4250 5100
+91 11 2693 0117/121 Fax: +91 11 2684 2212
Chennai Thapar House, 43/44, Montieth Road, Egmore, Chennai - 600 008, India Phone:+91 44 2854 6205/06
+91 44 2854 6093 Fax: +91 44 2854 7531
Pune 1187/17, Ghole Road, Shivaji Nagar, Pune - 411 005, India Phone: +91 20 2553 9064/67 Fax: +91 20 4018 1930
Hyderabad 3rd Floor, Uma Chambers Plot No. 9&10, Nagarjuna Hills, (Near Punjagutta Cross Road) Hyderabad - 500 482, India Phone: +91 40 2335 8103/05 Fax: +91 40 2335 7507
CRISIL Ltd is a Standard & Poor's company
CRISIL Limited CRISIL House, Central Avenue, Hiranandani Business Park, Powai, Mumbai – 400076. India Phone: +91 22 3342 3000 | Fax: +91 22 3342 8088 www.crisil.com