Crime in relation to urban design. Case study: The Greater ...
14
ARCHITECTURAL ENGINEERING Crime in relation to urban design. Case study: The Greater Cairo Region Heba Adel a , Mohamed Salheen a , Randa A. Mahmoud a,b, * a Ain Shams University, Department of Urban Planning, 1 El-Sarayyat Street, Abbasyah, Egypt b UFE ‘‘French University of EGYPT”, Department of Architecture, Sherouk City, Egypt Received 28 October 2014; revised 2 August 2015; accepted 30 August 2015 Available online 21 October 2015 KEYWORDS Crime occurrence; Built environment; Urban circumstances Abstract Crime is a part of any social system and known to human communities since its origins. It differs from community to another, even within one community it doesn’t occur equally in all places and nor by the same way. It is also concentrated in some places more than others, sometimes increases, sometimes decreases, etc. Previous researches have proved that crime rate has significant correlation with different social factors: education levels, poverty rates and lack of social organiza- tion, while others have drawn the attention to its relation with the built environment. They proposed that crime occurs in places where both opportunities and criminals are available. The role of this paper is to identify urban circumstances related to crime occurrence within the Greater Cairo Region, and to propose different ways to reduce these crimes. Consecutively, agglomeration’s main districts were scrutinized according to social analysis, street-network pattern and land-use. Ó 2015 Ain Shams University. Production and hosting by Elsevier B.V. This is an open access article under the CC BY-NC-ND license (http://creativecommons.org/licenses/by-nc-nd/4.0/). 1. Introduction This paper evolved from a master thesis ‘‘Crime and urban planning in Egypt” on the relationship between crime patterns within the Greater Cairo Region and different urban planning aspects, including both social and physical ones [1]. The objectives were to do the following: – Increase the awareness of the relationship between urban planning and crime occurrence and how to consider this in planning. – Investigate urban planning approaches in crime prevention. – Understand the relationship between crime patterns in Egypt and urban planning aspects. – Suggest possible urban planning precautions/considerations in order to help in crime prevention commensurate with the Egyptian environment. The study was bounded in several ways. Firstly, due to the wide scope of the study, it was not possible to conduct the analysis at all of the region’s districts; therefore, the main agglomeration districts were selected to be analyzed. Secondly, * Corresponding author at: Ain Shams University, Department of Urban Planning, 1 El-Sarayyat Street, Abbasyah, Egypt. Tel.: +20 1006688865. E-mail addresses: [email protected] (H. Adel), mohamed_ [email protected] (M. Salheen), [email protected] (R.A. Mahmoud). Peer review under responsibility of Ain Shams University. Production and hosting by Elsevier Ain Shams Engineering Journal (2016) 7, 925–938 Ain Shams University Ain Shams Engineering Journal www.elsevier.com/locate/asej www.sciencedirect.com http://dx.doi.org/10.1016/j.asej.2015.08.009 2090-4479 Ó 2015 Ain Shams University. Production and hosting by Elsevier B.V. This is an open access article under the CC BY-NC-ND license (http://creativecommons.org/licenses/by-nc-nd/4.0/).
Transcript of Crime in relation to urban design. Case study: The Greater ...

Ain Shams Engineering Journal (2016) 7, 925–938
Ain Shams University
Ain Shams Engineering Journal
www.elsevier.com/locate/asejwww.sciencedirect.com
ARCHITECTURAL ENGINEERING
Crime in relation to urban design. Case study:
The Greater Cairo Region
* Corresponding author at: Ain Shams University, Department of
Urban Planning, 1 El-Sarayyat Street, Abbasyah, Egypt. Tel.: +20
1006688865.
E-mail addresses: [email protected] (H. Adel), mohamed_
[email protected] (M. Salheen), [email protected]
(R.A. Mahmoud).
Peer review under responsibility of Ain Shams University.
Production and hosting by Elsevier
http://dx.doi.org/10.1016/j.asej.2015.08.0092090-4479 � 2015 Ain Shams University. Production and hosting by Elsevier B.V.This is an open access article under the CC BY-NC-ND license (http://creativecommons.org/licenses/by-nc-nd/4.0/).
Heba Adel a, Mohamed Salheen a, Randa A. Mahmoud a,b,*
aAin Shams University, Department of Urban Planning, 1 El-Sarayyat Street, Abbasyah, EgyptbUFE ‘‘French University of EGYPT”, Department of Architecture, Sherouk City, Egypt
Received 28 October 2014; revised 2 August 2015; accepted 30 August 2015Available online 21 October 2015
KEYWORDS
Crime occurrence;
Built environment;
Urban circumstances
Abstract Crime is a part of any social system and known to human communities since its origins.
It differs from community to another, even within one community it doesn’t occur equally in all
places and nor by the same way. It is also concentrated in some places more than others, sometimes
increases, sometimes decreases, etc. Previous researches have proved that crime rate has significant
correlation with different social factors: education levels, poverty rates and lack of social organiza-
tion, while others have drawn the attention to its relation with the built environment. They
proposed that crime occurs in places where both opportunities and criminals are available. The role
of this paper is to identify urban circumstances related to crime occurrence within the Greater Cairo
Region, and to propose different ways to reduce these crimes. Consecutively, agglomeration’s main
districts were scrutinized according to social analysis, street-network pattern and land-use.� 2015 Ain Shams University. Production and hosting by Elsevier B.V. This is an open access article under
the CC BY-NC-ND license (http://creativecommons.org/licenses/by-nc-nd/4.0/).
1. Introduction
This paper evolved from a master thesis ‘‘Crime and urbanplanning in Egypt” on the relationship between crime patternswithin the Greater Cairo Region and different urban planning
aspects, including both social and physical ones [1]. The
objectives were to do the following:
– Increase the awareness of the relationship between urban
planning and crime occurrence and how to consider thisin planning.
– Investigate urban planning approaches in crime prevention.– Understand the relationship between crime patterns in
Egypt and urban planning aspects.– Suggest possible urban planning precautions/considerationsin order to help in crime prevention commensurate with the
Egyptian environment.
The study was bounded in several ways. Firstly, due to the
wide scope of the study, it was not possible to conduct theanalysis at all of the region’s districts; therefore, the mainagglomeration districts were selected to be analyzed. Secondly,

926 H. Adel et al.
the study period has been identified by five-years starting from2004 till 2008 for the following reasons:
– The large number of urban crimes committed during thisperiod.
– Crime statistics are available starting from 2003 till 2008;
statistics before that period are difficult to obtain.– Last census (2006) took place in the middle of the selectedperiod; therefore, the resulting values can be considered as
an average of the five years of the study.– The proximity between the time of preparing the study, andthe study period itself; therefore, a true perception can begiven to the region during the study period.
Finally, the research studies crimes are only related to geog-raphy and linked to specific physical environment, including
the following:
a. Crimes against persons: homicide and attempted mur-
der, assaults including battery with serious injury ordeath, kidnapping, sexual harassment and rape.
b. Crimes against property: robbery, arson, housebreaking,
shoplifting, rusting and car theft.
2. Crime and the built environment
Earlier crime and crime prevention studies started in 1800s asthe industrial revolution changed the urban–rural relationshipand reshaped the urban structure; this change ultimatelycaused many social problems. Early sociologists focused on
how these social problems led to crime occurrence. It is worthmentioning that this concept continued until the early 1960s.In 1960s, researchers have drawn the attention to the relation
between the built environment and crime. Jane Jacob’s book‘‘The Death and Life of Great American Cities” [2] was the firstinfluential work to suggest that active street life could cut
down opportunities for crime. She focused on the role that‘‘eyes on the street” played in maintaining social control.Jacobs’ thesis was simple: people, not police, are the guardians
of the public space [3]. Her critique corresponded over thephysical design of urban America, which emphasized high riseapartment buildings separated by public space without anyspecific guardianship. Office areas became vacant after supper,
which led to a cessation of informal surveillance and to areduction in the sense of community among residents. Accord-ing to Jacobs, city streets were unsafe because they were
deserted [2]. She frequently cites New York City’s GreenwichVillage as an example of a vibrant urban community, andhow well-used streets were more likely to be safe from serious
crime. She found that natural surveillance was essential for thefeeling of safety and that could be achieved by increasing thenumber of people using a particular area through encouraginga diversity of uses and creating opportunities for positive social
interactions [2]. The early 1970s saw a surge of studies depend-ing on the previous work of Jane Jacobs. In 1971, Oscar New-man published a paper ‘‘Architectural Design for Crime
Prevention”, and in 1973 he published a book ‘‘DefensibleSpace, Crime Prevention through Urban Design” [4]. Heargued that an area is safer when people feel a sense of owner-
ship and responsibility for that part of a community. Newman
studied crime rates in low-income housing projects in NewYork City. He observed the development of an eleven story,2740-unit public housing complex, named ‘‘Pruitt-Igoe”. The
Pruitt-Igoe was supposed to be an ideal housing communityfor low-income families. The idea was to keep the groundsand the first floor free for community activity. Each building
was given communal corridors on every third floor to housea laundry, a communal room and a garbage room. The outsideareas of each building were also common areas. According to
Newman, because all the grounds and common areas were dis-associated from the units, residents could not feel the respon-sibility toward them and they became unsafe. The corridors,lobbies, elevators and stairs were dangerous places to walk,
they became covered with graffiti and littered with garbageand human waste, and women had to get together in groups.The project never achieved more than 60% occupancy. The
complex failed miserably and was demolished about 10 yearslater [4]. However, across the street from Pruitt-Igoe was anolder, smaller, row-house complex occupied by an identical
population called ‘‘Carr Square Village”. It remained fullyoccupied and trouble-free throughout the construction, occu-pancy, and the decline of Pruitt-Igoe. With the social variables
constant in the two developments, Newman began to look intowhat physical factors were different between the two com-plexes that would allow one complex to thrive while the otherhad to be torn down. One of the first things Newman looked at
was building type. He noticed that:
– In a single-family housing, everybody feels the responsibil-
ity for their place. Residents know who belongs to the area;streets and sidewalks are usually only traveled by neighbors,and therefore identifying strangers is possible.
– In walk-ups the number of people sharing the commonareas is limited, only 2 families, giving them a sense ofresponsibility for their place. It is also easy to identify stran-
gers due to the small number of residents.– In high-rises, residents do not feel responsible for any of thecommon areas since they are shared with so many others.They can’t identify strangers because of the amount of
people that use the space.
Newman studied also the social and physical factors that
create high crime rates. He found that the percentage of pop-ulation receiving welfare is shown to be the most importantfactor, followed by building height which in turn correlates
highly with the number of apartments sharing the entry to abuilding, as it affects the ability of residents to control theirenvironment. In addition, the size of the housing project andthe number of other projects in the area, as the larger low
income projects surrounded by other low income projectssuffer a higher crime rate than small or isolated projects [4].Thus, Newman found that the safest neighborhoods have the
following attributes:
1. Minimized common areas: the larger the number of people
who share a communal space, the more difficult it is forpeople to identify it or to feel they have a right to controlor determine the activity taking place within it.
2. Maximized private ownership: private yards were moredefensible because the owners could know whether or notsomeone belonged to their yards.

GCR LimitsAgglomeration districts Limits
Figure 1 Agglomeration districts classification. Source: The Author.
Crime in relation to urban design 927
3. Minimized permeability: the ease of entry to and exit from
the neighborhood or housing area.
In 1984, Bill Hiller and Julienne Hanson introduced the
concept of ‘‘Social logic of space” by arguing that there aremany physical factors apart from building height that havean effect on encouraging criminal activities. They argued that,
on the contrary to Newman, segregation increases the fear ofcrime. Later, Hillier and his colleagues at the Bartlett Schoolof Architecture and Planning, University College, London,developed the theory of space syntax, based on the concept
of social logic of space.Space syntax has been used in research involving movement
analysis in general and its implications include strategic issues
such as retail locations, distribution of land uses and locationsof crime [5]. According to the theory, a good spatial layout
Table 1 Correlation between crime and different social factors acc
Illiteracy
rate
Unemployment
rate
Internal
rate
Total crimes r= �0.4411* �0.3559* �0.3349
t= �1.9837 �1.7011 �1.6259
Crimes against
person
r= �0.4227* �0.4673* �0.2138
t= �1.9254 �2.0639 �1.1415
Crime against
property
r= �0.4398* �0.3534* �0.3352
t= �1.9796 �1.6922 �1.6268
Significant at level 0.000*** Critical
0.01**
0.05*
generates automatic movement which increases the probabilityof interactions by unplanned encounters. The increased social
interactions then increase the risk for a criminal to get caughtand hence prevent him from committing the crime [6]. It isworth mentioning that the space syntax technique was usedin this research to identify the relationship between street net-
works and crime rates. The theory of space syntax and drawingmethodology will be explained later.
3. Methodology
As mentioned before, the main agglomeration’s districts(Fig. 1) were selected for investigation. It is worth mentioning
that the methodology used in the analysis depends on the cor-relation between crime rates of the selected districts and the
ording to the last census results (2006). Source: The Author.
migration Average family
rate
Rate
scramble
Population
density
�0.7217** �0.6478** �0.3900*
�2.7167 �2.5477 �1.8184
�0.7520** �0.6728** �0.4784*
�2.7816 �2.6065 �2.0970
�0.7189** �0.6453** �0.3877*
�2.7105 �2.5417 �1.8105
value 3.551
2.423
1.684

Table 2 Social ranks and agglomeration districts classification. Source: The Author.
QISM_ENAME Illiteracy
rate
# Unemployment
rate
# Internal Migration
rate
# Average Family
size
# Rate
scramble
# Population
Density
# Total
ranks
Total
crimes
1 Al-Marg A 22.47 5 10.19 3 13.94 3 4 1 1.14 1 30,260 31 44 563.7
2 Al-Salam C 20.39 5 9.05 2 13.39 3 3.94 1 1.21 1 17,684 18 30 504.0
3 Ain Shams C 14.46 3 12.23 3 12.53 3 3.92 1 1.12 1 63,046 64 75 769.1
4 Al-Khsos A 26.43 6 4.95 1 47.12 10 3.92 1 1.1 1 49,861 50 69 120.9
5 Al Mataria A 19.29 4 13.69 3 10.94 3 3.93 1 1.18 1 80,077 81 93 411.5
6 Shobra Al Khaima
2nd
A 22.36 5 11.83 3 25.55 6 4 1 1.16 1 44,004 44 60 129.1
7 Shubra Al Khaima
1st
A 24.94 5 11.67 3 24.26 5 4.04 1 1.2 1 32,720 33 48 95.4
8 Al Sahel A 15.78 4 13.07 3 7.64 2 3.52 1 1.04 1 55,293 56 67 360.9
9 Rod Al-Farag C 20.68 5 11.31 3 7.94 2 3.4 1 1.05 1 55,966 56 68 967.4
10 Shobra C 19.26 4 12.44 3 8.43 2 3.4 1 1.05 1 53,123 54 65 1766.1
11 Sharabia A 27.75 6 14.29 3 8.99 2 3.78 1 1.29 1 58,409 59 72 569.6
12 Al-Zawya Al Hamra C 23.02 5 14.65 3 11.46 3 3.94 1 1.19 1 63,706 64 77 772.8
13 Al Zaitoun A 13.4 3 13.2 3 12.3 3 3.69 1 1.07 1 39,275 40 51 525.6
14 Hadayeq Al Qoba A 18.86 5 13.72 3 11.29 3 3.68 1 1.13 1 73,402 74 87 565.3
15 Nozha B 4.98 1 8.04 2 15.53 4 3.31 1 0.87 1 2743 3 12 1574.6
16 Masr Al Gadida B 6.31 2 8.48 2 16.48 4 3.31 1 0.83 1 12,411 13 23 2737.4
17 Al Wayli B 14.66 3 6.11 2 7.89 2 3.4 1 0.99 1 15,600 16 25 1779.8
18 Al Zaher C 10.16 3 9.91 2 8.7 2 3.44 1 0.95 1 32,491 33 42 1693.5
19 Bab Al-Shairia C 24.3 5 7.3 2 4.43 1 3.61 1 1.13 1 55,231 56 66 1852.7
20 Al gammalia C 27.08 6 7.83 2 3.93 1 3.6 1 1.18 1 24,407 25 36 1541.1
21 Al-Darb Al-Ahmar C 22.86 5 8.55 2 4.72 1 3.71 1 1.12 1 32,479 33 43 1673.1
22 Al-Mouski C 27.17 6 8.16 2 6.38 2 3.4 1 1.05 1 27,512 28 40 3543.6
23 Al-Azbakeya B 14.62 3 7.77 2 6.07 2 3.19 1 0.93 1 19,490 20 29 2796.7
24 Bolaq C 31.54 7 5.94 2 6.12 2 3.31 1 1.27 1 27,212 28 41 713.9
25–
26
Qasr Al-Niel
+ Zamalik
B 4.39 1 5.76 2 14.63 3 2.42 1 0.56 1 6933 7 15 3131.4
27 Abdin C 14.47 4 5.94 2 10.41 3 3.13 1 0.92 1 25,018 26 37 1724.2
28 Al-Sayeda Zainab C 18.37 4 9.33 2 6.72 2 3.47 1 1.08 1 35,839 36 46 2236.7
29 Masr Al-Qadima C 28.97 6 9.61 2 8.27 2 3.52 1 1.13 1 21,477 22 34 405.7
30 Al-Khalifa B 22.6 5 6.64 2 9.96 2 3.75 1 1.21 1 6162 7 18 1007.7
31 Monshat Naser A 47.05 10 4.31 1 11.99 3 3.91 1 1.51 1 47,183 48 64 507.5
32 Madinat Nasr 2nd B 12.33 3 13.85 3 17.74 4 3.91 1 1.14 1 4387 5 17 1730.8
33 Madinat Nasr 1st B 6.75 2 9.14 2 21.84 5 3.69 1 1 1 6800 7 18 708.5
34 Al-Basatine C 21.67 5 11.83 3 10.69 3 3.96 1 1.17 1 27,613 28 41 574.1
35 Al-Maadi B 7.43 2 10.44 3 13.09 3 3.32 1 0.87 1 3118 4 14 3645.6
36–
37
Tora + Helwan C 20.84 5 13.97 3 13.37 3 3.91 1 1.18 1 4632 5 18 303.9
38 Al tebin B 25.5 6 18.82 4 16.31 4 4.36 1 1.33 1 2686 3 19 603.8
39 Giza-Qism C 25.05 6 11.99 3 11.59 3 3.82 1 1.14 1 22,354 23 37 1098.6
40 Al-Omrania C 14.83 3 11.09 3 25.5 6 3.86 1 1.09 1 41,447 2 16 361.2
41–
42
Al-Ahram B 22.5 5 11.83 3 19.16 4 3.97 1 1.12 1 15,073 16 30 594.2
928
H.Adel
etal.

43
BolaqAldakrour
A18.87
412.22
313.86
33.92
11.15
161,717
62
74
327.8
44
Dokki
B6.37
26.76
222.95
53.23
10.8
118,427
19
30
1843.7
45
Al-Aagouza
C12.32
310.77
329.23
63.43
10.91
130,380
31
45
1171.2
46
Imbaba-Q
ism
A21.73
510.07
319.34
43.98
11.19
171,490
72
86
338.3
47–
48
Alwaraq
C28.84
68.78
219.18
43.96
11.17
119,921
20
34
309.2
*Theblack
highlightedcellsrepresentvalues
larger
thantheregion’svalues
asfollows:
Theregion’srank=
35.Theregion’scrim
erate
=571.58.
**Districts
classificationkey:
a–Districts
generatingcrim
inalsrather
thanbeingvulnerable
tocrim
es.
b–Districts
attractingcrim
inalsrather
thangeneratingthem
.
c–Districts
attractingandgeneratingcrim
inalsatthesametime.
Italicvalues
representfragmentedranksforeach
rate.
Crime in relation to urban design 929
rates obtained from different factors. Analysis includes thefollowing:
3.1. Social analysis
In this part, crime rates were correlated with different socialfactors including illiteracy rate, unemployment rate, and inter-
nal migration studies, and these factors can be considered asan indicator of social deterioration within any society, whichis primarily responsible for generating criminals and increasing
crime rates.
3.2. Street network pattern analysis
Using the ‘‘space syntax” technique, street network analysishas to follow these steps:
a. Taking maps of the selected case studies, drawing the
longest and fewest axial lines to obtain the axial map.b. Analyzing the maps using UCL Depthmap software,
calculating the Global Integration, Local Integration
R= 3, R= 10 and Connectivity values.c. Checking the correlations between each of the former
values and crime rates.
3.3. Land use analysis
In this part, crime rates were correlated with different landuses which can be classified into activity uses (represented bycommercial areas), idle uses (represented by cemeteries, desertsand military areas), and a mix of them (represented by indus-
trial areas, in addition to the study of the residential areasthemselves, including some of the formal housing areas (theold deteriorated residential areas, public housing and shelter
‘‘El-EWAA” housing areas) and the informal housing areas).Based on previous studies, land uses can provide a goodopportunity for criminals to commit their crimes by reducing
movements and activities or exaggerating them.
4. Analysis
4.1. Social analysis
The main purpose of this analysis was to identify the relation-ship between different social factors and crime rate. Themethodology used to understand this relation depends on thecorrelation between the latter and the rate of each of these fac-
tors within the studied districts. According to the mentionedmethodology, results showed that total crime rate was signifi-cantly and negatively correlated with all studied social factors
except the internal migration rate, where a negative but notsignificant correlation exists. This also applied to person andproperty crimes. So, it can be concluded that districts with high
socially deteriorated residents have low crimes rate. Table 1shows the correlation and ‘‘t” values over the agglomerationdistricts.
This result can be explained in two directions. On the one
hand, the increase of socially deteriorated residents within adistrict is considered as an indicator of the increasing of the

Table 3 Social characteristics of the selected districts and their crime data during the study period (2004–2008). Source: Social
characteristics recalculated by the author according to the last census results, Crime data recalculated by the author according to Public
Security Bureau’s (PSB’s) statistics.
District Illiteracy
rate
Unemployment
rate
Internal
migration rate
Average
family size
Rate
scramble
Population
density
Crime
rates
Crime
against
person
Crime against
property
Districts generating criminals
Mataria 19.29 13.69 10.94 3.93 1.18 80,077 411.50 7.62 403.88
Manshyet
Nasser
47.05 4.31 11.99 3.91 1.51 47,183 507.54 7.63 499.90
Bolaq
AlDakrour
18.87 12.22 13.86 3.92 1.15 61,717 327.81 7.03 320.79
Districts attracting criminals
Masr
AlGadida
6.31 8.48 16.48 3.31 0.83 12,411 2737.41 26.41 2711.01
Madinat
Nasr 2nd
12.33 13.85 17.74 3.91 1.14 4387 1730.84 13.17 1717.67
Dokki 6.37 6.76 22.95 3.23 0.80 18,427 1843.68 23.45 1820.24
930 H. Adel et al.
district’s poverty rate. Since most criminals search for highstandards of living areas to commit their crimes, these sociallydeteriorated districts become less vulnerable to crimes and theadjacent ones with low socially deteriorated residents become
more vulnerable to crimes. On the other hand, most of thesedistricts help in creating criminals-due to their bad livingconditions-than being places of crimes. Since most criminals
leave a buffer around their residence where they might berecognized according to the crime pattern theory [7], theymay tend to commit their crimes within the adjacent districts.
Thus, these socially deteriorated districts become less vulnera-ble to crimes. Based on the previous explanation, a conceptual-ization of ‘‘districts attracting criminals” and ‘‘districtsgenerating criminals” has been proposed by comparing dis-
tricts’ social conditions with their crime rates through Table 2:
� Ranking values within each of the studied factors in groups,
for example:– values P 0, <10 have rank = 1;– values P 10, <20 have rank = 2;
– values P 20, <30 have rank = 3, etc.,
Then, summing up the resulted ranks over each district:
� Identifying high socially deteriorated districts by calculatingthe region’s rank; higher rank values are considered an indi-
cator of high socially deteriorated districts.� Identifying high crime rate districts by calculating theregion’s crime rate; higher values are considered an indica-
tor of high crime rate districts.
According to that, the main agglomeration’s districts were
classified according to the following figure into three types:
� Districts generating criminals rather than being vulnerable
to crimes, including socially deteriorated districts with lowcrime rates.
� Districts attracting criminals rather than generating them,including socially developed districts with high crime rates.
� Districts attracting and generating criminals at the sametime, including both socially deteriorated districts with high
crime rates and socially developed districts with low crimerates. It should be noted that criminals of this type ofdistricts may not be those who commit crimes within. It is
possible that these districts attract criminals from outsideand expel their criminals outside at the same time, as higherrisks of detection and apprehension exist within theirresidence districts.
4.2. Physical analysis
4.2.1. Street network
Based on the assumption that criminals always choose placesthat require the least amount of time and energy to commit
their crimes, a sample of the first and second districts typeswas selected to be analyzed. This involved the selection of dis-tricts that are socially and spatially different from each otherso that, any relationships between crime and space across the
areas are unlikely to be due to social factors. The selecteddistricts include the following: Al-Mataria, Manshyet Nasserand Boulaq Al Dakrour as districts generating criminals, corre-
sponded withMasr Al Gadida,Madinat Nasr 2nd and Dokki asdistricts attracting criminals. Table 3 indicates social charac-teristics of the districts being investigated and their crime data.
As for the third type, which includes districts attract and gen-erate criminals at the same time, it was difficult to identifywhether criminals are insiders or outsiders, especially that
most of these districts located within the downtown whichattracts people from different areas, whether criminals ornot. Thus the third type was ignored.
To identify the relationship between street networks and
crime rates, space syntax analysis has been used.
4.2.1.1. Drawing methodology. As axial models depend on
visibility, therefore, achieving the natural surveillance, someelements have to be taken into account while drawing. Basedon surveys done by the author within the selected districts,
these elements include the following:

Figure 2 Example of wide planted middle islands, Khalifa Ma’mon St., Misr Elgadida district. Source: The Author.
Figure 3 Example of narrow middle islands, Sudan St., Dokki District. Source: The Author.
Crime in relation to urban design 931
1. Middle islands: according to surveys, they can be classifiedinto the following:a. Wide planted fenced islands, with low-rise fences,
shrubs, and trimmed trees.b. Non-fenced wide planted islands with low-rise shrubs
and trimmed trees.
c. Narrow islands.
Figure 4 Examples of nodes and open areas, roxy square-Misr El-G
Source: The Author.
It is notable that most of them are easily passable and don’t
impede vision; therefore, they can be considered as spacesFigs. 2 and 3.
Nodes and open spaces:most of themare non-fenced contain-ing simple sculptures, fountains, shrubs, seats, etc. Fig. 4 shows
examples of nodes and open spaces within the selected districts.
adida District (Above) and Galaa Square-Dokki district (Below).

Figure 5 Example of fenced private areas, Madinet Nasr 2nd district. Source: The Author.
932 H. Adel et al.
It is notable that those sculptures, fountains, shrubs, seats,etc. don’t impede vision, so they were ignored while drawing
the axial maps; and considered as spaces.
1. Some private vacancies including the following:a. Fenced areas (such as Military uses, private lands): the
majority of these lands have high-rise fences thatimpede vision, as their main purpose is to secure thespace surrounded by; thus, they can be considered as
objects. Fig. 5 shows an example of fenced areas withinthe selected districts.
b. Non-fenced areas which can be classified into the
following:I. Buildings’ intermediate spaces: these spaces –
especially within the districts attracting criminals –
are usually used as building entrance, garageentrance and in some cases used as storage areaswhilea small percentage have been used as internal routesor open spaces; therefore, they can be considered as
objects.II. Buildings’ open spaces: these spaces usually are
planted, but the lack of maintenance of these plants
makes them grow thicker and impede visibility forresidents. Therefore, they can also be consideredas objects although, some are passable Fig. 6.
Visible Invisible
Figure 6 Example of building open spaces that impede visibility, E
Author.
So it can be concluded that, in order to study the effect ofnatural surveillance and movement on crime, middle islands,nodes and open areas are considered as spaces, while all
private vacancies are considered as objects.
4.2.1.2. Space syntax analysis. Depending on the selected sam-
ple, two questions need to be answered. The first is: ‘‘Are therespatial differences between districts generating criminals andthose attracting criminals that affect crime rates?” The second
is: ‘‘Are there particular street patterns attract criminals?”Therefore, there were two primary types of variables usedextensively in the analysis: the values obtained through SpaceSyntax analysis as the independent variable, and crime rates as
the dependent variables. The values obtained through spacesyntax were as follows: Global Integration, Local IntegrationR= 3, Local Integration R= 10 and Connectivity. The rela-
tionship between each of these values and crime rate wasexplored to examine their effects on crime occurrence in theselected districts. For the first question which relates to the
spatial differences that affect the crime, the correlationbetween each of values obtained through space syntax and
crime rate was calculated. Comparing Districts generating
criminals with districts attracting criminals Table 4 shows that:
These results are consistent with Hillier and Sahbaz, 2005.They concluded [8]:
mtdad Ramsis Buildings-Madinet Nasr 2nd district. Source: The

Table 4 Districts generating criminals and districts attracting criminals. Source: Author.
Districts generating criminals Districts attracting criminals
Global
integration
Integration
R= 3
Integration
R= 10
Connectivity Global
integration
Integration
R= 3
Integration
R= 10
Connectivity
Mataria 1.2140 2.2324 1.3544 4.7314 Masr Al Gadida 1.7721 2.4021 1.7723 5.3157
Manshyet Nasser 0.6157 1.6170 0.9960 3.3198 Madinat Nasr 2nd 0.7874 1.6219 0.9913 3.3833
Bolaq Al Dakrour 1.1348 2.2441 1.3122 4.2582 Dokki 1.4723 2.0799 1.4848 4.5362
Total crimes r= �0.8219 �0.8926 �0.8299 �0.6826 Total crimes r= 0.8001 0.8671* 0.8406 0.8617
t= �0.4511 �0.4716 �0.4535 �0.4057 t= 4.0034 6.5271 5.2754 6.2298
Crimes against
person
r
=
�0.4063 �0.5285 �0.4192 �0.2036 Crimes against
person
r= 0.9962** 0.9783** 0.9876** 0.9805**
t= �0.2889 �0.3458 �0.2954 �0.1691 t= 265.3883 45.1300 79.6578 50.3207
Crimes against
property
r= �0.8230 �0.8935 �0.8310 �0.6840 Crimes against
property
r= 0.7950 0.8629 0.8360 0.8573
t= �0.4515 �0.4719 �0.4538 �0.4062 t= 3.8785 6.2935 5.0985 6.0101
Significant at level 0.000*** Critical value 636.619 Significant at level 0.000*** Critical value 636.619
0.01** 31.821 0.01** 31.821
0.05* 6.314 0.05* 6.314
The total crime rates were negatively – though not significantly-correlated with all the spatial
factors which means that, crime rates decrease with increasing the global integration, local
integration R= 3, R= 10 and connectivity values, and vice versa. This also applied to both
crime against person and crime against property rates
The total crime rates were positively and significantly correlated with all the spatial factors which
means that, crime rates increase with increasing the global integration, local integration R= 3,
R= 10 and connectivity values, and vice versa. This also applied to both crime against person
and crime against property rates
Integration values:
Results support that the presence of more people appears to provide higher risks of detection and
apprehension to potential criminals. Higher Integration values are usually associated with higher
levels of movement at different scales—pedestrian and vehicular. Consequently, more people—
and eyes—are present which in turn, spell potential trouble for those attempting to commit any
criminal act. These findings agree with Jacob’s thesis through the presence of high density
neighborhoods characterized by strong social interactions as mentioned previously
Results support that the presence of more people appears to provide higher risks of being
exposed to crimes. Higher integration values provide overcrowded areas with a larger number of
potential targets especially, that most of these spaces are desirable locations for retail and other
public services because of their high accessibility. Criminals find it easier to commit their crimes
in crowd and escape using crowds to impede victims and blending into them. This doesn’t mean
that there are no eyes on streets, but it can be said that crowd, the existence of a larger number of
victims, the lack of social interactions between residents, etc., dominate the eyes on street which
makes these areas more vulnerable to crimes
Connectivity values:
Results also showed that although higher connectivity values provide more escape routes, lower
incidents occurred. This agrees with the rational choice theory where criminals, in general,
compare between the risks of being caught – or being recognized by the insiders – and escaping
with rewards gained (Felson, M. and Clarke, R.V., 1998); it is obvious that the probability of
escaping with rewards is less. This means that either those areas have low standards of living, or
high natural surveillance exists, or may be both
Results also showed that higher connectivity values provide more escape routes; therefore, higher
crimes occur, so it can be interpreted that criminals find the probability of escaping with rewards
is higher than being caught -or being recognized by the insiders. These findings agree partially
with Newman’s defensible space theory; both share the idea of minimizing the permeability –
including the ease of entry to and exit from the area – to control the numbers of people using the
space, while the idea of creating isolated neighborhoods from strangers to achieve territoriality is
unacceptable for the studied cases
Crim
ein
relatio
nto
urbandesig
n933
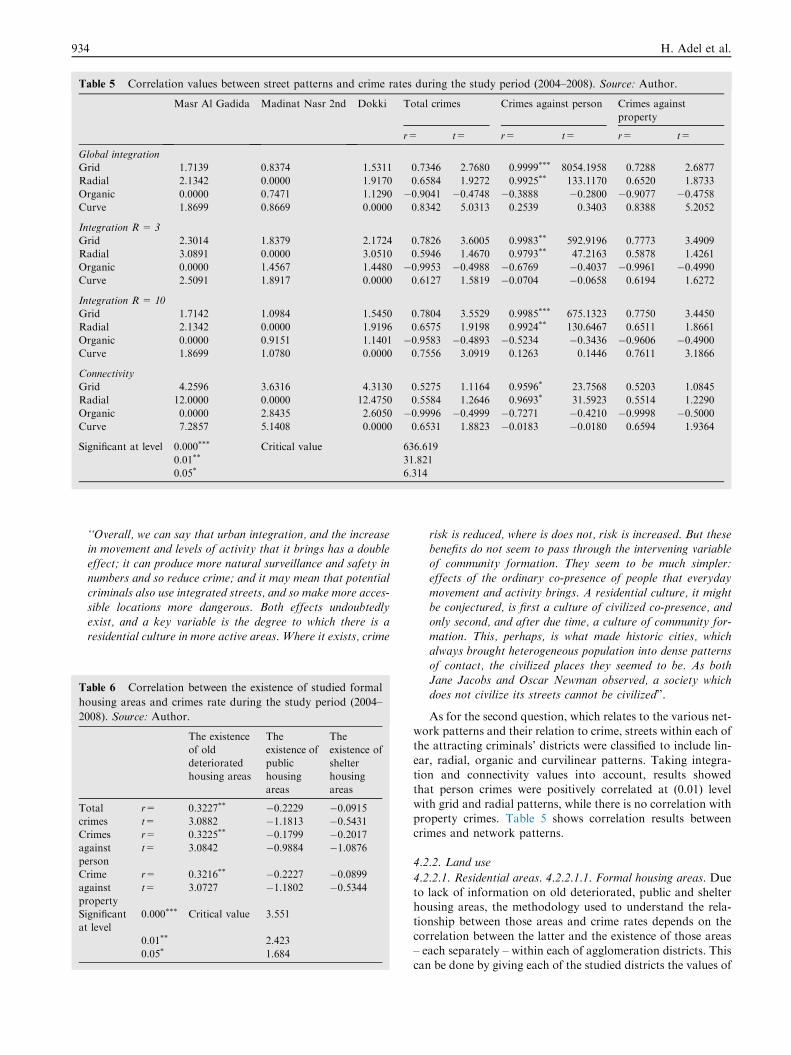
Table 5 Correlation values between street patterns and crime rates during the study period (2004–2008). Source: Author.
Masr Al Gadida Madinat Nasr 2nd Dokki Total crimes Crimes against person Crimes against
property
r= t= r= t= r= t=
Global integration
Grid 1.7139 0.8374 1.5311 0.7346 2.7680 0.9999*** 8054.1958 0.7288 2.6877
Radial 2.1342 0.0000 1.9170 0.6584 1.9272 0.9925** 133.1170 0.6520 1.8733
Organic 0.0000 0.7471 1.1290 �0.9041 �0.4748 �0.3888 �0.2800 �0.9077 �0.4758
Curve 1.8699 0.8669 0.0000 0.8342 5.0313 0.2539 0.3403 0.8388 5.2052
Integration R = 3
Grid 2.3014 1.8379 2.1724 0.7826 3.6005 0.9983** 592.9196 0.7773 3.4909
Radial 3.0891 0.0000 3.0510 0.5946 1.4670 0.9793** 47.2163 0.5878 1.4261
Organic 0.0000 1.4567 1.4480 �0.9953 �0.4988 �0.6769 �0.4037 �0.9961 �0.4990
Curve 2.5091 1.8917 0.0000 0.6127 1.5819 �0.0704 �0.0658 0.6194 1.6272
Integration R = 10
Grid 1.7142 1.0984 1.5450 0.7804 3.5529 0.9985*** 675.1323 0.7750 3.4450
Radial 2.1342 0.0000 1.9196 0.6575 1.9198 0.9924** 130.6467 0.6511 1.8661
Organic 0.0000 0.9151 1.1401 �0.9583 �0.4893 �0.5234 �0.3436 �0.9606 �0.4900
Curve 1.8699 1.0780 0.0000 0.7556 3.0919 0.1263 0.1446 0.7611 3.1866
Connectivity
Grid 4.2596 3.6316 4.3130 0.5275 1.1164 0.9596* 23.7568 0.5203 1.0845
Radial 12.0000 0.0000 12.4750 0.5584 1.2646 0.9693* 31.5923 0.5514 1.2290
Organic 0.0000 2.8435 2.6050 �0.9996 �0.4999 �0.7271 �0.4210 �0.9998 �0.5000
Curve 7.2857 5.1408 0.0000 0.6531 1.8823 �0.0183 �0.0180 0.6594 1.9364
Significant at level 0.000*** Critical value 636.619
0.01** 31.821
0.05* 6.314
T
h
2
T
cr
C
a
p
C
a
p
S
a
934 H. Adel et al.
‘‘Overall, we can say that urban integration, and the increasein movement and levels of activity that it brings has a doubleeffect; it can produce more natural surveillance and safety innumbers and so reduce crime; and it may mean that potential
criminals also use integrated streets, and so make more acces-sible locations more dangerous. Both effects undoubtedlyexist, and a key variable is the degree to which there is a
residential culture in more active areas. Where it exists, crime
able 6 Correlation between the existence of studied formal
ousing areas and crimes rate during the study period (2004–
008). Source: Author.
The existence
of old
deteriorated
housing areas
The
existence of
public
housing
areas
The
existence of
shelter
housing
areas
otal
imes
r= 0.3227** �0.2229 �0.0915
t= 3.0882 �1.1813 �0.5431
rimes
gainst
erson
r= 0.3225** �0.1799 �0.2017
t= 3.0842 �0.9884 �1.0876
rime
gainst
roperty
r= 0.3216** �0.2227 �0.0899
t= 3.0727 �1.1802 �0.5344
ignificant
t level
0.000*** Critical value 3.551
0.01** 2.423
0.05* 1.684
risk is reduced, where is does not, risk is increased. But thesebenefits do not seem to pass through the intervening variableof community formation. They seem to be much simpler:effects of the ordinary co-presence of people that everyday
movement and activity brings. A residential culture, it mightbe conjectured, is first a culture of civilized co-presence, andonly second, and after due time, a culture of community for-
mation. This, perhaps, is what made historic cities, whichalways brought heterogeneous population into dense patternsof contact, the civilized places they seemed to be. As both
Jane Jacobs and Oscar Newman observed, a society whichdoes not civilize its streets cannot be civilized”.
As for the second question, which relates to the various net-work patterns and their relation to crime, streets within each ofthe attracting criminals’ districts were classified to include lin-
ear, radial, organic and curvilinear patterns. Taking integra-tion and connectivity values into account, results showedthat person crimes were positively correlated at (0.01) level
with grid and radial patterns, while there is no correlation withproperty crimes. Table 5 shows correlation results betweencrimes and network patterns.
4.2.2. Land use
4.2.2.1. Residential areas. 4.2.2.1.1. Formal housing areas. Dueto lack of information on old deteriorated, public and shelterhousing areas, the methodology used to understand the rela-tionship between those areas and crime rates depends on the
correlation between the latter and the existence of those areas– each separately – within each of agglomeration districts. Thiscan be done by giving each of the studied districts the values of

Table 7 Correlation between the existence of informal hous-
ing areas and crime rates during the study period (2004–2008).
Source: Author.
The existence of
informal areas
The percentages of
informal areas
Total crimes r= �0.5670* �0.3546*
t= �2.3450 �1.6966
Crimes
against
person
r= �0.4954* �0.2242
t= �2.1469 �1.1870
Crime
against
property
r= �0.5659* �0.3549*
t= �2.3421 �1.6977
Significant at
level
0.000*** Critical value 3.551
0.01** 2.423
0.05* 1.684
Crime in relation to urban design 935
(1) if any of those areas exists, (0) for not. Results showed thattotal crime rates were positively and significantly correlatedwith the existence of old deteriorated housing areas with corre-
lation coefficient of 0.3227, but, negatively correlated withpublic and shelter housing areas – but not significant – withcorrelation coefficient of (�0.2229) and (�0.0915) respectively.
This also applied to crime against person and crime againstproperty rates. Table 6 shows the correlation values and theirsignificance.
Results also showed that – according to districtsclassification mentioned before – most crimes committedwithin districts attracting criminals, and those attracting andgenerating criminals at the same time – including property
and person crimes – are supposed to be committed withinold deteriorated housing areas, where significance at level of0.05 was shown. As for districts generating criminals, no
significant correlation was found which means that most ofcrime incidents committed within those districts are locatedoutside those areas.
4.2.2.1.2. Informal housing areas. Due to lack of informa-tion on the informal housing, the area of each was calculatedas an indicator of their demographic status such as population
and population density. The methodology used to understandthe relationship between those areas and crime rates dependson the correlation between the latter and the percentages forthose areas according to districts limits. Results showed that
total crime rates were negatively and significantly correlatedwith informal areas ratios with correlation coefficient of
Table 8 Correlation between studied land uses and crime rates dur
Residential Commercial I
Total crimes r= �0.3638* 0.2208* �t= �1.7286 1.8369 �
Crimes against person r= �0.3616* 0.2429* �t= �1.7209 2.0788 �
Crime against property r= �0.3625* 0.2198* �t= �1.7244 1.8261 �
Significant at level 0.000*** Critical value 3
0.01** 2
0.05* 1
(�0.3546) which means that, as the percentage of the informalhousing increases, crime rate decreases. This also applied tocrime against person – though not significant – and crime
against property rates. Table 7 shows the correlation valuesand their significance.
This result is considered a logical consequence, although
increasing of informal housing areas within a district was sup-posed to increase the district’s criminals; thus more crimes areexpected. Analysis showed that the increase of these areas
increases their district’s poverty rate. Since most criminalssearch for high standards of living areas to commit theircrimes, districts with larger informal housing areas become lessvulnerable to crime. According to districts classification, the
same results were applied to districts attracting criminals andthose generating and attracting criminal at the same time,though not significant. As for districts generating criminals,
there was positive and significant correlation between personcrimes and the percentage of informal districts’ housing dueto the increase of rape incidents within those areas, helped
by the high rates of poverty, the inability to bear the cost ofmarriage, in addition to, the nature of those areas which pro-vides opportunities to commit those types of incidents, and the
position of buildings themselves which don’t provide privacyto its residents, especially for women.
4.2.2.2. Other land uses. The methodology used to understand
the relationship between specific land uses and crime ratesdepends on the correlation between the latter and the percent-ages of each of these uses within the studied districts. Studied
land uses include residential, commercial, industrial, cemetery,vacant lands, agriculture lands and deserts. Results showedthat total crime rates were positively correlated with commer-
cial areas and deserts with correlation coefficient of (0.2208)and (0.2502) respectively, and negatively correlated with resi-dential, industrial, cemetery areas, vacant and agricultural
land with correlation coefficients of (�0.3638), (�0.3230),(�0.0533), (�0.3408) and (�0.3067) respectively; significantcorrelations at (0.05) level were obtained only in residential,commercial uses and deserts. This also applied to crime against
person and crime against property rates. Table 8 shows thecorrelation values and their significance.
Results also showed that – according to districts classifica-
tion mentioned before – most of the ‘‘districts attracting crim-inals” crimes – including property and person crimes – aresupposed to be committed within their commercial areas,
where significance at level of 0.05 was shown. As for districtsgenerating criminals, most of person crimes are supposed to
ing the study period (2004–2008). Source: Author.
ndustrial Cemetery Vacant lands Agriculture Desert
0.3230 �0.0533 �0.3408 �0.3067 0.2502*
1.5821 �0.3280 �1.6472 �1.5210 2.1622
0.2140 �0.0263 �0.1385 �0.2159 0.1129
1.1425 �0.1752 �0.7886 �1.1507 0.8250
0.3231 �0.0541 �0.3420 �0.3067 0.2509*
1.5827 �0.3324 �1.6515 �1.5211 2.1708
.551
.423
.684

936 H. Adel et al.
be committed within their industrial and agricultural areas,where significance at level of 0.05 was shown, while propertycrimes results did not show any significance with the studied
uses. This supports space syntax results, as criminals offendingwithin the first type find it easier to commit their crimes incrowd and escape using crowds to impede victims and blending
into them, while those offending within the second type findthe presence of more people provide higher risks of detectionand apprehension and they tend to commit their crimes within
segregated areas. As for districts generating and attractingcriminals at the same time, most of person crimes are supposedto be committed within their commercial areas and cemeteries,where significance at level of 0.05 was shown, while property
crimes results did not show any significance with the studieduses. This confirms that this type of districts contains a mixtureof the other two types, as crimes tend to occur in both crowd
and deserted areas.
5. Conclusion
From the above analysis, it is evident that most criminalssearch for accessible places, easy to move through and thatprovide high opportunities for escape to commit their crimes.
It is also evident that the agglomeration’s districts can be clas-sified as below into three types based on their social character-istics and crime rates:
5.1. Districts generating criminals
Analysis showed that the presence of more people in thosedistricts appears to provide higher risks of detection and
apprehension to potential criminals; therefore most criminalscommit their crimes within segregated areas. Analysis showedthat those segregated areas include old deteriorated housing,
industrial as well as agricultural areas.
5.2. Districts attracting criminals
Analysis showed that the presence of more people in those dis-tricts appears to provide higher risks of being exposed tocrimes; therefore most criminals commit their crimes within
overcrowded areas. Moreover, it showed that those over-crowded areas include commercial areas with grid networks.It is obvious that grid networks provide clearer and moredirect and predictable routes and therefore attract more poten-
tial offenders, while the existence of commercial uses helps inattracting more potential targets. Since more potential offend-ers will see more potential targets, more crime opportunities
will be provided.
5.3. Districts generating and attracting criminals
Results showed that those districts are a mix of the previoustwo types; therefore incidents occur within both overcrowdedand segregated areas almost with the same proportions.
6. Recommendations
According to the findings of this research, recommendations –
in order to provide a secured environment – have to cover two
different processes: the first is to improve the urban environ-ment, while the second includes the upgrading of populationespecially in the socially deteriorated districts.
6.1. Improving the urban environment
The researcher recommends that this process can be achieved
through a set of parties which have to work with each otherwithin the whole system. Those parties include the following:
6.1.1. Legislators
Legislators – represented by the members of the People’sAssembly and the Shura Council – need to work in twodirections:
a. The amendment of the existing laws or the enactment ofnew ones – whether related to the criminals themselves
or the urban environment where those crimes were com-mitted – in order to increase the effort of crime.
b. Allocating more resources of the general budget to deli-ver public services and utilities to underserved areas
especially, street lighting. Here comes the role of localgovernance as will be shown in the next point.
6.1.2. Local governance
Local governance at different levels (governorates, markez,cities, districts and villages) has the responsibility to distribute
those resources within their jurisdiction. It is recommendedthat this distribution covers three basic tasks:
a. Survey areas suffering from bad living conditions andclassify them according to their physical, social, eco-nomic conditions, etc.
b. The establishment and management of all public ser-vicesnutilities within sociallynphysically deterioratedareas.
c. The quick removal of informal housing areas and theirreplacement with formal ones.
It is notable that the mentioned tasks depend on planners
and designers significantly as will be shown in the next point.
6.1.3. Planners and designers
They are the key factors for crime reduction through their
cooperation with local governance and legislators. The resultof this cooperation appears in identifying different design prin-ciplesnmeasures to be adopted in laws or regulations, and
therefore secures the urban environment of future projects. Itis worth mentioning that analysis of this research has recom-mended a set of principlesnmeasures which activate the role
of both insiders and outsiders in maintaining natural surveil-lance through the following:
� Mixing of uses in order to pool different groups of people atdifferent times of the day, create opportunities for positivesocial interactions between insiders and outsiders; takinginto account the avoidance of incongruous uses.
� Reducing the grid network patterns in both limited andexaggerated movement areas.

Crime in relation to urban design 937
6.1.4. Criminologists
Criminologists have to provide decisionmakers with a snapshot
of criminality and criminal behavior which provide them withan understanding of crime patterns and trends. Without thisunderstanding of both crime patterns and criminal behavior,
people who have to make decisions that affect the safety andsecurity of communities will not have access to the vital, synthe-sized information essential to good planning and strategy.
6.2. Upgrading of population
The researcher recommends that this process can be achieved
through organizations within different ministries by strength-ening the sense of belonging and citizenship in the community,increasing social interactions among residents at differentlevels in addition to, building their capacity. This includes
the following:
6.2.1. Ministry of education
a. Strengthening the concepts of belonging and citizenshipthrough the development of education curriculum in
schools.b. Focusing on the role of the school in the process of educa-
tion so as not to be restricted to curriculum issues and to
be extended to monitor students’ behavior in addition to,strengthening the relationship between home and school.
c. Giving attention to schools’ activities – especially in
summer – in order to reduce juvenile crimes anddelinquency.
6.2.2. National council for youth
a. Raising youth awareness about citizenship and the legalsystem through targeted programs.
b. The establishment of youth centers and sports clubs – in
the underserved areas – to highlight the talents of youngpeople and their abilities, in addition to strengtheningsocial relationships among them.
c. Conducting training courses for youth employmentthrough improving their skills and abilities, such as com-puter skills.
6.2.3. Ministry of social solidarity
a. Raising families’ awareness about citizenship and thelegal system through targeted programs.
b. Encouragement of volunteer work as a mean of
strengthening social relationships within community.c. Conducting training courses for employment through
improving residents’ skills and abilities, such as crafts
making and tailoring.
Finally, for both processes, organizations within ministry of
interior have to do the following:
a. Improve law enforcement
b. Develop new strategies for crime reduction and presentthem to the legislative authorities.
7. Recommendations for further research
This study has opened the door for variety of studies that can
investigate crime in the Egyptian environment. For the future,a more detailed study is recommended with precise locations ofincidents. Future research may also be conducted in the newurban communities’ districts, villages and small towns’ districts
or even other Egyptian cities and comparison can be madewhich may strengthen the findings of this study or may contra-dict it. Also more detailed study can be done by dividing the
crime further by types, location and time, which will give amore detailed understanding of the crime patterns.
References
[1] Adel Hussein H. Crime and urban planning in Egypt case
study. Greater Cairo Region, thesis for M.Sc. degree in
Architecture (Urban Planning), Supervised by Dr. Mohammed
Salheen and Dr. Randa A. Maahmoud, Ain Shams University;
2011. 166p.
[2] Jacobs J. The death and life of great American cities. New York:
Vintage; 1961.
[3] Linden R. Situational crime prevention: its role in comprehensive
prevention initiatives. IPC Rev 2007;1:139–59.
[4] Newman O. Creating defensible space. Washington: U.S. Depart-
ment of Housing and Urban Development, Office of Policy
Development and Research; 1996.
[5] Salheen M. A comprehensive analysis of pedestrian environments:
the case of Cairo City Centre. PhD thesis, Edinburgh College of
Art, Heriot-Watt University; 2001.
[6] Dhimn D. Identifying the relationship between crime and street
layout using space syntax technology, master thesis, University of
Cicinnati; 2006.
[7] Brantingham PJ, Brantingham PL. Environmental criminology,
prospect heights. IL: Waveland Press; 1981.
[8] Hillier B, Sahbaz O. High resolution analysis of crime patterns in
urban street networks: an initial statistical sketch from an ongoing
study of a London borough. Proceedings of fifth international
space syntax symposium, Netherlands, Delft: The Bartlett, UCL;
2005.
Heba Adel is a teaching assistant at Faculty of
Engineering, Port Said University. She
received her M.Sc. Degree in Architecture
(Urban planning) from Ain Shams University.
She is pursuing her doctoral research at Port
Said University. Her research seeks to explore
the relationship between social injustice in
Egypt and different urban planning aspects
regarding public services.
She participated in many projects, such as the
Strategic Urban Planning of Assuit city-Assuit
governorate, developing the Master Plan of Ras Sedr city-South Sinai
governorate, and the identification and classification of unsafe and
unplanned areas within Cairo and Assuit governorates.

938 H. Adel et al.
Mohamed Salheen, a full Professor in Ain
Shams University, has obtained his PhD
degree from Edinburgh College of Art in
2001. He is co-Founder & director at IUSD-
Integrated Urbanism & Sustainable Design
Master Program, and owner of Integrated
Development Group. He has several publica-
tions in many disciplines and taught in the
Arab Academy for Science and Technology
and Maritime Transport as Associate
Professor from 2002 till 2005.
Randa A. Mahmoud is an Egyptian Architect
and Urban Planner. After having finished her
PhD studies in France at the IUP, she is now
Assistant Professor at both Ain Shams and
the French Universities in Egypt teaching and
supervising multidisciplinary topics.
She has been involved as a Freelancer in many
residential and urban design projects and
nominated for the price of the ‘‘Aga Khan
Award for Architecture-cycle 2013” for the
project ‘‘Beit Al Rawi,” a residential villa in
New Cairo. She has several local and international publications in the
fields of urban morphology, architectural typology, urban sociology
and informal urbanization.


![GREATER MANCHESTER JOINT AUDIT PANEL …...[p] Paper attached GREATER MANCHESTER JOINT AUDIT PANEL (POLICE AND CRIME) 10:20 a.m. – 12:00 p.m., Tuesday 30 July 2019 The Boardroom,](https://static.fdocuments.us/doc/165x107/5f0c8b857e708231d435f01a/greater-manchester-joint-audit-panel-p-paper-attached-greater-manchester-joint.jpg)