Creswell -qualitative_quantitative_and_mixed_methods.pdf ful book

Creswell Economic Opportunities Analysis
Prepared for
Lane Council of Governments and
the City of Creswell
by
ECONorthwest 99 W. Tenth, Suite 400
Eugene, OR 97401 (541) 687-0051
March 2005

Creswell Economic Opportunities Analysis: Executive Summary
FRAMEWORK This Creswell Economic Opportunities Analysis is designed to comply with
Oregon’s Statewide Planning Goal 9, which requires communities to provide for an adequate supply of sites of suitable sizes, types, locations, and service levels for a variety of industrial and commercial uses consistent with plan policies.
The Economic Opportunities Analysis reports our inventory of buildable non-residential land currently in Creswell’s UGB. Buildable means land that is vacant, zoned for non-residential development, free of constraints on development such as steep slopes or wetlands, and to which public services can be provided. The buildable lands inventory in this report also considers opportunities for redevelopment of currently developed properties in Creswell. The size distribution, location, and availability of public services for buildable land in Creswell.
This Economic Opportunities Analysis also reviews regional economic trends and local conditions to project the level of potential employment growth in Creswell. The amount and type of potential employment growth is used to estimate demand for non-residential land in total as well as by size, type, location, and service level.
The supply of buildable land currently in Creswell’s UGB is compared to demand generated by potential employment growth to assess whether or not Creswell has an adequate supply of suitable sites for industrial and commercial uses. This assessment considers whether sites currently in Creswell’s UGB suitable for the type of projected employment growth in terms of their size, type, location, and availability of public services.
The remainder of this Executive Summary describes our findings on the inventory of buildable land in Creswell’s UGB, economic conditions, projected employment growth in Creswell, the resulting demand for non-residential land, and a comparison of demand and supply conditions. This Executive Summary ends with a discussion of the next steps in this study.
SUPPLY OF BUILDABLE LAND A cursory review of the buildable lands inventory in Chapter 2 shows that the
City has about 137 acres available for commercial and industrial development. Of that land, about 66 acres are designated for industrial use, 48 for commercial use, and 22 for commercial-resort uses.
Creswell Economic Opportunities ECONorthwest March 2005 Page iii
A more detailed evaluation, however, suggests that Creswell has a more limited inventory of industrial lands. All of Creswell’s available industrial lands is in only eight parcels, and two of these parcels have two-thirds of Creswell’s available industrial acreage (one with 18 acres and another with 27 acres). The limited number of industrial parcels limits the size range of available parcels and may restrict market choice for certain types of industries interested in locating in Creswell. A more detailed discussion of site needs of potential industries is presented in Chapter 6 of this report.
For commercial lands, several of the sites have access restrictions and do not appear to be desirable sites for commercial uses. These sites, located north of Oregon Avenue and east of Highway 99, are surrounded by residential development. Portions of the sites that are close to I-5 may have some potential for commercial or light industrial use, but any use that generates heavy traffic will cause use conflicts with nearby residences. Moreover, access to the site would need significant improvements to accommodate uses that generate a lot of traffic.
We found that land designated for commercial-resort use has been primarily developed as housing. For this study, we assumed that only 17% of vacant lands designated for commercial-resort use would be in commercial uses. The most likely location for commercial uses is across from the Emerald Valley Resort Clubhouse at the intersection of Dale Kuni Road and Emerald Parkway.
ECONOMIC CONDITIONS Population growth has occurred at a faster rate in Creswell than in Lane
County or Oregon in every decade since the 1970s. Growth in Creswell has been fueled by its proximity to Eugene-Springfield, relatively lower housing costs, and desirable small-town atmosphere.
Employment growth in Creswell has been relatively flat over the few recent years for which data is available. But Creswell has recently seen some substantial development and business activity with the revitalization of the Emerald Valley Resort, residential development around the resort, and the development of the Creswell Marketplace shopping center and surrounding commercial uses east of I-5.
Creswell has a relatively diverse economy, with an employment distribution similar to that for Lane County as a whole. Major employment industries within Creswell’s UGB include Education, Manufacturing, Retail Trade, and Health Care/Social Assistance.
The latest population forecast from the Lane Council of Governments (LCOG) shows that Creswell is expected to grow faster than Lane County or any city in Lane County except Coburg over the 2004–2025 period. LCOG did not forecast employment growth in Lane County or Creswell over this period. A ten-year forecast by the Oregon Employment Department shows that total employment in Lane County is expected to grow by 17,500 jobs between 2002 and 2012. Employment growth in Lane County is expected to be led by Retail Trade, Services, Government, Finance/Insurance/Real Estate, and Manufacturing.
Page iv ECONorthwest March 2005 Creswell Economic Opportunities
Creswell’s comparative advantage for attracting business activity is determined by the mix of productive factors present in Creswell relative to other communities in the Willamette Valley. Creswell’s primary comparative advantage is its proximity to larger urban areas and location on I-5 combined with its small-town character. This makes Creswell attractive to residents and businesses who want to live and work in a community with small-town character but that still need to have access to urban amenities, a large and skilled workforce, and supplies and services available in larger communities as well as access to major transportation networks.
Economic conditions in Creswell are discussed in more detail in Chapters 3 and 4. Regional economic trends and conditions in Creswell, including Creswell’s comparative advantages, were the basis for developing the projection of employment growth summarized in the next section.
EMPLOYMENT GROWTH IN CRESWELL Given the expected rapid growth of population in Creswell relative to the
County and the implications for the ratio of population to employment, an annual average growth rate of 2.2% was selected for total employment growth in Creswell. This fits with the expectation that Creswell will receive an increasing share of employment growth in Lane County as it becomes a more fully developed community, and growth from spillover caused by increasingly crowded and expensive conditions in Eugene-Springfield.
Based on expected economic trends in Lane County and Creswell, the share of Creswell’s employment in Industrial and Commercial uses was assumed to increase slightly while the share of employment in Public uses was assumed to decline. The result of these assumptions applied to the existing level of employment in Creswell is shown in Table 1 below.
Table 1. Projected employment growth by land use type in the Creswell UGB, 2003–2023 Land Use 2003-25Type Employment % of Total Employment % of Total GrowthIndustrial 476 33% 825 35% 349Commercial 781 53% 1298 55% 517Public 205 14% 236 10% 31Total 1,462 100% 2,360 100% 898
2003 2025
Source: ECONorthwest.
SUPPLY AND DEMAND FOR NON-RESIDENTIAL LAND IN CRESWELL
We used assumptions about the number of employees per acre for the three land use types shown in Table 1 to translate employment growth to demand for land. These assumptions of employees per acre are based on observation of actual densities at employment sites. Table 2 shows the level of expected employment
Creswell Economic Opportunities ECONorthwest March 2005 Page v

growth, the resulting demand for non-residential land, the existing supply of buildable non-residential land, the resulting surplus or deficit of land in Creswell.
Table 2. Comparison of land demand and supply, Creswell UGB, 2004-2025
Land use typeTotal emp
growthEmp per net acre
Demand (net buildable
acres)
Supply (net buildable
acres)Surplus/(
Deficit)Commercial 349 35 10.0 67.8 57.9Industrial 517 20 25.9 67.1 41.3Public 31 15 0.0 0.0 0.0Total 897 35.8 134.9 99.1
Source: ECONorthwest. Note: Buildable land supply includes land designated for commercial and commercial/resort uses. We allocated 17% of the total commercial/resort land to commercial uses, with the remaining 83% going for residential uses. Public land demand is set to zero because the City and School District report that they have sufficient land to accommodate their expected growth.
Table 2 indicates that Creswell has an adequate supply of buildable Commercial and Industrial land. This comparison of demand and supply, however, focuses only on the total acreage. An analysis of the specific sites available in Creswell may suggest supply constraints not apparent in Table 2. All of Creswell’s available industrial land is located in two sites at the north and south end of Highway 99. Each of these sites have several large parcels with a few owners.
The north industrial site currently does not have access to sewer facilities, but a line should be extended to this site within two years. The south industrial site is separated from Highway 99 by the railroad and a slough that will require a bridge to access Highway 99 from this site. Alternative access to this site may be provided by Park Drive, but this alternative may be limited by residential structures in the area.
An analysis of the distribution of vacant and partially-vacant parcels by size, as shown in Table 2-4 in Chapter 2, suggests that Creswell’s supply of buildable industrial sites does not have a range of sizes that will allow Creswell to respond to market opportunities. The distribution of industrial parcels in Creswell raises several issues for the availability of buildable land for economic development, including:
• In any market, not all vacant and partially-vacant parcels are on the market or available for development in the immediate future. Thus, it is likely that even fewer industrial parcels than those shown in Chapter 2 are on the market or available for development in the immediate future.
• Many of the types of manufacturing firms that have potential to locate in Creswell need relatively small sites in the range of 0.25 to 5 acres. Chapter 2 shows that there are only three parcels in Creswell in the range of 1 to 4.9 acres, and these parcels are too large for small specialty manufacturers who want a site less than 1 acre.
Page vi ECONorthwest March 2005 Creswell Economic Opportunities
In addition to the limited distribution of industrial sites in Creswell, other factor suggests that Creswell may not have the right supply of buildable industrial land to respond to market opportunities. Chapter 5 identifies airport-related uses as a potential growth industry in Creswell. The City, however, does not have any buildable industrial land in the airport area currently within the UGB.
NEXT STEPS Given the context established by this Economic Opportunities Analysis, there
are several steps the City of Creswell can take to attract the type of economic development desired in the community:
1. This report shows that Creswell lacks a supply of buildable industrial sites with a variety of sizes that will allow the community to respond to market opportunities. In addition, the small number of buildable industrial sites suggests that Creswell may not have any sites available for development when an opportunity presents itself. To address these constraints, the City should consider expanding the UGB to include more areas designated for industrial development. Areas around the airport should be among the sites considered for this expansion in order to take advantage of opportunities presented by that site.
2. Actions recommended in the 2004 Economic Development Plan for the City of Creswell include steps that would support employment growth in Creswell. These steps include creating State-certified market-ready development sites and working with ODOT on permitting for sites adjacent to highways and the railroad. The City should work with ODOT and OECDD to help resolve site access issues for the southern industrial site. The City could also pursue State certification of development sites, either now or after an expansion of the UGB.
3. The City has identified a vision and goals that are generally supportive of economic development in the community. The economic development planning to date, however, does not contain specific policies or actions the City should adopt to attract the type of development desired in the community. The next phase of this study will be the development on an implementation plan that identifies specific policies and actions the City might adopt to affect the level and type of economic development in the community.
Creswell Economic Opportunities ECONorthwest March 2005 Page vii

Table of Contents
Page
CHAPTER 1 INTRODUCTION .......................................................................1-1 BACKGROUND .......................................................................................................... 1-1 FRAMEWORK FOR ECONOMIC DEVELOPMENT PLANNING IN OREGON.......................... 1-2 ORGANIZATION OF THIS REPORT............................................................................... 1-3
CHAPTER 2 NON-RESIDENTIAL BUILDABLE LANDS INVENTORY ................2-1 METHODS ................................................................................................................ 2-1 FINDINGS ................................................................................................................. 2-4
Land by classification ........................................................................................ 2-4 Service constraints on non-residential land supply............................................ 2-7 Redevelopment potential ................................................................................... 2-8
SUMMARY .............................................................................................................. 2-10
CHAPTER 3 THE CRESWELL ECONOMY .....................................................3-1 OVERVIEW OF THE CRESWELL ECONOMY.................................................................. 3-1
Population ......................................................................................................... 3-1 Household income............................................................................................. 3-1 Employment....................................................................................................... 3-2 Business and development trends in Creswell .................................................. 3-5 Forecasts of economic growth in Creswell ........................................................ 3-6
NATIONAL ECONOMIC TRENDS .................................................................................. 3-9 ECONOMIC TRENDS IN OREGON AND LANE COUNTY................................................ 3-10
Population ....................................................................................................... 3-10 Personal income.............................................................................................. 3-12 Employment..................................................................................................... 3-13 Economic activity............................................................................................. 3-14 Public policy..................................................................................................... 3-15 Outlook for growth in Oregon and Lane County .............................................. 3-15
CHAPTER 4 FACTORS AFFECTING FUTURE ECONOMIC DEVELOPMENT IN CRESWELL........................................................................................4-1 WHAT IS COMPARATIVE ADVANTAGE? ....................................................................... 4-1 LOCATION ................................................................................................................ 4-2 BUILDABLE LAND ...................................................................................................... 4-2 LABOR FORCE .......................................................................................................... 4-3 HOUSING ................................................................................................................. 4-6 PUBLIC SERVICES..................................................................................................... 4-7
Planning and support for economic development.............................................. 4-7
Creswell Economic Opportunities ECONorthwest March 2005 Page i
Water................................................................................................................. 4-9 Wastewater...................................................................................................... 4-10 Utilities............................................................................................................. 4-10
TRANSPORTATION.................................................................................................. 4-10 RENEWABLE AND NON-RENEWABLE RESOURCES..................................................... 4-11 QUALITY OF LIFE .................................................................................................... 4-12 CRESWELL’S COMPARATIVE ADVANTAGES .............................................................. 4-13
CHAPTER 5 EMPLOYMENT FORECAST .......................................................5-1 EMPLOYMENT BASE FOR PROJECTION....................................................................... 5-1 POTENTIAL GROWTH INDUSTRIES IN CRESWELL ........................................................ 5-3 PROJECT OF TOTAL EMPLOYMENT ............................................................................ 5-3 ALLOCATION OF EMPLOYMENT TO LAND-USE TYPES .................................................. 5-5
CHAPTER 6 CONCLUSION ..........................................................................6-1 BUILDABLE LANDS .................................................................................................... 6-1
APPENDIX A DATA DEFINITIONS AND CONVENTIONS............................... A-1 97426 ZIP CODE AREA ..............................................................................................A-1
Page ii ECONorthwest March 2005 Creswell Economic Opportunities

Chapter 1 Introduction
BACKGROUND Creswell had the highest growth rate of any community in Lane County in the
1990s, fueled by its proximity to Eugene-Springfield, relatively lower housing costs, and desirable small-town atmosphere. Rapid population growth has caused substantial residential development in Creswell, but commercial development has been sporadic and industrial development stagnant. The result is that Creswell has increasingly become a bedroom community for residents that work elsewhere.
Expected future population and employment growth in Lane County will create an opportunity for economic development and employment growth in Creswell. However, Creswell does not have all of the plans, policies, and technical data needed to guide economic development in the community. To address these needs, the City of Creswell has recently undertaken several initiatives, including:
• Development of an Economic Development Strategic Plan that identifies an economic development vision for the community and general industries to target for development.
• Creation of an Economic Development Subcommittee of the City Council, which will provide ongoing support and leadership for economic development in the community.
• Development of a master plan for the quadrant formed by I-5, Oregon Avenue, Mill Street, and the lumber mill that will identify a local street network and general land uses in this central area.
• Preparation of a Creswell Urban Growth Boundary Land Analysis that identified the supply of vacant land in Creswell’s Urban Growth Boundary in 2001.
Despite these initiatives, Creswell still does not have a full assessment of its economic development opportunities, an updated inventory of its buildable land supply, or an assessment of potential economic development policies it could implement to encourage desired growth in the community. Oregon Statewide Planning Goal 9 requires comprehensive plans to:
• Include an analysis of the community's economic patterns, potentialities, strengths, and deficiencies as they relate to state and national trends;
• Contain policies concerning the economic development opportunities in the community; and
• Provide for at least an adequate supply of sites of suitable sizes, types, locations, and service levels for a variety of industrial and commercial uses consistent with plan policies.
Creswell Economic Opportunities ECONorthwest March 2005 Page 1-1
This project is intended to meet these Goal 9 requirements and provide the City of Creswell with strategies to implement economic development policies. These results will be summarized in two reports: an Economic Opportunities Analysis and an Implementation Plan. These reports will have the following components:
• An assessment of national, state, and local economic trends that lead to an estimate of short- and long-term demand for commercial and industrial land in Creswell.
• A determination of the supply of buildable land in acres by type that is available to accommodate growth in Creswell.
• A comparison of land demand and supply.
• Short- and long-term strategies for implementing policies and actions to address land supply issues (if any) and to encourage the type of growth desired in Creswell.
The project is divided into two phases, each ending in a report. This report, the Economic Opportunity Analysis, is the product for the first phase, which focuses on describing past economic conditions, and likely and possible economic futures. It provides the base of information for a more detailed discussion of policy and implementation that will occur in the second phase, which will end with a second report: Development Strategies.
FRAMEWORK FOR ECONOMIC DEVELOPMENT PLANNING IN OREGON
The content of this report is designed to meet the requirements of Oregon Statewide Planning Goal 9 and the administrative rule that implements Goal 9 (OAR 660-009). The framework for economic development planning in Oregon is defined by OAR 660-009, which requires three key elements:
1. Economic Opportunities Analysis (OAR 660-009-0015). The Economic Opportunities Analysis (EOA) requires communities to review national and state trends, assess community economic development potential, identify industries reasonably expected to expand or locate in the area, and identify site requirements of these industries. The EOA must also include an inventory of lands available for commercial and industrial development.
2. Industrial and commercial development policies (OAR 660-009-0020). Cities with a population over 2,500 are required to develop policies based on the EOA. The policies must include community development objectives and identify categories or particular types of industrial and commercial uses desired by the community. Consistent with the community development objectives, cities must adopt policies to designate an adequate number of sites of suitable sizes, types and locations for desired industrial and commercial uses. Cities must also ensure necessary public facilities through the public facilities plan for the planning area.
Page 1-2 ECONorthwest March 2005 Creswell Economic Opportunities

3. Designation of lands for industrial and commercial uses (OAR 660-009-0025. Cities must adopt appropriate implementing measures including: (1) identification of needed sites; (2) assessment of the long-term supply of land available for commercial and industrial uses; and (3) evaluation of the short-term supply of serviceable sites.
This report is an Economic Opportunities Analysis, the first key element required by Goal 9. This EOA will be followed by a Development Strategies report that will identify potential policies and actions that the City of Creswell could adopt to meet the second key element required by Goal 9.
This EOA also includes an employment forecast that leads to identification of needed development sites, and an updated inventory of buildable commercial and industrial land in Creswell. These elements of the EOA will address part of the third key element required by Goal 9. However, this study does not include the analysis of potential urban expansion areas that will be required if an expansion of the Urban Growth Boundary is needed to provide a long-term supply of buildable commercial and industrial land in Creswell.
ORGANIZATION OF THIS REPORT This report is organized as follows:
Chapter 1: Introduction describes the theoretical background for the methods and analysis in this report in terms of building quality communities and the economics of location decisions by households and firms. This chapter also summarizes key City goals and policies related to economic development.
Chapter 2: Non-Residential Buildable Lands Inventory reports the results of the buildable lands analysis to identify the amount, size distribution, and location of buildable commercial and industrial sites in Creswell.
Chapter 3: The Creswell Economy contains an overview of the Creswell economy, a review of national and statewide trends and forecasts as the context for economic growth in Creswell, and previous forecasts of population and employment growth developed for Creswell.
Chapter 4: Factors Affecting Future Economic Development in Creswell discusses the condition of these factors in Creswell and how this compares with other locations in the southern Willamette Valley region. The factors included in this chapter are location, buildable land, labor force, housing, public services, transportation, renewable and non-renewable resources, and quality of life. This chapter ends with a discussion of Creswell’s comparative advantages for economic development.
Chapter 5: Employment Forecast presents an employment forecast for Creswell based on expected economic conditions at the national, state, and regional level and previous forecasts for growth in Creswell as described in Chapter 2 and local factors affecting economic development described in Chapter 3.
Creswell Economic Opportunities ECONorthwest March 2005 Page 1-3

Chapter 6: Conclusion summarizes key points from the previous chapters and makes a preliminary identification of potential economic development policies.
Page 1-4 ECONorthwest March 2005 Creswell Economic Opportunities

Non-Residential Buildable
Chapter 2 Lands Inventory
This chapter presents the non-residential buildable lands inventory for the City of Creswell. The results are based on analysis of Geographic Information System data provided by the Lane Council of Governments (LCOG). The analysis used aerial orthophotographs, discussions with City staff, and field visits to verify land classifications. The chapter begins with a discussion of the buildable lands inventory methodology, then presents maps and tables summarizing the inventory.
METHODS As required by OAR 660-009-0015(3), the Economic
Opportunities Analysis (EOA) for Creswell includes an updated estimate of the supply of buildable commercial and industrial land. The initial geographic scope of the study is all land designated for commercial or industrial inside the Creswell UGB. According to the Lane Council of Governments, the City prepared a Land Analysis in 2001 that did not disaggregate commercial and industrial lands or address the issue of infrastructure constraints.
ECO began the buildable lands analysis with a tax lot database provided by the Lane Council of Governments. The tax lot database originated from the Lane County Assessor and was current as of October 2004.1 The data were updated to December 2004 through local review and include recent development not reflected in the assessor’s data. The supply analysis builds from the tax lot-level database to estimates of buildable land by plan designation.
The method applied by ECONorthwest resulted in a database structure that facilitates a summary of land supply that can be cross-referenced geographically, by plan designation, and other variables. The general structure is based on the DLCD HB 2709 Workbook, and is consistent with the methods used by LCOG in the 2001 inventory. As outlined in the Workbook, the steps and sub-steps in the supply inventory are:
1. Calculate the gross vacant acres by plan designation, including fully vacant and partially vacant tax lots.
2. Calculate gross buildable vacant acres by plan designation by subtracting unbuildable acres from total acres.
3. Calculate net buildable acres by plan designation by subtracting land for future public facilities from gross buildable vacant acres.
1 The parcel-level database was based on information from the Lane County Assessor through the Lane Council of Governments The
base data was supplemented with additional land use data and local review by City staff.
Creswell Economic Opportunities Analysis ECONorthwest March 2005 Page 2-1
4. Calculate total net buildable acres by plan designation by adding redevelopable acres to net buildable acres.
The next step in the buildable lands analysis was to classify each tax lot into a set of mutually exclusive categories. ECO developed a set of working definitions that specify the rules with input from City staff. As a first step, we classified all tax lots in the UGB into one of the following categories:
• Vacant land. Tax lots that have no structures or have buildings with very little value. For the purpose of this inventory, lands with improvement values under $10,000 were initially identified as vacant.2
• Partially vacant land. Tax lots that are occupied by a use but which contain enough land to be further subdivided without need of rezoning. Partially vacant commercial and industrial tax lots were identified by analysis of GIS data, aerial photographs, and fieldwork.
• Undevelopable land. Land that is under the minimum lot size for the underlying zoning district, land that has no access or potential access, or land that is already committed to other uses by policy. Consistent with the 2001 LCOG inventory, ECO used a threshold of 2,500 square feet to identify undevelopable land in combination with aerial photos and building footprints.
• Developed land. Land that is developed at densities consistent with zoning and improvements that make it unlikely to redevelop during the analysis period. Lands not classified as vacant, partially-vacant, or undevelopable are considered developed.
• Redevelopable land. Land on which development has already occurred but on which, due to present or expected market forces, there exists the potential that existing development will be converted to more intensive uses during the planning period. Redevelopable land includes lands designated for commercial and industrial uses with improvement to land value ratios of less that 1:1. Redevelopable land is a subset of developed land.
The land classifications result in identification of lands that are vacant or partially vacant. The inventory includes all commercial and industrial lands within the Creswell UGB. Figure 2-1 shows lands by plan designation within the Creswell UGB.
2 Some lands initially identified as vacant were later reclassified due to pending development.
Page 2-2 ECONorthwest March 2005 Creswell Economic Opportunities Analysis
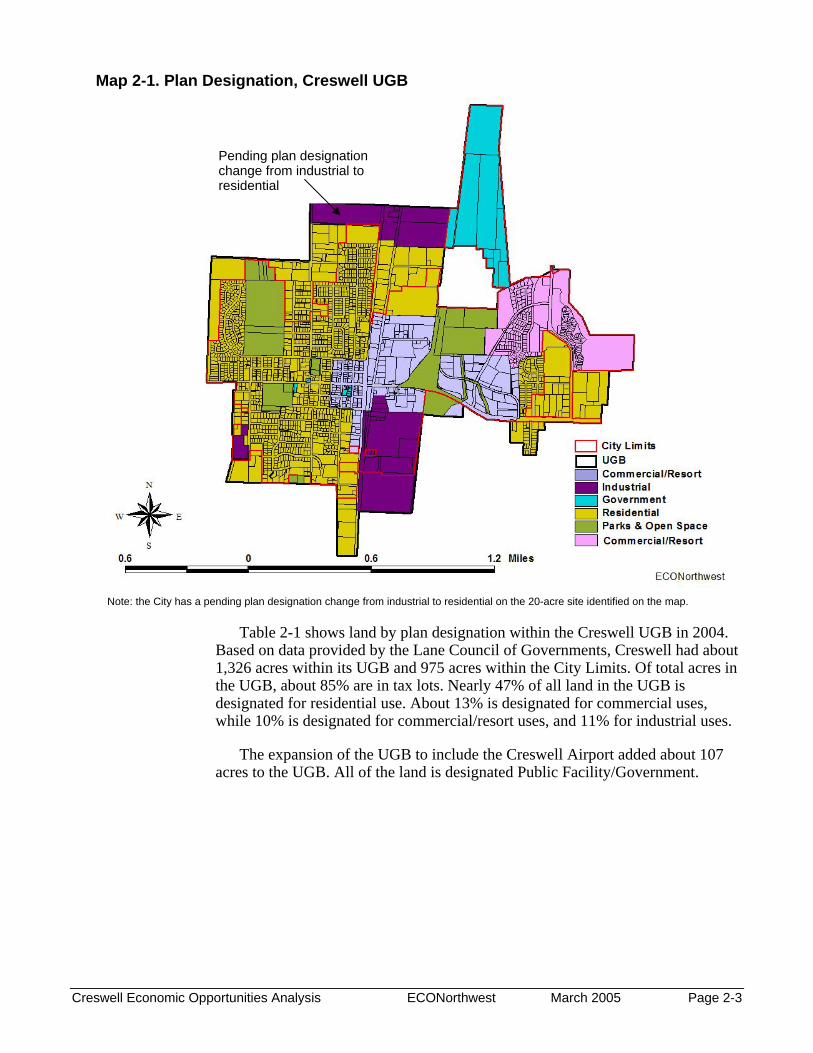
Map 2-1. Plan Designation, Creswell UGB
Pending plan designation change from industrial to residential
Note: the City has a pending plan designation change from industrial to residential on the 20-acre site identified on the map.
Table 2-1 shows land by plan designation within the Creswell UGB in 2004. Based on data provided by the Lane Council of Governments, Creswell had about 1,326 acres within its UGB and 975 acres within the City Limits. Of total acres in the UGB, about 85% are in tax lots. Nearly 47% of all land in the UGB is designated for residential use. About 13% is designated for commercial uses, while 10% is designated for commercial/resort uses, and 11% for industrial uses.
The expansion of the UGB to include the Creswell Airport added about 107 acres to the UGB. All of the land is designated Public Facility/Government.
Creswell Economic Opportunities Analysis ECONorthwest March 2005 Page 2-3
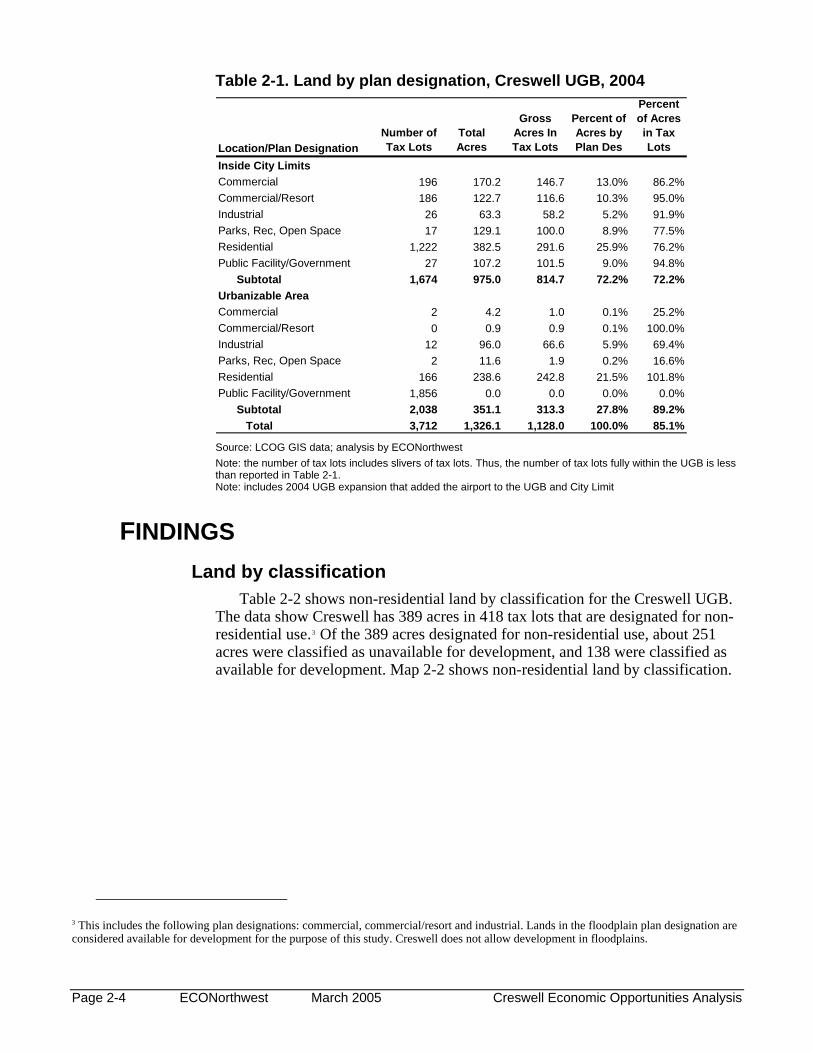
Table 2-1. Land by plan designation, Creswell UGB, 2004
Location/Plan DesignationNumber of Tax Lots
Total Acres
Gross Acres In Tax Lots
Percent of Acres by Plan Des
Percent of Acres in Tax Lots
Inside City LimitsCommercial 196 170.2 146.7 13.0% 86.2%Commercial/Resort 186 122.7 116.6 10.3% 95.0%Industrial 26 63.3 58.2 5.2% 91.9%Parks, Rec, Open Space 17 129.1 100.0 8.9% 77.5%Residential 1,222 382.5 291.6 25.9% 76.2%Public Facility/Government 27 107.2 101.5 9.0% 94.8%
Subtotal 1,674 975.0 814.7 72.2% 72.2%Urbanizable AreaCommercial 2 4.2 1.0 0.1% 25.2%Commercial/Resort 0 0.9 0.9 0.1% 100.0%Industrial 12 96.0 66.6 5.9% 69.4%Parks, Rec, Open Space 2 11.6 1.9 0.2% 16.6%Residential 166 238.6 242.8 21.5% 101.8%Public Facility/Government 1,856 0.0 0.0 0.0% 0.0%
Subtotal 2,038 351.1 313.3 27.8% 89.2%Total 3,712 1,326.1 1,128.0 100.0% 85.1%
Source: LCOG GIS data; analysis by ECONorthwest Note: the number of tax lots includes slivers of tax lots. Thus, the number of tax lots fully within the UGB is less than reported in Table 2-1. Note: includes 2004 UGB expansion that added the airport to the UGB and City Limit
FINDINGS Land by classification
Table 2-2 shows non-residential land by classification for the Creswell UGB. The data show Creswell has 389 acres in 418 tax lots that are designated for non-residential use.3 Of the 389 acres designated for non-residential use, about 251 acres were classified as unavailable for development, and 138 were classified as available for development. Map 2-2 shows non-residential land by classification.
3 This includes the following plan designations: commercial, commercial/resort and industrial. Lands in the floodplain plan designation are considered available for development for the purpose of this study. Creswell does not allow development in floodplains.
Page 2-4 ECONorthwest March 2005 Creswell Economic Opportunities Analysis

Table 2-2. Non-residential land by classification, Creswell UGB, 2004
ClassificationNumber of Tax Lots
Gross Acres
Gross Buildable
AcresDeveloped 356 237.3 0.0Undevelopable 10 0.2 0.0Partially Vacant 8 36.8 25.6Vacant 44 114.1 111.9
Total 418 388.5 137.5 Source: LCOG GIS data; analysis by ECONorthwest
Map 2-2. Non-residential land by classification, Creswell UGB, 2004
Table 2-3 shows non-residential land by plan designation in the Creswell UGB. The results show that about 48% of all non-residential land is designated for industrial uses, about 35% for commercial uses, and 16% for commercial-resort uses.
Creswell Economic Opportunities Analysis ECONorthwest March 2005 Page 2-5

Table 2-3. Non-residential land by plan designation, Creswell UGB, 2004
Location/Plan Designation
Number of Tax Lots
Gross Acres
Percent of Gross
Acres
Gross Buildable
Acres
Percent of Gross
Buildable Acres
Inside City LimitsCommercial 198 146.9 37.8% 48.7 35.4%Commercial/Resort 180 115.8 29.8% 22.6 16.4%Industrial 26 58.0 14.9% 6.4 4.6%
Subtotal 404 320.6 82.5% 77.6 56.4%Urbanizable Area
Commercial 2 1.0 0.3% 0.0 0.0%Commercial/Resort 1 0.5 0.1% 0.0 0.0%Industrial 12 66.2 17.1% 59.9 43.6%
Subtotal 15 67.8 17.5% 59.9 43.6%Total 419 388.5 100.0% 137.5 100.0%
Source: LCOG GIS data; analysis by ECONorthwest
Table 2-4 shows vacant and partially vacant non-residential land by plan designation and tax lot size in the Creswell UGB. The acreage figures include the only the vacant portions of partially vacant tax lots. The results show that about 42% of vacant or partially vacant non-residential tax lots are under one acre in area, and 84% are under five acres in area. In terms of acres, however, 60% of the total land area is in eight tax lots over five acres in size. All of the tax lots over 10 acres in area are designated for industrial uses.
Table 2-4. Vacant and partially vacant non-residential land by plan designation and tax lot size, Creswell UGB, 2004
Plan Designation <0.250.25-0.49
0.50-0.99
1.00-1.99
2.00-4.99
5.00-9.99
10.00-19.99 20.00+ Total
Number of Tax LotsCommercial 12 1 5 11 5 2 36Commercial/Resort 1 1 2 2 6Industrial 1 1 2 2 1 1 8
Total 14 2 5 12 9 6 1 1Number of Acres
Commercial 1.3 0.4 4.5 14.7 16.8 11.0 48.7Commercial/Resort 0.2 0.4 8.8 13.2 22.6Industrial 0.1 1.3 6.5 14.0 17.9 26.6 66.3
Total 1.5 0.7 4.5 16.0 32.1 38.2 17.9 26.6 137.5Percent of Tax Lots 28% 4% 10% 24% 18% 12% 2% 2% 100%Percent of Acres 1% 1% 3% 12% 23% 28% 13% 19% 100%Average Lot Size 0.1 0.4 0.9 1.3 3.6 6.4 17.9 26.6 2.8
Lot Size (Gross Buildable Acres)
50
Source: City of Creswell buildable land database, analysis by ECONorthwest Note: acreages do not include developed portions of partially vacant tax lots
Page 2-6 ECONorthwest March 2005 Creswell Economic Opportunities Analysis
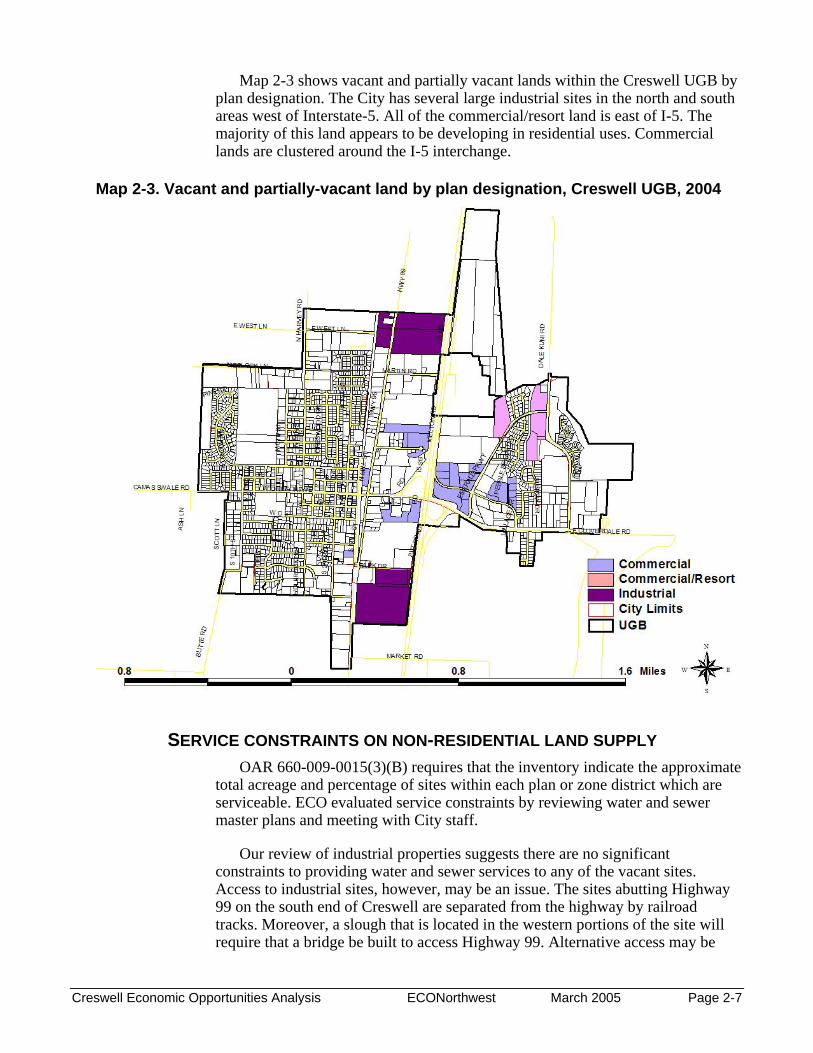
Map 2-3 shows vacant and partially vacant lands within the Creswell UGB by plan designation. The City has several large industrial sites in the north and south areas west of Interstate-5. All of the commercial/resort land is east of I-5. The majority of this land appears to be developing in residential uses. Commercial lands are clustered around the I-5 interchange.
Map 2-3. Vacant and partially-vacant land by plan designation, Creswell UGB, 2004
SERVICE CONSTRAINTS ON NON-RESIDENTIAL LAND SUPPLY OAR 660-009-0015(3)(B) requires that the inventory indicate the approximate
total acreage and percentage of sites within each plan or zone district which are serviceable. ECO evaluated service constraints by reviewing water and sewer master plans and meeting with City staff.
Our review of industrial properties suggests there are no significant constraints to providing water and sewer services to any of the vacant sites. Access to industrial sites, however, may be an issue. The sites abutting Highway 99 on the south end of Creswell are separated from the highway by railroad tracks. Moreover, a slough that is located in the western portions of the site will require that a bridge be built to access Highway 99. Alternative access may be
Creswell Economic Opportunities Analysis ECONorthwest March 2005 Page 2-7

possible via Park Drive; however, several existing residential structures may constrain this option.
The industrial sites on the north end of Creswell presently do not have access to sewer facilities. According to City staff, a planned residential development in the northwest area of Creswell will require sewer lines be extended. The plan is to place an interceptor under the railroad tracks which would provide sewer service to the industrial sites. The upgrade is scheduled to occur within two years.
All of the lands within the UGB east of Interstate 5 are serviced by a privately-owned sewer system. Technically this could be considered a constraint. However, considerable development of the commercial and commercial-resort land east of Interstate 5 has occurred in recent years. This shows that the private owner is allowing development to occur as the market dictates.
REDEVELOPMENT POTENTIAL Redevelopment potential deals primarily with developed land where the ratio
of improvement-to-land value is less than 1:14. Not all, or even a majority of parcels that meet these criteria for redevelopment potential will be assumed to redevelop during the planning period. The issue of how much land might redevelop over the planning period is discussed in Chapter 6.
As a starting point, we plotted the distribution of improvement-to-land-value ratios for all residential parcels classified as developed. 5 Figure 2-1 shows the distribution of improvement-to-land values for all developed non-residential land in Creswell. The figure shows that the largest category of land with improvement-to-land value ratios of less than 1:1 is in the 0.00-0.24 category (nearly 40 acres). Because these parcels have improvement values that are less than one-quarter of the land value, they can be considered the most ripe for redevelopment.
4 In the context of a buildable lands inventory, we are only interested in redevelopment that increases the density or intensity of use.
5 Developed parcels include parcels that are fully developed, and the developed portion of partially developed parcels.
Page 2-8 ECONorthwest March 2005 Creswell Economic Opportunities Analysis
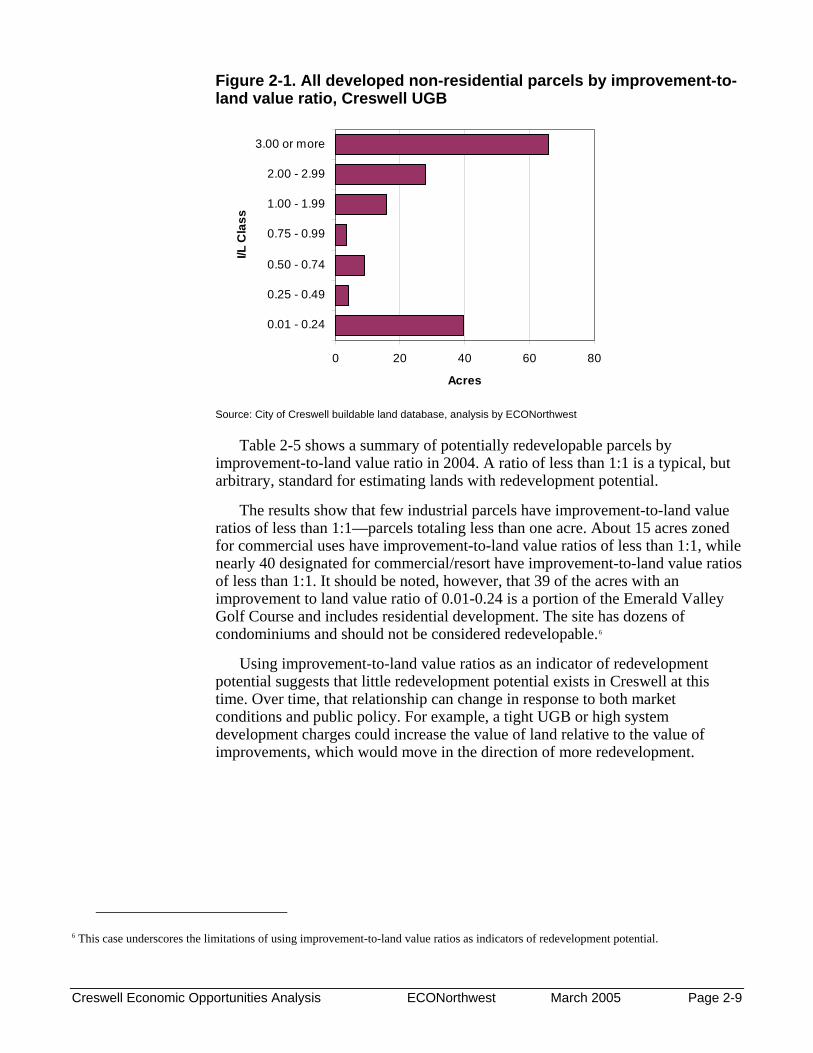
Figure 2-1. All developed non-residential parcels by improvement-to-land value ratio, Creswell UGB
0 20 40 60 8
0.01 - 0.24
0.25 - 0.49
0.50 - 0.74
0.75 - 0.99
1.00 - 1.99
2.00 - 2.99
3.00 or more
I/L C
lass
Acres
0
Source: City of Creswell buildable land database, analysis by ECONorthwest
Table 2-5 shows a summary of potentially redevelopable parcels by improvement-to-land value ratio in 2004. A ratio of less than 1:1 is a typical, but arbitrary, standard for estimating lands with redevelopment potential.
The results show that few industrial parcels have improvement-to-land value ratios of less than 1:1—parcels totaling less than one acre. About 15 acres zoned for commercial uses have improvement-to-land value ratios of less than 1:1, while nearly 40 designated for commercial/resort have improvement-to-land value ratios of less than 1:1. It should be noted, however, that 39 of the acres with an improvement to land value ratio of 0.01-0.24 is a portion of the Emerald Valley Golf Course and includes residential development. The site has dozens of condominiums and should not be considered redevelopable.6
Using improvement-to-land value ratios as an indicator of redevelopment potential suggests that little redevelopment potential exists in Creswell at this time. Over time, that relationship can change in response to both market conditions and public policy. For example, a tight UGB or high system development charges could increase the value of land relative to the value of improvements, which would move in the direction of more redevelopment.
6 This case underscores the limitations of using improvement-to-land value ratios as indicators of redevelopment potential.
Creswell Economic Opportunities Analysis ECONorthwest March 2005 Page 2-9
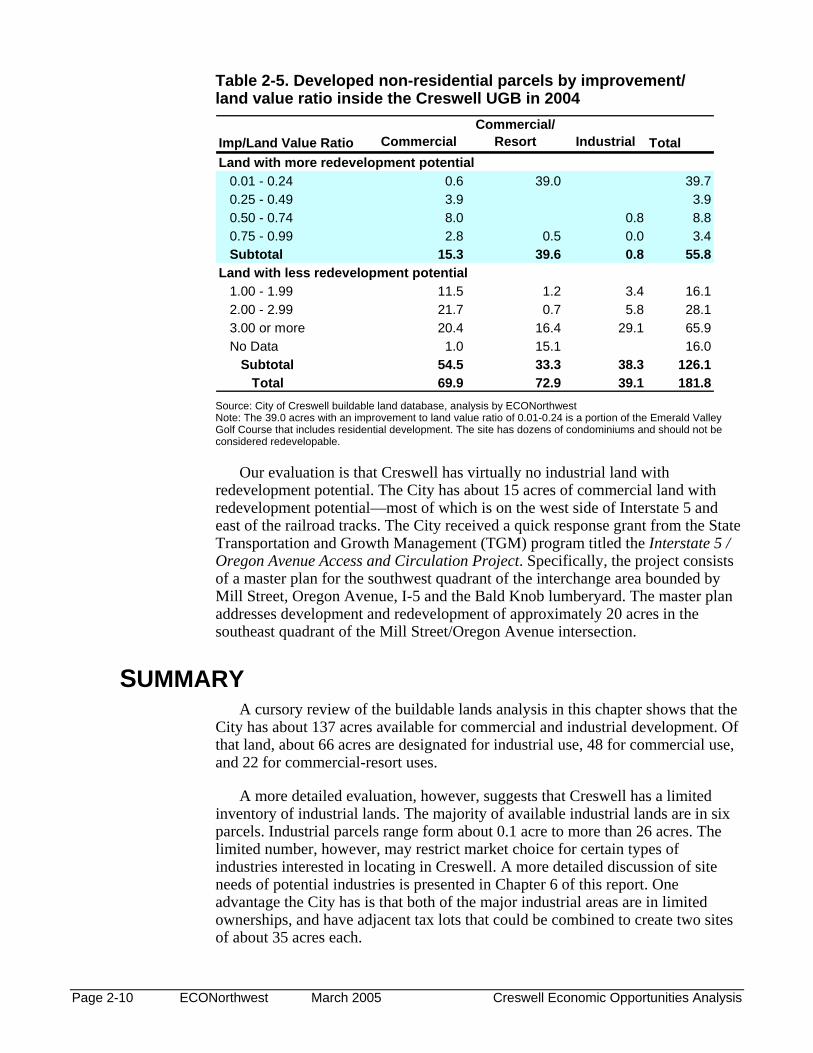
Table 2-5. Developed non-residential parcels by improvement/ land value ratio inside the Creswell UGB in 2004
Imp/Land Value Ratio CommercialCommercial/
Resort Industrial TotalLand with more redevelopment potential
0.01 - 0.24 0.6 39.0 39.70.25 - 0.49 3.9 3.90.50 - 0.74 8.0 0.8 8.80.75 - 0.99 2.8 0.5 0.0 3.4Subtotal 15.3 39.6 0.8 55.8
Land with less redevelopment potential1.00 - 1.99 11.5 1.2 3.4 16.12.00 - 2.99 21.7 0.7 5.8 28.13.00 or more 20.4 16.4 29.1 65.9No Data 1.0 15.1 16.0
Subtotal 54.5 33.3 38.3 126.1Total 69.9 72.9 39.1 181.8
Source: City of Creswell buildable land database, analysis by ECONorthwest Note: The 39.0 acres with an improvement to land value ratio of 0.01-0.24 is a portion of the Emerald Valley Golf Course that includes residential development. The site has dozens of condominiums and should not be considered redevelopable.
Our evaluation is that Creswell has virtually no industrial land with redevelopment potential. The City has about 15 acres of commercial land with redevelopment potential—most of which is on the west side of Interstate 5 and east of the railroad tracks. The City received a quick response grant from the State Transportation and Growth Management (TGM) program titled the Interstate 5 / Oregon Avenue Access and Circulation Project. Specifically, the project consists of a master plan for the southwest quadrant of the interchange area bounded by Mill Street, Oregon Avenue, I-5 and the Bald Knob lumberyard. The master plan addresses development and redevelopment of approximately 20 acres in the southeast quadrant of the Mill Street/Oregon Avenue intersection.
SUMMARY A cursory review of the buildable lands analysis in this chapter shows that the
City has about 137 acres available for commercial and industrial development. Of that land, about 66 acres are designated for industrial use, 48 for commercial use, and 22 for commercial-resort uses.
A more detailed evaluation, however, suggests that Creswell has a limited inventory of industrial lands. The majority of available industrial lands are in six parcels. Industrial parcels range form about 0.1 acre to more than 26 acres. The limited number, however, may restrict market choice for certain types of industries interested in locating in Creswell. A more detailed discussion of site needs of potential industries is presented in Chapter 6 of this report. One advantage the City has is that both of the major industrial areas are in limited ownerships, and have adjacent tax lots that could be combined to create two sites of about 35 acres each.
Page 2-10 ECONorthwest March 2005 Creswell Economic Opportunities Analysis

For commercial lands, several of the sites have access restrictions and do not appear to be desirable sites for commercial uses. These sites, located north of Oregon Avenue and east of Highway 99, are surrounded by residential development. Portions of the sites that are close to I-5 may have some potential for commercial or light industrial use, but any use that generates heavy traffic will cause use conflicts with nearby residences. Moreover, access to the site would need significant improvements to accommodate uses that generate a lot of traffic.
Commercial lands east of I-5 have a potential service constraint as the area is served by a private sewer system. Recent developments in the area, however, suggest this is not much of a limiting factor. It is likely that the area will continue to develop as demand dictates.
Finally, a lot of the land that is designated for commercial-resort use has been developed as housing. The Creswell Economic Development Plan, assumed that only 17% of vacant lands designated for commercial-resort use would be in commercial uses. The most likely location for commercial uses is across from the Emerald Valley Resort Clubhouse at the intersection of Dale Kuni Road and Emerald Parkway.
Creswell Economic Opportunities Analysis ECONorthwest March 2005 Page 2-11

Chapter 3 The Creswell Economy
OVERVIEW OF THE CRESWELL ECONOMY POPULATION
Table 3-1 shows population growth trends in Oregon, Lane County, and Creswell between 1970 and 2003. Population in Creswell has more than tripled over the 33-year period shown in Table 3-1, growing from 1,199 in 1970 to 3,990 in 2003. Creswell’s population in 2003 was only 1.2% of population in Lane County and 0.1% of population in Oregon.
Relatively modest amounts of population growth in communities with a small population base, such as Creswell, can result in relatively high rates of population growth in percentage terms. Table 3-1 shows that the average annual population growth rate in Creswell has outpaced both county and statewide growth rates over the 1970-2003 period, with Creswell’s average annual growth rates by decade ranging between 3.2% and 4.0%. In comparison, population in Lane County grew more slowly than for Oregon as a whole except in the 1970–1980 period, with average annual growth rates by decade ranging between 0.3% and 2.5%. More rapid growth in Creswell has caused its share of population in Lane County to grow from 0.6% in 1970 to 1.2% in 2003
Table 3-1. Population in Oregon, Lane County, and Creswell, 1970–2003
Area 1970 1980 1990 2000 2003 70-80 80-90 90-00 00-03Oregon 2,091,385 2,633,156 2,842,321 3,421,399 3,541,500 2.3% 0.8% 1.9% 1.2%Lane County 215,401 275,226 282,921 322,963 329,400 2.5% 0.3% 1.3% 0.7%Creswell 1,199 1,770 2,431 3,579 3,990 4.0% 3.2% 3.9% 3.7%Creswell% of Lane Co 0.6% 0.6% 0.9% 1.1% 1.2%
Average Annual Growth Rate
Source: U.S. Census (1970, 1980, 1990, 2000) and Population Research Center, Portland State University (2003 estimates). Average annual growth rates and Creswell’s percent of Lane County calculated by ECONorthwest. Note: Census counts as of April 1, Population Research Center estimates as of July 1.
While population has grown more rapidly in Creswell than in Lane County and Oregon since 1970, the average annual growth rates of Oregon, Lane County and Creswell move together overtime. Population growth rates in Oregon, Lane County, and Creswell were higher over the 1970–1980 period, dropped during the 1980–1990 period, rose again during the 1990–2000 period, and are showing a declining trend over the 2000–2003 period. The Creswell average annual growth rate has remained several points higher then either the state or the county average over the entire time period shown in Table 3-1.
HOUSEHOLD INCOME Table 3-2 shows the distribution of household income in Creswell, Lane
county, and Oregon in 1999. Compared to Lane County and Oregon, Creswell has
Creswell Economic Opportunities ECONorthwest March 2005 Page 3-1

a larger share of low-income households (with an annual income of less than $10,000) and middle-income households (with an annual income of $50,000 to $74,999). The share of Creswell households with an annual income of $10,000 to $49,999 is roughly similar to that in Lane County and Oregon, but Creswell has a lower share of households with annual incomes of $75,000 and over.
Table 3-2. Households by annual income in Creswell, Lane County, and Oregon, 1999 ($1999)
Lane County OregonIncome Range Households Percent Percent PercentLess than $10,000 201 15% 11% 9%$10,000 to $14,999 77 6% 7% 6%$15,000 to $24,999 190 15% 15% 13%$25,000 to $34,999 207 16% 14% 14%$35,000 to $49,999 236 18% 18% 18%$50,000 to $74,999 294 23% 19% 20%$75,000 to $99,999 58 4% 8% 10%$100,000 to $149,999 37 3% 5% 7%$150,000 to $199,999 0 0% 1% 2%$200,000 or more 0 0% 2% 2%Total 1,300 100% 100% 100%Median HH Income $34,053 $36,942 $40,916
City of Creswell
Source: U.S. Census, Profile of Selected Economic Characteristics: 2000.
EMPLOYMENT Table 3-3 shows covered employment by sector and industry within
Creswell’s Urban Growth Boundary (UGB). The data in Table 3-3 is based on confidential records for individual employers provided the Oregon Employment Department. Table 3-3 does not report employment in sectors where there are fewer than three firms in order to maintain the confidentiality of individual employers. The sectors with the largest level of 2003 employment in the Creswell UGB are Government, Manufacturing, Retail Trade, and Accommodation and Food Service. Together these industries account for 617 jobs or 57% of total employment in the Creswell area. A review of the data underlying Table 3-3 shows that Creswell’s largest employment industries are in four sectors:
• Government: Educational Services
• Manufacturing: Wood Products, Transportation Equipment, Chemicals
• Retail Trade: Food and Beverage Stores, Gasoline Stations
• Accommodation and Food Service: Accommodations, Food Services and Drinking Places
Of these major employment sectors, Table 3-3 shows that Manufacturing and Government have a payroll per employee higher than the Creswell average, while Retail Trade and Accommodation and Food Service have a payroll per employee lower than the Creswell average. Other sectors with a higher-than-average payroll per employee include Transportation and Warehousing, Wholesale Trade, Construction, and Agriculture/Forestry.
Page 3-2 ECONorthwest March 2005 Creswell Economic Opportunities
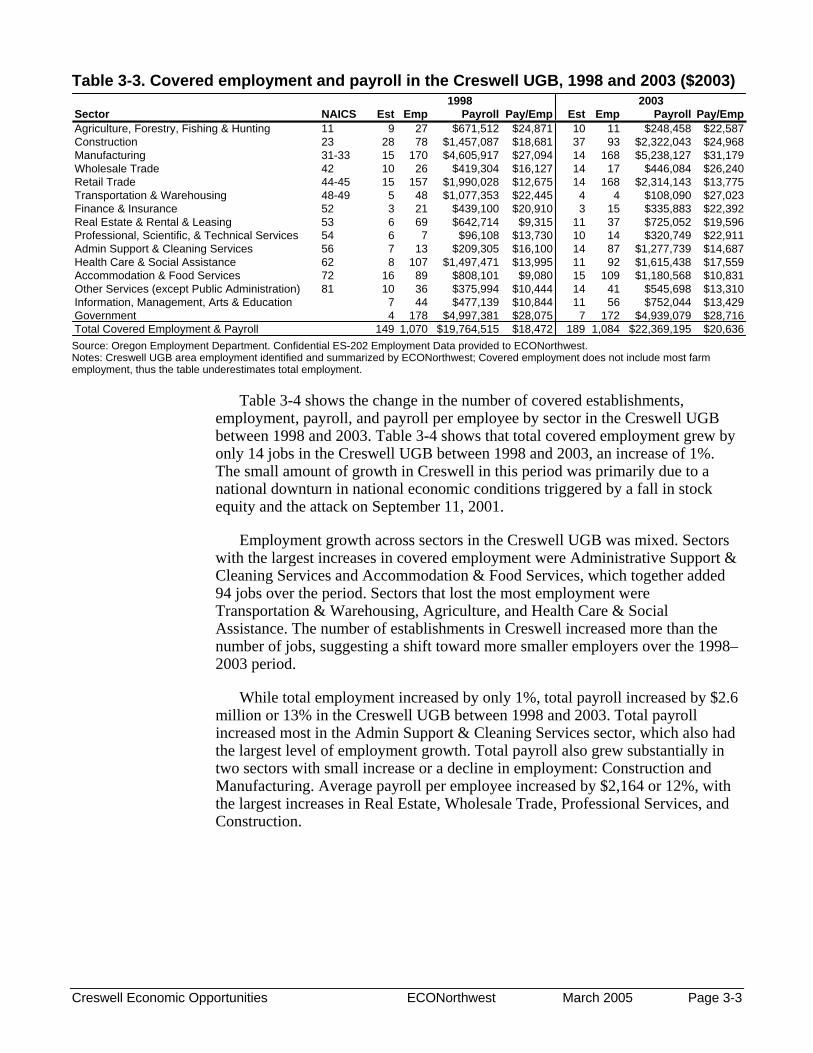
Table 3-3. Covered employment and payroll in the Creswell UGB, 1998 and 2003 ($2003)
Sector NAICS Est Emp Payroll Pay/Emp Est Emp Payroll Pay/EmpAgriculture, Forestry, Fishing & Hunting 11 9 27 $671,512 $24,871 10 11 $248,458 $22,587Construction 23 28 78 $1,457,087 $18,681 37 93 $2,322,043 $24,968Manufacturing 31-33 15 170 $4,605,917 $27,094 14 168 $5,238,127 $31,179Wholesale Trade 42 10 26 $419,304 $16,127 14 17 $446,084 $26,240Retail Trade 44-45 15 157 $1,990,028 $12,675 14 168 $2,314,143 $13,775Transportation & Warehousing 48-49 5 48 $1,077,353 $22,445 4 4 $108,090 $27,023Finance & Insurance 52 3 21 $439,100 $20,910 3 15 $335,883 $22,392Real Estate & Rental & Leasing 53 6 69 $642,714 $9,315 11 37 $725,052 $19,596Professional, Scientific, & Technical Services 54 6 7 $96,108 $13,730 10 14 $320,749 $22,911Admin Support & Cleaning Services 56 7 13 $209,305 $16,100 14 87 $1,277,739 $14,687Health Care & Social Assistance 62 8 107 $1,497,471 $13,995 11 92 $1,615,438 $17,559Accommodation & Food Services 72 16 89 $808,101 $9,080 15 109 $1,180,568 $10,831Other Services (except Public Administration) 81 10 36 $375,994 $10,444 14 41 $545,698 $13,310Information, Management, Arts & Education 7 44 $477,139 $10,844 11 56 $752,044 $13,429Government 4 178 $4,997,381 $28,075 7 172 $4,939,079 $28,716Total Covered Employment & Payroll 149 1,070 $19,764,515 $18,472 189 1,084 $22,369,195 $20,636
1998 2003
Source: Oregon Employment Department. Confidential ES-202 Employment Data provided to ECONorthwest. Notes: Creswell UGB area employment identified and summarized by ECONorthwest; Covered employment does not include most farm employment, thus the table underestimates total employment.
Table 3-4 shows the change in the number of covered establishments, employment, payroll, and payroll per employee by sector in the Creswell UGB between 1998 and 2003. Table 3-4 shows that total covered employment grew by only 14 jobs in the Creswell UGB between 1998 and 2003, an increase of 1%. The small amount of growth in Creswell in this period was primarily due to a national downturn in national economic conditions triggered by a fall in stock equity and the attack on September 11, 2001.
Employment growth across sectors in the Creswell UGB was mixed. Sectors with the largest increases in covered employment were Administrative Support & Cleaning Services and Accommodation & Food Services, which together added 94 jobs over the period. Sectors that lost the most employment were Transportation & Warehousing, Agriculture, and Health Care & Social Assistance. The number of establishments in Creswell increased more than the number of jobs, suggesting a shift toward more smaller employers over the 1998–2003 period.
While total employment increased by only 1%, total payroll increased by $2.6 million or 13% in the Creswell UGB between 1998 and 2003. Total payroll increased most in the Admin Support & Cleaning Services sector, which also had the largest level of employment growth. Total payroll also grew substantially in two sectors with small increase or a decline in employment: Construction and Manufacturing. Average payroll per employee increased by $2,164 or 12%, with the largest increases in Real Estate, Wholesale Trade, Professional Services, and Construction.
Creswell Economic Opportunities ECONorthwest March 2005 Page 3-3

Table 3-4. Change in the number of covered establishments, employment, payroll, and payroll per employee by sector in the Creswell UGB, 1998–2003 ($2003)
Establishments Payroll Pay/EmpSector Change Change % Change Change ChangeAgriculture, Forestry, Fishing & Hunting 1 -16 -59% -$423,054 -$2,284Construction 9 15 19% $864,956 $6,288Manufacturing -1 -2 -1% $632,210 $4,086Wholesale Trade 4 -9 -35% $26,780 $10,113Retail Trade -1 11 7% $324,115 $1,099Transportation & Warehousing -1 -44 -92% -$969,263 $4,578Finance & Insurance 0 -6 -29% -$103,217 $1,483Real Estate & Rental & Leasing 5 -32 -46% $82,338 $10,281Professional, Scientific, & Technical Services 4 7 100% $224,641 $9,181Admin Support & Cleaning Services 7 74 569% $1,068,434 -$1,414Health Care & Social Assistance 3 -15 -14% $117,967 $3,564Accommodation & Food Services -1 20 22% $372,467 $1,751Other Services (except Public Administration) 4 5 14% $169,704 $2,865Information, Management, Arts & Education 4 12 27% $274,905 $2,585Government 3 -6 -3% -$58,302 $640Total Covered Employment & Payroll 40 14 1% $2,604,681 $2,164
Employment
Source: Oregon Employment Department. Confidential ES-202 Employment Data provided to ECONorthwest. Change calculated by ECONorthwest.
Table 3-5 compares the distribution of covered employment in the Creswell UGB and Lane County. Table 3-5 shows that the distribution of employment in the Creswell UGB is very similar to that in Lane County—the distribution for every sector in Creswell is within four percentage points of the distribution in Lane County.
Table 3-5. Distribution of covered employment in the Creswell UGB and Lane County, 2003
LaneSector Creswell CountyAgriculture, Forestry, Fishing & Hunting 1% 2%Construction 9% 5%Manufacturing 15% 14%Wholesale Trade 2% 4%Retail Trade 15% 13%Transportation & Warehousing 0% 2%Finance & Insurance 1% 3%Real Estate & Rental & Leasing 3% 2%Professional, Scientific, & Technical Services 1% 4%Admin Support & Cleaning Services 8% 5%Health Care & Social Assistance 8% 12%Accommodation & Food Services 10% 9%Other Services (except Public Administration) 4% 4%Information, Management, Arts & Education 5% 6%Government 16% 16%Total Covered Employment & Payroll 100% 100%
Source: calculated by ECONorthwest from data provided by the Oregon Employment Department.
Table 3-6 shows total covered employment in Lane County, Census Tract 11 (which includes Creswell and the surrounding rural area) and Creswell over the 1978–1998 period. Table 3-6 shows that employment in Lane County and Census
Page 3-4 ECONorthwest March 2005 Creswell Economic Opportunities
Tract 11 grew at similar rates over the 1978–1998 period, with an average annual growth rate of 1.5% in Lane County and 1.4% in Census Tract 11.
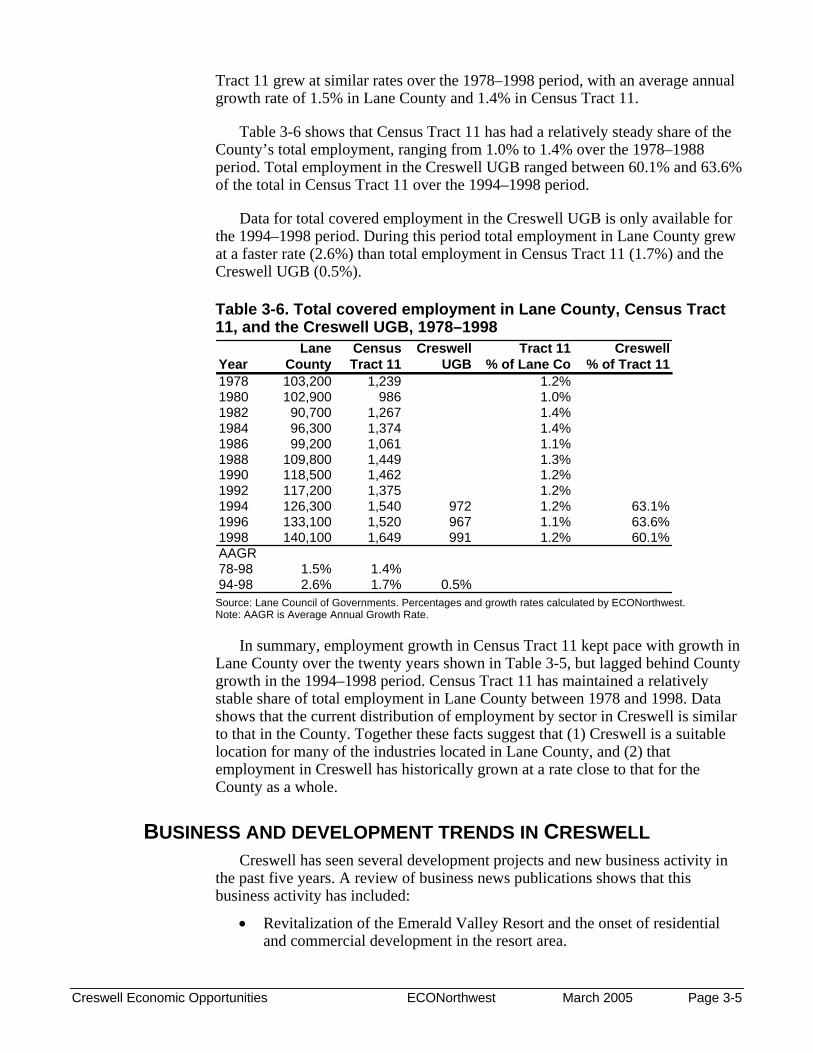
Table 3-6 shows that Census Tract 11 has had a relatively steady share of the County’s total employment, ranging from 1.0% to 1.4% over the 1978–1988 period. Total employment in the Creswell UGB ranged between 60.1% and 63.6% of the total in Census Tract 11 over the 1994–1998 period.
Data for total covered employment in the Creswell UGB is only available for the 1994–1998 period. During this period total employment in Lane County grew at a faster rate (2.6%) than total employment in Census Tract 11 (1.7%) and the Creswell UGB (0.5%).
Table 3-6. Total covered employment in Lane County, Census Tract 11, and the Creswell UGB, 1978–1998
Lane Census Creswell Tract 11 CreswellYear County Tract 11 UGB % of Lane Co % of Tract 111978 103,200 1,239 1.2%1980 102,900 986 1.0%1982 90,700 1,267 1.4%1984 96,300 1,374 1.4%1986 99,200 1,061 1.1%1988 109,800 1,449 1.3%1990 118,500 1,462 1.2%1992 117,200 1,375 1.2%1994 126,300 1,540 972 1.2% 63.1%1996 133,100 1,520 967 1.1% 63.6%1998 140,100 1,649 991 1.2% 60.1%AAGR78-98 1.5% 1.4%94-98 2.6% 1.7% 0.5%
Source: Lane Council of Governments. Percentages and growth rates calculated by ECONorthwest. Note: AAGR is Average Annual Growth Rate.
In summary, employment growth in Census Tract 11 kept pace with growth in Lane County over the twenty years shown in Table 3-5, but lagged behind County growth in the 1994–1998 period. Census Tract 11 has maintained a relatively stable share of total employment in Lane County between 1978 and 1998. Data shows that the current distribution of employment by sector in Creswell is similar to that in the County. Together these facts suggest that (1) Creswell is a suitable location for many of the industries located in Lane County, and (2) that employment in Creswell has historically grown at a rate close to that for the County as a whole.
BUSINESS AND DEVELOPMENT TRENDS IN CRESWELL Creswell has seen several development projects and new business activity in
the past five years. A review of business news publications shows that this business activity has included:
• Revitalization of the Emerald Valley Resort and the onset of residential and commercial development in the resort area.
Creswell Economic Opportunities ECONorthwest March 2005 Page 3-5
• Relocation of Ray’s Food Place from it’s location near Creswell’s traditional downtown to a 42,000 sq. ft. store east of I-5.
• Development of the Creswell Marketplace shopping center around the new Ray’s Food Place. This shopping center now has a bank, veterinary clinic, video rental, hair salon, and other retail shops.
• Redevelopment of the shopping center that formally housed Ray’s Food Place, which is now occupied by an auto parts store, video store, pizza parlor, hair salon, and discount retailer.
• Improvements to Oregon Avenue including a widened sidewalk, land posts, benches, bike racks, and trees. This project changed the former diagonal parking to parallel parking, reducing the number of parking spaces.
• Business openings in Creswell’s traditional downtown, including a dentist, jeweler, insurance office, and hair salon. In addition, a local hardware store is moving to a new larger location to expand their ability to provide supplies and services.
FORECASTS OF ECONOMIC GROWTH IN CRESWELL Several recent planning efforts have included projections of population and
employment growth in Creswell, including the 1998 Transportation System Plan and 2001 Urban Growth Boundary Land Analysis. An updated forecast of employment growth is presented as part of this EOA in Chapter 5, based on national, state, and regional trends presented in this chapter and local factors affecting economic development described in Chapter 4.
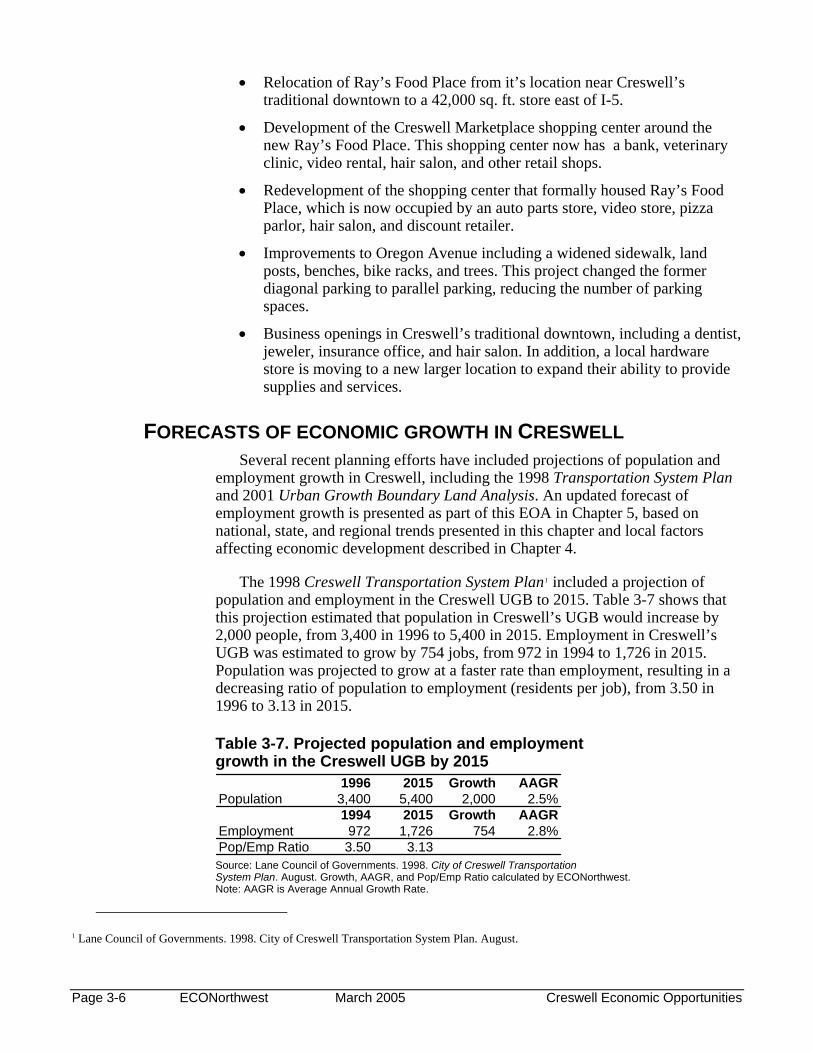
The 1998 Creswell Transportation System Plan1 included a projection of population and employment in the Creswell UGB to 2015. Table 3-7 shows that this projection estimated that population in Creswell’s UGB would increase by 2,000 people, from 3,400 in 1996 to 5,400 in 2015. Employment in Creswell’s UGB was estimated to grow by 754 jobs, from 972 in 1994 to 1,726 in 2015. Population was projected to grow at a faster rate than employment, resulting in a decreasing ratio of population to employment (residents per job), from 3.50 in 1996 to 3.13 in 2015.
Table 3-7. Projected population and employment growth in the Creswell UGB by 2015
1996 2015 Growth AAGRPopulation 3,400 5,400 2,000 2.5%
1994 2015 Growth AAGREmployment 972 1,726 754 2.8%Pop/Emp Ratio 3.50 3.13
Source: Lane Council of Governments. 1998. City of Creswell Transportation System Plan. August. Growth, AAGR, and Pop/Emp Ratio calculated by ECONorthwest. Note: AAGR is Average Annual Growth Rate.
1 Lane Council of Governments. 1998. City of Creswell Transportation System Plan. August.
Page 3-6 ECONorthwest March 2005 Creswell Economic Opportunities
The population projection in the Transportation System Plan was based on assuming that population in the Creswell UGB would grow at a rate similar to the 2.6% average annual growth rate for Creswell’s population between 1980 and 1995. The population projection in the Transportation System Plan was based on a forecast of total employment in Lane County and an assumption that share of County employment in Census Tract 11 (which includes Creswell) would increase slightly over the forecast period. All employment growth in Census Tract 11 was assumed to occur in Creswell because of Oregon’s land use planning rules.
Table 3-8. Projected population growth in the City of Creswell and Creswell UGB, 2000–2020
City of Creswell
Creswell UGB
Population2000 3,579 3,9292010 5,000 5,3502020 6,700 7,050Growth2000-10 1,421 1,4212010-20 1,700 1,700Total 3,121 3,121AAGR2000-10 3.4% 3.1%2010-20 3.0% 2.8%2000-20 3.2% 3.0%
Source: Lane Council of Governments. 2001. Creswell Urban Growth Boundary Land Analysis. October. Growth and AAGR calculated by ECONorthwest. Note: AAGR is Average Annual Growth Rate.
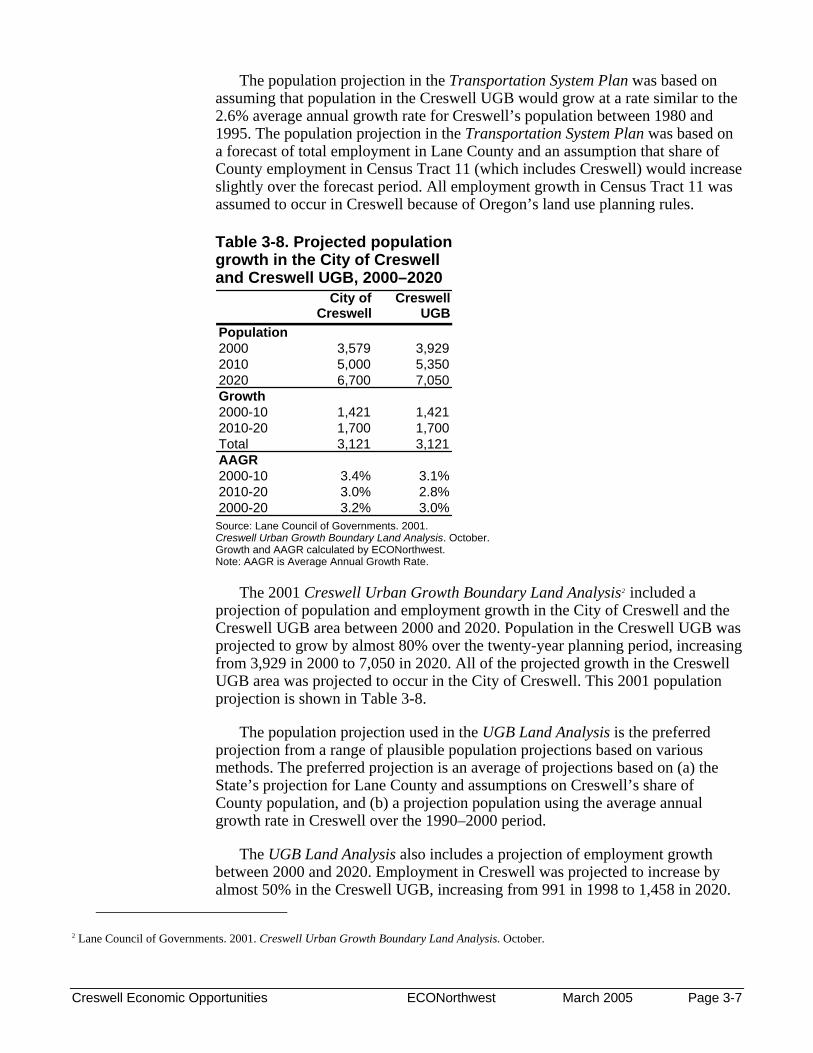
The 2001 Creswell Urban Growth Boundary Land Analysis2 included a projection of population and employment growth in the City of Creswell and the Creswell UGB area between 2000 and 2020. Population in the Creswell UGB was projected to grow by almost 80% over the twenty-year planning period, increasing from 3,929 in 2000 to 7,050 in 2020. All of the projected growth in the Creswell UGB area was projected to occur in the City of Creswell. This 2001 population projection is shown in Table 3-8.
The population projection used in the UGB Land Analysis is the preferred projection from a range of plausible population projections based on various methods. The preferred projection is an average of projections based on (a) the State’s projection for Lane County and assumptions on Creswell’s share of County population, and (b) a projection population using the average annual growth rate in Creswell over the 1990–2000 period.
The UGB Land Analysis also includes a projection of employment growth between 2000 and 2020. Employment in Creswell was projected to increase by almost 50% in the Creswell UGB, increasing from 991 in 1998 to 1,458 in 2020.
2 Lane Council of Governments. 2001. Creswell Urban Growth Boundary Land Analysis. October.
Creswell Economic Opportunities ECONorthwest March 2005 Page 3-7

The share of employment in the Commercial sector was projected to grow faster than in other major sectors, increasing its share of total employment from 54% in 1998 to 60% in 2020. LCOG’s 2001 employment projection for the Creswell UGB is shown in Table 3-9.
Table 3-9. Projected employment growth by major sector in the Creswell UGB, 1998–2020
Industrial Commercial Other TotalEmployment1998 252 535 204 9912020 364 875 219 1,458Share of total employment1998 25% 54% 21% 100%2020 25% 60% 15% 100%Growth1998-20 112 340 15 467AAGR1998-20 1.7% 2.3% 0.3% 1.8%
Source: Lane Council of Governments. 2001. Creswell Urban Growth Boundary Land Analysis. October. Growth and AAGR calculated by ECONorthwest. Note: AAGR is Average Annual Growth Rate.
The employment projection used in the UGB Land Analysis is based on an employment projection for Lane County developed as part of the Region 2050 project and assumptions about the share of County employment in Census Tract 11. The share of Census Tract 11 employment in Creswell was assumed to increase from 60% in 1998 to 65% in 2020. To allocate the projection of total employment to major sectors, the share of employment in the Industrial sector was expected to remain at 25% while the share in Commercial increased from 54% in 1998 to 60% in 2020 and the share in Other sectors decreased from 21% in 1998 to 15% in 2020.
The Lane Council of Governments has developed a forecast of population for urban growth boundary areas (UGBs) of communities in Lane County. The LCOG forecast for communities is coordinated to County control totals. This forecast predicts that population in the Creswell UGB area will increase by 2,860 between 2004 and 2025. Creswell’s population is projected to grow at an average annual rate of 2.4% between 2004 and 2025, compared to only 1.0% for Lane County as a whole in the same period. The LCOG forecast is shown in Table 3-10.
Page 3-8 ECONorthwest March 2005 Creswell Economic Opportunities
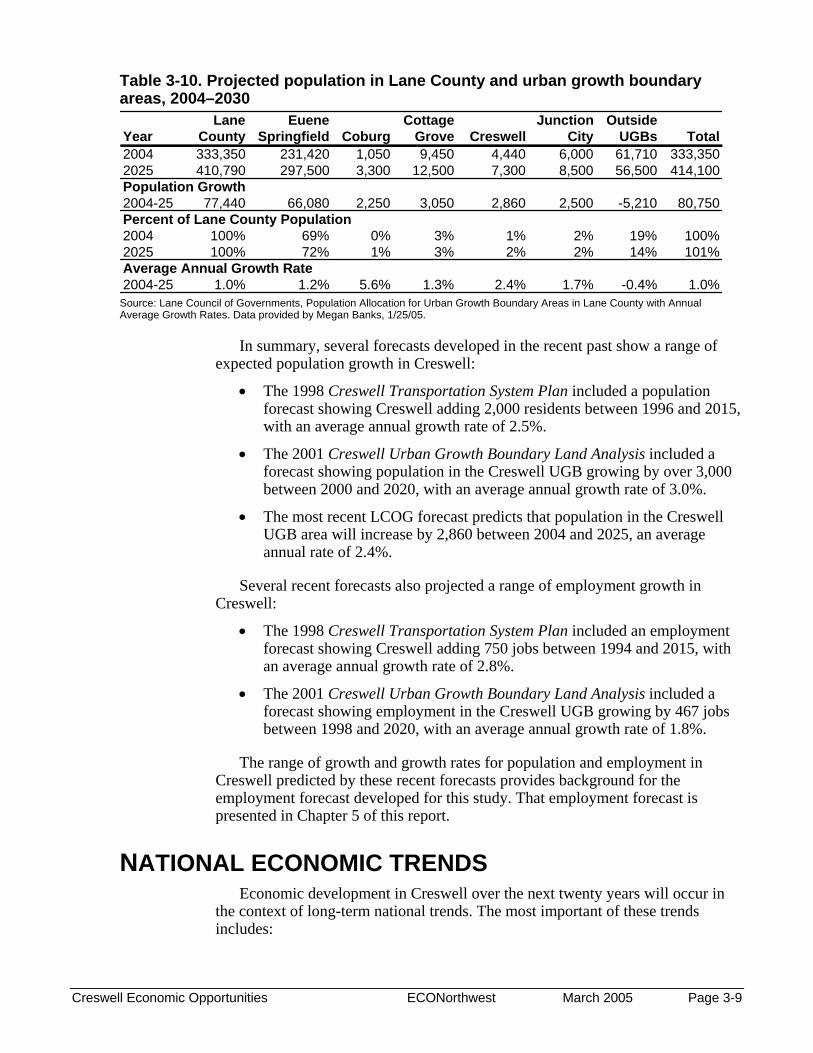
Table 3-10. Projected population in Lane County and urban growth boundary areas, 2004–2030
Lane Euene Cottage Junction OutsideYear County Springfield Coburg Grove Creswell City UGBs Total2004 333,350 231,420 1,050 9,450 4,440 6,000 61,710 333,3502025 410,790 297,500 3,300 12,500 7,300 8,500 56,500 414,100Population Growth2004-25 77,440 66,080 2,250 3,050 2,860 2,500 -5,210 80,750Percent of Lane County Population2004 100% 69% 0% 3% 1% 2% 19% 100%2025 100% 72% 1% 3% 2% 2% 14% 101%Average Annual Growth Rate2004-25 1.0% 1.2% 5.6% 1.3% 2.4% 1.7% -0.4% 1.0%
Source: Lane Council of Governments, Population Allocation for Urban Growth Boundary Areas in Lane County with Annual Average Growth Rates. Data provided by Megan Banks, 1/25/05.
In summary, several forecasts developed in the recent past show a range of expected population growth in Creswell:
• The 1998 Creswell Transportation System Plan included a population forecast showing Creswell adding 2,000 residents between 1996 and 2015, with an average annual growth rate of 2.5%.
• The 2001 Creswell Urban Growth Boundary Land Analysis included a forecast showing population in the Creswell UGB growing by over 3,000 between 2000 and 2020, with an average annual growth rate of 3.0%.
• The most recent LCOG forecast predicts that population in the Creswell UGB area will increase by 2,860 between 2004 and 2025, an average annual rate of 2.4%.
Several recent forecasts also projected a range of employment growth in Creswell:
• The 1998 Creswell Transportation System Plan included an employment forecast showing Creswell adding 750 jobs between 1994 and 2015, with an average annual growth rate of 2.8%.
• The 2001 Creswell Urban Growth Boundary Land Analysis included a forecast showing employment in the Creswell UGB growing by 467 jobs between 1998 and 2020, with an average annual growth rate of 1.8%.
The range of growth and growth rates for population and employment in Creswell predicted by these recent forecasts provides background for the employment forecast developed for this study. That employment forecast is presented in Chapter 5 of this report.
NATIONAL ECONOMIC TRENDS Economic development in Creswell over the next twenty years will occur in
the context of long-term national trends. The most important of these trends includes:
Creswell Economic Opportunities ECONorthwest March 2005 Page 3-9

• Continued westward migration of the U.S. population, and the increasing role of amenities and other non-wage factors as determinants of the location decisions of households and firms.
• Growth in Pacific Rim trade.
• The growing importance of education as a determinant of wages and household income.
• A continued shift of employment from resource-intensive industries to service-oriented and high-tech manufacturing sectors of the economy.
• The increasing integration of non-metropolitan and metropolitan areas.
Short-term national trends will also affect economic growth in the region, but these trends are difficult to predict. At times these trends may run counter to the long-term trends described above. A recent example is the downturn in Asian economies, which caused Oregon’s exports to Pacific Rim countries to decline. This in turn led to layoffs in the Lumber & Wood Products and high-tech Manufacturing industries. The Asian economies, however, have substantially recovered, and Pacific Rim trade will continue to play a significant role in the national, state, and local economy over the long run. This report takes a long-run perspective on the Creswell economy (as the Goal 9 requirements intend) and does not attempt to predict short-run business cycles.
Economic development in Creswell will also be affected by long-run economic trends in Oregon and the Willamette Valley. The following section describes recent trends in population, income, and employment growth in Oregon, Lane County, and Creswell. This is followed by the economic outlook for Oregon. Opportunities and constraints affecting future economic development in Creswell are addressed in Chapter 4 of this report. Recent economic trends and the economic outlook for Oregon form, along with opportunities and constraints in Creswell, are the primary basis for our expectations of future trends and development patterns in Creswell. We will use these trends and conditions to develop a forecast of employment growth in Creswell in Chapter 5.
ECONOMIC TRENDS IN OREGON AND LANE COUNTY POPULATION
Oregon's economy is generally more cyclical than the nation's, growing faster than the national economy during expansions and contracting more rapidly than the nation during recessions. This pattern is shown in Table 3-7, which presents data on population in the U.S., Oregon, and selected areas in Oregon over the 1970–2000 period. Table 3-7 shows Oregon grew more rapidly than the U.S. in the 1970s and 1990s (which were generally expansionary periods) but lagged behind the U.S. in the 1980s. Oregon's slow growth in the 1980s was primarily due to the nationwide recession early in the decade. Oregon’s population growth regained momentum in 1987, growing at annual rates of 1.4%–2.9% between 1988 and 1996. The Willamette Valley received over 70% of the state's population growth during this period.
Page 3-10 ECONorthwest March 2005 Creswell Economic Opportunities
Population growth for Oregon and its regions slowed in 1997, to 1.1% statewide, the slowest rate since 1987. Net migration into Oregon, which is the largest component of population growth, dropped from 35,000 in 1996 to 18,000 in 1999. The reasons most often cited for this slowing of population growth are the recovery of the California economy, the combination of a high cost of living (especially housing) and low wages in Oregon, and a perceived decline in the quality of Oregon’s schools. Population growth in Oregon has not recovered to the rates experienced in the 1990s, with average annual growth in the 2000–2003 period of only 1.2%.
The Willamette Valley has always been the center of growth in Oregon. The population growth rate in the Willamette Valley has exceeded that of the state in every decade except during the 1970s. Almost 70% of Oregon’s population is located in the Willamette Valley, which contains only 14% of the state’s land area. Most of the Willamette Valley’s population is concentrated in the metropolitan areas of Portland, Salem, and Eugene.3
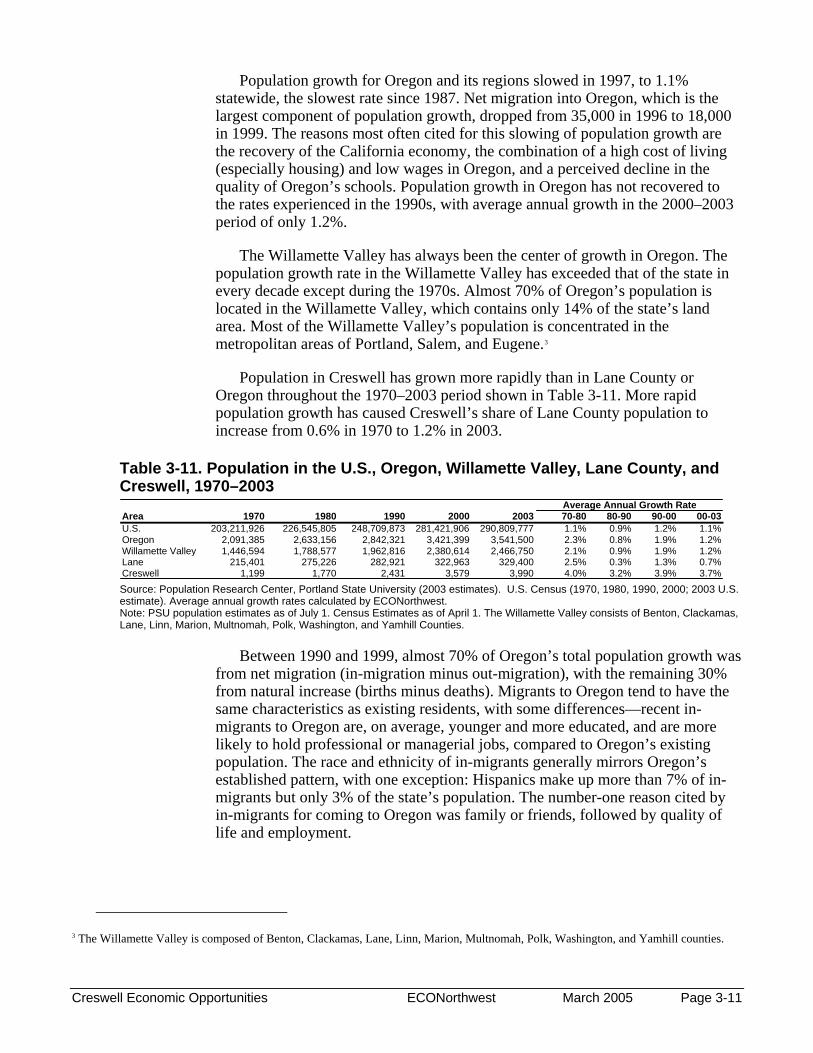
Population in Creswell has grown more rapidly than in Lane County or Oregon throughout the 1970–2003 period shown in Table 3-11. More rapid population growth has caused Creswell’s share of Lane County population to increase from 0.6% in 1970 to 1.2% in 2003.
Table 3-11. Population in the U.S., Oregon, Willamette Valley, Lane County, and Creswell, 1970–2003
Area 1970 1980 1990 2000 2003 70-80 80-90 90-00 00-03U.S. 203,211,926 226,545,805 248,709,873 281,421,906 290,809,777 1.1% 0.9% 1.2% 1.1%Oregon 2,091,385 2,633,156 2,842,321 3,421,399 3,541,500 2.3% 0.8% 1.9% 1.2%Willamette Valley 1,446,594 1,788,577 1,962,816 2,380,614 2,466,750 2.1% 0.9% 1.9% 1.2%Lane 215,401 275,226 282,921 322,963 329,400 2.5% 0.3% 1.3% 0.7%Creswell 1,199 1,770 2,431 3,579 3,990 4.0% 3.2% 3.9% 3.7%
Average Annual Growth Rate
Source: Population Research Center, Portland State University (2003 estimates). U.S. Census (1970, 1980, 1990, 2000; 2003 U.S. estimate). Average annual growth rates calculated by ECONorthwest. Note: PSU population estimates as of July 1. Census Estimates as of April 1. The Willamette Valley consists of Benton, Clackamas, Lane, Linn, Marion, Multnomah, Polk, Washington, and Yamhill Counties.
Between 1990 and 1999, almost 70% of Oregon’s total population growth was from net migration (in-migration minus out-migration), with the remaining 30% from natural increase (births minus deaths). Migrants to Oregon tend to have the same characteristics as existing residents, with some differences—recent in-migrants to Oregon are, on average, younger and more educated, and are more likely to hold professional or managerial jobs, compared to Oregon’s existing population. The race and ethnicity of in-migrants generally mirrors Oregon’s established pattern, with one exception: Hispanics make up more than 7% of in-migrants but only 3% of the state’s population. The number-one reason cited by in-migrants for coming to Oregon was family or friends, followed by quality of life and employment.
3 The Willamette Valley is composed of Benton, Clackamas, Lane, Linn, Marion, Multnomah, Polk, Washington, and Yamhill counties.
Creswell Economic Opportunities ECONorthwest March 2005 Page 3-11
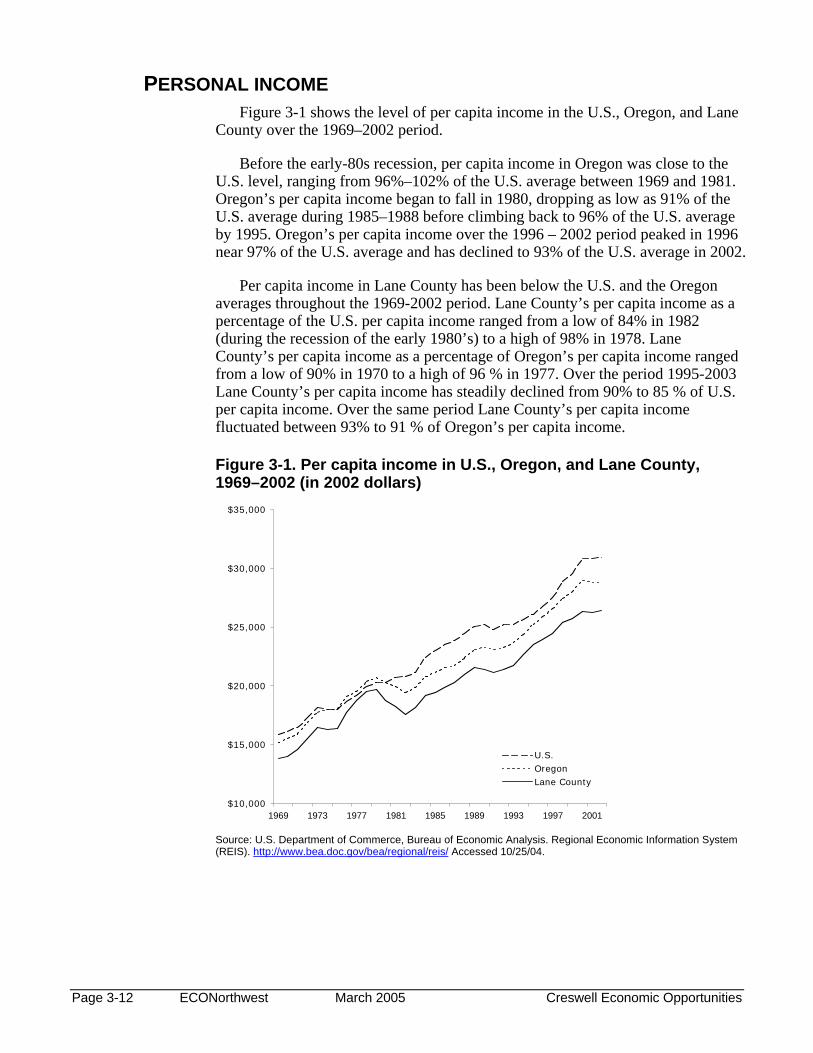
PERSONAL INCOME Figure 3-1 shows the level of per capita income in the U.S., Oregon, and Lane
County over the 1969–2002 period.
Before the early-80s recession, per capita income in Oregon was close to the U.S. level, ranging from 96%–102% of the U.S. average between 1969 and 1981. Oregon’s per capita income began to fall in 1980, dropping as low as 91% of the U.S. average during 1985–1988 before climbing back to 96% of the U.S. average by 1995. Oregon’s per capita income over the 1996 – 2002 period peaked in 1996 near 97% of the U.S. average and has declined to 93% of the U.S. average in 2002.
Per capita income in Lane County has been below the U.S. and the Oregon averages throughout the 1969-2002 period. Lane County’s per capita income as a percentage of the U.S. per capita income ranged from a low of 84% in 1982 (during the recession of the early 1980’s) to a high of 98% in 1978. Lane County’s per capita income as a percentage of Oregon’s per capita income ranged from a low of 90% in 1970 to a high of 96 % in 1977. Over the period 1995-2003 Lane County’s per capita income has steadily declined from 90% to 85 % of U.S. per capita income. Over the same period Lane County’s per capita income fluctuated between 93% to 91 % of Oregon’s per capita income.
Figure 3-1. Per capita income in U.S., Oregon, and Lane County, 1969–2002 (in 2002 dollars)
$10,000
$15,000
$20,000
$25,000
$30,000
$35,000
1969 1973 1977 1981 1985 1989 1993 1997 2001
U.S.OregonLane County
Source: U.S. Department of Commerce, Bureau of Economic Analysis. Regional Economic Information System (REIS). http://www.bea.doc.gov/bea/regional/reis/ Accessed 10/25/04.
Page 3-12 ECONorthwest March 2005 Creswell Economic Opportunities

EMPLOYMENT
OREGON Employment growth has generally followed the trend of population growth,
but employment growth varies more because employment is more closely tied to economic conditions. As for population, over 70% of Oregon’s employment is located in the Willamette Valley. The Valley also experienced the largest loss of employment in the recession of the early 1980s.
The composition of Oregon's employment has changed since 1969. Employment growth has been led by the Finance, Insurance and Real Estate (F.I.R.E.) and Services sectors. The share of total employment in these sectors increased from 25% to 35% between 1969 and 1995. Slow growth in Manufacturing caused its share of total employment to decline from 20% to 13% over this period, while other sectors grew at rates close to the statewide average.
In the last 20 years Oregon's economy has made a transition away from reliance on traditional resource-extraction industries, with the growth of high-tech manufacturing, services, and trade. A significant indicator of this transition is the decline of employment in the Lumber & Wood Products industry and the concurrent growth of employment in high-technology manufacturing industries (Industrial Machinery, Electronic Equipment, and Instruments). Employment in Lumber & Wood Products has declined from its 1979 peak, while employment in high-tech industries surpassed that in Lumber & Wood Products 1995.
While this transition has increased the diversity of employment within Oregon, it has not significantly improved Oregon's diversity relative to the national economy. Oregon's relative diversity has historically ranked low among states, primarily due to dependence on the timber industry. Oregon ranked 35th in diversity (1st = most diversified) based on Gross State Product data for 1963–1986, and 32nd based on data for the 1977–1996 period. While Oregon's economy has diversified, it is still heavily dependent on several industries—Oregon's diversity ranking remains low due to disproportionately large timber, high tech, and agricultural industries. Relatively low economic diversity increases the risk of economic volatility as measured by changes in output or employment. For example, while Oregon has enjoyed the upside of increasing concentration in high-tech manufacturing, the 1999 Asian banking crisis and resulting layoffs showed the risk of Oregon's reliance on the high-tech manufacturing industry.4
LANE COUNTY During the 1990’s, industrial diversification accelerated in Lane County. By
1998, the broad industrial mix in Lane County closely mirrored that of Oregon as a whole even though Lane County only has about 10% of the state’s employment. This diversification stems form Lane County being home to the University of Oregon, a regional provider of medical services, and center for specialty
4 LeBre, Jon. 1999. "Diversification and the Oregon Economy: An Update." Oregon Labor Trends. February.
Creswell Economic Opportunities ECONorthwest March 2005 Page 3-13
manufacturing including high-tech firms and transportation equipment (particularly RV manufacturing).
The application of technology increased productivity in the traditional commodity products side of the lumber and wood products industry, allowing the creation and expansion of value-added secondary wood products firms that helped stabilize employment in the wood products sector.
Lane County employment continued to grow into 2000. In 2001, however, the worldwide downturn in the high-tech industry had an effect on the economy of Oregon and Lane County. Several high-tech firms in Lane County announced layoffs or closings. Between 2000 and 2001, total non-farm payroll employment in Lane County dropped 1.7%. Most of this employment loss was in durable goods manufacturing, particularly in high-tech manufacturing.
Between 2001 and 2002, total non-farm payroll employment in Lane County increased 0.4%, adding 600 jobs. In 2003, non-farm payroll employment declined 0.7%, losing 1,000 jobs. Projections by the Oregon Employment Department predict that Lane County total non-farm employment will reach 159,200 by 2012, an increase of 17,500 jobs above the 2002 level.
While non-farm payroll employment both grew and declined this decade, total employment for Lane County has continued to increase. Between 2000 and 2003, total employment increased 3,893 employees, a 2.5% increase. Total employment during this period has grown because of an increase in contract employment that is not included in non-farm payroll employment (contract employment is where someone works for another person or company as an independent under contract as opposed to being an employee).5
ECONOMIC ACTIVITY Despite the economic downturn early in this decade, Oregon and Lane County
have experienced expansion of existing businesses and the opening of new businesses in industries that have potential to locate in Creswell. A review of business news sources shows numerous examples of businesses that expanded and new business activity in Oregon. These businesses includes firms in the following industries:
• Manufacture of aircraft, aircraft equipment, and avionics. Much of this activity has occurred in the Central Oregon region.
• Call centers.
• Software design and customer support.
• Manufacturing of recreational vehicles (RVs), trailers, and other transportation equipment.
5 Lane Council of Governments. 2004. City of Creswell and Creswell Regional Economic Development Plan. August.
Page 3-14 ECONorthwest March 2005 Creswell Economic Opportunities
• Other specialty manufacturing, including high-tech electronics, food processing, adhesives, industrial equipment, and recreational equipment.
• Warehousing and distribution.
• Big-box retail development.
• Specialty retail in shopping center and traditional downtown settings.
Of course, businesses in these and other industries have closed or downsized in this decade. The industries that are generating growth, however, are suggestive of the types of industries that might generate growth in Creswell. The comparative advantage of Creswell as a business location and the implications for the types of businesses that may locate in Creswell are discussed in Chapter 4 of this report.
PUBLIC POLICY Changing economic conditions in Oregon have not only been affected by
national and international trends, but also by government action in Oregon. State policy has made a concerted effort to attract industries with tax policy (e.g., no unitary tax, which would tax world-wide corporate income of businesses operating in Oregon), changes in corporation codes, reforms to reduce the costs of workers’ compensation, investments in infrastructure, and other incentives (e.g., enterprise zones and the Strategic Investment Program, which attempts to stimulate capital-intensive industries through property tax abatement). The State has encouraged international trade and investments with missions and offices in Japan, Taiwan, and other Pacific Rim countries. State policy on land use and environmental quality aim at preserving the natural and cultural amenities that make Oregon attractive to its current and potential residents and businesses—but their effects, however, are not unambiguous, since they may also raise taxes, fees, and land development costs.
In reaction to a perceived lack of industrial sites in Oregon ready for development, the State has initiated the Industrial Site Certification Program. This program certifies that industrial sites are ready for development within six months or less after being chosen for development. Certified sites receive a comprehensive review and have current information available for the availability and capacity of water, sewer, electrical power and telecommunications; environmental, cultural and land issues; transportation accessibility; and much more. Site certification serves as a marketing tool for communities and allows them to better take advantage of development opportunities.
OUTLOOK FOR GROWTH IN OREGON AND LANE COUNTY The State's long-term forecast of population in Oregon and Lane County is
shown in Table 3-12. Table 3-12 shows that population in Oregon is expected to grow at an average annual rate of 1.24% over the 2005–2025 period. Growth in Lane County is expected to lag behind the State average, with an average annual growth rate of 1.02% over the same period. Lane County is expected to add over 75,000 residents over the twenty-year 2005–2025 period.
Creswell Economic Opportunities ECONorthwest March 2005 Page 3-15

Table 3-12. Population forecast for Oregon, and Lane County, 2000–2025
AAGR2000 2005 2010 2015 2020 2025 05-25
Population Oregon 3,436,750 3,618,200 3,843,900 4,095,708 4,359,258 4,626,015 1.24% Lane 323,950 333,855 347,494 365,639 387,574 409,159 1.02%
Source: State of Oregon, Office of Economic Analysis. 2004. Forecasts of Oregon's County Populations and Components of Change, 2000 – 2040. Average Annual Growth Rate (AAGR) calculated by ECONorthwest.
Table 3-9 shows the Oregon Employment Department's ten-year forecast for employment by industry for Oregon and Lane County. Table 3-9 shows that employment growth in Oregon over the 2002-2012 period will be led by Services, Retail Trade, and Government. Together, these three sectors are expected to add 159,400 new jobs or 74% of employment growth in Oregon. Employment growth in Lane County is expected to be led by these same three sectors over the 2002-2012 period, which are expected to add a total of 13,700 jobs or 78% of employment growth in Lane County.
The forecast in Table 3-13 shows that the employment growth rate in Lane County is expected to lag behind the Oregon average, with total employment growing by 12.4% in Lane County compared to 13.7% in Oregon as a whole.
Page 3-16 ECONorthwest March 2005 Creswell Economic Opportunities
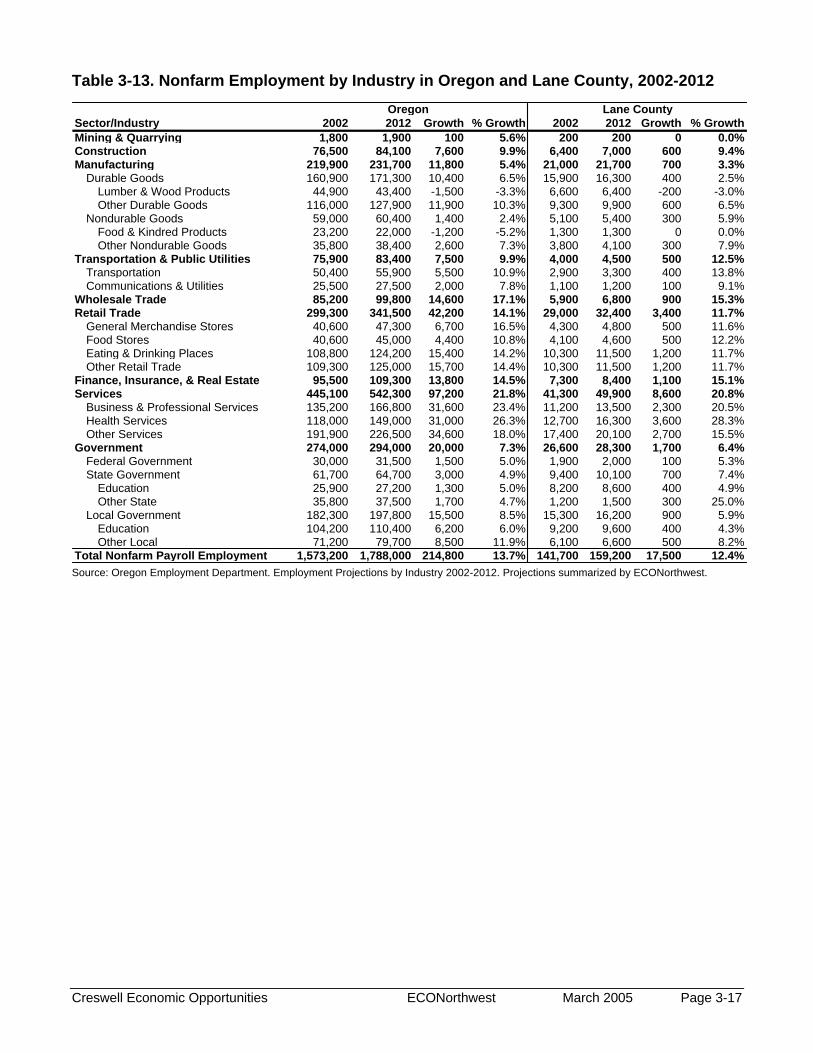
Table 3-13. Nonfarm Employment by Industry in Oregon and Lane County, 2002-2012
Sector/Industry 2002 2012 Growth % Growth 2002 2012 Growth % GrowthMining & Quarrying 1,800 1,900 100 5.6% 200 200 0 0.0%Construction 76,500 84,100 7,600 9.9% 6,400 7,000 600 9.4%Manufacturing 219,900 231,700 11,800 5.4% 21,000 21,700 700 3.3%
Durable Goods 160,900 171,300 10,400 6.5% 15,900 16,300 400 2.5%Lumber & Wood Products 44,900 43,400 -1,500 -3.3% 6,600 6,400 -200 -3.0%Other Durable Goods 116,000 127,900 11,900 10.3% 9,300 9,900 600 6.5%
Nondurable Goods 59,000 60,400 1,400 2.4% 5,100 5,400 300 5.9%Food & Kindred Products 23,200 22,000 -1,200 -5.2% 1,300 1,300 0 0.0%Other Nondurable Goods 35,800 38,400 2,600 7.3% 3,800 4,100 300 7.9%
Transportation & Public Utilities 75,900 83,400 7,500 9.9% 4,000 4,500 500 12.5%Transportation 50,400 55,900 5,500 10.9% 2,900 3,300 400 13.8%Communications & Utilities 25,500 27,500 2,000 7.8% 1,100 1,200 100 9.1%
Wholesale Trade 85,200 99,800 14,600 17.1% 5,900 6,800 900 15.3%Retail Trade 299,300 341,500 42,200 14.1% 29,000 32,400 3,400 11.7%
General Merchandise Stores 40,600 47,300 6,700 16.5% 4,300 4,800 500 11.6%Food Stores 40,600 45,000 4,400 10.8% 4,100 4,600 500 12.2%Eating & Drinking Places 108,800 124,200 15,400 14.2% 10,300 11,500 1,200 11.7%Other Retail Trade 109,300 125,000 15,700 14.4% 10,300 11,500 1,200 11.7%
Finance, Insurance, & Real Estate 95,500 109,300 13,800 14.5% 7,300 8,400 1,100 15.1%Services 445,100 542,300 97,200 21.8% 41,300 49,900 8,600 20.8%
Business & Professional Services 135,200 166,800 31,600 23.4% 11,200 13,500 2,300 20.5%Health Services 118,000 149,000 31,000 26.3% 12,700 16,300 3,600 28.3%Other Services 191,900 226,500 34,600 18.0% 17,400 20,100 2,700 15.5%
Government 274,000 294,000 20,000 7.3% 26,600 28,300 1,700 6.4%Federal Government 30,000 31,500 1,500 5.0% 1,900 2,000 100 5.3%State Government 61,700 64,700 3,000 4.9% 9,400 10,100 700 7.4%
Education 25,900 27,200 1,300 5.0% 8,200 8,600 400 4.9%Other State 35,800 37,500 1,700 4.7% 1,200 1,500 300 25.0%
Local Government 182,300 197,800 15,500 8.5% 15,300 16,200 900 5.9%Education 104,200 110,400 6,200 6.0% 9,200 9,600 400 4.3%Other Local 71,200 79,700 8,500 11.9% 6,100 6,600 500 8.2%
Total Nonfarm Payroll Employment 1,573,200 1,788,000 214,800 13.7% 141,700 159,200 17,500 12.4%
Oregon Lane County
Source: Oregon Employment Department. Employment Projections by Industry 2002-2012. Projections summarized by ECONorthwest.
Creswell Economic Opportunities ECONorthwest March 2005 Page 3-17

Factors Affecting Future Economic
Chapter 4 Development in Creswell
Economic development opportunities in Creswell will be affected by local conditions as well as the national and regional economic conditions that were addressed in Chapter 3. Factors affecting future economic development in Creswell include its location, buildable land, labor force, housing, public services, transportation, natural resources, and quality of life. Economic conditions in Creswell relative to these conditions in other portions of the southern Willamette Valley form Creswell’s comparative advantage for economic development. Creswell’s comparative advantages have implications for the types of firms most likely to locate and expand in Creswell.
This chapter begins with a description of comparative advantage any why it is relevant for the Economic Opportunity Analysis. This chapter then reviews local factors affecting economic development in Creswell and any advantages, opportunities, disadvantages, and constraints these factors may present. This chapter ends with a discussion of the comparative advantages formed by the mix of factors present in Creswell and the implications for the types of firms most likely to locate in Creswell.
There is little that Creswell can do to influence national and regional conditions that affect economic development. Creswell, however, can influence local factors that affect economic development. The review of local factors in this chapter will form a basis for developing economic development strategies for Creswell later in this study.
WHAT IS COMPARATIVE ADVANTAGE? Each economic region has different combinations of productive factors: land
(and natural resources), labor (including technological expertise), and capital (investments in infrastructure, technology, and public services). While all areas have these factors to some degree, the mix and condition of these factors vary. The mix and condition of productive factors may allow firms in a region to produce goods and services more cheaply, or to generate more revenue, than firms in other regions.
By affecting the cost of production and marketing, comparative advantages affect the pattern of economic development in a region relative to other regions. Goal 9 recognizes this by requiring plans to include an analysis of the relative supply and cost of factors of production. An analysis of comparative advantage depends on the geographic areas being compared. Economic conditions in Creswell will be largely shaped by national and regional economic conditions affecting the southern Willamette Valley. Chapter 3 presents forecasts of conditions in Oregon and Lane County to help establish the context for economic development in Creswell. Local economic factors will help determine the level
Creswell Economic Opportunities ECONorthwest March 2005 Page 4-1
and type of development in Creswell relative to other communities in the southern Willamette Valley. This chapter focuses on the comparative advantages of Creswell relative to Lane County and the southern Willamette Valley. The implications of these individual factors for Creswell’s overall comparative advantage are discussed at the end of this chapter.
LOCATION Creswell’s location will have substantial influence on its future development.
Creswell lies roughly ten miles south of Eugene-Springfield and ten miles north of Cottage Grove. Creswell is linked to both communities by Interstate 5. Creswell’s proximity to larger communities and location on I-5 has important implications for economic development in Creswell:
• Creswell’s proximity to Eugene-Springfield and Cottage Grove mean that workers in these communities are able to commute to employers in Creswell, and Creswell residents are able to commute to employers in these larger communities.
• Creswell has roughly the same access to workers and to markets as other locations in the southern Willamette Valley. Firms that are currently in or are considering a location in the region may be willing to consider locations in Creswell.
• Creswell can offer its residents access to shopping, cultural activities, and other amenities of the larger urban areas along with its local small-town character.
• With its small size and rural setting, Creswell also offers access to rural housing and recreational opportunities in the surrounding rural area.
Creswell’s proximity to larger urban areas and location on I-5, along with its small-town character, are a primary comparative advantage for economic development in Creswell.
BUILDABLE LAND An analysis of buildable lands in Creswell is presented in Chapter 2 of this
report. This analysis shows that Creswell has several large parcels designated for industrial development at the north and south ends of Highway 99 in Creswell, with commercial land clustered east and west of the I-5 interchange. Buildable land designated for commercial/resort land off of Emerald Parkway east of I-5 appears to be primarily developing in residential uses. In addition, there appears to be some potential for redevelopment on a portion of developed commercial properties in Creswell, primarily in the area west of I-5 and east of the railroad tracks.
Buildable land is needed to allow new development that will support employment growth in Creswell. The limited amount of buildable land identified in Chapter 2 suggests that the supply of buildable land may be a constraint for employment growth in Creswell. Creswell’s Comprehensive Land Use Plan,
Page 4-2 ECONorthwest March 2005 Creswell Economic Opportunities
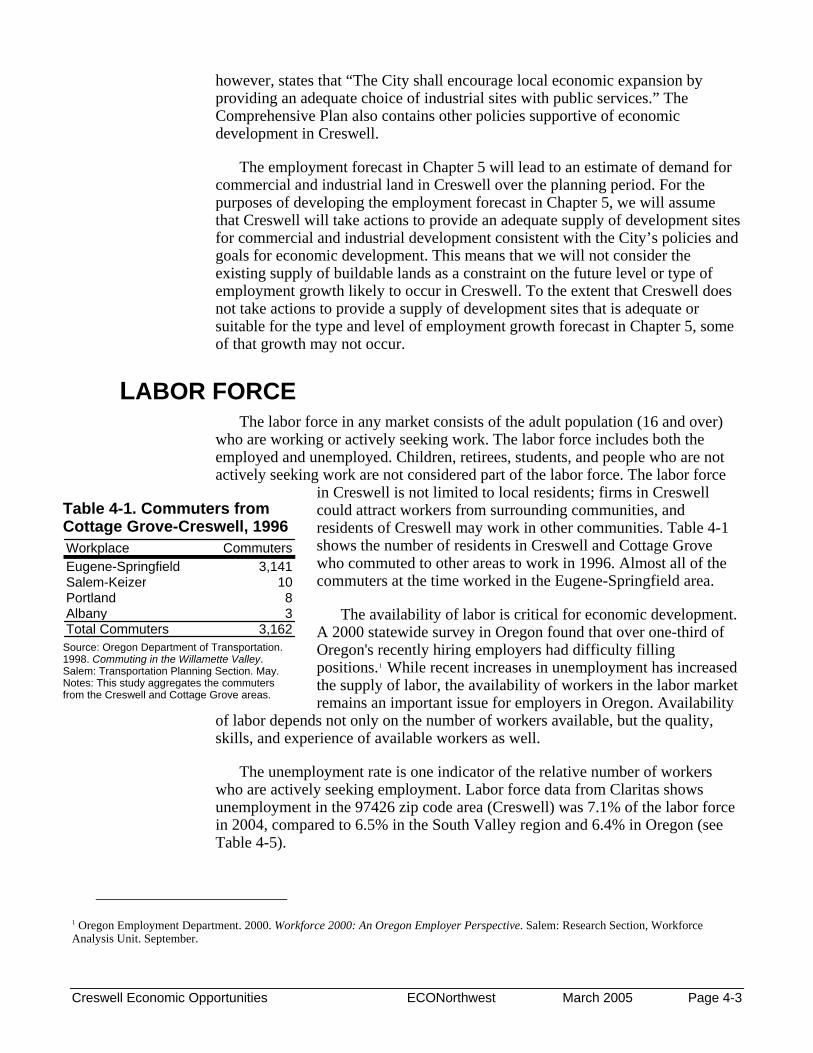
however, states that “The City shall encourage local economic expansion by providing an adequate choice of industrial sites with public services.” The Comprehensive Plan also contains other policies supportive of economic development in Creswell.
The employment forecast in Chapter 5 will lead to an estimate of demand for commercial and industrial land in Creswell over the planning period. For the purposes of developing the employment forecast in Chapter 5, we will assume that Creswell will take actions to provide an adequate supply of development sites for commercial and industrial development consistent with the City’s policies and goals for economic development. This means that we will not consider the existing supply of buildable lands as a constraint on the future level or type of employment growth likely to occur in Creswell. To the extent that Creswell does not take actions to provide a supply of development sites that is adequate or suitable for the type and level of employment growth forecast in Chapter 5, some of that growth may not occur.
LABOR FORCE The labor force in any market consists of the adult population (16 and over)
who are working or actively seeking work. The labor force includes both the employed and unemployed. Children, retirees, students, and people who are not actively seeking work are not considered part of the labor force. The labor force
in Creswell is not limited to local residents; firms in Creswell could attract workers from surrounding communities, and residents of Creswell may work in other communities. Table 4-1 shows the number of residents in Creswell and Cottage Grove who commuted to other areas to work in 1996. Almost all of the commuters at the time worked in the Eugene-Springfield area.
The availability of labor is critical for economic development. A 2000 statewide survey in Oregon found that over one-third of Oregon's recently hiring employers had difficulty filling positions.1 While recent increases in unemployment has increased the supply of labor, the availability of workers in the labor market remains an important issue for employers in Oregon. Availability
of labor depends not only on the number of workers available, but the quality, skills, and experience of available workers as well.
Table 4-1. Commuters from Cottage Grove-Creswell, 1996 Workplace CommutersEugene-Springfield 3,141Salem-Keizer 10Portland 8Albany 3Total Commuters 3,162
Source: Oregon Department of Transportation. 1998. Commuting in the Willamette Valley. Salem: Transportation Planning Section. May. Notes: This study aggregates the commuters from the Creswell and Cottage Grove areas.
The unemployment rate is one indicator of the relative number of workers who are actively seeking employment. Labor force data from Claritas shows unemployment in the 97426 zip code area (Creswell) was 7.1% of the labor force in 2004, compared to 6.5% in the South Valley region and 6.4% in Oregon (see Table 4-5).
1 Oregon Employment Department. 2000. Workforce 2000: An Oregon Employer Perspective. Salem: Research Section, Workforce Analysis Unit. September.
Creswell Economic Opportunities ECONorthwest March 2005 Page 4-3

Direct information on the quality of the workforce is not readily available—it would require an extensive survey about worker's level of education, work experience, and an assessment of cognitive and physical skills. Demographic characteristics that are typically used to indicate the quality of the labor force include age distribution, educational attainment, employment by occupation or industry, and race/ethnicity.
Table 4-2 shows the share of population by age in Creswell, the surrounding South Valley region, and Oregon. This table shows that compared to other areas, Creswell has a higher share of its population in the under 18 age group, which is primarily outside of the labor force. Creswell’s share of population in other age groups is within three percentage points of that in the region and state.
Table 4-2. Percent of population by age in Oregon, the South Valley region, and the Creswell zip code area, 2004
Age Total Percent Total Percent Total PercentUnder 18 865,963 24% 49,840 21% 2,265 27%18-34 832,415 23% 65,324 28% 1,681 20%35-49 802,209 22% 49,272 21% 1,915 22%50-64 631,908 18% 40,539 17% 1,632 19%65+ 457,524 13% 29,123 12% 1,030 12%Total 3,590,019 100% 234,098 100% 8,523 100%
Oregon South Valley Creswell
Source: Claritas. Percentages calculated by ECONorthwest. Notes: South Valley consists of the population in the zip codes for Cottage Grove, Creswell, Eugene, Pleasant Hill, and Springfield.
Table 4-3 shows the percent of population by education level completed in Creswell, other communities in the southern Willamette Valley, and Oregon. Table 4-3 shows that the majority of Creswell’s residents cluster around being a high school graduate, having some college, or having an associates degree (69%). Eugene’s share of population with a Bachelor’s or graduate degree is above the state average. Creswell’s share of population with a Bachelor’s or graduate degree is below both Eugene and the state average.
Table 4-3. Percent of population by education completed in Oregon, Cottage Grove, Creswell, Eugene, and Springfield, 2000
Educational attainment OregonCottage
Grove Creswell Eugene SpringfieldLess than 9th grade 5% 6% 2% 2% 5%9th to 12th grade, no diploma 11% 16% 16% 7% 14%High school graduate (includes equivalency) 27% 32% 28% 19% 33%Some college, no degree 28% 30% 33% 34% 29%Associate degree 6% 7% 8% 6% 6%Bachelor's degree 15% 6% 8% 19% 9%Graduate or professional degree 8% 3% 4% 12% 3%Total Population 100% 100% 100% 100% 100%
Source: U.S. Census Bureau, Census 2000. Percentages calculated by ECONorthwest.
The percent of population by race/ethnicity in Creswell is shown in Table 4-4. This table shows that the distribution in Creswell is roughly similar to that in the South Valley region. However, the South Valley and Creswell have a larger share
Page 4-4 ECONorthwest March 2005 Creswell Economic Opportunities

of White population and correspondingly lower shares of Hispanic and Black populations.
Table 4-4. Percent of population by race/ ethnicity in Oregon, the South Valley region, and the Creswell zip code area, 2004
Oregon South Valley Lane County CreswellWhite Population 2,927,296 201,761 291,307 7,614 Percentage 82% 86% 90% 89%Black Population 57,207 2,170 2,469 21 Percentage 2% 1% 1%His
0%panic
Population 338,056 13,428 9,370 428 Percentage 9% 6% 3%Other Po
5%
pulation 267,460 16,739 21,252 460 Percentage 7% 7% 7%Total Po
5%
pulation 3,590,019 234,098 324,398 8,523 Percentage 100% 100% 100% 100%
Source: Claritas. Percentages calculated by ECONorthwest. Note: South Valley consists of the population in zip codes for Cottage Grove, Creswell, Eugene, Pleasant Hill, and Springfield.
Table 4-5 shows the percent of population by occupation in Oregon, the South Valley region, and Creswell. This table shows that the distribution of occupations for residents of the Creswell zip code area is roughly similar to that of the surrounding South Valley region and Oregon. The largest differences appear in Management and Service occupations (where Creswell has a larger share) and in Sales occupations (where Creswell has a lower share).
Creswell Economic Opportunities ECONorthwest March 2005 Page 4-5

Table 4-5. Population by occupation in Oregon, the South Valley region, and the Creswell zip code area, 2004
Occupation Population Percent Population Percent Population PercentNot In Labor Force 981,626 34.7% 65,660 34.5% 2,363 36.3%In Armed Forces 2,786 0.1% 71 0.0% 0 0.0%Civilian, Unemployed 118,437 4.2% 8,046 4.2% 295 4.5%Civilian, Employed 1,725,058 61.0% 116,479 61.2% 3,858 59.2%
Management Occupations, Except Farmers and Farm Managers 150,342 5.3% 9,150 4.8% 362 5.6%Farmers and Farm Managers 13,846 0.5% 303 0.2% 36 0.6%Business Operations Specialists 34,097 1.2% 1,972 1.0% 36 0.6%Financial Specialists 32,344 1.1% 1,949 1.0% 39 0.6%Computer and Mathematical Occupations 39,508 1.4% 2,331 1.2% 9 0.1%Architecture and Engineering Occupations 39,101 1.4% 1,733 0.9% 10 0.2%Life, Physical, and Social Science Occupations 17,830 0.6% 1,560 0.8% 38 0.6%Community and Social Services Occupations 28,992 1.0% 2,365 1.2% 54 0.8%Legal Occupations 16,022 0.6% 1,382 0.7% 32 0.5%Education, Training, and Library Occupations 93,014 3.3% 8,194 4.3% 251 3.9%Arts, Design, Entertainment, Sports, and Media Occupations 35,860 1.3% 3,274 1.7% 76 1.2%
Healthcare Practitioners and Technical Occupations 71,023 2.5% 5,013 2.6% 144 2.2%Healthcare Support Occupations 32,279 1.1% 2,161 1.1% 86 1.3%Protective Service Occupations 26,830 0.9% 1,286 0.7% 42 0.6%Food Preparation and Serving Related 87,763 3.1% 5,980 3.1% 124 1.9%Building and Grounds Cleaning, and Maintenance Occupations 58,256 2.1% 4,009 2.1% 196 3.0%Service Occupations: Personal Care and Service Occupations 57,193 2.0% 4,274 2.2% 253 3.9%Sales and Related Occupations 196,643 7.0% 14,142 7.4% 310 4.8%Office and Administrative Support Occupations 254,599 9.0% 17,195 9.0% 572 8.8%Farming, Fishing, and Forestry Occupations 29,126 1.0% 1,095 0.6% 59 0.9%Construction and Extraction Occupations 93,012 3.3% 5,549 2.9% 228 3.5%
Installation, Maintenance, and Repair Occupations 64,304 2.3% 4,400 2.3% 229 3.5%Production Occupations 140,860 5.0% 9,880 5.2% 319 4.9%Transportation and Material Moving Occupations 112,214 4.0% 7,282 3.8% 353 5.4%
Totals 2,827,907 100.0% 190,256 100.0% 6,516 100.0%
Oregon South Valley Creswell
Source: Claritas. Percentages calculated by ECONorthwest. Note: South Valley consists of the population in zip codes for Cottage Grove, Creswell, Eugene, Pleasant Hill, and Springfield.
The implications of the workforce analysis reinforce the point made earlier in this chapter that Creswell can attract a workforce from the surrounding region. In addition, it appears that the workforce in the Creswell zip code area is very similar to that for the surrounding region in terms of educational attainment, race/ethnicity, and occupation. Thus it does not appear that workforce will be a constraint on employment growth in Creswell or have a substantial impact on the type of employment growth likely to occur.
HOUSING Housing is an important component of any economic development strategy
because it affects the type of residents and employers who might be attracted to the community. Goal 10 requires cities to develop strategies to provide housing affordable to households at all income levels. In addition to concerns about availability of housing affordable to lower income households, providing higher-
Page 4-6 ECONorthwest March 2005 Creswell Economic Opportunities

quality housing for managers and skilled workers should also be considered in both housing and economic development strategies.
As part of the City of Creswell and Creswell Region Economic Development Plan, LCOG compiled a community profile which includes data on housing trends in Creswell. Table 4-6 shows housing units within the Creswell UGB by type, with a comparison to the distribution of housing types in Lane County. Table 4-6 shows that almost two-thirds of the housing within the Creswell UGB is Single Family and another 15% of housing is Manufactured Dwellings in Parks. Compared to Lane County, Creswell has a larger share of Manufactured Dwellings in Parks and a lower share of housing in Multi-Family developments.
Table 4-6. Housing units by type in the Creswell UGB and Lane County, January 2004
Lane CountyHousing Type Units Percent PercentSingle Family 1,130 63% 60%Duplex 79 4% 7%Multi-Family 190 11% 20%Manufactured Dwelling 139 8% 8%Manufactured Dwelling in Park 260 15% 5%Total 1,798 100% 100%
Creswell UGB
Source: Lane Council of Governments. 2004. City of Creswell and Creswell Region Economic Development Plan, August.
Census data shows that roughly 70% of Creswell’s housing stock was built after 1969. Housing development in Creswell over the last three decades has provided new built and manufactured single-family homes in subdivision developments. Some of these developments have homes targeted at first-time homebuyers and young families with prices that are relatively lower than prices for similar homes in the Eugene-Springfield market. The result is that Creswell has attracted many families looking for housing value, many with one or more members that work in Eugene-Springfield. The relatively lower cost of housing has also helped Creswell attract employers who are looking for communities where their owners and workers can afford to live.
In addition, recent residential development near the Emerald Valley Resort on the east side of Creswell has provided high-quality expensive housing for professionals and retirees with relatively higher incomes. Owners of businesses like to live near their business, regardless of their income. The diversity of housing types is an asset for economic development in Creswell as it can help attract a variety of firms and firms with workers in a range of income levels.
PUBLIC SERVICES PLANNING AND SUPPORT FOR ECONOMIC DEVELOPMENT
The City of Creswell's Comprehensive Plan contains a range goals and policies supportive of economic development in Creswell. These goals and policies include:
Creswell Economic Opportunities ECONorthwest March 2005 Page 4-7
• The City shall encourage local economic expansion by providing an adequate choice of industrial sites with public services.
• The City shall encourage expansion of freeway oriented services to capitalize on through and tourist traffic.
• The City shall, through industrial and commercial diversification, create jobs to employ the currently unemployed.
The Lane Council of Governments published an Economic Development Plan for the City of Creswell in 2004.2 this Plan was developed by a committee of Creswell residents and business owners. The Economic Development Plan states the Committee’s vision for economic development as:
Attract and promote sustainable industries with a long-term interest in the Creswell region. These industries shall be small, clean, and provide family-wage jobs. Industries and businesses shall also include opportunities for local residents to work and shop.
The Economic Development Plan identifies a goals and strategies to support the vision for economic development. Goals and strategies that have implications for the potential type of employment growth in Creswell include:
• Support and enhance existing business enterprises on both sides of the railroad and Interstate 5.
• Develop sites along the Interstate 5 corridor to attract tourism and create jobs.
• Promote small businesses with 10–50 employees. • Create office space for professionals and professional businesses. • Create a business park. • Encourage and facilitate retail growth that serves and accompanies
Creswell’s residential growth. • Provide adequate industrial lands for new or expanding businesses. • Recruit a state government headquarters for Creswell. • Promote airport-related businesses and industries. • Encourage downtown property owners to redevelop their properties as
appropriate. • Encourage tourism by marketing Emerald Valley Resort and its
championship golf course.
The Economic Development Plan also identifies industries that were found to be compatible with Creswell’s vision for economic development, on the State targeted industries list, and make the most of Creswell’s location.:
• Health care • Assisted living facilities • Wood products • Corporate office space
2 Lane Council of Governments. 2004. City of Creswell and Creswell Region Economic Development Plan. August.
Page 4-8 ECONorthwest March 2005 Creswell Economic Opportunities

• Distribution • Logistics center • Transportation-related • Airport-related • Government headquarters/office • Sports-equipment related • Recreation-related
Actions recommended in the Economic Development Plan for the City of Creswell include steps that would support employment growth in Creswell. These steps include:
• Creating State-certified “shovel-ready” development sites. • Working with ODOT on permitting for sites adjacent to highways and the
railroad. • Providing an adequate supply of buildable commercial and industrial lands
in Creswell. • Increased marketing and outreach, including development of a buildable
lands map, marketing materials, application assistance, collaboration with other small cities and towns in Lane County, a business recruiting committee, and an economic plan implementation committee.
These adopted goals, policies, and strategies show that the City of Creswell supports economic development and is willing to take steps to accommodate and encourage employment growth in the community. The types of industries and commercial activities supported by these policies reflect the existing mix of employers in Creswell and Creswell’s comparative advantages identified in this chapter.
WATER The City of Creswell provides water service in the community. According to
Ron Staehlin, Professional Engineer at Southwood Engineering, the City relies on the Coast Fork of the Willamette River for its water supply. This water supply has the capacity to provide 2,010 gallons/minute (2.9 million gallons/day) but treatment capacity is limited to 1,400 gallons/minute at full capacity (2.0 million gallons/day). However, during winter, turbidity limits treatment capacity to only 300 gallons/minute (432,000 gallons/day).
If the City were to expand treatment to be sufficient to the full water supply (2,010 gallons/minute) it would support a population of 4,944. The City’s 20-year population projection for 2025 will require a water supply and treatment capacity of 2,843 gallons/minute. Mr. Staehlin recommends that the City expand its treatment capacity by adding pre-treatment facilities and doubling the size of its filters. This expansion will require investment by the City of Creswell, and funds have not been identified to pay for these improvements.
While the City’s water supply has capacity for growth, the City’s water storage facilities are currently inadequate. Creswell currently needs capacity to
Creswell Economic Opportunities ECONorthwest March 2005 Page 4-9
store 1.6 million gallons for its current population but has only 1.22 million gallons of storage. For the 20-year population projection the City will need 4.3 million gallons of storage. Mr. Staehlin is proposing that the City develop a new 3 million gallon water storage tank to supplement its existing storage capacity. Such a tank will give Creswell enough storage capacity to support its projected 2025 population.
WASTEWATER The City of Creswell provides wastewater collection and treatment for
development in Creswell west of I-5. According to Steve Cilest at West Yost Engineering, treatment capacity is the most limiting aspect of the wastewater system in Creswell. The City currently uses a lagoon system that is likely to hit capacity soon. The City has decided to hold off on expanding treatment capacity until the State Department of Environmental Quality establishes treatment requirements for water discharged into Camas Swale Creek, which the City system discharges into. The DEQ study of Camas Swale Creek is currently underway.
The City is just finishing other improvements to its wastewater treatment facility that will increase capacity. With these improvements, this facility (except the lagoons) will have capacity to support the 20-year population projected by the Lane Council of Governments. Expansion or replacement of the treatment lagoons will need to wait five to ten years until the DEQ makes its final recommendations.
The portions of Creswell east of I-5 are served by a private wastewater treatment system. This system currently has capacity for additional development, but its owners are not allowing new residential development to connect to the system until they are done with their own commercial developments in the area. The City seeks to eventually have the two wastewater systems connected.
We assume that the City will be able to resolve issues with discharging into Camas Swale Creek in order to expand its treatment capacity and will eventually connect the systems on both sides of I-5. Thus, wastewater treatment should not be a constraint to future employment growth in Creswell.
UTILITIES Natural gas is distributed in the Creswell area by Northwest Natural Gas
Company. Emerald People’s Utility District (EPUD) and Pacific Power & Light provide electricity. Both natural gas or electricity capacity appear to be sufficient to support future employment growth in Creswell.
TRANSPORTATION Creswell is located on Interstate 5, a primary north-south transportation
corridor linking Creswell to domestic markets in the United States and international markets via west coast ports. The Creswell interchange on I-5 is the
Page 4-10 ECONorthwest March 2005 Creswell Economic Opportunities

only interchange for about five miles north or south along the freeway. Creswell is also located on Highway 99, which runs parallel to I-5 in the Creswell area and provides alternative access to Eugene-Springfield and Cottage Grove.
The I-5 overpass in Creswell is in the process of being reconstructed to provide sidewalks that will improve pedestrian safety and access. This interchange, however, will continue to use the existing on- and off-ramps. These ramps may need to be improved in the future to serve additional traffic generated by population and employment growth in Creswell.
In addition to its location on I-5, Creswell is also served by rail. The Central Oregon and Pacific Railroad (COPR) operates on the Siskiyou line that runs parallel to I-5 and Highway 99 through Creswell. Currently, the COPR operates two freight and two local trains through Creswell, six days per week. One spur line currently exists in the Creswell area to serve Bald Knob Lumber Mill.3 This service allows connection to the Union Pacific Railroad in Eugene, with connections to national and international markets. Railroad service is primarily used by businesses that rely on shipments of large quantities of commodities such as lumber, grains, and chemicals.
Creswell is also served by transit service provided by the Lane Transit District (LTD), which operates Route 98 through Creswell linking Eugene-Springfield to Cottage Grove. A bus covers this route six times on weekdays, three times on Saturday and twice on Sunday. This bus route also stops at the main campus of Lane Community College in Eugene.
Residents and businesses in Creswell have access to the Eugene Airport, which is about a 30-minute drive from Creswell. The Eugene Airport offers scheduled flights with connections available to national and international destinations. The City of Creswell owns and operates Hobby Field, which is classified as a basic utility general aviation airport. Hobby Field is popular with private pilots—it is ranked as the third-busiest CAT4 General Aviation airport and serves as a reliever for the Eugene Airport. A survey by the Oregon Department of Aviation measured 23,000 operations (1 landing plus 1 take-off) at Hobby Field in 2001.
RENEWABLE AND NON-RENEWABLE RESOURCES Goal 9 requires economic development plans to be based on a consideration of
the availability of renewable and non-renewable resources and pollution control requirements in the planning jurisdiction. Goal 9 goes on to state that economic projections should take into account the availability of natural resources to support the expanded development, and that plans to improve the economy should consider as a major determinant the carrying capacity of the air, land, and water resources of the planning area.
3 Lane Council of Governments. 2004. City of Creswell and Creswell Region Economic Development Plan. August.
Creswell Economic Opportunities ECONorthwest March 2005 Page 4-11

The carrying capacity of land and water have been addressed in this chapter with the discussion of buildable lands, water supply, and wastewater treatment capacity. Thus, this section will focus on the capacity of air to support economic development in Creswell. The discussion of air pollution in this section is drawn from the Lane Regional Air Pollution Authority 1998 Annual Report, the latest annual report available on their web site.4
Much of the inland areas of Lane County experience periods of air stagnation. When this happens during winter months, cold air often becomes trapped near the valley floor with warm air aloft creating temperature inversion conditions. The combination of cold stagnant air and restricted ventilation causes air pollutants to become trapped near the ground. Although temperature inversions can occur anytime, they are most frequent and pose most harm to air quality in the winter when residents are using wood to heat their homes. During these episodes, smoke and gas concentrations climb, deteriorating the local air quality.
The Environmental Protection Agency (EPA) has established health standards for six outdoor air pollutants (criteria pollutants): particulate matter (PM10 and PM2.5), ozone (O3), carbon monoxide (CO), sulfur dioxide (SO2), nitrogen dioxide (NO2) and lead (Pb). These National Ambient Air Quality Standards (NAAQS) are based on protection against adverse health and environmental effects. The concentrations of criteria pollutants must be continually measured to ensure the standards are met. Areas that fail to meet the NAAQS are designated as federal “non-attainment” areas by EPA and are required, by law, to have strategic plans developed to bring the areas back into compliance with the standards and maintain compliance.
In Lane County, four criteria pollutants are measured: particulate matter, carbon monoxide, ozone and lead. The Eugene/Springfield area is monitored for all four pollutants. LRAPA measures pollutants at five locations in Eugene, one location in Springfield, one location in Saginaw (south of Eugene/Springfield), and one location in Cottage Grove (south of Saginaw).
The Eugene/Springfield area has been designated PM10 "non-attainment" area, although PM10 standards were last exceeded in the Eugene/Springfield area in 1987. Eugene-Springfield has been in attainment of EPA standards for the other three monitored pollutants since 1994. There is no indication that the level of air pollutants in Lane County will pose a constraint on economic development in Creswell over the planning period.
QUALITY OF LIFE Quality of life is difficult to assess because it is subjective—different people
will have different opinions about factors affect quality of life, desirable characteristics of those factors, and the overall quality of life in any community. Economic factors such as income, job security, and housing cost are often cited as
4 Lane Regional Air Pollution Authority. 1998 LRAPA Annual Report. http://www.lrapa.org/public_education/annual_reports/ Accessed 12/13/04.
Page 4-12 ECONorthwest March 2005 Creswell Economic Opportunities

important to quality of life. These economic factors and overall economic conditions are the focus of this report, so this section will focus on non-economic factors that affect quality of life.
Creswell’s qualify of life, combined with its access and proximity to jobs, shopping, services, and cultural amenities in Eugene-Springfield, is a key comparative advantage for economic development. Creswell’s Economic Development Plan (August 2004) identified factors that affect this quality of life in Creswell, which are confirmed by field work and contacts with real estate and economic development specialists familiar with Creswell. These factors include:
• Small-town character and feel in Creswell.
• Local schools that are supported in the community.
• Community spirit.
• Access to recreational opportunities including golf, flying, bicycling, hiking, fishing, and hunting.
• Rural lifestyle with access to urban amenities.
• An attractive downtown.
Creswell’s location and quality of life suggest that it will continue to attract residents and businesses that are attracted to the southern Willamette Valley but prefer the lifestyle of a smaller town.
Chapter 5 will consider the national and regional economic conditions described in Chapter 3 and the local factors affecting economic development described in this chapter to develop an employment projection for the Creswell UGB.
CRESWELL’S COMPARATIVE ADVANTAGES The mix of productive factors present in Creswell, relative to other
communities in the Willamette Valley, form Creswell’s comparative advantage. A primary comparative advantage in Creswell is its proximity to larger urban areas and location on I-5, along with its small-town character. This makes Creswell attractive to residents and businesses who want to live and work in a community that has small-town character but still need to have access to urban amenities, a large and skilled workforce, and supplies and services available in larger communities as well as access to major transportation networks.
Chapter 3 reports industries that have shown growth and business activity in Oregon over the past few years. These industries are indicative of businesses that might locate or expand in Creswell. The characteristics of Creswell will affect the types of businesses most likely to locate in Creswell:
Creswell Economic Opportunities ECONorthwest March 2005 Page 4-13

• The presence of the Creswell Airport could help Creswell attract businesses engaged in the manufacture and service of aircraft, avionics, and related equipment.
• Creswell’s semi-rural setting, access to I-5, and workforce availability make Creswell attractive for businesses in manufacturing. Examples include the manufacture of RVs and related equipment, high-tech electronics, food processing, industrial equipment, recreational equipment, and other specialty manufacturing.
• Creswell’s semi-rural setting, access to I-5, and workforce availability also make Creswell attractive for businesses in warehousing and transportation. Large warehouse facilities that serve large areas appear to be favoring locations in the mid-Willamette Valley—examples include the Lowe’s distribution warehouse in Lebanon and the WinCo distribution facility in Woodburn. Creswell is more likely to attract more modest facilities that serve a smaller geographic region or that specialize in fewer goods.
• Creswell’s attractive semi-rural setting could make it a location for software design, engineering, research, and other professional services that are attracted to high-quality settings.
• The availability of commercial land east of the I-5 interchange may be attractive to call centers and back-office operations that need to attract employees from the larger labor market.
Cities exist in an economic hierarchy in which larger cities offer a wider range of goods and services than smaller cities. The location of a community relative to larger cities, as well as its absolute size, affects the mix of goods and services that can be supported by a small city. Creswell’s small size and location between Eugene-Springfield and Cottage Grove has implications for the types of retail and service firms most likely to locate in Creswell:
• Big-box retail is unlikely to locate in Creswell because of its proximity to Eugene-Springfield and Cottage Grove. Big-box retailers are more likely to locate in these larger communities, because both have a larger customer base and are within a short drive of Creswell.
• Creswell may be able to support a mid-size discount store such as a Bi-Mart, but is unlikely to support another large grocery or other big-box retail businesses over the planning period.
• Population growth in Creswell will drive more development of small and specialty retail, both in new and traditional areas of Creswell.
• Small towns with an I-5 interchange are common locations for factory outlet centers, which are a retail destination.
Page 4-14 ECONorthwest March 2005 Creswell Economic Opportunities

Creswell Economic Opportunities ECONorthwest March 2005 Page 4-15
Chapter 5 Employment Forecast
To provide for at least an adequate supply of commercial and industrial sites consistent with plan policies, Creswell needs to have an estimate of the amount of commercial and industrial land that will be needed over the planning period. Demand for commercial and industrial land will be driven by the expansion and relocation of existing businesses and new businesses locating in Creswell. The level of this business expansion activity can be measured by employment growth in Creswell. This chapter presents a projection of future employment levels in Creswell for the purpose of estimating demand for commercial and industrial land.
The projection of employment in this chapter has three major steps: 1. Establish base employment for the projection. We start with the
estimate of covered employment in Creswell’s UGB presented in Chapter 3. Covered employment does not include all workers, so we adjust covered employment to reflect total employment in Creswell. Employment by sector will be summarized into employment by land use type for the purposes of estimating land demand by type.
2. Identify potential growth industries in Creswell. Given trends in economic activity and expected growth in Oregon, and Creswell’s comparative advantages, we identify the types of firms and industries that may locate in Creswell.
3. Project total employment. The projection of total employment will consider a variety of factors, including historical growth rates and projections for Lane County.
4. Allocate total employment to land use types. This allocation will use assumptions based on expected trends in employment growth by land use type.
The remainder of this chapter is organized by headings that correspond to these three major steps for the projection.
EMPLOYMENT BASE FOR PROJECTION Chapter 3 presents an estimate of 2003 covered employment in the Creswell
UGB. Covered employment refers to employment that is covered by unemployment insurance laws. Covered employment does not include jobs that are not covered by unemployment insurance laws, primarily self-employed proprietors. To estimate the share of total employment in Creswell that is not included in covered employment, we compared estimates for total and covered employment for Lane County. The U.S. Department of Commerce, Bureau of Economic Analysis provides estimates of total employment by county that include self-employed proprietors and other workers not covered by unemployment insurance. We compared the estimates of total employment from the BEA to covered employment reported by the Oregon Employment Department. The
Creswell Economic Opportunities ECONorthwest March 2005 Page 5-1

resulting percent of total employment included in covered employment in shown in Table 5-1.
Table 5-1. Total employment by land use type in the Creswell UGB, 2003 Covered Covered % Total % of Total
Land Use Type/Sector Employment of Total Employment EmploymentIndustrial 380 476 41%Agriculture, Forestry, Fishing & Hunting 11 67% 16 1%Construction 93 63% 148 13%Manufacturing 168 99% 170 15%Wholesale Trade 17 87% 20 2%Transportation & Warehousing 4 68% 6 1%Admin Support & Cleaning Services 87 75% 116 10%Commercial 532 470 41%Retail Trade 168 80% 209 18%Accommodation & Food Services 109 92% 118 10%Finance & Insurance 15 64% 24 2%Real Estate & Rental & Leasing 37 31% 119 10%Professional, Scientific, & Technical Services 14 54% 26 2%Health Care & Social Assistance 92 80% 115 10%Other Services (except Public Administration) 41 51% 81 7%Information, Management, Arts & Education 56 63% 89 8%Public 172 205 18%Government 172 84% 205 18%Total Employment 1,084 94% 1,151 100% Source: Covered employment from confidential ES-202 employment data provided by the Oregon Employment Department; employment by sector in the Creswell UGB summarized by ECONorthwest. Covered % of total employment calculated by ECONorthwest from comparison of total employment estimates by the U.S. Department of Commerce, Bureau of Economic Analysis (CA25) and covered employment data from the Oregon Employment Department for Lane County. Total employment estimates by ECONorthwest.
Table 5-1 shows that covered employment includes 74% of total employment in Creswell based on our comparison of covered and total employment in Lane County and the composition of employment by sector in the Creswell UGB. The share of total employment included in covered employment varies by sector, from a low of 31% in Real Estate to a high of 92% in Accommodation % Food Services. The percentages shown in Table 5-1 correspond with our expectation that industries have a higher share of self-employed proprietors, like Real Estate, Professional Services, and Construction, have a lower share of jobs in covered employment than sectors where most employees earn a wage or salary, such as Manufacturing and Accommodation & Food Service. The adjustment to convert covered employment to total employment increases employment in Creswell by 378 jobs or 35%, from 1,084 covered jobs to 1,462 total jobs.
Table 5-1 also classifies sectors by land use type. These land use types are the categories that will be used to project employment growth for the purposes of estimating land demand in the Creswell UGB. Sectors with similar land use types are grouped together in Table 5-1. For example, Admin Support & Cleaning Services is included in the Industrial land use type because most of these firms in Creswell are engaged in landscaping, cleaning, and road flagging.
Page 5-2 ECONorthwest March 2005 Creswell Economic Opportunities
POTENTIAL GROWTH INDUSTRIES IN CRESWELL The analysis of economic conditions and trends in Chapter 3 and of
Creswell’s comparative advantages in Chapter 4 have implications for industries with potential for growth in Creswell. These implications include the following:
• Creswell should be attractive for firms engaged in a range of specialty manufacturing, including aircraft, RVs, high-tech electronics, food processing, industrial equipment, and recreational equipment.
• Creswell should also be attractive for firms engaged in warehousing and distribution. Creswell is most likely to attract modestly-sized facilities that serve a small geographic region or that specialize in fewer goods.
• Creswell might be attractive for firms engaged in software design, engineering, research, and other professional services.
• Creswell may be able to support a mid-size discount store such as a Bi-Mart, but is unlikely to support another large grocery or other big-box retail businesses.
• Population growth in Creswell will drive more development of small and specialty retail, both in new and traditional areas of Creswell.
• Small towns with an I-5 interchange are common locations for factory outlet centers.
In addition to these implications, population growth in Creswell will drive growth in local government and school employment.
PROJECTION OF TOTAL EMPLOYMENT The analysis of economic conditions in Creswell includes a variety of
indicators for likely future levels of employment in the Creswell UGB. These indicators include the following:
• Employment in Census Tract 11, which includes Creswell and the surrounding rural area, grew at an average annual rate of 1.4% over the 1978–1998 period.
• The Oregon Employment Department projects total covered employment in Lane County to grow at an average annual rate of 1.2% over the 2002–2012 period.
• The 1998 Creswell Transportation System Plan included an employment forecast showing Creswell adding 750 jobs between 1994 and 2015, with an average annual growth rate of 2.8%.
• The 2001 Creswell Urban Growth Boundary Land Analysis included a forecast showing employment in the Creswell UGB growing by 467 jobs between 1998 and 2020, with an average annual growth rate of 1.8%.
Creswell Economic Opportunities ECONorthwest March 2005 Page 5-3
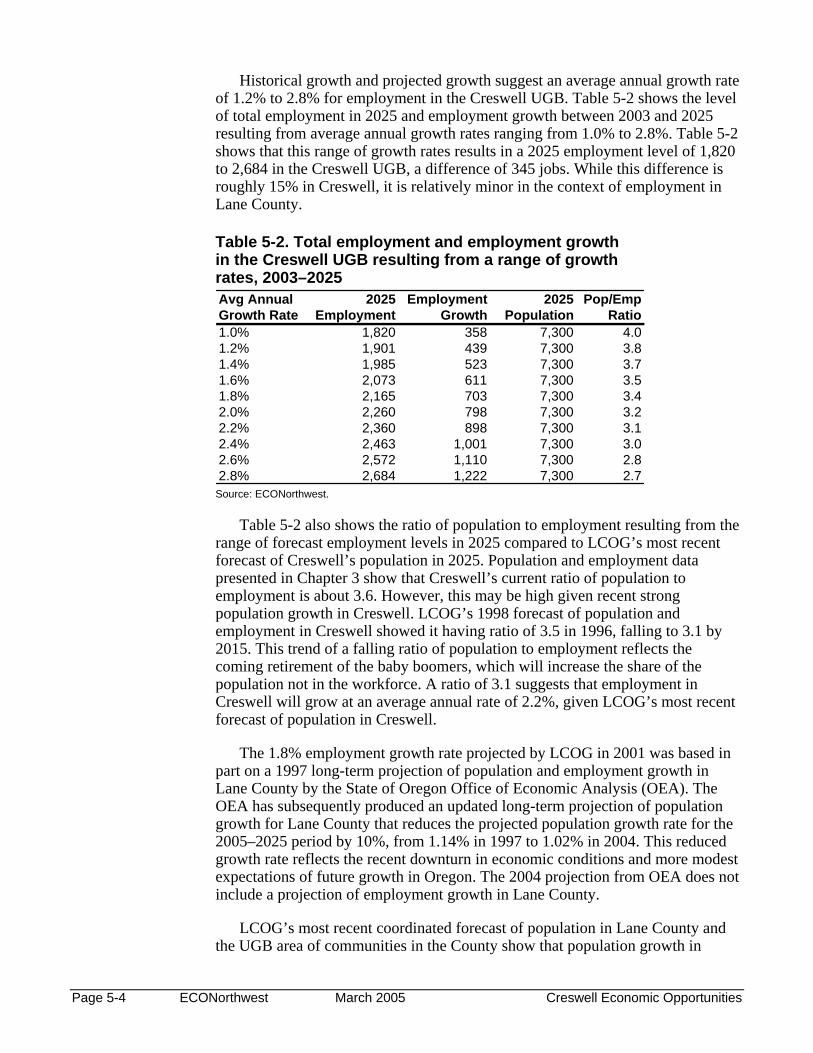
Historical growth and projected growth suggest an average annual growth rate of 1.2% to 2.8% for employment in the Creswell UGB. Table 5-2 shows the level of total employment in 2025 and employment growth between 2003 and 2025 resulting from average annual growth rates ranging from 1.0% to 2.8%. Table 5-2 shows that this range of growth rates results in a 2025 employment level of 1,820 to 2,684 in the Creswell UGB, a difference of 345 jobs. While this difference is roughly 15% in Creswell, it is relatively minor in the context of employment in Lane County.
Table 5-2. Total employment and employment growth in the Creswell UGB resulting from a range of growth rates, 2003–2025 Avg Annual 2025 Employment 2025 Pop/EmpGrowth Rate Employment Growth Population Ratio1.0% 1,820 358 7,300 4.01.2% 1,901 439 7,300 3.81.4% 1,985 523 7,300 3.71.6% 2,073 611 7,300 3.51.8% 2,165 703 7,300 3.42.0% 2,260 798 7,300 3.22.2% 2,360 898 7,300 3.12.4% 2,463 1,001 7,300 3.02.6% 2,572 1,110 7,300 2.82.8% 2,684 1,222 7,300 2.7
Source: ECONorthwest.
Table 5-2 also shows the ratio of population to employment resulting from the range of forecast employment levels in 2025 compared to LCOG’s most recent forecast of Creswell’s population in 2025. Population and employment data presented in Chapter 3 show that Creswell’s current ratio of population to employment is about 3.6. However, this may be high given recent strong population growth in Creswell. LCOG’s 1998 forecast of population and employment in Creswell showed it having ratio of 3.5 in 1996, falling to 3.1 by 2015. This trend of a falling ratio of population to employment reflects the coming retirement of the baby boomers, which will increase the share of the population not in the workforce. A ratio of 3.1 suggests that employment in Creswell will grow at an average annual rate of 2.2%, given LCOG’s most recent forecast of population in Creswell.
The 1.8% employment growth rate projected by LCOG in 2001 was based in part on a 1997 long-term projection of population and employment growth in Lane County by the State of Oregon Office of Economic Analysis (OEA). The OEA has subsequently produced an updated long-term projection of population growth for Lane County that reduces the projected population growth rate for the 2005–2025 period by 10%, from 1.14% in 1997 to 1.02% in 2004. This reduced growth rate reflects the recent downturn in economic conditions and more modest expectations of future growth in Oregon. The 2004 projection from OEA does not include a projection of employment growth in Lane County.
LCOG’s most recent coordinated forecast of population in Lane County and the UGB area of communities in the County show that population growth in
Page 5-4 ECONorthwest March 2005 Creswell Economic Opportunities

Creswell is expected to outpace growth in Lane County. Creswell has an average annual population growth rate of 2.4% between 2004 and 2025, compared to only 1.0% in Lane County. Creswell is expected to grow faster than every other community in Lane County except Coburg.
Given the expected rapid growth of population in Creswell relative to the County and the implications for the ratio of population to employment, it appears that an annual average growth rate of 2.2% for total employment in Creswell is reasonable. This fits with our expectation that Creswell will receive an increasing share of employment growth in Lane County as it becomes a more fully developed community, with a fuller range of economic activities, and from spillover caused by increasingly crowded and expensive conditions in Eugene-Springfield.
ALLOCATION OF EMPLOYMENT TO LAND-USE TYPES
All sectors will not grow at the same rate; some will grow faster than others, causing them to have an increasing share of employment in Creswell. To account for expected variations in growth rates by sector, we will use assumptions about the future share of employment by land use type. These assumptions are based on the potential growth industries identified in this chapter and the analysis of comparative advantages in Chapter 4:
• Creswell should be attractive to a range of firms engaged in specialty manufacturing, warehousing, and distribution. We assume that the share of Industrial employment in the Creswell UGB should increase slightly, from 33% in 2003 to 35% in 2025.
• We expect Retail growth in Creswell will serve the growing local population. We assume that the share of Retail employment in the Creswell UGB will increase from 32% in 2003 to 35% in 2025.
• Services, Finance, Insurance, and Real Estate are expected to have the highest growth rates in Lane County. However, much of this growth will locate in the urban centers of Eugene and Springfield. We expect growth in these sectors in Creswell to be in business that serve the local population. We assume that the share of employment in the Creswell UGB in these sectors will decline slightly over the planning period, from 21% in 2003 to 20% in 2025.
• In Creswell we expect population growth to drive demand for employment in education and other government services. Due to economies of scale, however, we assume that the share of Public employment in the Creswell UGB will decline slightly over the planning period, from 14% in 2003 to 10% in 2025.
The result of these assumptions for the share of employment by land use type and the overall average annual growth rate for total employment is shown in Table 5-3, which shows growth will be led by Commercial (517 jobs), followed
Creswell Economic Opportunities ECONorthwest March 2005 Page 5-5

by Industrial (349 jobs), and Public (31 jobs). The amount of buildable land needed to support this employment growth is estimated in Chapter 6.
Table 5-3. Projected employment growth by land use type in the Creswell UGB, 2003–2023 Land Use 2003-25Type Employment % of Total Employment % of Total GrowthIndustrial 476 33% 825 35% 349Commercial 781 53% 1298 55% 517Public 205 14% 236 10% 31Total 1,462 100% 2,360 100% 898
2003 2025
Source: ECONorthwest.
Page 5-6 ECONorthwest March 2005 Creswell Economic Opportunities

Chapter 6 Conclusion
All the preceding technical work contained in this report has been structured to comply with the Goal 9 requirements for an "Economic Opportunity Analysis." That information and structure is useful to the City for procedural reasons: it allows the City to demonstrate to state agencies that it has met state planning requirements.
Equally, if not more, important from the City's perspective is that the information is a base from which possible futures and policy options can be generated and evaluated. That evaluation will, in turn, lead to changes in policy that the City believes will increase its possibilities for achieving the future it decides to pursue.
The following conclusions are intended to raise issues for consideration in the in the next phase of this project. Some conclusions address economic development opportunities; others economic development constraints. While the conclusions ultimately relate to each other in diverse ways, we structure them around several key topics for the purpose of discussion.
BUILDABLE LANDS This section compares land demand and supply. The comparison is based on
data presented in this chapter and does not consider local policies or economic development strategies that may imply different site requirements and land needs. OAR 660-009-0025(2) requires cities to designate sufficient land in each site category to accommodate, at a minimum, the projected land needs for each category during the 20-year planning period.
Table 6-1 shows a comparison of land demand and supply for the Creswell UGB for the period 2003-2025. The results show Creswell has an overall surplus of buildable non-residential land of almost 100 acres. When analyzed by plan designation, it appears that Creswell has a surplus of Commercial and Industrial land. Public sector demand in Table 6-1 was set to zero because the City and School District reported that they can accommodate their expected growth on land they already own, so no additional land for these public uses will be needed. Public land, however, may be needed for parks to serve Creswell’s growing population.
Creswell Economic Opportunities ECONorthwest March 2005 Page 6-1
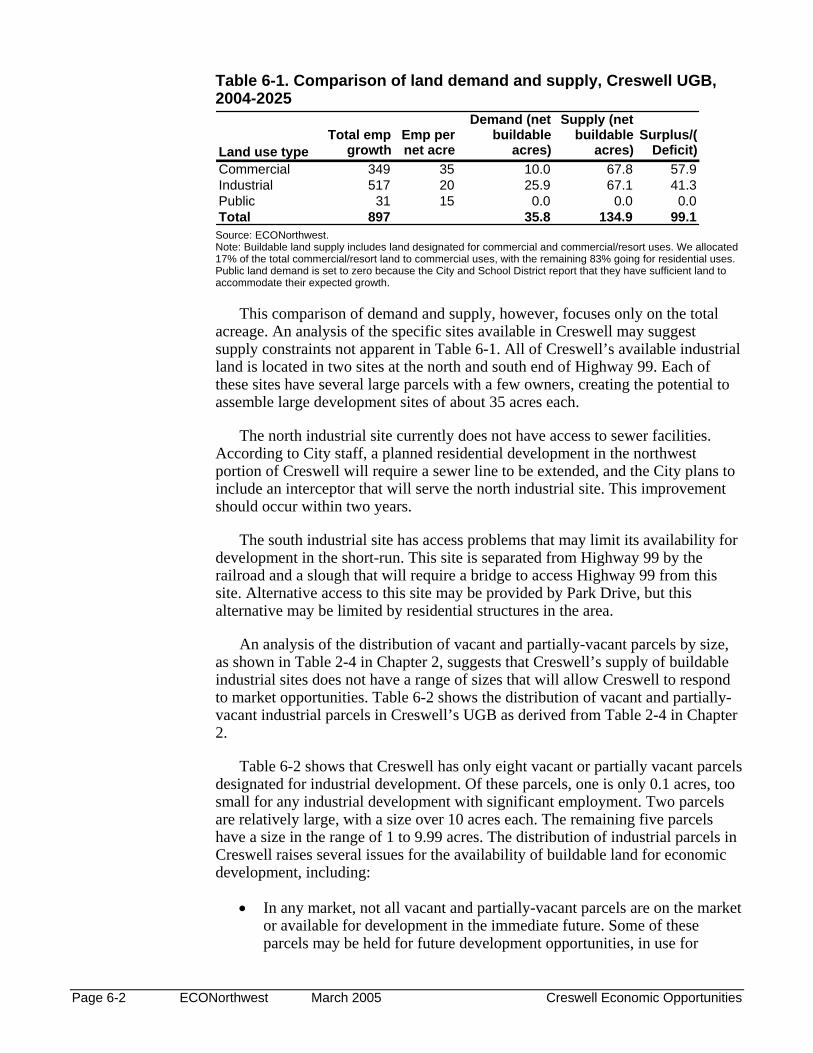
Table 6-1. Comparison of land demand and supply, Creswell UGB, 2004-2025
Land use typeTotal emp
growthEmp per net acre
Demand (net buildable
acres)
Supply (net buildable
acres)Surplus/(
Deficit)Commercial 349 35 10.0 67.8 57.9Industrial 517 20 25.9 67.1 41.3Public 31 15 0.0 0.0 0.0Total 897 35.8 134.9 99.1
Source: ECONorthwest. Note: Buildable land supply includes land designated for commercial and commercial/resort uses. We allocated 17% of the total commercial/resort land to commercial uses, with the remaining 83% going for residential uses. Public land demand is set to zero because the City and School District report that they have sufficient land to accommodate their expected growth.
This comparison of demand and supply, however, focuses only on the total acreage. An analysis of the specific sites available in Creswell may suggest supply constraints not apparent in Table 6-1. All of Creswell’s available industrial land is located in two sites at the north and south end of Highway 99. Each of these sites have several large parcels with a few owners, creating the potential to assemble large development sites of about 35 acres each.
The north industrial site currently does not have access to sewer facilities. According to City staff, a planned residential development in the northwest portion of Creswell will require a sewer line to be extended, and the City plans to include an interceptor that will serve the north industrial site. This improvement should occur within two years.
The south industrial site has access problems that may limit its availability for development in the short-run. This site is separated from Highway 99 by the railroad and a slough that will require a bridge to access Highway 99 from this site. Alternative access to this site may be provided by Park Drive, but this alternative may be limited by residential structures in the area.
An analysis of the distribution of vacant and partially-vacant parcels by size, as shown in Table 2-4 in Chapter 2, suggests that Creswell’s supply of buildable industrial sites does not have a range of sizes that will allow Creswell to respond to market opportunities. Table 6-2 shows the distribution of vacant and partially-vacant industrial parcels in Creswell’s UGB as derived from Table 2-4 in Chapter 2.
Table 6-2 shows that Creswell has only eight vacant or partially vacant parcels designated for industrial development. Of these parcels, one is only 0.1 acres, too small for any industrial development with significant employment. Two parcels are relatively large, with a size over 10 acres each. The remaining five parcels have a size in the range of 1 to 9.99 acres. The distribution of industrial parcels in Creswell raises several issues for the availability of buildable land for economic development, including:
• In any market, not all vacant and partially-vacant parcels are on the market or available for development in the immediate future. Some of these parcels may be held for future development opportunities, in use for
Page 6-2 ECONorthwest March 2005 Creswell Economic Opportunities
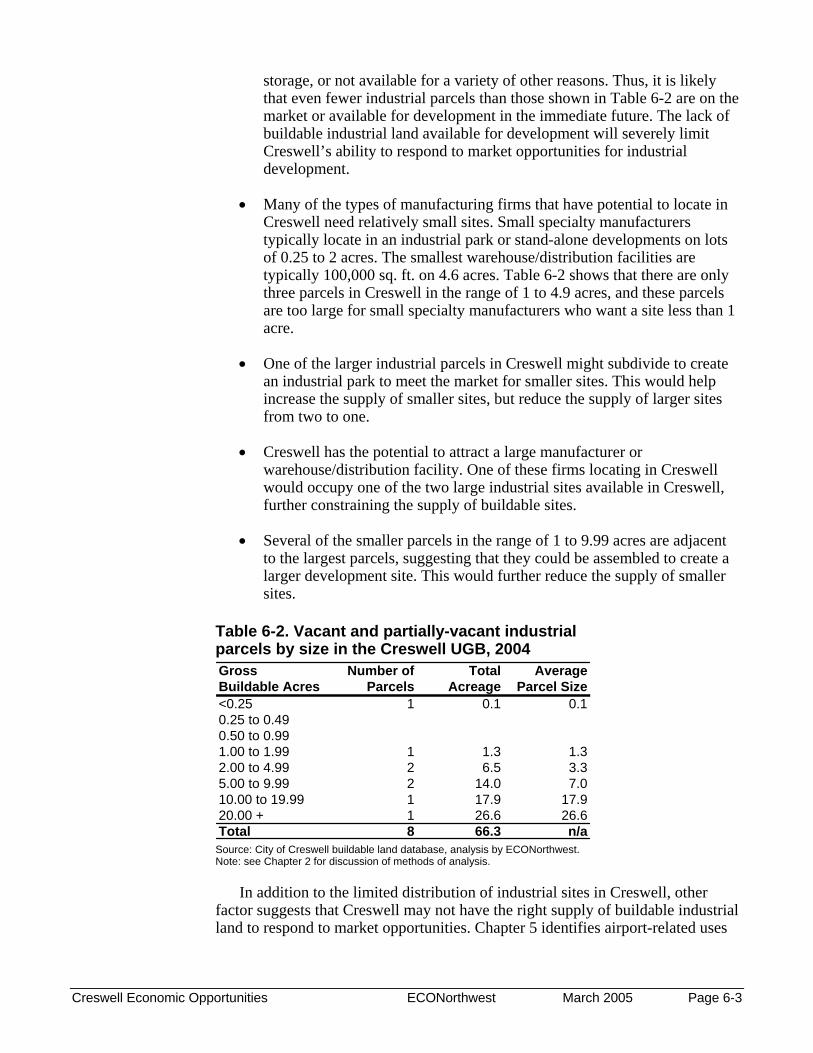
storage, or not available for a variety of other reasons. Thus, it is likely that even fewer industrial parcels than those shown in Table 6-2 are on the market or available for development in the immediate future. The lack of buildable industrial land available for development will severely limit Creswell’s ability to respond to market opportunities for industrial development.
• Many of the types of manufacturing firms that have potential to locate in Creswell need relatively small sites. Small specialty manufacturers typically locate in an industrial park or stand-alone developments on lots of 0.25 to 2 acres. The smallest warehouse/distribution facilities are typically 100,000 sq. ft. on 4.6 acres. Table 6-2 shows that there are only three parcels in Creswell in the range of 1 to 4.9 acres, and these parcels are too large for small specialty manufacturers who want a site less than 1 acre.
• One of the larger industrial parcels in Creswell might subdivide to create an industrial park to meet the market for smaller sites. This would help increase the supply of smaller sites, but reduce the supply of larger sites from two to one.
• Creswell has the potential to attract a large manufacturer or warehouse/distribution facility. One of these firms locating in Creswell would occupy one of the two large industrial sites available in Creswell, further constraining the supply of buildable sites.
• Several of the smaller parcels in the range of 1 to 9.99 acres are adjacent to the largest parcels, suggesting that they could be assembled to create a larger development site. This would further reduce the supply of smaller sites.
Table 6-2. Vacant and partially-vacant industrial parcels by size in the Creswell UGB, 2004 Gross Number of Total AverageBuildable Acres Parcels Acreage Parcel Size<0.25 1 0.1 0.10.25 to 0.490.50 to 0.991.00 to 1.99 1 1.3 1.32.00 to 4.99 2 6.5 3.35.00 to 9.99 2 14.0 7.010.00 to 19.99 1 17.9 17.920.00 + 1 26.6 26.6Total 8 66.3 n/a
Source: City of Creswell buildable land database, analysis by ECONorthwest. Note: see Chapter 2 for discussion of methods of analysis.
In addition to the limited distribution of industrial sites in Creswell, other factor suggests that Creswell may not have the right supply of buildable industrial land to respond to market opportunities. Chapter 5 identifies airport-related uses
Creswell Economic Opportunities ECONorthwest March 2005 Page 6-3
as a potential growth industry in Creswell. The City, however, does not have any buildable industrial land in the airport area currently within the UGB.
NEXT STEPS Given the context established by this Economic Opportunities Analysis, there
are several steps the City of Creswell can take to attract the type of economic development desired in the community:
1. This report shows that Creswell lacks a supply of buildable industrial sites with a variety of sizes that will allow the community to respond to market opportunities. In addition, the small number of buildable industrial sites suggests that Creswell may not have any sites available for development when an opportunity presents itself. To address these constraints, the City should consider expanding the UGB to include more areas designated for industrial development. Areas around the airport should be among the sites considered for this expansion in order to take advantage of opportunities presented by that site.
2. Actions recommended in the 2004 Economic Development Plan for the City of Creswell include steps that would support employment growth in Creswell. These steps include creating State-certified market-ready development sites and working with ODOT on permitting for sites adjacent to highways and the railroad. Creswell currently does not have any State-certified development sites and this report identifies access constraints at one of the large industrial sites in Creswell. The City should pursue certification of development sites, either now or after an expansion of the UGB, and work with ODOT and OECDD to help resolve site access issues for the southern industrial site.
3. The City has identified a vision and goals that are generally supportive of economic development in the community. The economic development planning to date, however, does not contain specific policies or actions the City should adopt to attract the type of development desired in the community. The next phase of this study will be the development on an implementation plan that identifies specific policies and actions the City might adopt to affect the level and type of economic development in the community.
Page 6-4 ECONorthwest March 2005 Creswell Economic Opportunities
Appendix A Data Definitions and Conventions
97426 ZIP CODE AREA Several data sources in this report, including ES-202 data from the Oregon
Employment Department and demographic data from Claritas, are for the 97426 zip code area, which includes Creswell and the surrounding rural area that gets mail with a Creswell address. Figure A-1 shows that the 97426 zip code area includes the City of Creswell and the surrounding rural area.
Figure A-1. 97426 zip code area
QuickTime™ and aTIFF (Uncompressed) decompressor
are needed to see this picture.
Source: U.S. Census American Fact Finder. http://factfinder.census.gov/servlet/ReferenceMapFramesetServlet?_lang=en
Creswell Economic Opportunities ECONorthwest March 2005 Page A-1