Crested Butte Real Estate Market Report YTD June 2015
7
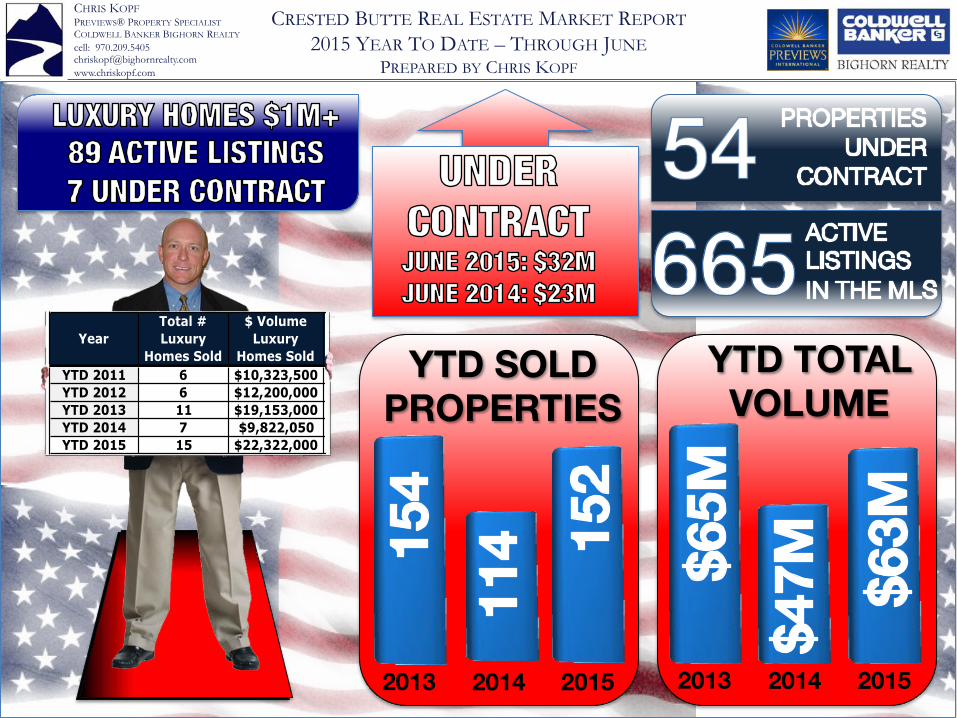
Sales Volume numbers represent all Single Family Homes, Condos, Townhomes and Land sales in the North End of the Gunnison Valley, including Almont, CB South, Rural Crested Butte, Crested Butte, Mt. Crested Butte and Rural Mt. Crested Butte as shown in the Gunnison Country Association of Realtors MLS. Information contained herein deemed reliable, but not guaranteed. CHRIS KOPF PREVIEWS® PROPERTY SPECIALIST COLDWELL BANKER BIGHORN REALTY cell: 970.209.5405 [email protected] www.chriskopf.com CRESTED BUTTE REAL ESTATE MARKET REPORT 2015 YEAR TO DATE – THROUGH JUNE PREPARED BY CHRIS KOPF YTD SOLD PROPERTIES 2013 2014 2015 2013 2014 2015 YTD TOTAL VOLUME Year Total # Luxury Homes Sold $ Volume Luxury Homes Sold YTD 2011 6 $10,323,500 YTD 2012 6 $12,200,000 YTD 2013 11 $19,153,000 YTD 2014 7 $9,822,050 YTD 2015 15 $22,322,000
-
Upload
chris-kopf -
Category
Real Estate
-
view
11 -
download
0
Transcript of Crested Butte Real Estate Market Report YTD June 2015
Sales Volume numbers represent all Single Family Homes, Condos, Townhomes and Land sales in the North End of the Gunnison Valley, including Almont, CB South, Rural Crested Butte, Crested Butte, Mt. Crested Butte and Rural Mt. Crested Butte as shown in the Gunnison Country Association of Realtors MLS. Information contained herein deemed reliable, but not guaranteed.
CHRIS KOPF PREVIEWS® PROPERTY SPECIALIST COLDWELL BANKER BIGHORN REALTY cell: 970.209.5405 [email protected] www.chriskopf.com
CRESTED BUTTE REAL ESTATE MARKET REPORT 2015 YEAR TO DATE – THROUGH JUNE
PREPARED BY CHRIS KOPF
YTD SOLDPROPERTIES
2013 2014 2015 2013 2014 2015
CONDO & TOWN HOME MEDIAN SALES PRICE
YTD TOTALVOLUME
TOTAL $ VOLUME SOLD YTD YearTotal # Luxury
Homes Sold
$ Volume Luxury
Homes Sold
Avg. Price Per Sq. Ft
YTD 2011 6 $10,323,500 $378YTD 2012 6 $12,200,000 $378YTD 2013 11 $19,153,000 $417YTD 2014 7 $9,822,050 $396YTD 2015 15 $22,322,000 $395

Sales Volume numbers represent all Single Family Homes, Condos, Townhomes and Land sales in the North End of the Gunnison Valley, including Almont, CB South, Rural Crested Butte, Crested Butte, Mt. Crested Butte and Rural Mt. Crested Butte as shown in the Gunnison Country Association of Realtors MLS. Information contained herein deemed reliable, but not guaranteed.
CHRIS KOPF PREVIEWS® PROPERTY SPECIALIST COLDWELL BANKER BIGHORN REALTY cell: 970.209.5405 [email protected] www.chriskopf.com
CRESTED BUTTE REAL ESTATE MARKET REPORT 2015 YEAR TO DATE – THROUGH JUNE
PREPARED BY CHRIS KOPF Crested Butte Real Estate Market Report –
Year to Date through June 30, 2015 Crested Butte Visitors and Real Estate Market Strong Estimates had 15,000 visitors on Elk Avenue to watch the annual 4th of July parade in historic downtown Crested Butte. With record number of visitors enjoying the culture, beauty and recreational wonders of the Crested Butte area many are also investigating and buying real estate here. As the charts and numbers show the Year to Date (YTD) trends in the Crested Butte Real Estate market up year over year and continue to be nearly identical to the results in 2013 YTD. Comparing the YTD results in 2015 we see that Total Number of Properties Sold is up 33% over last year, Total Volume is up 25%. There continues to be strong demand for quality homes at the low-end of the market, and now very little inventory below $700,000 for a single family home in the Crested Butte area. There continues to be a huge increase in lot sales with one third of all properties sold or 56 lots sold YTD vs. 20 for the same period last year. This should buoy the design and construction business in Crested Butte as well with many locals dependent on this segment. The luxury single family home space over $1 Million offers many options in quality homes for the second homeowner, in a variety of locations (qty. 91) in the Crested Butte area. Buyers are cherry picking in this segment and the average price is $1.5M. There are double the homes sold this year (qty. 15) vs. the same period last year (qty. 7), and results are similar but exceed YTD results in 2013 (qty. 11) when average price per home sold was $1.7M.
YTD Total $ Volume of Properties Sold
YTD Total Number of Properties Sold
Sales Volume numbers represent all Single Family Homes, Condos, Townhomes and Land sales in the North End of the Gunnison Valley, including Almont, CB South, Rural Crested Butte, Crested Butte, Mt. Crested Butte and Rural Mt. Crested Butte as shown in the Gunnison Country Association of Realtors MLS. Information contained herein deemed reliable, but not guaranteed.
CHRIS KOPF PREVIEWS® PROPERTY SPECIALIST COLDWELL BANKER BIGHORN REALTY cell: 970.209.5405 [email protected] www.chriskopf.com
CRESTED BUTTE REAL ESTATE MARKET REPORT 2015 YEAR TO DATE – THROUGH JUNE
PREPARED BY CHRIS KOPF
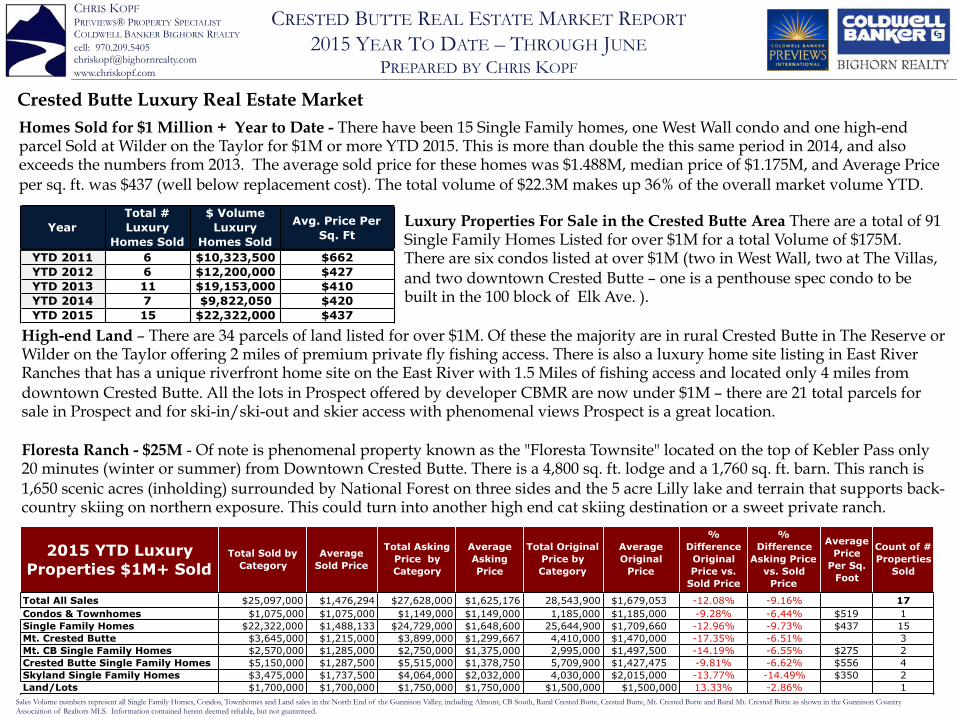
Crested Butte Luxury Real Estate Market Homes Sold for $1 Million + Year to Date - There have been 15 Single Family homes, one West Wall condo and one high-end parcel Sold at Wilder on the Taylor for $1M or more YTD 2015. This is more than double the this same period in 2014, and also exceeds the numbers from 2013. The average sold price for these homes was $1.488M, median price of $1.175M, and Average Price per sq. ft. was $437 (well below replacement cost). The total volume of $22.3M makes up 36% of the overall market volume YTD.
Luxury Properties For Sale in the Crested Butte Area There are a total of 91 Single Family Homes Listed for over $1M for a total Volume of $175M. There are six condos listed at over $1M (two in West Wall, two at The Villas, and two downtown Crested Butte – one is a penthouse spec condo to be built in the 100 block of Elk Ave. ).
High-end Land – There are 34 parcels of land listed for over $1M. Of these the majority are in rural Crested Butte in The Reserve or Wilder on the Taylor offering 2 miles of premium private fly fishing access. There is also a luxury home site listing in East River Ranches that has a unique riverfront home site on the East River with 1.5 Miles of fishing access and located only 4 miles from downtown Crested Butte. All the lots in Prospect offered by developer CBMR are now under $1M – there are 21 total parcels for sale in Prospect and for ski-in/ski-out and skier access with phenomenal views Prospect is a great location. Floresta Ranch - $25M - Of note is phenomenal property known as the "Floresta Townsite" located on the top of Kebler Pass only 20 minutes (winter or summer) from Downtown Crested Butte. There is a 4,800 sq. ft. lodge and a 1,760 sq. ft. barn. This ranch is 1,650 scenic acres (inholding) surrounded by National Forest on three sides and the 5 acre Lilly lake and terrain that supports back-country skiing on northern exposure. This could turn into another high end cat skiing destination or a sweet private ranch.
YearTotal # Luxury
Homes Sold
$ Volume Luxury
Homes Sold
Avg. Price Per Sq. Ft
YTD 2011 6 $10,323,500 $662YTD 2012 6 $12,200,000 $427YTD 2013 11 $19,153,000 $410YTD 2014 7 $9,822,050 $420YTD 2015 15 $22,322,000 $437
2015 YTD Luxury Properties $1M+ Sold
Total Sold by Category
Average Sold Price
Total Asking Price by Category
Average Asking Price
Total Original Price by Category
Average Original
Price
% Difference
Original Price vs.
Sold Price
% Difference
Asking Price vs. Sold
Price
Average Price
Per Sq. Foot
Count of # Properties
Sold
Total All Sales $25,097,000 $1,476,294 $27,628,000 $1,625,176 28,543,900 $1,679,053 -12.08% -9.16% 17Condos & Townhomes $1,075,000 $1,075,000 $1,149,000 $1,149,000 1,185,000 $1,185,000 -9.28% -6.44% $519 1Single Family Homes $22,322,000 $1,488,133 $24,729,000 $1,648,600 25,644,900 $1,709,660 -12.96% -9.73% $437 15Mt. Crested Butte $3,645,000 $1,215,000 $3,899,000 $1,299,667 4,410,000 $1,470,000 -17.35% -6.51% 3Mt. CB Single Family Homes $2,570,000 $1,285,000 $2,750,000 $1,375,000 2,995,000 $1,497,500 -14.19% -6.55% $275 2Crested Butte Single Family Homes $5,150,000 $1,287,500 $5,515,000 $1,378,750 5,709,900 $1,427,475 -9.81% -6.62% $556 4Skyland Single Family Homes $3,475,000 $1,737,500 $4,064,000 $2,032,000 4,030,000 $2,015,000 -13.77% -14.49% $350 2Land/Lots $1,700,000 $1,700,000 $1,750,000 $1,750,000 $1,500,000 $1,500,000 13.33% -2.86% 1
Sales Volume numbers represent all Single Family Homes, Condos, Townhomes and Land sales in the North End of the Gunnison Valley, including Almont, CB South, Rural Crested Butte, Crested Butte, Mt. Crested Butte and Rural Mt. Crested Butte as shown in the Gunnison Country Association of Realtors MLS. Information contained herein deemed reliable, but not guaranteed.
CHRIS KOPF PREVIEWS® PROPERTY SPECIALIST COLDWELL BANKER BIGHORN REALTY cell: 970.209.5405 [email protected] www.chriskopf.com
CRESTED BUTTE REAL ESTATE MARKET REPORT 2015 YEAR TO DATE – THROUGH JUNE
PREPARED BY CHRIS KOPF
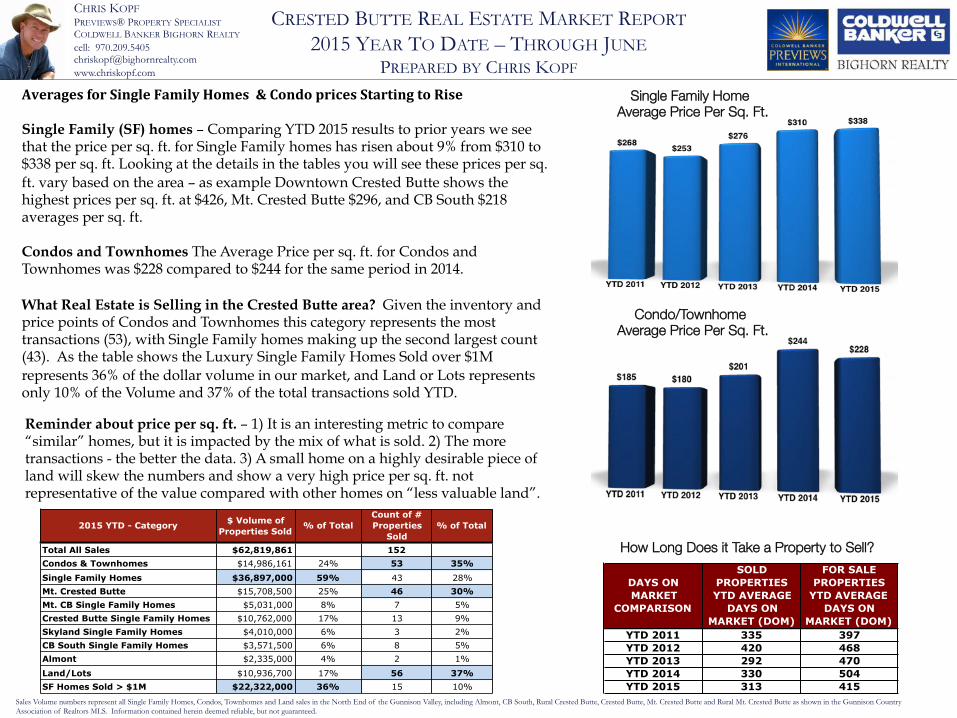
Averages(for(Single(Family(Homes((&(Condo(prices(Starting(to(Rise( Single Family (SF) homes – Comparing YTD 2015 results to prior years we see that the price per sq. ft. for Single Family homes has risen about 9% from $310 to $338 per sq. ft. Looking at the details in the tables you will see these prices per sq. ft. vary based on the area – as example Downtown Crested Butte shows the highest prices per sq. ft. at $426, Mt. Crested Butte $296, and CB South $218 averages per sq. ft. Condos and Townhomes The Average Price per sq. ft. for Condos and Townhomes was $228 compared to $244 for the same period in 2014. What Real Estate is Selling in the Crested Butte area? Given the inventory and price points of Condos and Townhomes this category represents the most transactions (53), with Single Family homes making up the second largest count (43). As the table shows the Luxury Single Family Homes Sold over $1M represents 36% of the dollar volume in our market, and Land or Lots represents only 10% of the Volume and 37% of the total transactions sold YTD.
How Long Does it Take a Property to Sell?
Single Family Home " Average Price Per Sq. Ft.
Reminder about price per sq. ft. – 1) It is an interesting metric to compare “similar” homes, but it is impacted by the mix of what is sold. 2) The more transactions - the better the data. 3) A small home on a highly desirable piece of land will skew the numbers and show a very high price per sq. ft. not representative of the value compared with other homes on “less valuable land”.
2015 YTD - Category $ Volume of Properties Sold
% of TotalCount of # Properties
Sold% of Total
Total All Sales $62,819,861 152Condos & Townhomes $14,986,161 24% 53 35%Single Family Homes $36,897,000 59% 43 28%Mt. Crested Butte $15,708,500 25% 46 30%Mt. CB Single Family Homes $5,031,000 8% 7 5%Crested Butte Single Family Homes $10,762,000 17% 13 9%Skyland Single Family Homes $4,010,000 6% 3 2%CB South Single Family Homes $3,571,500 6% 8 5%Almont $2,335,000 4% 2 1%Land/Lots $10,936,700 17% 56 37%SF Homes Sold > $1M $22,322,000 36% 15 10%
DAYS ON MARKET
COMPARISON
SOLD PROPERTIES YTD AVERAGE
DAYS ON MARKET (DOM)
FOR SALE PROPERTIES
YTD AVERAGE DAYS ON
MARKET (DOM)YTD 2011 335 397YTD 2012 420 468YTD 2013 292 470YTD 2014 330 504YTD 2015 313 415
Condo/Townhome" Average Price Per Sq. Ft.
Sales Volume numbers represent all Single Family Homes, Condos, Townhomes and Land sales in the North End of the Gunnison Valley, including Almont, CB South, Rural Crested Butte, Crested Butte, Mt. Crested Butte and Rural Mt. Crested Butte as shown in the Gunnison Country Association of Realtors MLS. Information contained herein deemed reliable, but not guaranteed.
CHRIS KOPF PREVIEWS® PROPERTY SPECIALIST COLDWELL BANKER BIGHORN REALTY cell: 970.209.5405 [email protected] www.chriskopf.com
CRESTED BUTTE REAL ESTATE MARKET REPORT 2015 YEAR TO DATE – THROUGH JUNE
PREPARED BY CHRIS KOPF Trends show Prices for Single Family Homes and
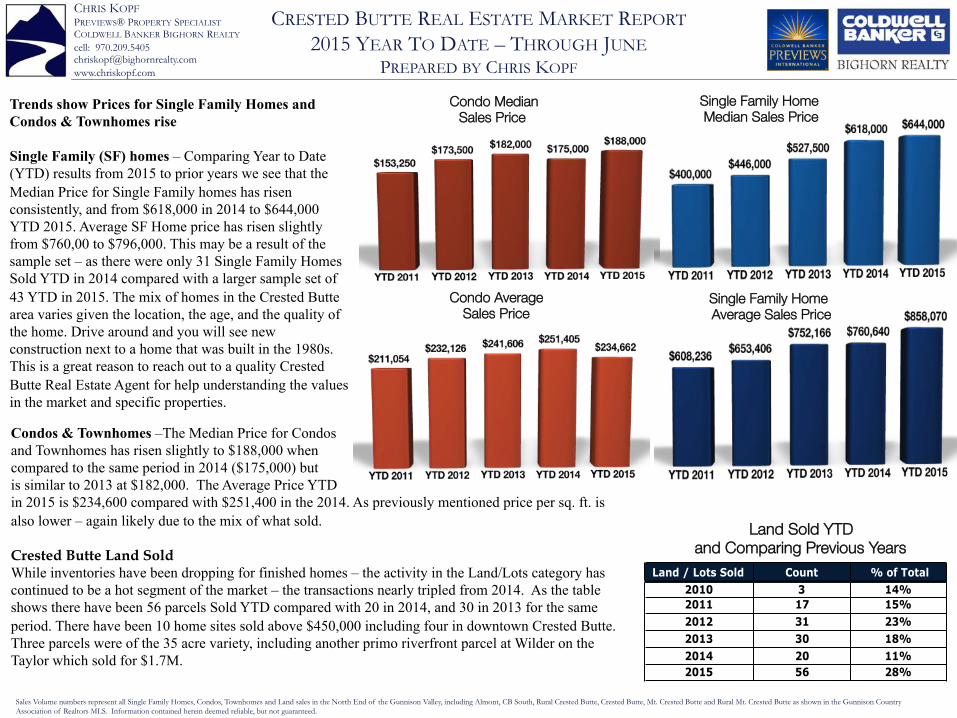
Condos & Townhomes rise Single Family (SF) homes – Comparing Year to Date (YTD) results from 2015 to prior years we see that the Median Price for Single Family homes has risen consistently, and from $618,000 in 2014 to $644,000 YTD 2015. Average SF Home price has risen slightly from $760,00 to $796,000. This may be a result of the sample set – as there were only 31 Single Family Homes Sold YTD in 2014 compared with a larger sample set of 43 YTD in 2015. The mix of homes in the Crested Butte area varies given the location, the age, and the quality of the home. Drive around and you will see new construction next to a home that was built in the 1980s. This is a great reason to reach out to a quality Crested Butte Real Estate Agent for help understanding the values in the market and specific properties.
Condos & Townhomes –The Median Price for Condos and Townhomes has risen slightly to $188,000 when compared to the same period in 2014 ($175,000) but is similar to 2013 at $182,000. The Average Price YTD in 2015 is $234,600 compared with $251,400 in the 2014. As previously mentioned price per sq. ft. is also lower – again likely due to the mix of what sold. Crested Butte Land Sold While inventories have been dropping for finished homes – the activity in the Land/Lots category has continued to be a hot segment of the market – the transactions nearly tripled from 2014. As the table shows there have been 56 parcels Sold YTD compared with 20 in 2014, and 30 in 2013 for the same period. There have been 10 home sites sold above $450,000 including four in downtown Crested Butte. Three parcels were of the 35 acre variety, including another primo riverfront parcel at Wilder on the Taylor which sold for $1.7M.
Condo Median Sales Price
Single Family Home" Median Sales Price
Condo Average Sales Price
Single Family Home" Average Sales Price
Land Sold YTD "and Comparing Previous Years
Land / Lots Sold Count % of Total2010 3 14%2011 17 15%2012 31 23%2013 30 18%2014 20 11%2015 56 28%
Sales Volume numbers represent all Single Family Homes, Condos, Townhomes and Land sales in the North End of the Gunnison Valley, including Almont, CB South, Rural Crested Butte, Crested Butte, Mt. Crested Butte and Rural Mt. Crested Butte as shown in the Gunnison Country Association of Realtors MLS. Information contained herein deemed reliable, but not guaranteed.
CHRIS KOPF PREVIEWS® PROPERTY SPECIALIST COLDWELL BANKER BIGHORN REALTY cell: 970.209.5405 [email protected] www.chriskopf.com
CRESTED BUTTE REAL ESTATE MARKET REPORT 2015 YEAR TO DATE – THROUGH JUNE
PREPARED BY CHRIS KOPF
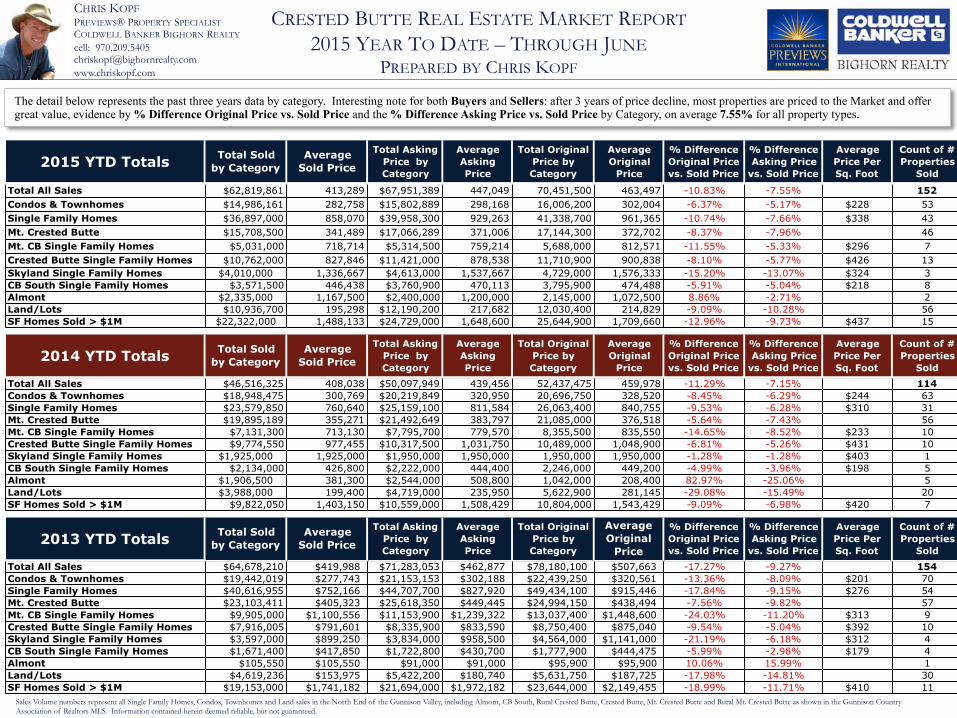
The detail below represents the past three years data by category. Interesting note for both Buyers and Sellers: after 3 years of price decline, most properties are priced to the Market and offer great value, evidence by % Difference Original Price vs. Sold Price and the % Difference Asking Price vs. Sold Price by Category, on average 7.55% for all property types.
2015 YTD Totals Total Sold by Category
Average Sold Price
Total Asking Price by Category
Average Asking Price
Total Original Price by Category
Average Original
Price
% Difference Original Price vs. Sold Price
% Difference Asking Price
vs. Sold Price
Average Price Per Sq. Foot
Count of # Properties
Sold
Total All Sales $62,819,861 413,289 $67,951,389 447,049 70,451,500 463,497 -10.83% -7.55% 152Condos & Townhomes $14,986,161 282,758 $15,802,889 298,168 16,006,200 302,004 -6.37% -5.17% $228 53Single Family Homes $36,897,000 858,070 $39,958,300 929,263 41,338,700 961,365 -10.74% -7.66% $338 43Mt. Crested Butte $15,708,500 341,489 $17,066,289 371,006 17,144,300 372,702 -8.37% -7.96% 46Mt. CB Single Family Homes $5,031,000 718,714 $5,314,500 759,214 5,688,000 812,571 -11.55% -5.33% $296 7Crested Butte Single Family Homes $10,762,000 827,846 $11,421,000 878,538 11,710,900 900,838 -8.10% -5.77% $426 13Skyland Single Family Homes $4,010,000 1,336,667 $4,613,000 1,537,667 4,729,000 1,576,333 -15.20% -13.07% $324 3CB South Single Family Homes $3,571,500 446,438 $3,760,900 470,113 3,795,900 474,488 -5.91% -5.04% $218 8Almont $2,335,000 1,167,500 $2,400,000 1,200,000 2,145,000 1,072,500 8.86% -2.71% 2Land/Lots $10,936,700 195,298 $12,190,200 217,682 12,030,400 214,829 -9.09% -10.28% 56SF Homes Sold > $1M $22,322,000 1,488,133 $24,729,000 1,648,600 25,644,900 1,709,660 -12.96% -9.73% $437 15
2014 YTD Totals Total Sold by Category
Average Sold Price
Total Asking Price by Category
Average Asking Price
Total Original Price by Category
Average Original
Price
% Difference Original Price vs. Sold Price
% Difference Asking Price
vs. Sold Price
Average Price Per Sq. Foot
Count of # Properties
SoldTotal All Sales $46,516,325 408,038 $50,097,949 439,456 52,437,475 459,978 -11.29% -7.15% 114Condos & Townhomes $18,948,475 300,769 $20,219,849 320,950 20,696,750 328,520 -8.45% -6.29% $244 63Single Family Homes $23,579,850 760,640 $25,159,100 811,584 26,063,400 840,755 -9.53% -6.28% $310 31Mt. Crested Butte $19,895,189 355,271 $21,492,649 383,797 21,085,000 376,518 -5.64% -7.43% 56Mt. CB Single Family Homes $7,131,300 713,130 $7,795,700 779,570 8,355,500 835,550 -14.65% -8.52% $233 10Crested Butte Single Family Homes $9,774,550 977,455 $10,317,500 1,031,750 10,489,000 1,048,900 -6.81% -5.26% $431 10Skyland Single Family Homes $1,925,000 1,925,000 $1,950,000 1,950,000 1,950,000 1,950,000 -1.28% -1.28% $403 1CB South Single Family Homes $2,134,000 426,800 $2,222,000 444,400 2,246,000 449,200 -4.99% -3.96% $198 5Almont $1,906,500 381,300 $2,544,000 508,800 1,042,000 208,400 82.97% -25.06% 5Land/Lots $3,988,000 199,400 $4,719,000 235,950 5,622,900 281,145 -29.08% -15.49% 20SF Homes Sold > $1M $9,822,050 1,403,150 $10,559,000 1,508,429 10,804,000 1,543,429 -9.09% -6.98% $420 7
2013 YTD Totals Total Sold by Category
Average Sold Price
Total Asking Price by Category
Average Asking Price
Total Original Price by Category
Average Original
Price
% Difference Original Price vs. Sold Price
% Difference Asking Price
vs. Sold Price
Average Price Per Sq. Foot
Count of # Properties
SoldTotal All Sales $64,678,210 $419,988 $71,283,053 $462,877 $78,180,100 $507,663 -17.27% -9.27% 154Condos & Townhomes $19,442,019 $277,743 $21,153,153 $302,188 $22,439,250 $320,561 -13.36% -8.09% $201 70Single Family Homes $40,616,955 $752,166 $44,707,700 $827,920 $49,434,100 $915,446 -17.84% -9.15% $276 54Mt. Crested Butte $23,103,411 $405,323 $25,618,350 $449,445 $24,994,150 $438,494 -7.56% -9.82% 57Mt. CB Single Family Homes $9,905,000 $1,100,556 $11,153,900 $1,239,322 $13,037,400 $1,448,600 -24.03% -11.20% $313 9Crested Butte Single Family Homes $7,916,005 $791,601 $8,335,900 $833,590 $8,750,400 $875,040 -9.54% -5.04% $392 10Skyland Single Family Homes $3,597,000 $899,250 $3,834,000 $958,500 $4,564,000 $1,141,000 -21.19% -6.18% $312 4CB South Single Family Homes $1,671,400 $417,850 $1,722,800 $430,700 $1,777,900 $444,475 -5.99% -2.98% $179 4Almont $105,550 $105,550 $91,000 $91,000 $95,900 $95,900 10.06% 15.99% 1Land/Lots $4,619,236 $153,975 $5,422,200 $180,740 $5,631,750 $187,725 -17.98% -14.81% 30SF Homes Sold > $1M $19,153,000 $1,741,182 $21,694,000 $1,972,182 $23,644,000 $2,149,455 -18.99% -11.71% $410 11
Sales Volume numbers represent all Single Family Homes, Condos, Townhomes and Land sales in the North End of the Gunnison Valley, including Almont, CB South, Rural Crested Butte, Crested Butte, Mt. Crested Butte and Rural Mt. Crested Butte as shown in the Gunnison Country Association of Realtors MLS. Information contained herein deemed reliable, but not guaranteed.
CHRIS KOPF PREVIEWS® PROPERTY SPECIALIST COLDWELL BANKER BIGHORN REALTY cell: 970.209.5405 [email protected] www.chriskopf.com
CRESTED BUTTE REAL ESTATE MARKET REPORT 2015 YEAR TO DATE – THROUGH JUNE
PREPARED BY CHRIS KOPF
!
Crested Butte Summer – Crested Butte continues to break records in tourism in the Summer months. The calendar is packed with something for everyone – there are festivals, art walk evenings, non-profit gala events, great options in Music Festival performances, Cattleman’s Days Rodeo in Gunnison, fun Tour de Forks dinners supporting the Center for the Arts, free Alpenglow concerts on Mondays in town and Wednesdays up on the mountain, a full social and recreational schedule at the Club at Crested Butte to name a few. Combine this with one of the most awesome years of wildflowers everywhere you look or walk or bike and surrounded by beautiful mountain peaks, flowing streams and rivers, waterfalls, and pristine mountain lakes. The recreational opportunities and family adventures abound. What is missing? Crowds. Traffic jams. Smog. Noise. Glitz. Trappings. Crested Butte is a laid-back community with a health mix of permanent and second-home owners. We attract those who like the vibe and culture and unpretentiousness of Crested Butte. Unlike other mountain towns, there are great values available in the many real estate offerings. How can I help you? This Crested Butte Real Estate Market report and the level of detail is representative of what you can expect from me as your Real Estate Agent. If you are interested in finding out what your existing property is worth, or considering me to represent you as a Buyer, I would appreciate the opportunity to earn your business (or that of a friend you think I could help). To see featured properties or search the MLS – visit www.chriskopf.com. Contact me at: (970) 209-5405, or [email protected] Thanks,
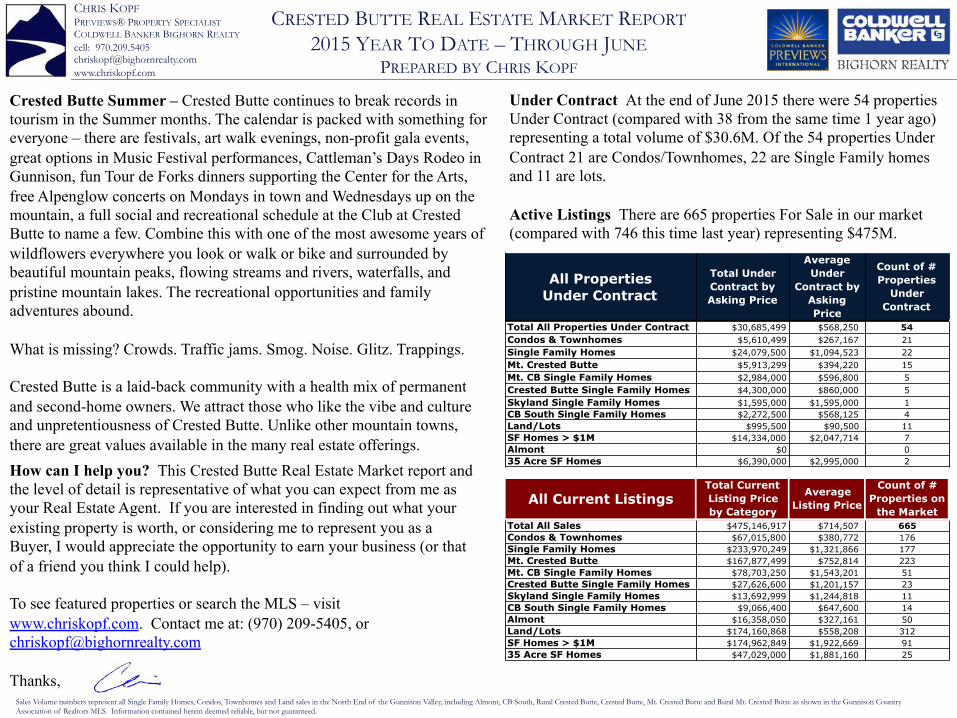
Under Contract At the end of June 2015 there were 54 properties Under Contract (compared with 38 from the same time 1 year ago) representing a total volume of $30.6M. Of the 54 properties Under Contract 21 are Condos/Townhomes, 22 are Single Family homes and 11 are lots. Active Listings There are 665 properties For Sale in our market (compared with 746 this time last year) representing $475M.
All Properties Under Contract
Total Under Contract by Asking Price
Average Under
Contract by Asking Price
Count of # Properties
Under Contract
Total All Properties Under Contract $30,685,499 $568,250 54Condos & Townhomes $5,610,499 $267,167 21Single Family Homes $24,079,500 $1,094,523 22Mt. Crested Butte $5,913,299 $394,220 15Mt. CB Single Family Homes $2,984,000 $596,800 5Crested Butte Single Family Homes $4,300,000 $860,000 5Skyland Single Family Homes $1,595,000 $1,595,000 1CB South Single Family Homes $2,272,500 $568,125 4Land/Lots $995,500 $90,500 11SF Homes > $1M $14,334,000 $2,047,714 7Almont $0 035 Acre SF Homes $6,390,000 $2,995,000 2
All Current ListingsTotal Current Listing Price by Category
Average Listing Price
Count of # Properties on
the MarketTotal All Sales $475,146,917 $714,507 665Condos & Townhomes $67,015,800 $380,772 176Single Family Homes $233,970,249 $1,321,866 177Mt. Crested Butte $167,877,499 $752,814 223Mt. CB Single Family Homes $78,703,250 $1,543,201 51Crested Butte Single Family Homes $27,626,600 $1,201,157 23Skyland Single Family Homes $13,692,999 $1,244,818 11CB South Single Family Homes $9,066,400 $647,600 14Almont $16,358,050 $327,161 50Land/Lots $174,160,868 $558,208 312SF Homes > $1M $174,962,849 $1,922,669 9135 Acre SF Homes $47,029,000 $1,881,160 25