Credit Valley Conservation - cvc.ca · common method of financing in Ontario. ... Funding the...
76
Credit Valley Conservation 2010
Transcript of Credit Valley Conservation - cvc.ca · common method of financing in Ontario. ... Funding the...

Credit Valley Conservation
2010
10527
Typewritten Text
Survey of Municipal Policies and Administrative Approaches for Overcoming Institutional Barriers to Low Impact Development
10527
Typewritten Text
10527
Typewritten Text
10527
Typewritten Text
10527
Typewritten Text
10527
Typewritten Text
10527
Typewritten Text
10527
Typewritten Text
10527
Typewritten Text
10527
Typewritten Text
10527
Typewritten Text
10527
Typewritten Text
10527
Typewritten Text

Credit River
Water Management Strategy Update –
Municipal Stormwater Financing Study
Internal Working Document
FINAL
May 2008

Credit River Water Management Strategy Update –
Municipal Stormwater Financing Study
TABLE OF CONTENTS
EXECUTIVE SUMMARY............................................................................................................................
1.0 PROJECT OVERVIEW .................................................................................................................... 1
1.1 BACKGROUND ...............................................................................................................................1 1.2 STUDY TASKS ...............................................................................................................................1 1.3 PROJECT ORGANIZATION AND HIGHLIGHTS ..................................................................................2
2.0 STORMWATER FUNDING MECHANISMS................................................................................. 4
2.1 MUNICIPAL STORMWATER MANAGEMENT PROGRAMS .................................................................4 2.2 OVERVIEW OF FUNDING MECHANISMS .........................................................................................7 2.3 PROPERTY TAX ...........................................................................................................................10 2.3.1 General Tax Fund..................................................................................................................10 2.3.2 Dedicated Tax Levy ...............................................................................................................11 2.3.3 Advantages and Disadvantages .............................................................................................11
2.4 DEVELOPMENT RELATED CHARGES AND FEES............................................................................11 2.4.1 Development Charges............................................................................................................11 2.4.2 Cash-in-lieu Charges.............................................................................................................12 2.4.3 Subdivision Agreements.........................................................................................................12 2.4.4 Advantages and Disadvantages .............................................................................................12
2.5 IMPERVIOUS AREA BASED CHARGES ..........................................................................................12 2.5.1 Stormwater Rate ....................................................................................................................12 2.5.2 Advantages and Disadvantages .............................................................................................14
2.6 COMPARISON OF FUNDING OPTIONS ...........................................................................................14
3.0 REPRESENTATIVE CASE STUDIES .......................................................................................... 17
3.1 PITTSBURG, KANSAS ...................................................................................................................17 3.2 MIDDLETOWN, OHIO ...................................................................................................................19 3.3 MEMPHIS, TENNESSEE.................................................................................................................21 3.4 KITCHENER AND WATERLOO, ONTARIO......................................................................................23 3.5 STRATFORD, ONTARIO ................................................................................................................26 3.6 OTHER CANADIAN MUNICIPALITIES............................................................................................28 3.6.1 Town of Aurora, Ontario .......................................................................................................28 3.6.2 City of London, Ontario.........................................................................................................30 3.6.3 City of St. Thomas, Ontario ...................................................................................................30 3.6.4 City of Regina, Saskatchewan................................................................................................30 3.6.5 City of Saskatoon, Saskatchewan...........................................................................................30 3.6.6 City of Calgary, Alberta ........................................................................................................31 3.6.7 City of Edmonton, Alberta .....................................................................................................31 3.6.8 City of St. Albert, Alberta ......................................................................................................31 3.6.9 Strathcona County, Alberta ...................................................................................................31 3.6.10 City of Richmond, British Columbia .................................................................................32
3.7 CASE STUDY LESSONS ................................................................................................................32 3.7.1 Stormwater Funding Lessons Learned ..................................................................................32 3.7.2 Stormwater Rate Implementation Success Factors................................................................34 3.7.2.1 Public Consultation Program ...........................................................................................34 3.7.2.2 Rate Implementation Costs ...............................................................................................35 3.7.2.3 Jurisdictional Boundaries .................................................................................................35 3.7.2.4 Level of Service Flexibility................................................................................................36 3.7.2.5 Property Owner Incentives ...............................................................................................37
4.0 INITIAL PROGRAM DEFINITION.............................................................................................. 39
4.1 STORMWATER MANAGEMENT PROGRAMS IN CVC MUNICIPALITIES ..........................................39 4.1.1 Town of Orangeville ..............................................................................................................40 4.1.2 City of Mississauga................................................................................................................42
4.2 LAND USE ANALYSIS ..................................................................................................................44 4.2.1 Basis for Rate Policy .............................................................................................................44 4.2.2 Parcel Characteristics ...........................................................................................................45
Credit River Water Management Strategy Update – Municipal Stormwater Financing Study ii
4.2.3 Impervious Area Characteristics ...........................................................................................45 4.2.3.1 Town of Orangeville .........................................................................................................45 4.2.3.2 City of Mississauga ...........................................................................................................47
4.3 CONCEPTUAL STORMWATER RATE ANALYSIS ............................................................................48 4.3.1 Stormwater Billing Units .......................................................................................................49 4.3.1.1 Town of Orangeville .........................................................................................................50 4.3.1.2 City of Mississauga ...........................................................................................................50 4.3.2 Revenue Potential ..................................................................................................................50 4.3.2.1 Town of Orangeville .........................................................................................................50 4.3.2.2 City of Mississauga ...........................................................................................................53
4.4 COMPARISON TO OTHER MUNICIPALITIES...................................................................................53 4.5 BASIS FOR CREDIT POLICY ..........................................................................................................55
5.0 CONCLUSIONS AND RECOMMENDATIONS .......................................................................... 57
5.1 FUNDING OPTION OVERVIEW......................................................................................................57 5.2 CONCLUSIONS .............................................................................................................................58 5.3 CONSIDERATIONS FOR A STORMWATER RATE IMPLEMENTATION STRATEGY .............................59
LIST OF TABLES Table ES-1: Average Annual SWM Program Expenditures (2009-2017)..................................................... vi Table ES-2: Land Use and Impervious Area Characteristics ....................................................................... vii Table 1-1: Characteristics of CVC Member Municipalities ............................................................................3 Table 2-1: General Stormwater Program Funding Options .............................................................................8 Table 2-2: 2007 Property Tax Rates ..............................................................................................................10 Table 2-3: Comparison of Stormwater Funding Options ..............................................................................15 Table 3-1: Parcel Analysis for Pittsburg, Kansas ..........................................................................................18 Table 3-2: Projected Revenue for Pittsburg, Kansas .....................................................................................18 Table 3-3: Parcel Analysis for Middletown, Ohio.........................................................................................20 Table 3-4: Parcel Analysis for Memphis, Tennessee.....................................................................................22 Table 3-5: Parcel Analysis and Stormwater Billing Units for Kitchener, Ontario ........................................24 Table 3-6: Parcel Analysis and Stormwater Billing Units for Waterloo, Ontario .........................................25 Table 3-7: Parcel Analysis and Stormwater Billing Units for Stratford, Ontario ..........................................27 Table 3-8: Summary of Stormwater Rates in Canada ...................................................................................29 Table 4-1: Population, Dwelling and Density Statistics for Selected CVC Municipalities ...........................39 Table 4-2: Town of Orangeville Stormwater Management Program Expenditures ......................................41 Table 4-3: Adoption Rate Targets of CRWMSU Implementation Measures ................................................42 Table 4-4: City of Mississauga Stormwater Management Program Expenditures ........................................43 Table 4-5: Parcel Characteristics and Residential Dwelling Unit Distributions ............................................46 Table 4-6: Summary of Impervious Areas in the Town of Orangeville ........................................................46 Table 4-7: Summary of Impervious Areas in the City of Mississauga ..........................................................48 Table 4-8: Summary of Stormwater Billing Units in the Town of Orangeville ............................................50 Table 4-9: Summary of Stormwater Billing Units in the City of Mississauga ..............................................51 Table 4-10: Potential Rate Revenue in the Town of Orangeville ..................................................................52 Table 4-11: Potential Rate Revenue in the City of Mississauga....................................................................52 Table 4-12: Comparison of Operations and Maintenance Expenditures in Ontario ......................................53
LIST OF FIGURES Figure 2-1: Components of a Stormwater Management System .....................................................................5 Figure 2-2: Example of Impervious Areas of a Single Family Residential Home ........................................13 Figure 4-1: Comparison of Monthly Rate Charge and Base Area Size .........................................................54 LIST OF APPENDICES APPENDIX A Literature Review APPENDIX B Credit Policy Examples CVC_StormwaterFunding_FinalReport.doc
Credit River Water Management Strategy Update – Municipal Stormwater Financing Study iii
EXECUTIVE SUMMARY
ES.1 Background
CVC staff and member municipalities have identified program funding as a barrier to the implementation of recommended improvement projects and was included as a key recommendation in the Credit River Water Management Strategy Update (CRWMSU) final report (CVC, April 2007). The report further acknowledged that funds are not presently allocated by the municipalities for many of the recommended programs and improvement projects and as a result, alternative sources of funding would need to be considered. In June 2007, CVC contracted with Totten Sims Hubicki Associates (TSH) to provide an overview of various funding mechanisms employed in North America to support stormwater management (SWM) programs and conduct two conceptual financial analyses within the Credit River watershed. The objectives of the CRWMSU Municipal Stormwater Financing Study included:
• Review and evaluate stormwater funding options that have been used as successful financial models for SWM programs throughout North America, including representative case studies from communities that best reflect the needs and issues of CVC member municipalities;
• Hold a working session with the CRWMSU Management Steering Group to confirm goals and objectives for the financial analysis and explore related issues generated by the participants;
• Conduct a conceptual stormwater rate analysis for selected CVC member municipalities to explore rate structure options and establish preliminary revenue expectations; and
• Document the results and findings in a report, with follow-up presentations to the CRWMSU Management Steering Group and CVC Board of Directors.
ES.2 Review of Funding Options
To support current and future SWM needs, the general mechanisms for funding the major components of a municipal SWM program include the following:
• Taxes, which are mandatory levies authorized by the legislature, collected by a public body, and not related to any specific benefit or government service (i.e., these are for general services to support the public good);
• Fees and special charges, which are payments made to offset the cost of a specific service and payable by those people who benefit from the service;
• Special levies that have specific designations and limitations for usage;
• Other means besides taxes, fees, and special levies; and
• A combination of the above. Property taxes are the primary source of funding for SWM programs in Ontario. At least three municipalities in Ontario (i.e., London, St. Thomas, and Aurora) have implemented a special stormwater user fee that charges a flat rate to residential properties and an area-based charge to commercial/industrial properties. Other municipalities in Ontario are known to be evaluating various stormwater funding options. There are approximately a dozen municipalities in western Canada that have either adopted a flat rate user free or have implemented a stormwater rate based on zoning and intensity of development. Over 600 stormwater rates have been implemented in communities throughout the U.S. The funding options that were investigated as part of this study included:

Credit River Water Management Strategy Update – Municipal Stormwater Financing Study iv
• Property Tax which allocates charges to property owners based on assessed value. Funding a municipal SWM program with revenue from property taxes is the most common method of financing in Ontario. As an alternative, a dedicated levy could be administered specifically for SWM. The primary advantages of using property taxes to support the municipal SWM program, either through a general tax fund or dedicated levy, is that this method is already accepted as the primary existing source of revenue for municipalities and the billing system is already established. The primary disadvantages are that the fairness and equity in allocating charges is low, it is not a sustainable revenue stream, there are no incentive opportunities to reduce stormwater runoff and pollutant discharge, and many large properties do not contribute to the funding (i.e., tax-exempt).
• Development Related Charges and Fees which allocates charges to developers to fund eligible growth-related costs. Development charges (DC) are used to pay for capital costs of SWM facilities in specific areas. Cash-in-Lieu charges can be applied to both capital and operations/maintenance costs of SWM facilities in redevelopment/infill situations, and not necessarily in the location where the development is occurring. Subdivision agreements can also be used to pay for area-specific capital works and anticipated future operations/maintenance. The primary advantage is that these methods are currently accepted by the development community. The primary disadvantages are that these methods are limited by the amount of developable land within municipality and are directly dependent on growth and economic conditions.
• Stormwater Rate which allocates charges to property owners based on the measured area of impervious ground cover (e.g., rooftops, driveways, and parking lots), which is a common indicator of the relative contribution of stormwater runoff and pollutant loading to the municipal SWM system. Funding through a stormwater rate has the primary advantages of a fair and equitable allocation of charges to property owners, it is a sustainable and dedicated funding source, provides incentive opportunities to reduce stormwater runoff and pollutant discharge, and it provides a mechanism to charge tax-exempt properties for municipal SWM services. The primary disadvantages include additional costs for rate implementation and the possibility that a new fee may not be well received by the public. A new fee structure might also be reluctantly received by municipal staff if it does not fit well within the current financial and policy framework dominated by property tax revenues.
ES.3 Case Studies and Lessons Learned
To provide an example of the application of a stormwater rate in communities with characteristics similar to CVC member municipalities, representative case studies of stormwater rate implementations were presented for the following communities:
• Pittsburg, Kansas which represents a largely rural community located in the headwaters
• Middletown, Ohio, an urbanizing community in the middle of a watershed
• Memphis, Tennessee, a large urban community at the downstream end of a watershed To add a Canadian perspective, recent stormwater rate studies in Ontario (i.e., Kitchener, Waterloo, and Stratford) were summarized along with details of stormwater financing programs from other municipalities across Canada. Based on the consultant’s experience in municipal SWM financing throughout North America, a common set of lessons learned was derived, and includes the following:
1. Recognize that one size does not fit all. Each community’s SWM program has unique needs, preferred solutions, organizational structures, staff experience and knowledge, equipment and resources.

Credit River Water Management Strategy Update – Municipal Stormwater Financing Study v
2. Collaborate with stakeholders and promote communication. Stakeholders need to be chosen carefully and representative of all the citizens and property owners who will be paying for the SWM program. Further, the facilitator at stakeholder meetings needs to ensure the facts have been presented and understood, inspire collaborative dialog, and be impartial in the decision making process yet skilled at marshalling divergent opinions toward group consensus.
3. Define the champion and home of the program. The champion or champions of the funding program can either be a respected community leader, activist, councilor or staff person. The home of the program can refer to the local government (i.e., regional or municipal level) and the department in which the program resides (e.g., Engineering, Finance, or Public Works).
4. Clearly define the health, safety and welfare benefits. The guiding principles behind the municipal SWM program should be, first and foremost, the health, safety, and welfare of its residents and business owners. Clearly documenting and defining a municipality’s SWM issues, problems and needs along with the corresponding solutions, services, and expenditures is a necessary step in identifying the optimal funding mechanism.
5. Clearly define the cost of each program element. The level of service provided by the municipality’s SWM system directly affects the overall program cost. Public trust and confidence can only be gained through a clear and transparent accounting of program costs.
6. Allocate level of service by geography. There are clear differences between SWM facilities and services in an urban versus a rural setting (e.g., curb/gutter with storm sewers versus roadside ditching). Even within a rural setting for example, there can be different service costs for operations and maintenance activities and capital projects, depending on topography and vegetation cover.
7. Pragmatically address inter-jurisdictional issues within watersheds. Political boundaries often present roadblocks to SWM. Joint initiatives can realize great cost efficiencies in SWM services and capital projects.
8. Keep abreast of new legislation and initiatives. It is also important for municipal staff to keep on top of upcoming SWM regulations, funding opportunities, and new technologies to bolster long-term program planning and identify future cost efficiencies in service delivery.
9. Provide clear documentation for customer fees. Regardless of the funding mechanism that is ultimately selected for the municipality, customer relations will be improved when an effort is made to clearly explain any new charges.
10. Establish policies to address private property issues. With an increasing focus on source or lot-level controls for SWM, it is becoming increasingly important to establish municipal policies to assist in dealing with private property issues.
ES.4 Conceptual Rate Analysis
To explore rate structure options and establish preliminary revenue expectations, a conceptual stormwater rate analysis was conducted for two CVC member municipalities. The development of a stormwater rate structure required an estimate of the annual SWM program expenditures and the impervious area characteristics of each municipality, which were selected in order to represent a cross-section of CVC communities that vary by geography, governance, population, and land use characteristics:
• Orangeville, a town located in the headwaters of the Credit Valley watershed; and
• Mississauga, a large city located at the downstream end of the Credit Valley watershed.

Credit River Water Management Strategy Update – Municipal Stormwater Financing Study vi
Stormwater Management Program Expenditures Table ES-1 summarizes the projected SWM program costs for Orangeville and Mississauga, which represent non-growth related expenditures (i.e., activities funded through their respective DC programs have not been included) that are needed to achieve desired level of service goals and meet regulatory compliance targets. These costs have been estimated and are for illustrative purposes in order to satisfy the objectives of this study. Further cost details would need to be investigated should the financial analysis be extended beyond the scope of this study.
Table ES-1: Average Annual SWM Program Expenditures (2009-2017) Activity Orangeville Mississauga
Operation and Maintenance $363,500 $4,776,300
Capital Improvement Projects $661,900 $3,585,900
Other Municipal SWM Program Activities $483,600 $153,700
CRWMSU Implementation $106,100 $1,065,800
Total $1,615,100 $9,581,700
Notes:
1. Costs have been estimated for illustrative purposes and are for
discussion only. In addition to the expenditure items estimated by staff in the respective municipalities, CRWMSU implementation costs from the April 2007 final report have been incorporated into the average annual expenditures. These costs are shown in the bottom row of Table ES-1 and include the following items:
• Source control measures, which are designed to reduce runoff, improve water quality and control flows that affect flooding and erosion within urban areas and are generally applied to individual lots (e.g., roof downspout disconnection, porous pavement; soak away pits, parking lots equipped with biofilters and rooftop storage);
• Conveyance control measures, which are designed to reduce runoff by encouraging higher levels of infiltration into the ground and are generally applied within the existing collection system (e.g., porous stormwater pipes, grassed swales, and dual-pipe systems where one pipe infiltrates water into the ground through a gravel filter); and
• Additional public education activities to plan, promote and implement private property source controls, stewardship practices, including landowner and community outreach to build general awareness of environmental issues within the Credit Watershed and inform citizens and business owners on best management practices (BMPs), spill prevention, and new development standards, etc.
Land Use Analysis A parcel analysis identifies the characteristics of parcels in a municipality, which in turn determines the base charge for a stormwater rate. Every parcel of land in a municipality contributes runoff to the municipal drainage system and impacts water quality in proportion to the amount of impervious area located on their property. The impervious area of a parcel refers to surfaces covered with material that is highly resistant to the infiltration of water (e.g., building rooftops, paved areas, and compacted gravel). In a typical stormwater rate study, a statistical sampling process would be conducted to provide an accurate and defensible estimate for residential impervious area determinations. For the purposes of this study however, impervious area estimates were based on land use assumptions and other information provided by the municipalities.

Credit River Water Management Strategy Update – Municipal Stormwater Financing Study vii
A summary of land use characteristics and impervious area estimates for Orangeville and Mississauga are shown in Table ES-2. The number of residential dwelling units is shown along with the percentage of detached single-family houses. The estimated impervious areas are shown in the next four rows of Table ES-2. The public right-of-way (ROW) is not typically included in the stormwater rate calculation as it is considered part of the drainage collection system.
Table ES-2: Land Use and Impervious Area Characteristics
Orangeville Mississauga
Item Count Distribution Count Distribution
Residential Dwelling Units1 9,420 60% 223,720 42%
Estimated Impervious Area (m2)
Residential 2,486,680 44% 39,398,804 23%
Non-Residential 2,260,793 40% 81,099,097 46%
Right-of-Way 962,727 17% 54,093,492 31%
Total 5,710,200 100% 174,591,393 100%
Number of Equivalent Residential Billing Units (ERUs)
Residential 9,420 52% 223,720 33%
Non-Residential 8,564 48% 460,509 67%
Right-of-Way 0 0% 0 0%
Total 17,984 100% 684,229 100%
Average ERU Size (m2) 264.0 176.1
Notes:
1. Distribution shown is the proportion of detached single family homes. In an Equivalent Residential Unit (ERU) rate structure, each residential dwelling unit is assigned one stormwater billing unit. Non-residential ERUs are assigned based on the impervious area divided by the average ERU size, which is 264 m2 (2,841 ft2) and 176 m2 (1,896 ft2) respectively for Orangeville and Mississauga, as shown in the bottom row of Table ES-2. These values fit within the typical range of 115 communities in the state of Florida of between 150 and 320 m2 (1,600 to 3,400 ft2) and can also be compared to those determined in recent stormwater rate studies conducted by the consultant team in other southern Ontario municipalities, namely:
• Kitchener: 178 m2/ERU
• Stratford: 196 m2/ERU
• Waterloo: 167 m2/ERU
Potential Stormwater Rate Revenue By comparing the annual revenue needs with the estimated number of billing units in each community, a projection of the potential stormwater rate revenue was made. In Orangeville, every dollar per ERU per month would generate $209,350 of annual revenue and a stormwater rate charge between $7.50 and $8.00/ERU/month would support the Town’s average annual revenue requirement of $1,615,100. In Mississauga, every dollar per ERU per month would generate $7,955,400 of annual revenue and a stormwater rate charge between $1.00 and $1.50/ERU/month would support the City’s average annual revenue requirement of $9,581,700. These revenue forecasts assume an annual billing unit growth rate of 0.5 percent would be achieved and also that there would be a 5 percent reduction in rate revenue due to adjustments, credits, errors in billing, or delinquent accounts, which is typical in other jurisdictions throughout the U.S. It has been estimated that the average stormwater rate charge in the U.S. is $4 per billing unit per month, with an 80-percentile range of between $2 and $8 per month. Recent rate studies in Kitchener and Waterloo indicated base charges of $4.41 and $4.17/ERU/month, respectively.

Credit River Water Management Strategy Update – Municipal Stormwater Financing Study viii
Credit Policy Credits, if awarded, would reduce a property owner’s charge from the base stormwater rate if their on-site facilities have been property designed, constructed, and maintained to provide an appropriate level of control for flooding, erosion, and/or water quality treatment. Credits are typically awarded to any facilities that relieve the municipality of its fiscal SWM responsibilities or otherwise result in direct savings to the municipality’s SWM program. Typically, SWM facilities for urban development projects provide primarily localized benefits. For example, because stormwater detention basins for development projects control a relatively small percentage of the watershed, its benefits are typically limited to stream systems immediately downstream of the development site. Since it is unlikely that privately maintained SWM facilities significantly reduce the municipality’s system-wide costs, it is appropriate to express the benefits of these facilities in terms of potential reductions in the “local” SWM program costs. Therefore, the recommended approach to establishing a technical basis for the municipality’s credit policy is to base the “maximum total credit” (i.e., maximum stormwater rate reduction) on the total percentage of SWM program costs which provide “local” benefits. The credit factors require evaluation of the programmatic budgets for a reasonable period of time to reflect overall costs. Based on the consultant’s experience in similar jurisdictions, an initial set of credit values is suggested which add to a maximum of 50 percent credit. Upon the initial years of the stormwater rate it is advisable to further adjust such values to reflect the overall costs and benefits perceived by the municipality. ES.5 Conclusions and Recommendations
The cost of the municipal SWM programs within CVC’s jurisdiction will increase significantly in future years. Not only will costs increase due to the implementation of CRWMSU recommendations, but also as municipalities increase their stormwater level of service to address new water quality regulations, replace/rehabilitate aging infrastructure, and an increased maintenance burden as new development infrastructure is assumed. As a result, municipalities will need greater emphasis on sound asset management and financial planning, particularly a long-term outlook for municipalities with decreasing growth/development potential. A stormwater rate was chosen to be the focus of this study as it is the most fair, equitable and sustainable funding mechanism. A stormwater rate charges property owners based on their relative contribution of stormwater runoff volume and pollutant loading, whereas property tax funding is only based on assessed property value and DC is based on total number of dwelling units or land area. As a dedicated and sustainable source of funding, a stormwater rate provides more budgeting flexibility than property tax or growth-related funding. A stormwater rate also supports CRWMSU strategies by including incentives for private property source controls. Not only is there an inherent developer incentive for installing stormwater source controls (i.e., since they reduce land requirements for end-of-pipe facilities and therefore can reduce overall SWM construction costs), but property owners with source controls would be eligible for stormwater rate credits if these facilities are properly maintained. The biggest challenges for a stormwater rate are the costs associated with a rate implementation study and in achieving consensus among key stakeholders in an acceptable rate structure and credit policy details, particularly with tax-exempt property owners who would now be faced with a new charge, and commercial/industrial business owners, some of whom could be impacted greatly by redistributing the cost allocation from assessed value to an impervious area based

Credit River Water Management Strategy Update – Municipal Stormwater Financing Study ix
charge. These challenges have been overcome in past studies through stakeholder involvement and a properly implemented public consultation program. Further, since the stormwater rate represents a major departure from current municipal financing policies, it would require a broader public finance framework, as well as a strong political will among councilors and ratepayers in order to implement. This challenge is neither unusual nor insurmountable, as experience in other jurisdictions has shown. Although the details in this report are decidedly focused on stormwater rates, it is the individual
choice of each municipality whether to pursue the funding options presented in this report. Such implementation decisions may be a function of time. That is, as growth-related development opportunities become more limited and the DC revenue potential declines, a stormwater rate program may become more attractive. Further, as municipal accounting and fiscal management policies mature and evolve, such that revenue sources are more rigorously assigned to specific cost centers, a rate program may also become more attractive. For municipalities that may choose to consider investigating a stormwater rate as an alternative method of financing their SWM program, a series of implementation steps was suggested to help provide guidance for initial dialog among municipal staff. The recommended implementation strategy includes the following items:
1. Select a Stormwater Advisory Committee (SWAC) of key community stakeholders and ratepayer representatives. A series of monthly facilitated meetings should be planned and coordinated with the stormwater rate study to solicit feedback and dialog throughout the process.
2. Conduct a parcel analysis including impervious area measurements for a representative
statistical sampling of residential properties and all non-residential properties.
3. Conduct a financial review of SWM related expenditures to determine the annual funding requirements under two level of service (LOS) scenarios: current LOS based on recent fiscal year expenditures and budget forecasts, and a sustainable LOS representing staff’s assessment of future SWM program activities and expenditures required to provide a more proactive and preventative maintenance program, additional activities to meet provincial and federal water quality requirements, manage assets in a more sustainable manner, and to meet service expectations of the public. LOS scenarios should be expressed as an annual expense averaged over a suitable planning horizon (e.g., 5 years).
4. Develop an appropriate stormwater billing unit method and rate structure based on the
parcel and financial analyses described in the preceding items. This rate would apply to all property types, regardless of tax status.
5. Consider a phase-in period to ease the transition from the current property tax based
funding. For example, a stormwater rate program may be phased-in over a four-year period with the following revenue sources:
• Year 1: Combined revenue including 25% stormwater rate + 75% property tax
• Year 2: Combined revenue including 50% stormwater rate + 50% property tax
• Year 3: Combined revenue including 75% stormwater rate + 25% property tax
• Year 4: 100% stormwater rate revenue
6. Consider a policy to reduce the property tax levy by the corresponding stormwater rate revenue amount in each year of the recommended phase-in period in Item 5.

Credit River Water Management Strategy Update – Municipal Stormwater Financing Study x
7. Examine the adoption of a stormwater rate credit policy, based on the following details:
• Credit eligibility to be determined based on the SWM practices and facilities on site (i.e., source controls).
• All non-residential properties, regardless of tax status, and communal stormwater facilities that serve large residential subdivisions (e.g., >250 lots) would be eligible for credits.
• A maximum credit of no more than 50%.
• Property owners must apply for a credit on an annual basis and certify that all facilities have been constructed, operated, and maintained as designed.
8. Based on discussions with SWAC, consider adopting policies that would benefit tax-
exempt properties, including:
• A rebate policy for tax-exempt properties currently contributing Payment In-Lieu-Of Taxes (PILOT, e.g., post-secondary schools and hospitals), that would deduct the stormwater component of their PILOT charge from their stormwater bill, which will vary in proportion to the stormwater rate revenue during the phase-in period; and
• A tax subsidy for tax-exempt properties that do not currently contribute Payment In-Lieu-Of Taxes (e.g., elementary/secondary schools, churches, and charitable organizations that are defined as exempt from taxation under the Income Tax Act).
These tax subsidies and rebates would reduce the charge to tax-exempt properties. Although this consideration apparently goes against the benefit that a rate offers a mechanism to allocate charges to tax-exempt properties, it is a reality that will likely need to be addressed during the implementation phase. Feedback from recent discussions with SWAC members in the Kitchener, Waterloo and Stratford rate studies has indicated that stormwater rate charges essentially overlap the PILOT charge and would be double-counting. Similarly, church representatives have requested special recognition in-lieu-of the valuable social and community services they provide, which were downloaded on them by the municipality. The key ingredient is to engage and work with these tax-exempt groups to determine their specific needs and resolve to achieve a balance. Since schools, churches and other such institutions often have significant impervious areas, they represent important opportunities for incentive programs to reduce stormwater runoff and pollutant loading through source controls. Further, given the nature of these properties and the citizenry that they attract, there are many opportunities for educational programs that could be factored into a credit program, rather than resorting to subsidies or rebates.
9. Investigate efficiencies in coordinating SWM services that can be shared by neighboring
municipalities, CVC, TRCA, and the regional governments. Joint initiatives that can offer services on a multi-jurisdictional basis (e.g., operations and maintenance activities, capital projects, and administrative/management services) can help to reduce the overall SWM program costs in individual municipalities. Specific examples include sharing specialized equipment and/or trained personnel, and coordinating local and regional government programs such as integrating the municipality’s pond sediment removal activities with the region’s composting program.

Credit River Water Management Strategy Update – Municipal Stormwater Financing Study 1
1.0 PROJECT OVERVIEW
This section summarizes the background that led to the present study, outlines the study tasks, and highlights the project organization. 1.1 Background
The ultimate goal of the Credit River Water Management Strategy Update (CRWMSU) was to develop a watershed management strategy that could be used to ensure safe, abundant, clean water for environmentally, socially, economically healthy communities within the Credit River watershed. To achieve this goal, findings from previous Credit Valley Conservation (CVC) initiatives were integrated with the original Credit River Water Management Strategy to refine and adjust the long-term plan for managing the water and environmental resources within the watershed. A major part of this plan was the development of municipal stormwater management (SWM) program enhancements and capital improvement projects that were recommended throughout the watershed. CVC staff and member municipalities have identified program funding as a barrier to the implementation of recommended improvement projects. Among the key recommendations in the CRWMSU final report was the following item (CVC, April 2007, page 250):
“Funding: Initiate the necessary programs/policies to staff and finance a range of new
development, retrofit and restorative measures as recommended in the Strategy and
further determine appropriate program and funding requirements through the
implementation process.”
The report further acknowledged that funds are not presently allocated by the municipalities for many of the recommended programs and improvement projects and as a result, alternative sources of funding would need to be considered. In June 2007, CVC contracted with Totten Sims Hubicki Associates (TSH) to provide an overview of various funding mechanisms employed in North America to support SWM programs and conduct two conceptual financial analyses within the Credit River watershed. 1.2 Study Tasks
In order to achieve the objectives of the CRWMSU Municipal Stormwater Financing Study, a project work plan was developed featuring the following tasks:
• Task I – Stormwater Funding Options: Stormwater funding options that have been used as successful financial models for SWM programs throughout North America were reviewed and evaluated for applicability to CVC member municipalities. The findings of this evaluation are presented in Section 2 of this report.
• Task II – Stormwater Rate Framework: To help set the framework for stormwater rates in the CVC municipalities, a working session with the CRWMSU Management Steering Group was held to confirm goals and objectives for the conceptual stormwater rate analysis and explore related issues generated by the participants. Section 1.3 describes this workshop.
• Task III – Case Studies: Representative case studies of stormwater rate implementations in communities that best reflect the needs and issues of CVC member municipalities were illustrated. Case studies from recent stormwater rate studies in Ontario are included along with a description of the overall lessons learned in Section 3 of this report.

Credit River Water Management Strategy Update – Municipal Stormwater Financing Study 2
• Task IV – Initial Program Definition: A conceptual stormwater rate analysis was conducted for two selected CVC member municipalities to explore rate structure options and establish preliminary revenue expectations. The results of this analysis are presented in Section 4 of this report.
• Task V – Reporting: This report documents the results and findings of Tasks I-IV described above. The overall conclusions and recommendations for this study are described in Section 5. In addition to the report, follow-up presentations to the CRWMSU Management Steering Group and CVC Board of Directors are planned.
1.3 Project Organization and Highlights
The project team comprised members of the consultant team and CVC staff, who met regularly to consider results of the rate study analysis as well as feedback from meetings with staff at CVC member municipalities. The consulting team acted under the direction of CVC project team staff which included:
• Christine Zimmer, Senior Water Resources Engineer
• John Kinkead, Director, Water Resources (Team 2) The project Advisory Committee was composed of the following individuals:
• Wendy Alexander, Director of Transportation and Infrastructure Planning, City of Mississauga
• Lincoln Kan, Manager of Environmental Services, City of Mississauga
• Jack Tupling, Public Works Director, Town of Orangeville
• Doug Jones, Director of Environmental and Development Services, Town of Orangeville
• Chris Mills, Manager of Engineering Design and Development, Town of Halton Hills
• Andrew Pearce, Manager of Engineering and Construction, Town of Caledon
• Rick Bino, Director of Engineering and Development Services, City of Brampton The consultant team included the following firms:
• Totten Sims Hubicki Associates Ltd. (TSH). TSH was the lead firm, responsible for the overall project management, data collection and management, and technical analyses performed by the consultant team. TSH has completed numerous projects and studies throughout Ontario including SWM policy development, stormwater inventory and drainage assessments, rate studies, and creek and pond rehabilitation projects.
• Camp Dresser & McKee, Inc. (CDM). CDM provided technical oversight for the stormwater financing and implementation plan. CDM has established itself as a leader in the development and implementation of stormwater rates, having conducted stormwater financing studies for over 140 communities in the U.S.
Among the project highlights were a number of meetings held with project team staff and representatives of CVC member municipalities. The purpose of the meetings was to discuss their unique SWM needs and issues, stormwater funding options that would be most appropriate for the individual communities, and related topics. The key meetings included:
• A kickoff workshop was held June 11, 2007 at the CVC office, attended by the project team and representatives of the Town of Orangeville, City of Brampton, Town of Halton Hills, and City of Mississauga.
• A working session was held July 4, 2007 at the Town of Orangeville.
• An information session was held July 9, 2007 at the Town of Caledon.
• A working session was held July 26, 2007 at the City of Mississauga.

Credit River Water Management Strategy Update – Municipal Stormwater Financing Study 3
• Follow-up meetings and phone discussions with Orangeville and Mississauga staff from October through December, 2007.
• An interim report review meeting was held January 16, 2008 at the City of Mississauga.
• An interim report review meeting was held January 24, 2008 at CVC with the Town of Orangeville.
• A draft report review meeting was held April 18, 2008 at CVC with the Town of Orangeville and the City of Mississauga.
Table 1-1 summarizes basic demographic and land area information for the various CVC member municipalities. For each municipality, the upper tier municipality is given along with the latest census population from 2006, the growth rate (i.e., change in population from the last census in 2001), the population density in people per square kilometre, total land area and the percentage of land area within the CVC watershed. As described in Section 4, Orangeville and Mississauga were selected for a financial analysis of their respective SWM programs and these communities are highlighted in Table 1-1.
Table 1-1: Characteristics of CVC Member Municipalities
Municipality
Upper Tier
Municipality
Population
(2006)
Population Change,
2001-2006
Population
Density
(per km2)
Total Land
Area (km2)
Land Area Within CVC
Watershed
Township of Amaranth Dufferin County 3,845 3% 15 264 2%
City of Brampton Peel Region 433,806 33% 1,627 267 48%
Town of Caledon Peel Region 57,050 13% 83 687 45%
Township of East Garafraxa Dufferin County 2,389 8% 14 166 20%
Town of Erin Wellington County 11,148 1% 38 297 46%
Town of Halton Hills Halton Region 55,289 15% 200 276 53%
City of Mississauga Peel Region 668,549 9% 2,317 289 32%
Town of Mono Dufferin County 7,071 2% 26 278 6%
Town of Orangeville Dufferin County 26,925 7% 1,729 16 100%
Total 1,266,072 17% 499 2,539 35%
Notes:
1. Communities selected for financial analysis are highlighted.
Credit River Water Management Strategy Update – Municipal Stormwater Financing Study 4
2.0 STORMWATER FUNDING MECHANISMS
This section identifies the options and available funding sources that have been used to support municipal SWM programs throughout North America. In addition, the advantages and disadvantages of the various stormwater funding options that meet the needs of CVC member municipalities are discussed.
2.1 Municipal Stormwater Management Programs
Stormwater management involves controlling the quantity and quality of runoff resulting from rainfall. Urbanization dramatically changes the runoff response characteristics of natural land surfaces and a variety of problems can result when stormwater systems and facilities are not properly managed. Stormwater problems are most evident in areas that are prone to chronic flooding or erosion, but less discernible are the long-term impacts to water quality, stream stability, and the environment in general. Stormwater management systems represent valuable public assets that provide a number of benefits for many users. A municipality’s SWM system includes watercourses, culverts, bridges, storm sewers, swales, catchbasins, inlets, outfalls, ponds and other water quality treatment devices. By controlling floodwaters and preventing pollutants from reaching our streams, rivers and lakes, SWM systems can protect the health and safety of the public and the environment as well as minimize flooding and erosion threats to public and private property. In so doing, clean and healthy water resources support public drinking water supplies and can attract local investment through increased land values. Furthermore, clean and healthy water resources can support recreational activities, tourism, business and manufacturing, as well as aquatic and terrestrial habitats that rely on water. Municipal stormwater management refers to all of the services provided by a local unit of government to properly and effectively manage stormwater within the community (i.e., collect, convey, transport, store, treat, and discharge to a downstream receiving waterbody or waterbodies). A typical municipal SWM program includes a number of components as illustrated in Figure 2-1, including:
• Design, permitting, and construction of new capital improvement projects;
• Operation and maintenance of SWM facilities;
• Asset management, valuation, and planning;
• Rehabilitation, renewal, retrofit, reconstruction or upgrade of existing facilities;
• Emergency response, recovery, and clean-up for flooding events, system failures (e.g., pipe collapses, streambank slope instabilities), spills and other water quality violations;
• Engineering and support services for review and regulation of proposed developments, inspection, monitoring, environmental compliance programs, record maintenance and document management;
• Support for public education and community involvement programs; and
• Administration, staffing, computer resources, equipment, etc., including enforcement of by-laws and detection of illicit discharges and cross-connections.
In general, municipalities are responsible for managing all aspects of stormwater within their jurisdiction, including operations and maintenance (O&M) of SWM facilities located within the public right-of-way limits or easements. The municipality does not maintain facilities that are located on private property, within regional or provincial road rights-of-way, or that fall under the jurisdiction of another governmental authority, such as CVC.

Credit River Water Management Strategy Update – Municipal Stormwater Financing Study 5
StormwaterStormwaterManagementManagement
Public InvolvementPrograms
Capital Projects
Administration / Enforcement
Finance
EmergencyResponse
Operations / Maintenance
Engineering /Support Services
Figure 2-1: Components of a Stormwater Management System
Municipal ownership and operation of SWM facilities constructed by a developer are typically included as part of the formal assumption of a subdivision. This process includes an initial warranty period (i.e., typically a minimum of one year after the Municipality has issued preliminary inspection approval) in which the developer must maintain all SWM facilities, outfall structures, channel works and appurtenances. A final inspection by municipal staff is conducted to certify that all SWM facilities and related services are in a condition satisfactory to the Municipality’s standards for assumption. Once the Municipality’s financial requirements have been met (e.g., payments to cover any future anticipated maintenance or other costs associated with the assumption), formal municipal ownership of the SWM facilities begins upon Council resolution (through bylaw) that all conditions of the Subdivision Agreement and approved Engineer Plans have been fulfilled and all maintenance requirements have been completed. Stormwater problems can generally be classified into the categories listed below.
Flooding: This is probably the most visible of stormwater problems. Serious flooding presents a threat to public safety and can damage public and private property, disrupt business, and otherwise hamper normal activities within a community. Stormwater management facilities are designed to safely collect, convey or store runoff as a result of rainfall and snowmelt events. However, the recurrence frequency of these events is subject to change as a result of climate variability. During frequent rainfall events, runoff is collected in the minor system of storm sewers, swales, and roadside ditches. During the rare events in which the minor system capacity is exceeded, runoff is also conveyed through the major system that includes curb and gutter drainage in the public road right-of-way and other surface overland flow routes and storage in detention facilities or floodplain areas.
Water quality: Road salt, chemical spills, sediment and organic debris can all degrade water quality, impacting the natural environment including aquatic and terrestrial habitat as well as affecting drinking water supplies. Stormwater management systems are designed to improve the water quality of discharge of urban runoff

Credit River Water Management Strategy Update – Municipal Stormwater Financing Study 6
to receiving waterbodies, but need to be properly planned, constructed, operated, and maintained in order to do so.
Erosion: Water traveling over a bare or unprotected surface will erode the soil material, increasing sediment loads in the watercourse and also threatening the stability of the streambank and can jeopardize both public and private property if not addressed properly. Stormwater management systems are also designed to control the movement of stormwater in such a way as to minimize the erosion of streambanks, adjacent hill slopes and exposed structures.
Debris: During rainfall events, debris, trash and other deleterious material on land surfaces can be transported through the SWM system. As a result, this material may create a barrier to flow and increase the flooding potential, or it may flow to downstream watercourses and impact water quality. Routine inspection and maintenance of the stormwater collection system and other facilities, as well as an appropriate emergency response/recovery program is necessary to minimize these problems.
Despite substantial investments in municipal SWM systems and facilities, there will always be a need to invest in new capital improvement projects and to reinvest in the operation, maintenance, planning, and management of the stormwater program. Existing SWM systems may be inadequate for a variety of reasons, including:
Urbanization: Growth and development alters the amount of runoff and pollution discharged into the system. Additional impacts may include the alteration of drainage system characteristics.
Aging
infrastructure:
Pipes, culverts, bridges, pond control structures, hardened streambanks, and outfalls have a limited life expectancy and must be repaired or replaced eventually. Structural deficiencies result when aging infrastructure has exceeded its anticipated service life.
Regulatory
requirements
/design
standards:
Regulatory requirements are always changing (e.g., relaxed design standards due to limited technology, or increased design standards due to more stringent regulatory requirements, new and improved technologies, etc.). As a result, systems designed to previous criteria may be inadequate with respect to current standards. Also, the level of protection to be provided by SWM facilities is often dictated through studies and governing agencies for water quality and habitat protection.
Inadequate
planning
Problems will result if SWM programs do not proactively plan the appropriate resources, measures, and improvement projects to address needs and problems. In addition, facilities and SWM assets must be inventoried and evaluated at regular intervals.
Inadequate
maintenance:
Problems will result if SWM programs do not actively and routinely inspect and operate facilities, maintain watercourses, clean catchbasins and inlets, sweep streets/gutters, collect leaves/debris in and around SWM systems, etc.
Poor design or
faulty
construction:
Development site plans must be properly reviewed and adequately inspected during construction to minimize the potential for hazards.

Credit River Water Management Strategy Update – Municipal Stormwater Financing Study 7
As noted above, municipal SWM programs represent major public investments, and capital and operating budgets are interrelated with many other municipal services and public works. The SWM programs within CVC municipalities are currently funded primarily through property taxes, with development related capital projects currently funded by development charges. Like other public works, SWM facilities have a specific design capacity and service life, regular O&M needs, and their performance decreases with age and additional demands placed on the system. As a result, stormwater facilities and related infrastructure must be inventoried, assessed, valued, and managed according to sound asset management principals in order to plan an appropriate schedule for replacement, renewal, and rehabilitation. Of all the public works provided by a municipality, SWM services are often the least understood by members of the community. Storm pipes are underground and out of sight, detention facilities and ponds are presumed to be natural features and the function of SWM facilities and practices are not easily recognized. As a result, there is little public awareness of a municipality’s SWM services, program needs, and expenditures. Stormwater management systems often only attract attention during periods of rainfall, particularly when systems fail or rainfall exceeds the design capacity resulting in property or road flooding. Furthermore, property owners have widely varying perceptions concerning how their properties generate stormwater runoff and pollution, since usage of the municipal SWM system is not based on demand like water and sewage systems (e.g., turning on a tap, flushing a toilet). This may result in the misconception that property owners cannot control the discharge of stormwater into the municipal SWM system. Unlike other public works, particularly in comparison to wastewater and potable water systems, SWM regulations and design standards are relatively new and evolving, resulting in many existing SWM systems and facilities that do not meet current federal or provincial requirements for the construction of new facilities and/or long-term maintenance. More stringent federal and provincial requirements for water quality and quantity control are also being proposed, further widening the gap to bring these publicly-owned systems into compliance. Although municipal governments are responsible for managing all aspects of stormwater within their jurisdiction, they have limited flexibility and autonomy in generating revenue (e.g., through taxes, fees, special charges, loans, bonds, grants, fines, private partnerships, etc.). Despite new regulations, there are no new federal or provincial funding sources to achieve them, increasing budgeting pressures. In Ontario, all but a handful of municipalities fund their stormwater programs through property tax revenue, and therefore annual stormwater budgets have to compete with other vital public services. Another element to note is that emergency works are often required which cannot always be foreseen or budgeted appropriately. In cases where the resource requirements placed upon a community far exceed the available resources appropriated by the elected officials, the implementation of capital projects or the extent/frequency of O&M activities, for example, becomes dependent on the availability of funds, rather than based on need. It is expected that competing demands for limited public funds will continue, forcing municipalities to pursue alternative financing mechanisms in order to provide a sustainable SWM program.
2.2 Overview of Funding Mechanisms
To support current and future SWM needs, there are four general mechanisms for funding the major components of a municipal SWM program, including:

Credit River Water Management Strategy Update – Municipal Stormwater Financing Study 8
• Taxes, which are mandatory levies authorized by the legislature, collected by a public body, and not related to any specific benefit or government service (i.e., these are for general services to support the public good);
• Fees and special charges, which are payments made to offset the cost of a specific service and payable by those people who benefit from the service;
• Special levies that have specific designations and limitations for usage;
• Other means besides taxes, fees, and special levies; and
• A combination of the above. Table 2-1 shows the funding options that have been used to support all or some portion of municipal SWM programs in North America. Property taxes are the primary source of funding for SWM programs in Ontario. At least three municipalities in Ontario (i.e., London, St. Thomas, and Aurora) have implemented a special stormwater user fee that charges a flat rate to residential properties and an area-based charge to commercial/industrial properties. Other municipalities in Ontario are known to be evaluating various stormwater funding options. There are approximately a dozen municipalities in western Canada that have either adopted a flat rate user free or have implemented a stormwater rate based on zoning and intensity of development. A list of municipalities in Canada that are known to charge a specific fee for stormwater services is included in Section 3.6.
Table 2-1: General Stormwater Program Funding Options
Category/Description Category/Description
Taxes Fees and Special Charges
Local Income Taxes Aquifer Protection Fees
Local Sales Taxes Bond Issuance Fees
Personal (Tangible) Property Taxes Connection Fees
Real (Ad Valorem) Property Taxes Construction Fees
Selective Sales Taxes Developer Charges
State/Provincial Sales and Use Taxes Direct Water Use Charges
Exactions
Impact Fees
Inspection/Monitoring/Testing Fees
Other Means Permitting Fees
Credit Enhancement Mechanisms Professional Certification Fees
Debentures/Bonds Septic System Impact Fees
Fines and Penalties Special Assessments
Grants Stormwater Rates
Loans Tolls
Public-Private Partnership Arrangements Water Rights Application Fees
Water/Wastewater Rates
Well Permit/Pumping Fees Funding opportunities for SWM projects are also possible through grants to municipalities from a variety of governmental sources. Grant programs are often very competitive, based on project merits, and in many cases require matching funds. Grants also tend to be time-limited and not a reliable or sustainable funding source. To be successful, the municipality must therefore be proactive and adequately established to take advantage of the grant program. Communities with an identified revenue stream will be in a better position to compete for and use the grant funds as they become available. Grant funding options include:

Credit River Water Management Strategy Update – Municipal Stormwater Financing Study 9
• Earmarked money from the provincial capital budget including direct grants or gas tax revenues allocated to Ontario municipalities.
• Infrastructure investment programs such as the Ontario Rural Infrastructure Investment Initiative (RIII) and the Canada-Ontario Municipal Rural Infrastructure Fund (COMRIF)
• The federal government, through the Federation of Canadian Municipalities (FCM), has established grant funding under the Green Municipal Fund that can be used to support municipal governments and their partners in developing communities that are more environmentally, socially and economically sustainable. Eligible projects may include feasibility studies, field tests, sustainable community plans, and capital projects that demonstrate municipal leadership in sustainable development and serve as examples for other communities.
• Research grants (e.g., through MOE or a federal program such as Natural Sciences and Engineering Research Council of Canada (NSERC), typically in conjunction with a local university or other partners.
An ideal funding source for a municipal SWM program would have the following characteristics:
• Costs are allocated in a fair and equitable manner;
• Provides a sustainable and dedicated funding source to support SWM program needs;
• Applicable for use on a Town-wide or City-wide basis;
• Revenue meets the requirements for the optimum level of service provided and appropriate reserve funding levels are maintained;
• Costs and benefits are equitably distributed, and are transparent and visible across the community;
• Specifically for the case of fees and special charges: sound policies are in place for credits, adjustments and appeals, and rate study recommendations are publicly supported;
• Reasonable implementation costs (e.g., in calculating charges, managing billing systems, and overall administration); and
• Consistent with provincial and federal legislation. As part of this study, a number of meetings were held with CVC member municipalities to discuss the various funding options and those that would be most appropriate for the individual communities. These meetings included:
• June 11, 2007 workshop at the CVC office;
• July 4, 2007 working session at the Town of Orangeville;
• July 26, 2007 working session at the City of Mississauga;
• Follow-up meetings and phone discussions with Orangeville and Mississauga staff from October through December, 2007;
• An interim report review meeting was held January 16, 2008 at the City of Mississauga; and
• An interim report review meeting was held January 24, 2008 at CVC with the Town of Orangeville.
Based on discussions during these meetings, it has been determined that the funding options that are most applicable to CVC member municipalities are:
• Property Tax;
• Development Related Charges and Fees; and
• Stormwater Rate

Credit River Water Management Strategy Update – Municipal Stormwater Financing Study 10
2.3 Property Tax
2.3.1 General Tax Fund
Local property taxes are the most significant revenue source to support the SWM programs in CVC member municipalities. Revenue derived from the municipality’s portion of property tax goes into a general fund which covers the operating and capital expenditures of many services across several departments. Table 2-2 show the 2007 property tax rates for various taxable/occupied classes within selected CVC member municipalities.
Table 2-2: 2007 Property Tax Rates
Tax Class
Town of Orangeville
Town of Caledon
City of Mississauga*
Residential 0.74% 0.29% 1.00%
Multi-Residential 1.98% 0.50% 1.58%
Commercial/Office Building/Shopping Centre 0.90% 0.38% 2.60%
Industrial 1.62% 0.43% 2.94% Note: *The Orangeville and Caledon values show local tax rates, Mississauga values also include
the Regional and Education tax rates. Property tax is determined based on the property value assessment multiplied by the applicable tax rate which depends on zoning/building type and taxing status. The municipality also collects tax revenue on behalf of the school boards and the upper tier government (e.g., Peel Region). In this study, only the municipal portion of taxes is considered in the evaluation. The municipality’s portion on the annual property tax bill is calculated as the assessed property value times the corresponding rate by property type shown in Table 2-2. Property tax rates are established on an annual basis by Ontario municipalities to meet their projected funding needs and in consideration of the total Current Value Assessment (CVA) of all taxable properties within their jurisdiction. Furthermore, a number of Ontario municipalities have a capping adjustment program that limits tax payments for selected property types (e.g., Commercial, Industrial and Multi-Residential Properties). Tax-exempt properties generally do not contribute to the municipality’s SWM program. Tax-exempt properties include governmental parcels (e.g., municipal, regional, provincial, and federal buildings) as well as institutional parcels (e.g., schools, hospitals, and churches) and other charitable organizations that are registered with the Canada Revenue Agency and therefore exempt from taxation under the Income Tax Act. Some municipalities charge a core service fee or tax-like payment to tax-exempt properties. For example, the federal government administers the Payments in Lieu of Taxes program which distributes funds on behalf of eligible tax-exempt institutions to property taxing authorities such as CVC member municipalities to compensate for valuable services such as SWM, sanitary sewage collections, water distribution, police protection, fire protection, waste disposal and roads. The Municipal Act authorizes a “heads and beds” charge to institutions (e.g., hospitals, post-secondary schools, and correctional facilities), where payments of $75 per person/year or per bed/year are made under this program. For example, a 400-bed hospital would contribute $30,000 to the local municipality as a payment in lieu of tax.

Credit River Water Management Strategy Update – Municipal Stormwater Financing Study 11
2.3.2 Dedicated Tax Levy
A dedicated levy can be administered specifically to raise revenue for stormwater services, such that a fixed property tax rate is applied and itemized on the property owner’s annual tax bill, as is done in other Ontario municipalities for other public services (e.g., Police, Fire, Transit, Local Improvements, etc.). A by-law would be required to dedicate these funds specifically to SWM. With the general tax fund, money to support the SWM program comes from the municipality’s overall tax rate (as shown in Table 2-2) and is not dedicated until the annual budget is set each year. 2.3.3 Advantages and Disadvantages
Funding the municipality’s SWM program through property taxes offers several advantages, including:
• Property-tax-based revenues are already accepted as the primary existing source of revenue for municipalities;
• Can be used to fund all SWM program activities; and
• The billing system is already established for property taxes. Funding the municipality’s SWM program through property taxes offers several disadvantages, including:
• Property taxes are based on a property’s assessed value, which may not equate to its runoff contribution, so the fairness and equity of this revenue source is low;
• It is not a dedicated funding source (except in the case of a dedicated tax levy as described in Section 2.3.2);
• There is an annual competition for general tax funds to support other community services and can therefore prove difficult to sustain the SWM program. For example, funding demands for public safety (e.g., police and fire) and health care decrease the ability of property taxes to support significant increases in other programs (i.e., the SWM program);
• There is no incentive to reduce stormwater runoff and pollutant discharge;
• Tax-exempt properties contribute very little or nothing to support the SWM program; and
• Less effective cash flow with a single annual bill to customers versus monthly billing (e.g., through a stormwater rate as described in Section 4).
2.4 Development Related Charges and Fees
2.4.1 Development Charges
The Ontario Development Charges Act of 1997 authorizes municipalities to pass by-laws for the recovery of costs incurred to provide services to new and re-development projects. Development charges (DC) can only be utilized to fund eligible growth-related capital costs, and only for the services for which they were collected. DC rates are often based on the number of residential dwelling units or the building floor area for non-residential developments. Area-specific DC rates can be charged depending on location. Revenue derived from DC can be applied to projects throughout the municipality. As mentioned above, it is used to cover the capital costs related to growth, which may include the following SWM program components:
• Storm sewers, drainage works and other SWM facilities;
• Erosion control works;

Credit River Water Management Strategy Update – Municipal Stormwater Financing Study 12
• Stream rehabilitation and environmental enhancement structures;
• Engineering services related to managing and administering the capital program; and
• Acquisition and installation of monitoring equipment to observe and evaluate post-construction performance.
2.4.2 Cash-in-lieu Charges
In areas where there is the potential for re-development/infill, and on-site SWM facilities are considered infeasible (e.g., by presenting an undue maintenance burden on the municipality) contributions to off-site SWM facilities can be allocated in the form of a cash-in-lieu policy. Like DC, the rates are based on the area of development (or number of dwelling units) and area-specific rates can be determined for different geographic locations within the community. Unlike DC however, revenue derived from cash-in-lieu charges can be applied to both capital and operations/maintenance costs of SWM facilities.
2.4.3 Subdivision Agreements
Another form of development related charges used in Ontario to fund the municipality’s SWM program is through the use of subdivision agreements. These are one-time agreements for area-specific capital works in new development subdivisions. Cost sharing for joint facilities can also be accommodated. The present value costs of anticipated future operations/maintenance and ongoing monitoring can also be included in the agreement. 2.4.4 Advantages and Disadvantages
Funding the municipality’s SWM program through development related charges offers several advantages, including:
• Accepted by the development community; and
• Charges are based on contributing area, which is more equitable than property value. Funding the municipality’s SWM program through development related charges offers several disadvantages, including:
• They are limited by the amount of developable land within municipality (i.e., not applicable throughout municipality);
• Directly dependent on growth and growth rates (i.e., if growth rate declines, so does the revenue collected); and
• Development charges are limited to the capital costs associated with the development (cash-in-lieu and subdivision agreements can also be used for operations/maintenance).
2.5 Impervious Area Based Charges
2.5.1 Stormwater Rate
A stormwater rate involves assessing all property owners a charge for the municipality’s SWM services based on the amount of impervious area. The fee is typically assessed monthly or quarterly. The rate is based on the contribution of stormwater runoff from each property to the local drainage system (e.g., ditches, sewers, and channels) and water quality control facilities. Revenues generated through the rate can be used for any SWM program related costs. A stormwater rate is a more equitable funding mechanism than other funding sources, because fees assessed to each parcel of land are based on usage of the drainage system rather than

Credit River Water Management Strategy Update – Municipal Stormwater Financing Study 13
property value. Because commercial and industrial properties generally generate much more runoff and stormwater pollution per square meter or square foot than single-family residential properties, these properties are charged a proportionally greater fee. The principal advantage associated with a stormwater rate is that all parcels; including tax-exempt properties (e.g., federal, provincial, school, and other tax-exempt buildings and installations) can be assessed a user fee that reflects their relative stormwater contribution to the municipal SWM system. For example, each tax-exempt parcel could be charged a stormwater user fee that is proportional to the stormwater discharge from the property. This method is similar to the manner in which other public utility or user fee operations bill tax-exempt property based on usage (e.g., electricity usage and water consumption). The area of impervious ground cover (e.g., rooftops, driveways, and parking lots) is typically used as the basis for the stormwater rate because impervious area is a common indicator of stormwater flow and pollution discharge potential. Figure 2-2 illustrates the impervious area for a typical single family residential home.
Figure 2-2: Example of Impervious Areas of a Single Family Residential Home
Note: Impervious areas are outlined in blue (driveway, walkway, and rear patio) and green (roof). The average impervious area per dwelling unit (in square meters or square feet) for residential land use categories is typically designated as the base unit for the user fee structure. The base unit

Credit River Water Management Strategy Update – Municipal Stormwater Financing Study 14
represents the stormwater discharge potential of the average residential dwelling and its associated lot. It can be based on all residential development (including multi-family) or on single-family residential development only. The average impervious area of the base unit is calculated by summing the impervious area (in square meters or square feet) for all residential parcels and dividing by the total number of dwelling units. A stormwater rate typically charges a flat fee to each residential dwelling unit and charges a non-residential parcel based on the ratio of the parcel’s impervious area to that of the base unit. For example, if a commercial or industrial parcel has four times the impervious area of the base unit, the parcel would be billed four times the monthly flat fee for residential dwelling units. Further references on stormwater rates and their application throughout North American can be found in Appendix A. Case studies on selected stormwater rates are included in Section 3.
2.5.2 Advantages and Disadvantages
Funding the municipality’s SWM program through a stormwater rate offers several advantages, including:
• Dedicated funding source;
• Fair and equitable fee that is based on runoff contribution rather than property value;
• A mechanism to charge tax-exempt property for municipal SWM services;
• With a credit program, provides an incentive for property owners to reduce stormwater runoff and pollutant discharge; and
• A stable funding source for all SWM program activities to allow long-range planning, large-scale capital improvements, and leverage for debentures.
Funding the municipality’s SWM program through a stormwater rate offers several disadvantages, including:
• Additional implementation costs (e.g., rate study, database management, billing and customer service – however this could be minimized through the use of other existing billing systems such as electricity, water/sewer, etc.); and
• The possibility that a new fee may not be well received by the public; however this can be avoided through the formation of a stormwater advisory committee. Committee members are chosen to represent the broad spectrum of key stakeholders/ratepayers and facilitated meetings are held to educate members on the municipality’s stormwater needs, expenditures and achieve consensus on stormwater rate implementation details.
2.6 Comparison of Funding Options
Table 2-3 compares the various stormwater funding options with respect to several specific criteria, including:
• City-Wide Applicability: This category indicates whether or not the funding method can be used throughout the municipality’s jurisdiction.
• Used for Capital Costs: Identifies the eligibility for funds to be used to support capital improvement projects.
• Used for O&M Costs: Identifies the eligibility for funds to be used to support operations and maintenance activities.
• Used for Engineering/Support Costs: Identifies the eligibility for funds to be used to offset the costs of engineering, support, and overall administration of the SWM program.

Credit River Water Management Strategy Update – Municipal Stormwater Financing Study 15
• Meets Entire Revenue Needs: This category indicates whether or not the funding method satisfies the revenue requirements of the SWM program (i.e., all Capital, O&M and Engineering/Support costs).
• Fair & Equitable Allocation: This category indicates whether or not the funding method charges the property owner according to individual contribution to the SWM program expenditures.
• Dedicated Funding Source: Identifies those funding methods that are sustainable and funds are dedicated solely to SWM program expenditures.
• Public Accountability: This category provides the relative scale (low, medium, or high) to which revenue and expenditures are clearly understood and equated. This has also been referred to as Transparency. Options with a high accountability are considered to be advantageous.
• Effort to Administrate: This category identifies the relative effort to administer the funding option. Options with low administrative effort are considered to be advantageous.
• Social Benefits: This category identifies the relative scale of social benefits provided by the option. Options with high social benefit are considered to be advantageous and generally include those options that minimize the use of tax funds for SWM services (i.e., leaving more available tax funds to support health/safety, law enforcement, and other public services).
• Environmental Benefits: This category identifies the relative scale of environmental benefits provided by the option. Options with high environmental benefit are considered to be advantageous and generally include those options that provide incentives to reduce stormwater and pollutant loads using source control measures.
Table 2-3: Comparison of Stormwater Funding Options
Funding Method
City Wide
Applic-
ability
Used for
Capital
Costs
Used for
O&M
Costs
Used for
Eng'rg/
Support
Costs
Meets
Entire
Revenue
Needs
Fair &
Equitable
Alloc-
ation
Dedicated
Funding
Source
Public
Account-
ability
Effort To
Admin-
istrate
Social
Benefits
Environ-
mental
Benefits
General Tax Fund Yes Yes Yes Yes Yes No No Low Low Low Low
Dedicated Tax Levy Yes Yes Yes Yes Yes No Yes Medium Medium Low Low
Development Charges No Yes No Yes No Yes Yes Medium Medium High Medium
Cash-In-Lieu Charges No Yes No No No Yes Yes Medium Medium High Medium
Subdivision Agreements No No Yes No No Yes Yes Medium Medium High Medium
Stormwater Rate Yes Yes Yes Yes Yes Yes Yes High High High High As shown in Table 2-3, only the property tax and stormwater rate alternatives address all aspects of a comprehensive SWM program on a municipality-wide scale. Development related charges are an important source of revenue, but cannot be used solely to support the entire program. This comparison presents a relative assessment of the criteria noted above. While the intent of this study is not meant to select one option over another, Table 2-3 does highlight the preference of a stormwater rate over property tax methods based on its fair and equitable allocation. As noted in the disadvantages for a stormwater rate, there may be an overriding sense of maintaining the status quo of property tax based funding versus introducing a new fee that may not be well received by the public. There may also be reluctance by municipal staff in adopting a new fee structure, particularly if it is not consistent with the overarching corporate philosophy and policy framework. In summary, a stormwater rate is considered the most equitable and sustainable funding mechanism because the costs are allocated based on the relative stormwater impacts caused by a

Credit River Water Management Strategy Update – Municipal Stormwater Financing Study 16
property. The correlation between the amount of impervious area and the relative quantity and quality of stormwater runoff allows a fair and equitable allocation of SWM costs. In addition, a stormwater rate provides a mechanism to provide financial incentives to reduce stormwater and pollutant load contributions at source as well as a dedicated revenue source that can be used to implement a comprehensive program.

Credit River Water Management Strategy Update – Municipal Stormwater Financing Study 17
3.0 REPRESENTATIVE CASE STUDIES This section presents a summary of stormwater rate implementations in communities that have similar needs and issues as CVC member municipalities. These representative case studies highlight the key program elements, public consultation activities, incentive programs, implementation costs, and billing systems in three different communities that have utilized a stormwater rate to successfully satisfy revenue requirements for stormwater management, including:
• Pittsburg, Kansas which represents a largely rural community located in the headwaters;
• Middletown, Ohio, an urbanizing community in the middle of a watershed; and
• Memphis, Tennessee, a large urban community at the downstream end of a watershed. This section also includes a description of recent stormwater rate studies in Ontario, a list of stormwater user fees throughout Canada, and a summary of lessons learned.
3.1 Pittsburg, Kansas
The City of Pittsburg is located in Crawford County southeastern Kansas. It has a population of 19,000 and a total area of 32.4 km2 (12.5 mi2). This community was selected as an example of a stormwater rate implementation in a mostly rural area located at the upstream end of a watershed. The stormwater management needs and issues of Pittsburg are similar to many of the CVC member municipalities located in the headwaters of the Credit River watershed, including the Town of Orangeville. The City selected CDM to assist in evaluating the necessary revenue source to resolve existing flooding problems and to manage the stormwater management system appropriately for future needs. There is no county involvement in the City’s stormwater management program. Pittsburg State University is a major property owner within Pittsburg and occupies approximately 20 percent of the City’s area. Since a master plan had been completed in 1993, CDM was asked to review the results of that investigation and incorporate those project requirements into the analysis of the appropriate level of expenditures. Along with these capital project needs, CDM assisted the staff in developing costs for existing O&M, along with projecting the O&M needs for five years. As an adjunct to the technical evaluations, CDM assisted the City in developing a Stormwater Advisory Committee and presenting the needs through a series of presentations and facilitated discussions. The result of these discussions was the unanimous approval of a stormwater charge to improve O&M and initiate the debt financing for capital projects in 2003. In order to accomplish these assignments, the rate structure was initiated January 1, 2003 and continues to be used to support the City’s entire stormwater management program. Table 3-1 identifies the specific parcel analysis that was developed to classify the stormwater billing units for each land use category. As presented in this tabulation, the ERU (Equivalent Residential Unit) rate structure was selected as the “best fit” for this community. Table 3-1 shows the number of dwelling units and total square meters of impervious area in each land use category. The average impervious column divides the impervious area by the number of dwelling units for each residential land use category. The calculation at the bottom of the table averages the impervious area for all residential categories to give an estimate of the average ERU size, which is 289 m2 (3,106 ft2).

Credit River Water Management Strategy Update – Municipal Stormwater Financing Study 18
Table 3-1: Parcel Analysis for Pittsburg, Kansas
Parcel Dwelling Est'd Impervious Avg. Impervious Number of Percent of
Type Units Area (m2) Area (m2) ERUs Total ERUs
Residential
Single Family 7,078 2,227,684 315 7,078 35.3%
Duplex 574 96,151 168 574 2.9%
Triplex 116 16,689 144 116 0.6%
Quadplex 71 8,001 113 71 0.4%
Multi-Family 662 94,353 143 662 3.3%
Moble Home 170 59,101 348 170 0.8%
Non-Residential
Commercial n/a 1,640,374 5,685 28.3%
Industrial n/a 744,834 2,581 12.9%
Exempt n/a 676,893 2,346 11.7%
Agricultural n/a 92,416 320 1.6%
Recreation n/a 131,167 455 2.3%
Not Included in Rate
Undeveloped n/a n/a 0 0.0%
Total 8,671 5,787,663 20,058 100.0%
Average Equivalent Residential Unit (ERU) size: 288.5 m2
3,105.9 ft2
By definition, the number of ERUs for all residential properties is equal to the number of dwelling units. For non-residential properties, the number of ERUs is determined by dividing the estimated impervious area by the corresponding ERU size. The final column in the table shows the percentage of stormwater billing units in each land use category. As shown in Table 3-1, there were an estimated 20,000 billing units in 2003. Table 3-2 projects the anticipated revenue necessary for different rate structures. An annual growth rate of 5 percent per year has been incorporated into the projection. Further, it is assumed that 5 percent of the potential revenue would go uncollected due to adjustments or credits, errors in billing, or delinquent accounts.
Table 3-2: Projected Revenue for Pittsburg, Kansas
FY 2003 FY 2004 FY 2005 FY 2006 FY 2007
20,058 21,061 22,114 23,220 24,381
$1.00 $228,661 $240,094 $252,099 $264,704 $277,939
$1.50 $342,992 $360,141 $378,148 $397,056 $416,909
$2.00 $457,322 $480,189 $504,198 $529,408 $555,878
$2.50 $571,653 $600,236 $630,247 $661,760 $694,848
$3.00 $685,984 $720,283 $756,297 $794,112 $833,817
$3.50 $800,314 $840,330 $882,346 $926,464 $972,787
$4.00 $914,645 $960,377 $1,008,396 $1,058,816 $1,111,756
Notes:
1. Assumes a 5% annual growth rate
2. Assumes a 95% collection rate
FY:
ERU Billing Units1:
Monthly Rate2
($ per ERU per
Month)

Credit River Water Management Strategy Update – Municipal Stormwater Financing Study 19
Based on the Advisory Committee’s recommended level of service, the average annual revenue requirements to support the City’s future stormwater management program were estimated to be approximately $1,000,000 per year. Using the values shown in Table 3-2, this resulted in a selected rate structure of $3.50/ERU/month. As part of the City’s stormwater rate implementation, a credit policy has been adopted that includes a site specific evaluation of SWM practices and follows an application form process. This incentive program provides up to 25 percent credit to the university and industrial property owners that demonstrate on-site SWM practices are properly installed and maintained. Stormwater billing was integrated with the existing water/wastewater utility billing system, which is wholly owned and operated by the City of Pittsburg. Reference:
Mr. Allen Gill, City Manager City Hall City of Pittsburg 201 West Fourth Street Pittsburg, Kansas 66762 Tel: (620) 231-4100
3.2 Middletown, Ohio
The City of Middletown is located in southwestern Ohio. It has a population of 51,000 and a total area of 66.8 km2 (25.8 mi2). This community was selected as an example of a stormwater rate implementation in an urbanizing area located in the middle of a watershed. The stormwater management needs and issues of Middletown are similar those of the Town of Caledon. The City of Middletown retained CDM to assist with the formation and implementation of a stormwater rate. Middletown contains approximately 274 km (170 mi) of storm sewers, of which approximately 124 km (77 mi) comprise the combined sewer system. Consequently, Middletown’s stormwater user charge must fairly and equitably distribute the stormwater user fee in both the combined and separate sewer areas. Approximately 30 percent of the City’s area is comprised of industrial properties. Project tasks included start-up administration and coordination, a project kickoff workshop, Stormwater Advisory Committee workshops, data collection, evaluation of existing storm/combined sewer system, review of existing and future programs, rate structure determination, general billing system analysis, preliminary rate analysis and revenue scenarios, credit policy options, financing system impact, implementation policy and procedures, stormwater funding ordinance, public information/education program, organization and staffing, and a summary report. Although there is no county involvement in the City’s stormwater management program, the county was represented as an ex-officio member of the Advisory Committee. The key City issues that were addressed included the following:
• Areas of the City that chronically flood during rainfall events;
• An aging and deteriorating storm and combined sewer infrastructure—the city has identified the need to spend $60 to $75 million in capital improvement projects over the next 25 years to repair, replace, and upgrade the system, and required assistance with funding options; and

Credit River Water Management Strategy Update – Municipal Stormwater Financing Study 20
• The City must develop a stormwater management plan for compliance with the National Pollutant Discharge Elimination System (NPDES) Phase II Stormwater Rule.
CDM conducted a series of facilitated sessions with the Stormwater Advisory Committee composed of community stakeholders. This process allowed the city to gain the public and council buy-in necessary to formulate and implement a stormwater user fee that could be used to generate revenues to help solve the flooding problems, develop a preventative storm sewer system operation and maintenance program, and achieve compliance with the NPDES Phase II Stormwater Rule. Additional services provided in the rate development included the creation of an Adjustment and Credit Policy for the stormwater rate. Following acceptance of the Advisory Committee’s recommendations, the City implemented a stormwater rate in July 2004. Table 3-3 identifies the specific parcel analysis that was developed to classify the stormwater billing units for each land use category. The ERU (Equivalent Residential Unit) rate structure was selected as the “best fit” for this community. Table 3-3 shows the number of dwelling units and total square meters of impervious area in each land use category. The average impervious column divides the impervious area by the number of dwelling units for each residential land use category. The calculation at the bottom of the table averages the impervious area for all residential categories to give an estimate of the average ERU size, which is 261 m2 (2,814 ft2).
Table 3-3: Parcel Analysis for Middletown, Ohio
Parcel Dwelling Est'd Impervious Avg. Impervious Eligible Number of ERUs Percent of
Type Units Area (m2) Area (m
2) Credits (base) (w/ credits) Total ERUs
Residential
All Residential Categories 18,530 4,844,406 261 0% 18,530 18,530 49.4%
Non-Residential
Agricultural n/a 3,037 5% 12 11 0.0%
AK Steel (Industrial) n/a 3,023,251 80% 11,564 2,313 6.2%
Other Industrial n/a 824,815 5% 3,155 2,997 8.0%
Commerical n/a 2,455,445 5% 9,392 8,923 23.8%
Exempt Governmental n/a 550,741 5% 2,107 2,001 5.3%
Exempt Schools n/a 344,906 5% 1,319 1,253 3.3%
Exempt Religious n/a 323,376 5% 1,237 1,175 3.1%
Exempt Other n/a 78,176 5% 299 284 0.8%
Not Included in Rate
Undeveloped n/a n/a 0% 0 0 0.0%
Total 18,530 12,448,152 47,615 37,487 100.0%
Average Equivalent Residential Unit (ERU) size: 261.4 m2
2,814.1 ft2
As part of the City’s Adjustment and Credit Policy, billing unit credits for various property types were negotiated during the stormwater rate implementation process. These credits are shown in the Eligible Credits column in Table 3-3. In general a 5 percent credit was awarded to non-residential properties, with the exception of the City’s largest industry, AK Steel, which was assigned an 80 percent credit. By definition, the number of ERUs for all residential properties is equal to the number of dwelling units. For non-residential properties, the number of base ERUs is determined by dividing the estimated impervious area by the corresponding ERU size. The number of ERUs

Credit River Water Management Strategy Update – Municipal Stormwater Financing Study 21
(including eligible credits) is shown in the second last column. The final column in the table shows the percentage of stormwater billing units in each land use category. As shown in Table 3-3, there were an estimated 37,500 billing units in 2004. Based on the Advisory Committee’s recommended level of service, the average annual revenue requirements to support the City’s future stormwater management program were estimated to be approximately $1,300,000 per year. Since the eligible credits were factored into calculation of the number of stormwater billing units, there was no need to account for a revenue reduction. Based on the 37,500 billing units, a rate structure of $3.00/ERU/month was selected to meet the average annual revenue requirements. Stormwater billing was integrated with the existing water/wastewater utility billing system, which is wholly owned and operated by the City of Middletown. Reference:
Ms. Ginger Smith, Director Department of Public Works City of Middletown One Donham Plaza Middletown, Ohio 45042 Tel: (513) 425-1808
3.3 Memphis, Tennessee
The City of Memphis is located in southwestern Tennessee, along the Mississippi River near the confluence with the Wolf River. It has a population of 671,000 and a total area of 763.4 km2 (294.8 mi2). This community was selected as an example of a stormwater rate implementation in a mostly rural area located at the upstream end of a watershed. The stormwater management needs and issues of Memphis are similar those of the City of Mississauga. The City of Memphis contracted with CDM in the spring of 2005 to develop and implement a stormwater rate, known as the City of Memphis Stormwater Enterprise Fund. The initial project task was to facilitate a series of workshops with representatives from a cross-section of the City (residents, industry, commercial business, churches, environmental groups, developers, etc.). The workshops culminated in July of 2005 with a discussion of various rate methodologies. Although there is no county involvement in the City’s stormwater management program, the county was represented as an ex-officio member at these workshops. The results of the workshop were used to develop a stormwater funding ordinance. The ordinance passed the Memphis City Council with overwhelming support (only one vote against). CDM completed the parcel analysis (digitizing impervious areas), working in a cooperative arrangement with students from the University of Memphis, to populate the database needed to develop the billing system. A formal adjustment and credit policy was adopted, including a manual and structured approval process. The billing database is administered by Memphis Light Gas and Water, a City-owned enterprise, in their monthly utility billings. The initial bills were sent beginning May 1, 2006. Table 3-4 identifies the specific parcel analysis that was developed to classify the stormwater billing units for each land use category. The methodology selected was a stormwater rate with a tiered SFU (Single Family Unit) residential structure. The tiered residential structure allows

Credit River Water Management Strategy Update – Municipal Stormwater Financing Study 22
dwelling units that contain smaller impervious areas to be charged less than the typical single family detached residents, and consequently residential properties with a larger than average impervious footprint would be charged a higher than average residential rate. This tiered structure was seen as a means to provide relief to economically disadvantaged homeowners.
Table 3-4: Parcel Analysis for Memphis, Tennessee
Parcel Dwelling Est'd Impervious Avg. Impervious Number of Percent of
Type Units Area (m2) Area (m
2) SFUs Total SFUs
Residential
Single Family Home (Small) 16,580 2,835,752 171 9,699 2.4%
Single Family Home (Average) 132,639 38,780,348 292 132,639 33.0%
Single Family Home (Large) 16,580 7,385,894 445 25,262 6.3%
Duplex 13,274 1,713,680 129 5,861 1.5%
Triplex 546 65,747 120 225 0.1%
Apartment 66,304 8,309,628 125 28,421 7.1%
Apartment Garden 8,301 954,649 115 3,265 0.8%
Apartment High Rise 4,011 146,208 36 500 0.1%
Townhome 11 2,063 188 7 0.0%
Condo 6,361 1,053,084 166 3,602 0.9%
Mobile Home Park 1,919 432,385 225 1,479 0.4%
Non-Residential
All Non-Residential Categories n/a 55,741,824 190,658 47.5%
Not Included in Rate
Undeveloped n/a n/a 0 0.0%
Total 266,526 117,421,262 401,618 100.0%
Average Equivalent Residential Unit (ERU) size: 231.4 m2
2,491.0 ft2
Average Single Family Unit (SFU) size: 292.4 m2
3,147.1 ft2
Table 3-4 shows the number of dwelling units and total square meters of impervious area in each land use category. The average impervious column divides the impervious area by the number of dwelling units for each residential land use category. The calculation at the bottom of the table averages the impervious area for all residential categories to give an estimate of the average ERU size, which is 231 m2 (2,491 ft2). The average SFU size is the average impervious area for single family homes, which is 292 m2 (3,147 ft2). The number of SFUs for each residential property category is equal to the number of dwelling units times the ratio of average impervious area to the average SFU size. For example, apartment units in Memphis have an average impervious area of 125 m2, which is 43 percent of the average SFU size (i.e., 125 m2/292 m2). The number of apartment SFUs is therefore 66,304 dwelling units times 43 percent, or 28,421 as shown in the second last column. The final column in the table shows the percentage of stormwater billing units in each land use category. As shown in Table 3-4, there were an estimated 401,600 billing units in 2006. Based on the Advisory Committee’s recommended level of service, the average annual revenue requirements to support the City’s future stormwater management program were estimated to be approximately $18,000,000 per year. The City’s stormwater rate ordinance included a condition

Credit River Water Management Strategy Update – Municipal Stormwater Financing Study 23
that the rate be phased-in over a 4-year period which helped to balance additional capital revenue requirements. The selected rate increased from $2.30/SFU/month in the first year of implementation to $4.60/SFU/month in the fourth year. Reference:
Mr. Jerry Collins, P.E., Director Division of Public Works City of Memphis 125 North Main Street Memphis, Tennessee 38103-2091 Tel: (901) 576-7109
3.4 Kitchener and Waterloo, Ontario
The Kitchener-Waterloo Stormwater Utility Feasibility Study was initiated in July 2005 with the original objective of evaluating the feasibility of a mechanism to fund stormwater related activities in both cities. Key project highlights included:
• Kickoff workshop in August 2005 that included presentations, interviews, and related discussion session with key staff from several City departments;
• A series of six facilitated Stormwater Advisory Committee (SWAC) meetings from October 2005 thru April 2006;
• Individual discussion meetings in March 2006 with SWAC members (i.e., residents, business, and education groups); and
• Two public open house forums (in February and April 2006) with summary presentations, informational poster boards, and activities targeted to specific groups (i.e., residential taxpayers, non-residential taxpayers, tax-exempt entities).
The existing and future SWM program needs and expenditures were reviewed and evaluated for each city. In addition, a statistical sampling of the impervious area for residential land use categories was performed using computer based measurements from aerial photographs. Impervious areas for non-residential parcels were estimated. The project was halted in May 2006 in order to solicit more public feedback on expenditures and funding options for the cities’ stormwater programs. During the project hiatus, the project name was changed to the Kitchener-Waterloo Stormwater Management Program and Funding Review. The project resumed the following year with an interim report in May 2007 that reviewed the current SWM programs and identified current and future funding needs and expenditures. Research focus groups were held in November 2007 to provide additional public feedback. Participants in the focus groups were randomly recruited from their target population representing Kitchener residents, Waterloo residents, business owners from both municipalities, and tax exempt property owners or board members from both municipalities. Meetings were held individually with these four groups and were facilitated by a neutral, third party facilitator. The key findings from the focus group meetings included the following:
• In general, people support the concept that those who contribute the most stormwater to the system through impermeable surfaces should contribute the most funds toward managing it.
• In general, residential property owners support a user fee model (which assesses a charge in relation to the stormwater contribution from a property, rather than property tax which is based on assessed value). This is likely influenced by the possibility that they would pay less than they currently do.

Credit River Water Management Strategy Update – Municipal Stormwater Financing Study 24
• Business and tax exempt property owners are much more concerned about a user fee structure that would have them absorb additional costs.
• Tax exempt properties would experience unique and perhaps profound challenges under a user fee scenario, as revenue generation opportunities are limited.
• The introduction of a combination fee structure (i.e. blended revenue from the tax base and user fees) is seen by many to be a more palatable first step towards a user pay system.
• SWM and related funding matters were not a high priority issue for most participants.
• Once informed about the current program and funding challenges, many expressed greater levels of interest in SWM and support for additional funding.
• Skepticism was expressed by some participants that moving to a user fee would result in any decrease in property taxes.
• Education, incentives and credits are seen as key success factors for any SWM funding system.
The stormwater rate structure analysis resumed in January 2008. The average detached Single Family Unit (SFU) uses the average impervious area of the single family detached home as the base billing unit. Under this rate policy, single family residences are charged one unit (i.e., 1 SFU). Multi-family, duplex, triplex, condominiums and mobile homes will be charged based upon the total impervious area of that category divided by the number of dwelling units, and then divided by the average area of a single family parcel. Based on the parcel analysis, a tiered SFU structure was deemed to be appropriate in Kitchener and Waterloo. Under this tiered rate policy, all customers are charged a fee based on the total impervious area on each parcel divided by the average area of a single family parcel. Table 3-5 summarizes the number of parcels, dwelling units, and impervious area for each land use category in Kitchener. The average impervious area of single family homes was calculated to be 259 m2 (2,788 ft2).
Table 3-5: Parcel Analysis and Stormwater Billing Units for Kitchener, Ontario
Parcel Number Dwelling Est'd Impervious Area (m2) SFU Tiered SFU Distribution
Type of Parcels Units Total Avg/d.u. Factor Count %
Single Family (small) 4,181 4,181 702,374 168 0.6 2,508 3.1%
Single Family (medium) 33,446 33,446 8,662,618 259 1.0 33,446 41.2%
Single Family (large) 4,181 4,181 1,438,195 344 1.3 5,435 6.7%
Duplex 1,396 2,792 299,219 107 0.4 1,117 1.4%
Townhouse 6,393 6,393 1,238,963 194 0.7 4,475 5.5%
Multi-Family 3-5 Units (est'd) 440 1,519 143,713 95 0.4 608 0.7%
Multi-Family >5 Units (est'd) 1,191 27,082 1,676,376 62 0.2 5,416 6.7%
Residential Vacant 1,261 0 0 0 0.0 0 0.0%
Residential Subtotal 52,489 79,594 14,161,458 178 53,005 65.2%
Non-Residential 2,769 n/a 5,359,285 n/a n/a 20,692 25.5%
Non-Res'l (Tax Exempt) 923 n/a 1,952,074 n/a n/a 7,537 9.3%
Total 56,181 21,472,817 81,234 100.0%
Single Family Unit (SFU) = 259 m2 (2,788 ft2) The single family residential parcels were subdivided into three tiers including:
• Single Family Small, which represents the smallest 10 percent of impervious area, less than or equal to 168 m2;
• Single Family Medium, which represents the middle 80-percentile of impervious area, between 168 m2 and 344 m2; and
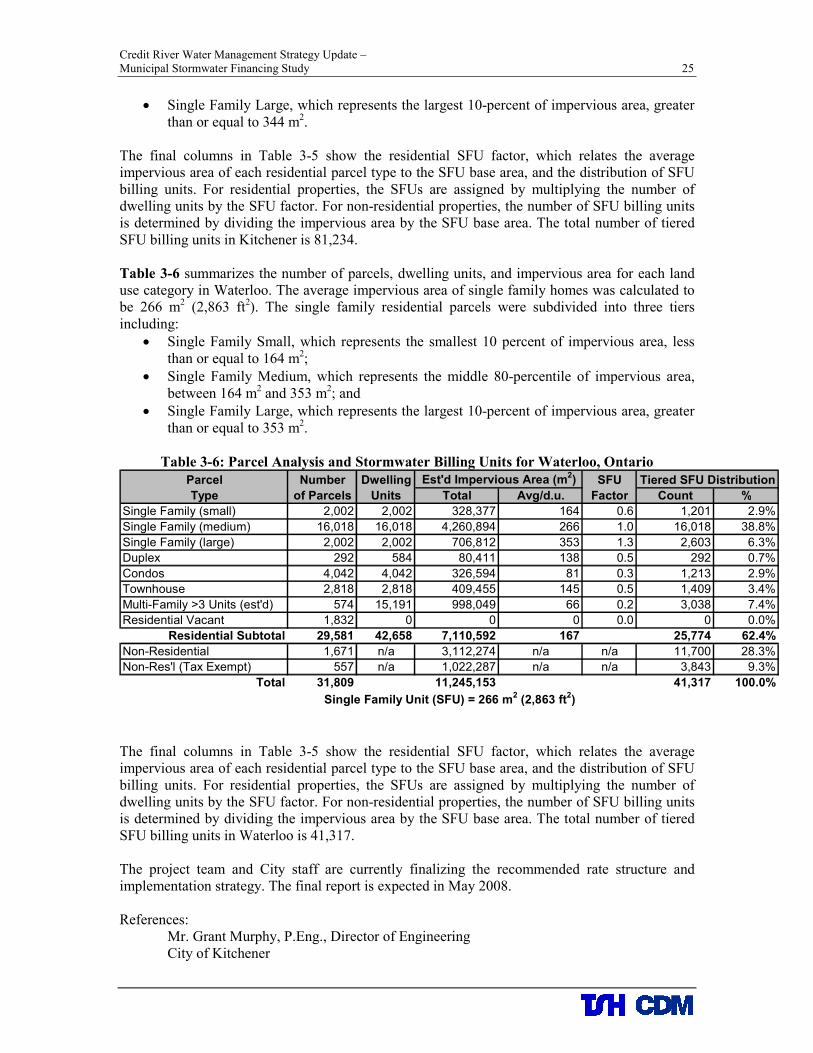
Credit River Water Management Strategy Update – Municipal Stormwater Financing Study 25
• Single Family Large, which represents the largest 10-percent of impervious area, greater than or equal to 344 m2.
The final columns in Table 3-5 show the residential SFU factor, which relates the average impervious area of each residential parcel type to the SFU base area, and the distribution of SFU billing units. For residential properties, the SFUs are assigned by multiplying the number of dwelling units by the SFU factor. For non-residential properties, the number of SFU billing units is determined by dividing the impervious area by the SFU base area. The total number of tiered SFU billing units in Kitchener is 81,234. Table 3-6 summarizes the number of parcels, dwelling units, and impervious area for each land use category in Waterloo. The average impervious area of single family homes was calculated to be 266 m2 (2,863 ft2). The single family residential parcels were subdivided into three tiers including:
• Single Family Small, which represents the smallest 10 percent of impervious area, less than or equal to 164 m2;
• Single Family Medium, which represents the middle 80-percentile of impervious area, between 164 m2 and 353 m2; and
• Single Family Large, which represents the largest 10-percent of impervious area, greater than or equal to 353 m2.
Table 3-6: Parcel Analysis and Stormwater Billing Units for Waterloo, Ontario
Parcel Number Dwelling Est'd Impervious Area (m2) SFU Tiered SFU Distribution
Type of Parcels Units Total Avg/d.u. Factor Count %
Single Family (small) 2,002 2,002 328,377 164 0.6 1,201 2.9%
Single Family (medium) 16,018 16,018 4,260,894 266 1.0 16,018 38.8%
Single Family (large) 2,002 2,002 706,812 353 1.3 2,603 6.3%
Duplex 292 584 80,411 138 0.5 292 0.7%
Condos 4,042 4,042 326,594 81 0.3 1,213 2.9%
Townhouse 2,818 2,818 409,455 145 0.5 1,409 3.4%
Multi-Family >3 Units (est'd) 574 15,191 998,049 66 0.2 3,038 7.4%
Residential Vacant 1,832 0 0 0 0.0 0 0.0%
Residential Subtotal 29,581 42,658 7,110,592 167 25,774 62.4%
Non-Residential 1,671 n/a 3,112,274 n/a n/a 11,700 28.3%
Non-Res'l (Tax Exempt) 557 n/a 1,022,287 n/a n/a 3,843 9.3%
Total 31,809 11,245,153 41,317 100.0%
Single Family Unit (SFU) = 266 m2 (2,863 ft2) The final columns in Table 3-5 show the residential SFU factor, which relates the average impervious area of each residential parcel type to the SFU base area, and the distribution of SFU billing units. For residential properties, the SFUs are assigned by multiplying the number of dwelling units by the SFU factor. For non-residential properties, the number of SFU billing units is determined by dividing the impervious area by the SFU base area. The total number of tiered SFU billing units in Waterloo is 41,317. The project team and City staff are currently finalizing the recommended rate structure and implementation strategy. The final report is expected in May 2008. References:
Mr. Grant Murphy, P.Eng., Director of Engineering City of Kitchener

Credit River Water Management Strategy Update – Municipal Stormwater Financing Study 26
200 King Street West, 9th Floor Kitchener, ON N2G 4G7 Tel: (519) 741-2410
Mr. Sunda Siva, P.Eng., Director of Capital Projects and Services City of Waterloo 265 Lexington Court Waterloo, ON N2J 4A8 Tel: (519) 747-8634
3.5 Stratford, Ontario
The City of Stratford Stormwater Rate Study and Implementation Plan project was initiated in March 2006 to develop and implement an equitable, self-supporting, and dedicated funding source for the City’s stormwater management (SWM) program, including:
• An identification of the City’s SWM program needs and expenditures;
• An evaluation of the appropriate funding mechanisms and resultant customer charges to support these needs; and
• Development of an implementation plan for the recommended funding mechanism. Key project highlights included:
• Kickoff workshop in March 2006 that included presentations, interviews, and related discussion session with key staff from various City departments;
• A series of six facilitated SWAC meetings and one open dialog session were held from June 2006 through December 2006;
• A Public Information Center held at the Kiwanis Centre in September 2006; and
• An Open House at City Hall in March 2007 that featured summary presentations, informational poster boards, and activities targeted to specific groups (i.e., residential taxpayers, non-residential taxpayers, tax-exempt entities).
The City’s existing and future SWM program needs and expenditures were reviewed and evaluated. To accommodate proposed capital expenditures of $30 million for recommended improvement projects, long-term financing options were evaluated with respect to a stormwater rate. A statistical sampling of the impervious area for residential land use categories was performed and all non-residential parcels were individually measured on a parcel-by-parcel basis. The impervious area for each parcel was calculated using computer based measurements from aerial photographs. Based on the parcel analysis, an SFU rate structure was deemed to be appropriate in Stratford. Under this tiered rate policy, all customers are charged a fee based on the total impervious area on each parcel divided by the average area of a single family parcel. Table 3-7 summarizes the revenue units and total units for each land use category. It was estimated that this rate policy will generate approximately 18,481 SFUs in the year 2007. The sample average impervious area for single family parcels was estimated to be 282.5 m2 (3,040 ft2). Further, single family residential parcels were subdivided into three separate categories including:
• Single Family Small, which represents the smallest 10 percent of impervious area, less than or equal to 181.2 m2 (1,950 ft2);

Credit River Water Management Strategy Update – Municipal Stormwater Financing Study 27
• Single Family Medium, which represents the middle 80-percentile of impervious area, between 181.2 m2 (1,950 ft2) and 399.4 m2 (4,300 ft2); and
• Single Family Large, which represents the largest 10-percent of impervious area, greater than or equal to 399.4 m2 (4,300 ft2).
Table 3-7: Parcel Analysis and Stormwater Billing Units for Stratford, Ontario
Parcel Number Residential Est'd Impervious Avg. Impervious Residential Number of Percent of
Type of Parcels Dwelling Units Area (m2) Area (m2) SFU Factor SFU Units Total SFUs
Single Family Small 687 687 124,484 181.2 0.6 440.7 2.38%
Single Family Medium 5,505 5,505 1,554,931 282.5 1.0 5,504.2 29.78%
Single Family Large 687 687 274,388 399.4 1.4 971.3 5.26%
Duplex 409 818 109,259 133.6 0.5 386.8 2.09%
Triplex 54 162 18,365 113.4 0.4 65.0 0.35%
4 Plex 35 140 14,158 101.1 0.4 50.1 0.27%
5 Plex 9 45 4,068 90.4 0.3 14.4 0.08%
6 Plex 11 66 5,892 89.3 0.3 20.9 0.11%
Multi-Family 1,303 3,467 245,464 70.8 0.3 868.9 4.70%
Row Housing 18 207 28,111 135.8 0.5 99.5 0.54%
Condos 485 485 38,121 78.6 0.3 134.9 0.73%
Mobile Homes 1 13 3,669 282.2 1.0 13.0 0.07%
Non-Residential 920 N/A 2,800,000 9,911.5 53.63%
Total 10,124 12,282 5,220,909 18,481.1 100.00%
SFU = 282.5 m2 (3,040 ft
2)
The non-residential customer class made up 9 percent of the total number of developed parcels, but contributed 54 percent of the total impervious area for the City. With long-term financing, the average annual stormwater expense for the City of Stratford was estimated to be $3,348,400 per year over the period from FY 2008 through FY 2012. Based on this, a stormwater rate of $15.73/SFU/month would be required to fully support the City’s annual SWM program expenditures. Recommendations in the final report included implementing a stormwater rate to cover the cost of the City’s non-capital activities (i.e., operations & maintenance, Upper Thames River Conservation Authority levy contribution, and rate implementation costs), representing approximately 16 percent of the City’s proposed SWM program expenditures. Options for funding the capital portion (i.e., 84 percent of the average annual SWM program expenditures) were recommended to be put forth as a referendum to voters, with the following options:
• 100% tax, 0% rate
• 50% tax, 50% rate
• 0% tax, 100% rate Additional recommendations included:
• Reducing property tax support for the City’s SWM program by the corresponding stormwater rate revenue and the amount of reduced property tax support identified should not be used for other City functions.
• An equitable adjustment and credit policy manual should be developed for eligible non-residential property owners and owner’s associations.
• Tax-exempt properties should be funded by a property-tax subsidy in an amount equal to the stormwater rate charge to these properties.
• Public information and outreach during implementation.
• Adoption of a by-law and rate resolution for the stormwater rate.

Credit River Water Management Strategy Update – Municipal Stormwater Financing Study 28
• Definition of the required procedures and responsibilities to carry out the administrative functions of the stormwater rate (e.g., development of accounting procedures to accommodate the rate revenue and track expenditures).
• Implementation of a billing system and data management procedures for the program, in which the stormwater rate charge will be added to Festival Hydro bills.
The final report was submitted in April 2007 and Council deliberations continued from May through October 2007. During these deliberations, the stormwater rate structure was determined under a range of scenarios from 25% rate (and 75% tax) to 100% rate. Initial councilor votes at the Finance Committee level unanimously favored a full stormwater rate, however feedback from business owners in September and October 2007 persuaded councilors to ultimately vote to continue tax-based funding of the City’s SWM program. As a result the project ended in November 2007. Reference:
Mr. Joe Salter, B.Sc. (Hon), Manager of Water Treatment and Distribution City of Stratford 82 Erie Street, 3rd Floor Stratford, ON N5A 2M4 Tel: (519) 271-0250 Ext. 315
3.6 Other Canadian Municipalities
As noted earlier, a number of Canadian municipalities have implemented a stormwater rate and others have investigated alternative financing mechanisms through formal studies. Our team has compiled rate details from many of these municipalities based on our work in Ontario, discussions with municipal staff throughout the country, and recent website research. Table 3-8 summarizes our knowledge of the stormwater rate studies and rate implementations in Canada, as of March 2008. For each municipality, the rate or study type is given along with the status or implementation date, and the basic details. Additional details are provided in the subsections below. Mr. Chris Ward at the City of Edmonton was instrumental in identifying the municipalities in western Canada. He was directly involved in implementing Edmonton’s stormwater rate (known as a Land Drainage Utility) and has participated in several other rate studies in the western provinces. Reference:
Mr. Chris Ward, Director - Drainage Planning City of Edmonton 9803-102 A Avenue Edmonton, AB T5J 3A3 Tel: (780) 496-5567
3.6.1 Town of Aurora, Ontario
The Town of Aurora has had a Storm Sewer Charge in place for a number of years. A flat rate is included as a miscellaneous charge on the Town’s water/wastewater bills for two customer classes. The equivalent rates, effective May 1, 2007, are $3.87 per month for residential users (billed quarterly), and $607 per year for commercial / industrial users regardless of property size

Table 3-8: Summary of Stormwater Rate Studies and Rate Implementations in Canada
Municipality Rate Type Status Details (as of March 2008)
Ontario
Aurora Flat Rate In place at least 3 years Storm Sewer Charge, Res’l $3.87/mo, Comm’l/Ind’l $607/yr.
Kitchener-Waterloo Feasibility Study Ongoing Began stormwater rate feasibility study, July 2005. In progress.
London Flat Rate In place at least 4 years
Storm Drainage Charge, Res’l $9.81/mo, Comm'l high rise $11.84/mo, Inst'l
$9.46/mo; Ind'l $985.09/ha/yr; Ind'l over 600,000 m3 $837.48/ha/yr.
St. Thomas Flat Rate In place at least 3 years Storm Drainage Rate, Res’l $5.54/mo, Comm’l/Ind’l $917/ha/yr.
Stratford Implementation Study
Completed November
2007
Began stormwater rate implementation study, March 2006. Final report
submitted April 2007. Council voted not to implement November 2007.
Manitoba
Winnipeg Have investigated drainage utility, status unknown.
Saskatchewan
Regina Water Use Surcharge
Storm Drainage Rates for all customers are $0.27 per month per 1,000 m3,
with a maximum charge of $8.64 per month.
Saskatoon Flat Rate
Implemented January
2002
All customers pay a monthly charge for stormwater management and
infrastructure upgrades, $7.40/mo (per water meter).
Alberta
Calgary Flat Rate Implemented March 1994
Storm Drainage Upgrade Charge, $5.73/mo to fund capital improvement
projects.
Edmonton Land Drainage Utility
Implemented January
2003
Utility based on intensity of development factor. Typical Res’l = $3.50/mo.
Includes credit policy.
Red Deer Land Drainage Utility or flat rate, not known.
St. Albert Flat Rate
Implemented January
2003
Storm Sewer Utility, bi-monthly billing, Res’l $7.00/mo, Res'l (stacked/ condo)
$4.85; Non-Res'l $19.15.
Strathcona County
Flat Rate (in selected
communities)
Implemented January
2007
Storm Sewer Operations charge, Res’l $1.75/mo and $7.25/mo in two
communities.
British Columbia
Langley Land Drainage Utility Details not known.
Prince George Feasibility Study Recently completed a feasibility study, but decided not to implement.
Richmond Land Drainage Utility Dykes & Drainage Charge, typical Res'l = $6.50/mo.
Vancouver Have investigated drainage utility, status unknown.

Credit River Water Management Strategy Update – Municipal Stormwater Financing Study 30
(billed bi-monthly). These rates decreased from the previous year ($4.62 per month residential, and $674 per year commercial/industrial), the result of a 12 percent increase in the combined water/wastewater rate.
3.6.2 City of London, Ontario
Based on our research and discussion with other municipalities, it appears that the City of London was the first municipality in Ontario to adopt a stormwater rate. A flat rate Storm Drainage Charge is included on the City’s monthly water bill and is described in the City’s current Sewer System Charges By-Law, in force since January 2005. A flat rate stormwater fee had been charged prior to 2005, under a different name and billing structure. The revenue from the Storm Drainage Charge is used to fund the replacement, repair/rehabilitation and capital improvements to the municipal SWM system. There are four customer classes including residential, commercial, industrial, and institutional. Exemptions from the charge have been granted to those properties that are:
• Outside the City’s Urban Growth Boundary
• Serviced by a municipal drain as designated under the Drainage Act.
• Bulk-metered (e.g., duplex, triplex, quad-plex or townhouse), where the individual meters are assessed the Storm Drainage Charge.
• Owned by the Upper Thames River Conservation Authority or the Kettle Creek Conservation Authority.
The current rates, effective January 1, 2008 are $9.81 per month for residential property owners, $11.84 per month (commercial and high rise residential), $9.46 per month (institutional), $985.09 per hectare per year (industrial) and $837.48 per hectare per year (industrial customers whose annual water consumption exceeds 600,000 m3). These rates represent a 9% increase in all categories compared to 2007 rates. 3.6.3 City of St. Thomas, Ontario
St. Thomas is located south of London and has a flat rate Storm Drainage charge similar to London. The local hydro company, St. Thomas Energy Services Inc., collects the monthly water, wastewater and Storm Drainage billings on the City’s behalf. The current rates, effective May 1, 2007 are $5.54 per month for residential properties (and commercial or institutional properties that are less than 1,800 m2 in size), and $917.16 per hectare per year for industrial properties (and commercial or institutional properties that exceed 1,800 m2 in size).
3.6.4 City of Regina, Saskatchewan
The City of Regina finances its SWM program through a Storm Drainage Rate that is based on water usage. A surcharge is applied on the monthly water/wastewater bill that charges $0.27 per month per 1,000 m3 of water, effective January 1, 2008. Customers that exceed 31,000 m3 are charged a flat rate of $8.64 per month.
3.6.5 City of Saskatoon, Saskatchewan
Saskatoon’s Storm Water Management Utility By-law was implemented in January 2002 “to establish and regulate the collection, transmission, treatment and disposal of storm water, and to set terms and guidelines for the storm water management utility”. Current charges are effective

Credit River Water Management Strategy Update – Municipal Stormwater Financing Study 31
January 1, 2008 and are included as an additional item on the City’s monthly water bill. All properties are charged a flat rate, comprised of two components:
• Storm Water Management Charge: $4.40 per water meter per month
• Infrastructure Upgrade Charge: $3.00 per water meter per month 3.6.6 City of Calgary, Alberta
Calgary first implemented a flat rate Storm Drainage Upgrade Charge in March 1994. Currently all properties are charged on their monthly utility bill at a rate of $5.73 per month per water meter. Revenue from the charge is used to fund capital improvement projects, with operations and maintenance costs paid by property taxes. Rates were recently increased from $1.48 per month and capital project costs for SWM facilities have been shared with funds from the Canada-Alberta National Infrastructure Program.
3.6.7 City of Edmonton, Alberta
The City of Edmonton implemented a Land Drainage Utility in January 2003. These charges are included on the City’s monthly utility bill. The current rate, effective January 1, 2008 is $0.017252 per square meter per month and individual properties are charged on the basis of the following calculation: Land Drainage Utility Charge = A × I × R × Rate where, A is the area of the property in square meters. For multiple units sharing a single
building or property, this area is the building lot area attributable to each unit. I is the Intensity of Development Factor. This value is 1.0, except for properties where
owners can demonstrate that they contribute significantly less stormwater runoff per property area to the City’s SWM system than other similarly zoned properties.
R is the runoff coefficient, determined by the City and based on land zoning. The City’s credit policy allows a reduction in the Intensity of Development Factor as noted above, and must be documented in a signed and sealed engineering report along with the completed application form and $250 application fee. Credits are eligible for sites that are located on undeveloped lands, have on-site SWM facilities, or discharge directly to the North Saskatchewan River without using the City’s SWM system. The credit is valid for five years from the date of approval and property owners must grant access to the applicant’s property for the purpose of inspecting SWM facilities. 3.6.8 City of St. Albert, Alberta
The City of St. Albert implemented a Storm Sewer Utility in January 2003. These charges are included on the City’s bi-monthly utility bill. The 2008 billing rates are applied as a flat fee to three property types: $7.00 per month for Residential (single family, duplex, and townhouse) properties, $4.85 per month for Residential (stacked apartment, condominium) properties, and $19.15 per month for Non-residential properties. Tax-exempt properties including public schools, churches, and hospitals are exempted from the Storm Sewer Utility charge. 3.6.9 Strathcona County, Alberta
A Storm Sewer Operations charge is included in Strathcona County’s monthly service fees. The charge is applied to residential property owners in two communities, the hamlets of Sherwood Park and Ardrossan (unincorporated suburbs of Edmonton). Revenue from this fee is used to fund
Credit River Water Management Strategy Update – Municipal Stormwater Financing Study 32
the maintenance of the stormwater facilities and collection system. The 2008 rates are $7.25 per month in Sherwood Park and $1.75 in Ardrossan, 4% and 17% higher than the respective 2007 rates.
3.6.10 City of Richmond, British Columbia Richmond is located in the Metro Vancouver area and has implemented a user fee to finance infrastructure replacement costs for managing drainage and upgrading flood protection works. A Dykes and Drainage charge is included on the City’s annual utility bill and the average cost for a single family home is approximately $6.50 per month. Details on the rate structure and typical charges for other property types are not known.
3.7 Case Study Lessons
This section presents the overall lessons learned and the critical success factors for implementing a stormwater rate. These have been developed from our team’s insight and knowledge gained on over 140 stormwater rate studies and implementation projects throughout North America. 3.7.1 Stormwater Funding Lessons Learned
A common set of lessons learned has been derived for municipal SWM financing in North America, despite the wide variations in terminology and measurement units; climate and hydrologic conditions; laws, cultures and politics. These are itemized as follows:
11. Recognize that one size does not fit all. Each community’s SWM program has unique needs, preferred solutions, organizational structures, staff experience and knowledge, equipment and resources. The way the program is funded is therefore necessarily specific to, and a socio-political reflection of, each community.
12. Collaborate with stakeholders and promote communication. Stakeholders need to be
chosen carefully and representative of all the citizens and property owners who will be paying for the SWM program. There is an optimal range in the number of stakeholders that can foster effective communication, and this varies among financing studies. Too small a number will omit the voice of key interests and too large a number may dilute the message or preclude the opportunity to receive meaningful feedback from key interests. The selection of stakeholder representatives is particularly critical with multi-faceted groups like the local Chamber of Commerce, for example. Ideal representatives would have regular interaction and communication back and forth with their constituents, such as the Executive Director types who regularly rely on staff support to filter messages through a diverse organization and can make fact-based decisions on their behalf (rather than emotion-based decisions on their own). This was a key lesson learned on the Stratford and Kitchener-Waterloo studies, where some Advisory Committee members were either not representative of, or did not effectively communicate with, their constituent groups. Further, the facilitator at stakeholder meetings needs to ensure the facts have been presented and understood, inspire collaborative dialog, and be impartial in the decision making process yet skilled at marshalling divergent opinions toward group consensus.
13. Define the champion and home of the program. The champion or champions of the
funding program can either be a respected community leader, activist, councilor or staff person. The home of the program can refer to the local government (i.e., regional or

Credit River Water Management Strategy Update – Municipal Stormwater Financing Study 33
municipal level) and the department in which the program resides (e.g., Engineering, Finance, or Public Works). In a stormwater rate study, the champion is not necessarily known at the start and this person develops as the facts and figures are understood during the Advisory Committee process. Portraying the details in a concise, consistent and collaborative manner, rather than overbearingly as in a sales pitch, will help to identify this champion.
14. Clearly define the health, safety and welfare benefits. The guiding principles behind the
municipal SWM program should be, first and foremost, the health, safety, and welfare of its residents and business owners. These principles are the basis for water resources legislation at all government levels in North America. SWM facilities are designed to provide health and safety benefits by minimizing threat to life and property damage due to flooding/erosion hazards, providing water quality treatment and environmental enhancements. Welfare, in this context, is the equitable allocation of resources to sustain the SWM program to meet the needs of the community. Of all the public works provided by a municipality, SWM services are often the least understood by members of the community, since storm pipes are underground and out of sight, ponds are presumed to be natural features, and the function of SWM facilities and practices are not easily recognized. As a result, there is little public awareness until the SWM system fails or the design capacity is exceeded. Clearly documenting and defining a municipality’s SWM issues, problems and needs along with the corresponding solutions, services, and expenditures is a necessary step in identifying the optimal funding mechanism.
15. Clearly define the cost of each program element. This directly follows from Item 4,
since the level of service provided by the municipality’s SWM system directly affects the overall program cost. Public trust and confidence can only be gained through a clear and transparent accounting of program costs. Budget forecasts that municipal staff can readily defend stand a much greater chance of acceptance. On the contrary, rule of thumb ballpark estimates and “Miscellaneous” budget line items can reduce credibility.
16. Allocate level of service by geography. This point is related to the benefit and cost
lessons in Items 4 and 5 and is critical where multi-jurisdictional issues are a concern. There are clear differences between SWM facilities and services in an urban versus a rural setting (e.g., curb/gutter with storm sewers versus roadside ditching). This is evident among CVC municipalities, with differences between communities in the north and south portions of the watershed. Even within a rural setting for example, there can be different service costs for operations and maintenance activities and capital projects, depending on topography and vegetation cover. Municipal SWM services usually develop to address the major needs within given geographies and such program nuances should always be understood going into a level of service review or funding study.
17. Pragmatically address inter-jurisdictional issues within watersheds. Continuing on the
discussion in Item 6, political boundaries often present roadblocks to SWM. Often some municipalities will not interact with each other until the stormwater problem becomes significant or a multi-jurisdictional solution is implemented. To pragmatically address stormwater issues means to approach them in a proactive manner by understanding the differences between municipalities before attempting a solution. Forcing a unilateral solution on an inter-jurisdictional problem can undermine the process. Joint initiatives can realize great cost efficiencies in SWM services and capital projects.

Credit River Water Management Strategy Update – Municipal Stormwater Financing Study 34
18. Keep abreast of new legislation and initiatives. It is also important for municipal staff to keep on top of upcoming SWM regulations, funding opportunities, and new technologies to bolster long-term program planning and identify future cost efficiencies in service delivery.
19. Provide clear documentation for customer fees. This item follows the communication
comments in Item 2 and the public trust and transparency comments in Item 5. Regardless of the funding mechanism that is ultimately selected for the municipality, customer relations will be improved when an effort is made to clearly explain any new charges.
20. Establish policies to address private property issues. With an increasing focus on source
or lot-level controls for SWM, it is becoming increasingly important to establish municipal policies to assist in dealing with private property issues. Policies could cover a variety of disciplines and representation from various departments (e.g., Engineering, Financial, and Legal).
3.7.2 Stormwater Rate Implementation Success Factors
The lessons learned in the preceding section apply to all SWM financing mechanisms in general. In addition, there are some critical success factors that apply specifically to the implementation of a stormwater rate based on impervious area. This section highlights five such factors. A structured Public Consultation program is the most important success factor of all and is described in Section 3.7.2.1. One of the biggest perceived challenges to a stormwater rate are the implementation costs, which are described in Section 3.7.2.2. Of particular concern in the CVC watershed are jurisdictional boundary issues, which are described in Section 3.7.2.3. Finally, the implementation of a stormwater rate represents more than a mere reallocation of municipal SWM program costs compared to current property tax based funding, it also supports the overall goals and objectives of many municipalities on three key fronts. That is, the implementation of a stormwater rate:
• Achieves the shared principles of fairness, equity, and sustainability;
• Provides a flexible mechanism to support the current and future needs of the SWM program; and
• Offers financial incentives for property owners to provide on-site controls to reduce stormwater and pollutant loads to the municipal SWM system.
Sections 3.7.2.4 and 3.7.2.5 describe the success factors related to the latter two bullets. 3.7.2.1 Public Consultation Program
In each of the case studies presented earlier, a unique public consultation program was developed to assist the project team with stormwater level of service, affordability, and funding decisions as well as to gauge and develop public understanding and support for study recommendations. A key feature of the public consultation program included the development and facilitation of a Stormwater Advisory Committee (SWAC), whose members represented different segments of the community and brought to the discussion the interests and concerns of each group. The typical SWAC process included facilitating regular monthly meetings, and generally a total of 6-8 meetings were held with each lasting approximately 90 minutes. The initial meetings

Credit River Water Management Strategy Update – Municipal Stormwater Financing Study 35
focussed on highlighting the unique problems and solutions, needs and benefits with an emphasis on fairness and equity. During the latter meetings, members had the opportunity to review and refine the consultant team findings related to the level of service issues and rate structure options. As described in Item 2 of the lessons learned in Section 3.7.1, stakeholders (i.e., SWAC members) need to be chosen carefully and representative of the key ratepayer groups. Although property owners with tax exemptions or substantial tax caps are often opposed to a stormwater rate, their representation on the SWAC is an important consideration. If, during the process, it is felt that messages are not being effectively communicated with specific businesses or groups (e.g., Chamber of Commerce, school boards, ecumenical organizations, etc.), it may be necessary to meet with them individually. Given the typically low profile and level of understanding of the municipal SWM program by the general public, the formation of an advisory committee is a critical undertaking in a stormwater rate. Experience has shown that a successful SWAC process will address the more contentious issues of key stakeholder groups at an early stage and in some cases, the most vocal opponents at the beginning have become the stormwater rate champions by the end and were the ones to make the recommendations to Council on behalf of SWAC. On the contrary, avoiding opponents during the course of the study could result in the rate being defeated during Council deliberations, depending on the tactics of a delegation of those opposed to the rate.
3.7.2.2 Rate Implementation Costs
Common misconceptions of a stormwater rate include significant implementation costs and the need to reorganize the administration structure. A critical success factor is addressing these misconceptions at an early stage in the rate study by presenting factual accounts of the anticipated administration costs. The biggest rate implementation cost items are the rate study, billing and database management (both start-up and ongoing service), and time for staff to review credit applications and new development plans (i.e., for impervious area calculations and new database accounts). Additional costs include municipal staff labor and expenses for Engineering, Legal, and Financial functions during the rate study and ongoing service, as well as indirect overhead. In the three U.S. case studies, each municipality already had customer service agents to handle the ongoing billing costs. Also, no new staff were hired and no restructuring was needed. What did change were the roles and efficiencies of a few existing staff members, usually in the Public Works Department. Their responsibility was broadened from being strictly “drainage” plan review or inspection to being more responsible to good SWM practices. A unique difference in the U.S. is that many municipalities have designated a manager for the National Pollutant Discharge Elimination System (NPDES) program, a person with similar role and responsibilities in administering a stormwater rate. Although a stormwater rate does not generally result in organizational restructuring, it does force a change in financial reporting methods towards better cost accounting. Itemizing specific SWM labor and equipment expenditures is a good business practice and not necessarily a challenge. 3.7.2.3 Jurisdictional Boundaries
The CVC watershed features multiple jurisdictions, with highly urbanized municipalities in the south and largely rural communities in the north. Items 6 and 7 of the lessons learned that were

Credit River Water Management Strategy Update – Municipal Stormwater Financing Study 36
presented in Section 3.7.1 describe jurisdictional boundary issues and addressing these are critical to the success of a stormwater rate implementation. As described in Item 6, different municipalities have developed efficiencies with certain SWM services according to their unique needs and resources within given geographies. Item 7 indicated that joint, multi-jurisdictional initiatives can realize great cost efficiencies in SWM services and capital projects. In some cases, municipalities may operate a joint stormwater rate program. The most successful multi-jurisdictional stormwater rates have evolved from the rates established in individual municipalities. This usually happens after a few years the stormwater rate is in operation when adjoining communities see themselves in a position to achieve operational efficiencies by teaming together (e.g., one municipality does the ditch cleaning, another does GIS, or CCTV, or billing, etc.). The three U.S. case studies involved single jurisdictions initially. With Pittsburg and Middletown there are no large adjoining communities and the county governments are low density/large in size and not interested in teaming. In Memphis, the county government (Shelby County) is in the process of joining the stormwater rate. In other cases, regional governments (e.g., counties) or agencies (e.g., regional sewer districts) may run the stormwater rate program on behalf of its member municipalities. Although not included in the U.S. case studies above, CDM conducted the implementation study for two multi-jurisdictional stormwater rates in Ohio. In Lake County in the northeast, a variable rate structure was instituted to pay for the overall SWM program in which the more rural communities paid a lower rate than the higher density communities who received more stormwater services from the County. In Hamilton County in the southwest, a similar variable rate structure was implemented (only to cover operations and maintenance costs) where less dense communities had a lower base charge.
3.7.2.4 Level of Service Flexibility
A stormwater rate provides a flexible mechanism to support the current and future needs of the SWM program, especially for municipalities that have identified significant increases in revenue requirements to address needed operations and maintenance activities, rehabilitate failing infrastructure, and/or to accelerate capital programs in order to provide the required water quality controls and minimize flooding and erosion hazards. There is a concern however that, by introducing a new funding method and increased revenue requirements at the same time, the new rate may be perceived as the reason for the increased cost to ratepayers. It is therefore critically important to clearly distinguish these as two separate issues, as described in Items 4 and 5 of the lessons learned in Section 3.7.1. Experience has shown that for municipalities who have not clearly identified their future program costs (e.g., minimal master planning activities have been completed), it is best to use the current level of service expenditures as the basis for the initial stormwater rate. That is, the rate initially replaces the current revenue stream and is then slowly ramped up over subsequent years to meet future level of service requirements as the master planning studies are completed and the capital improvement program and operational requirements becomes clearer. If some capital and operational planning has been done, then modest level of service cost increases can be included in the initial implementation of a stormwater rate, or the ramp up period to future level of service expenditures can be reduced. For municipalities that have completed significant capital and operational planning studies, especially those that have gone through a public and political process as was the case in Stratford, the future level of service expenditures can be used as the basis for the initial stormwater rate.

Credit River Water Management Strategy Update – Municipal Stormwater Financing Study 37
3.7.2.5 Property Owner Incentives
A stormwater rate provides incentives for property owners to provide on-site controls that reduce their individual contributions of stormwater runoff and pollutant loading to the municipal SWM system. This is achieved through the adoption of a credit policy, which is described in more detail in Section 4.4 and a sample is given in Appendix B. The goal of a stormwater rate is to institute a uniform charge on a common plane in order to achieve the principles of fairness and equity. Reductions in the base charge would then apply if the property owner does something to benefit the quantity and quality of runoff discharged to the municipal SWM system. One of the biggest implementation challenges of a rate study is in achieving consensus among ratepayers on the credit policy details. For residential properties, a tiered SFU structure can be instituted that charges variable rates depending on impervious area (unlike ERU which is equal for all residential properties). That is, the charge is determined based on whether impervious area is better or worse than the residential average. For non-residential properties, the charge is solely determined based on impervious area. Credits can apply if the property is located in an unusual place (i.e., runoff is not directed to the municipal SWM system). Extra charges can apply in unusual circumstances too (e.g., fertilizer plant located upstream of a lake or SWM pond). In municipalities that have implemented stormwater rates, there is a wide range in the perception of, and attitudes toward, credits. Generally speaking, in areas where stringent water quality standards are enforced and damaging flooding is common (e.g., coastal Florida), a stormwater rate is considered a necessity, not a luxury, and therefore very few credits are given. In other areas where flooding or water quality concerns are not as high a priority, a credit policy usually makes sense and helps to sell the program. Further, credits are typically mandated in a few states (e.g., Colorado, Maryland, Texas, Wisconsin, Virginia). A credit policy has motivated property owners to reduce their impervious cover. Some jurisdictions offer credits to properties that are below defined impervious cover targets (e.g., Beaufort County, SC). Generally, knowledge of the credit system has impacted the way new developments are built, however with existing developments, the main effect is for property owners to reduce their directly-connected impervious area (i.e., removing impervious area reduces the charge more so than an increase in their credit scores). Typical examples include treatment train approaches, such as redirecting parking drainage into vegetated swales that absorb, evaporate runoff and reduce runoff volume and pollutant loading to the outlet. There has been a noticeable relationship between the attractiveness of credits (as determined by the number of credit applications) and the stormwater rate charge. At low rates (e.g., below $3 per billing unit per month) there does not appear to be much interest or motivation to apply for a credit. Ratepayers are generally motivated to take advantage of stormwater rate credits when the rate is high (e.g., above $6 per billing unit per month). It is difficult to quantify the “pay off” to municipalities that adopt a credit policy as part of their rate program. Encouraging source controls supports many municipality’s SWM policies and water quality initiatives and is therefore a benefit from an environmental perspective. Cost payoffs are less apparent and can vary with the density of development. Implementing measures that reduce total runoff volume and pollutant loading discharge to the SWM system will minimize the municipality’s capital expenses. From the property owner’s perspective however, the pay off (i.e., return on their capital investment) will depend on their unique site characteristics.

Credit River Water Management Strategy Update – Municipal Stormwater Financing Study 38
The link between incentive programs and the behavior of property owners is more obvious in the water and wastewater industries, where incentives for people to install water-saving devices have drastically reduced their water consumption and wastewater generation quantities. Credit policies started in the 1970s, first with big industrial users who could achieve significant reductions in water use and thus yield a corresponding reduction in the size requirements for the municipality’s treatment facilities. Incentives for the smaller commercial and residential users came along in the 1980s, and although this reached out to more customers they did not achieve the same water volume reductions as the few, large water users. In comparison, credit policies for stormwater rates are in the early stages of development. Like water and wastewater, incentive programs should target the critical property owners first (i.e., the big industries, shopping malls, business parks, etc.) before addressing the individual single family homeowners. Some communities in Maryland have provided credits for rain barrels, but we are unaware of the impact on the overall SWM program or on rate administration costs. For the numerous though smaller impervious footprint of residential property owners, experience has shown that a bigger overall impact can be achieved through public education on good SWM housekeeping practices than through a credit program for individual homeowners.

Credit River Water Management Strategy Update – Municipal Stormwater Financing Study 39
4.0 INITIAL PROGRAM DEFINITION This section describes the stormwater program needs and corresponding funding program requirements in selected CVC member municipalities. The comparison of funding options in Section 2 identified a stormwater rate as the most fair, equitable and sustainable funding mechanism, because the costs are allocated based on the relative contribution of stormwater runoff and pollutant loading from all properties. As a result, the initial program definition in this section reflects a conceptual stormwater rate analysis to generate sufficient revenue to support the projected program expenditures based on information provided by the municipalities as well as additional projects and activities as part of the CRWMSU recommended implementation plan. 4.1 Stormwater Management Programs in CVC Municipalities
The current and future SWM programs and expenditures of selected CVC member municipalities are summarized in this section. The Town of Orangeville and City of Mississauga were selected in order to represent a cross-section of communities that vary by geography, governance, population, and land use characteristics. Table 4-1 compares population, number of dwelling units, land area, and density among selected CVC municipalities. Private dwellings occupied by usual residents are defined by Statistics Canada as a separate set of living quarters which has a private entrance either directly from outside or from a common hall, lobby, vestibule or stairway leading to the outside, and in which a person or a group of persons live permanently.
Table 4-1: Population, Dwelling and Density Statistics for Selected CVC Municipalities
(Source: Statistics Canada, 2007; Catalogue no. 92-591-XWE; Released March 13, 2007)
Municipality
Population (2006)
Population (2001)
Population Change, 2001-2006
Private Dwellings Occupied by Usual
Residents
Total Land
Area (km2)
Population Density
(per km2)
Town of Orangeville 26,925 25,248 6.6% 9,429 15.6 1,729
City of Mississauga 668,549 612,925 9.1% 214,894 288.5 2,317 Each municipality currently operates, maintains, and manages their SWM system with the goal of keeping the roads and drainage system in an operable condition, minimizing the hazards associated with erosion and flooding, and mitigating the environmental impacts due to stormwater runoff. The components of a typical municipal SWM program can be grouped into the following categories:
• Operation and Maintenance (O&M). Maintaining existing stormwater facilities is a large part of the stormwater budget and includes vital tasks such as inspection, cleaning, repair, and replacement of the various stormwater system components. Precautionary maintenance is performed on a regular basis throughout the system, including such activities as street sweeping, leaf collection, catch basin maintenance, spill prevention, and ditch cleaning. Non-routine services are performed as needed and may include removal of silt, sediment, debris, and/or vegetation. Other SWM programs items that may be included under O&M include response to customer complaints, emergency repair and replacement, emergency response in the event of a spill.
• Capital Projects. Building new facilities to replace aging infrastructure, keep up with growth and development, and to meet new legislative and regulatory requirements is a

Credit River Water Management Strategy Update – Municipal Stormwater Financing Study 40
constant, challenging, and expensive process. In addition to new growth-related capital projects, the capital improvement program could include reconstruction projects that involve work on existing infrastructure and special projects including system rehabilitation, renewal, and/or retrofit projects. Additional capital expenditures could include activities associated with administering the capital program, such as support and overhead items, program development, infrastructure mapping, asset management planning, project management, procurement and contract administration associated with the stormwater system.
• Other. This category includes stormwater related expenditures that are not directly related to the O&M and capital programs. This may include activities related to environmental compliance, intergovernmental payments, or contributions to reserve funds.
After early consideration to include Caledon in the funding program assessment, the decision was made to focus on Orangeville and Mississauga. The following subsections describe the SWM programs in these municipalities. 4.1.1 Town of Orangeville
The Town of Orangeville is located in Dufferin County among the headwaters of the Credit Valley watershed. The majority of the Town is within CVC’s jurisdiction, however a portion lies within the jurisdiction of the Nottawasaga Conservation Authority. Table 4-2 shows the projected SWM program activities and expenditures for Orangeville, which summarizes the efforts needed to achieve desired level of service goals and meet regulatory compliance targets. Actual expenditures are shown for the previous budget year (i.e., Fiscal Year, FY 2006), and the anticipated budget for stormwater expenditures is shown for the next eleven years (FY 2007 through FY 2017). SWM activities are classified into the O&M, Capital Projects, and Other categories as described above. For O&M activities, the Town’s budget activity codes are shown in brackets. For Capital Projects, costs have been taken from the Town’s most recent SWM Development Charges Study. The non-growth share of each project was divided equally between the five years of the forecast and inflated by 2 percent per year for each year beyond 2006. Any expenditures related to Development Charges are not included in this evaluation. An annual inflation rate of 2.5 percent per year was applied for each year beyond 2010. Expenditures listed under the Other category in Table 4-2 include contributions to the lifecycle reserve fund for the stormwater collection system and the payment for the annual levy that is apportioned among CVC member municipalities. The costs shown in Table 4-2 have been estimated and are for illustrative purposes in order to
satisfy the objectives of this study. Further cost details would need to be investigated should the
Town wish to extend the financial analysis beyond the scope of this study. In addition to the expenditure items estimated by Town staff, CRWMSU implementation costs have been incorporated into the analysis beginning in FY 2009. These measures include the items and uptake rates shown in Table 4-3, including:
• Source control measures are designed to reduce runoff, improve water quality and control flows that affect flooding and erosion within urban areas and are generally applied to individual lots (e.g., roof downspout disconnection, porous pavement; soak away pits, parking lots equipped with biofilters and rooftop storage). These measures have been estimated at $1,499,000 over 50 years and have been included as an annualized cost in Table 4-2. Table 7.4.3 of the CRWMSU report (CVC, April 2007) indicates a total source
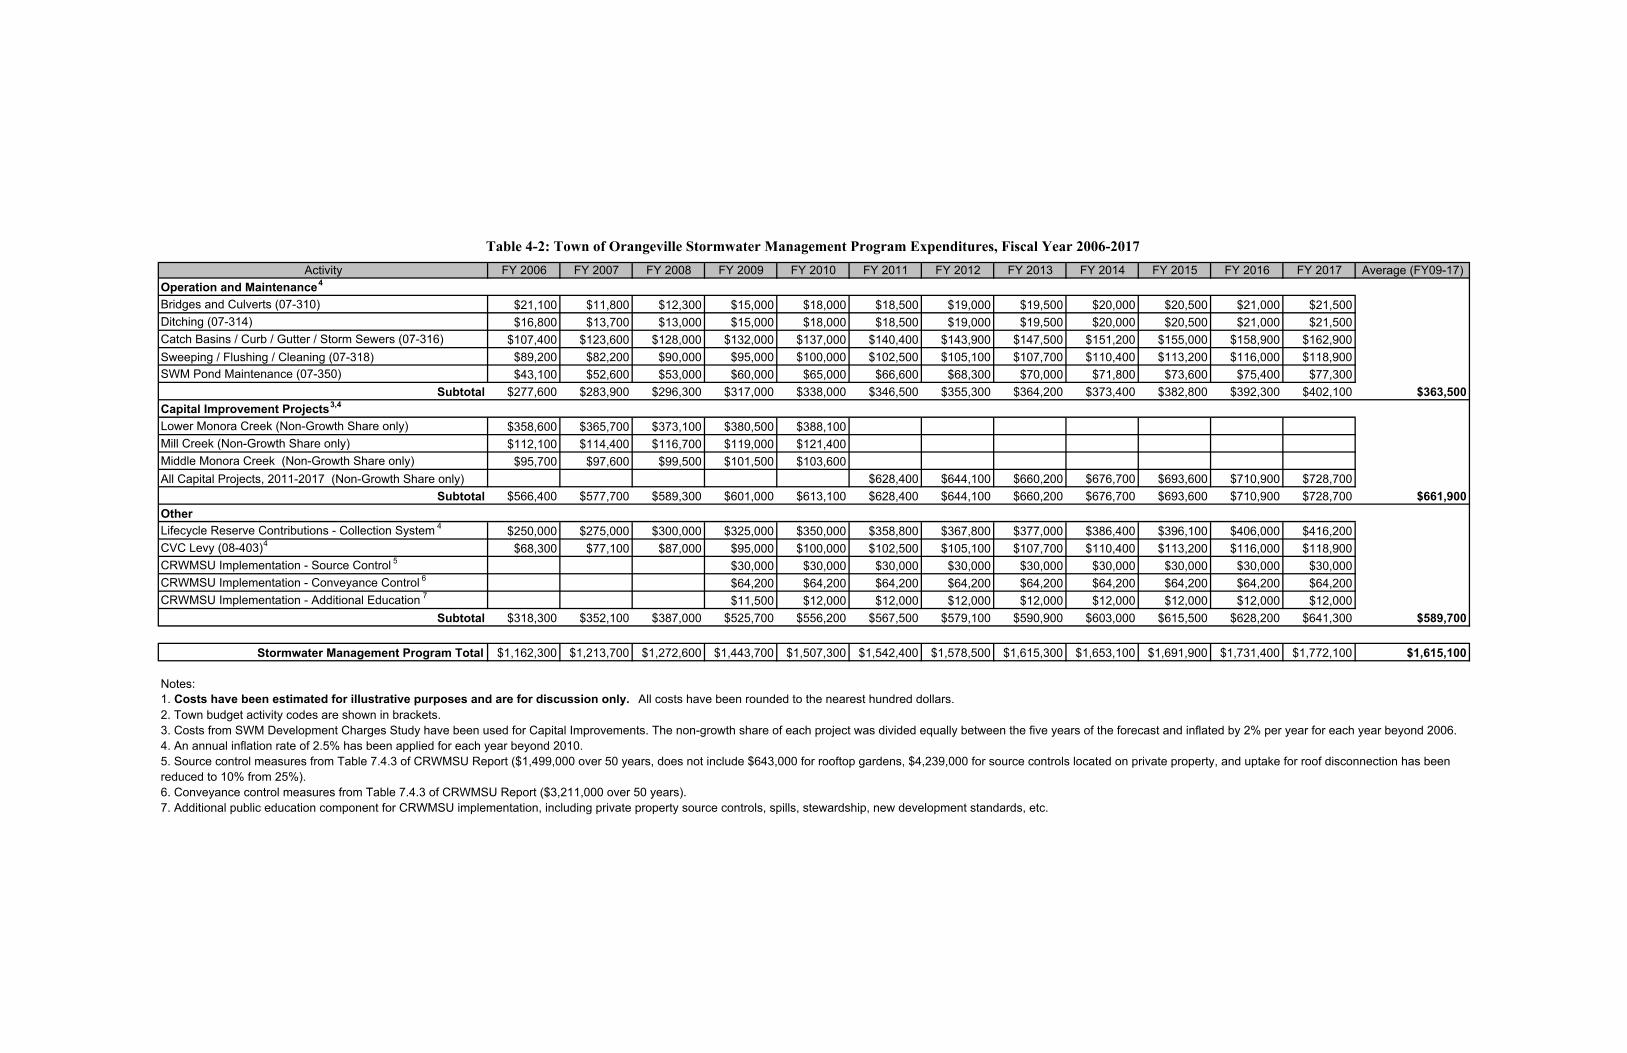
Table 4-2: Town of Orangeville Stormwater Management Program Expenditures, Fiscal Year 2006-2017
Activity FY 2006 FY 2007 FY 2008 FY 2009 FY 2010 FY 2011 FY 2012 FY 2013 FY 2014 FY 2015 FY 2016 FY 2017 Average (FY09-17)
Operation and Maintenance4
Bridges and Culverts (07-310) $21,100 $11,800 $12,300 $15,000 $18,000 $18,500 $19,000 $19,500 $20,000 $20,500 $21,000 $21,500
Ditching (07-314) $16,800 $13,700 $13,000 $15,000 $18,000 $18,500 $19,000 $19,500 $20,000 $20,500 $21,000 $21,500
Catch Basins / Curb / Gutter / Storm Sewers (07-316) $107,400 $123,600 $128,000 $132,000 $137,000 $140,400 $143,900 $147,500 $151,200 $155,000 $158,900 $162,900
Sweeping / Flushing / Cleaning (07-318) $89,200 $82,200 $90,000 $95,000 $100,000 $102,500 $105,100 $107,700 $110,400 $113,200 $116,000 $118,900
SWM Pond Maintenance (07-350) $43,100 $52,600 $53,000 $60,000 $65,000 $66,600 $68,300 $70,000 $71,800 $73,600 $75,400 $77,300
Subtotal $277,600 $283,900 $296,300 $317,000 $338,000 $346,500 $355,300 $364,200 $373,400 $382,800 $392,300 $402,100 $363,500
Capital Improvement Projects3,4
Lower Monora Creek (Non-Growth Share only) $358,600 $365,700 $373,100 $380,500 $388,100
Mill Creek (Non-Growth Share only) $112,100 $114,400 $116,700 $119,000 $121,400
Middle Monora Creek (Non-Growth Share only) $95,700 $97,600 $99,500 $101,500 $103,600
All Capital Projects, 2011-2017 (Non-Growth Share only) $628,400 $644,100 $660,200 $676,700 $693,600 $710,900 $728,700
Subtotal $566,400 $577,700 $589,300 $601,000 $613,100 $628,400 $644,100 $660,200 $676,700 $693,600 $710,900 $728,700 $661,900
Other
Lifecycle Reserve Contributions - Collection System 4$250,000 $275,000 $300,000 $325,000 $350,000 $358,800 $367,800 $377,000 $386,400 $396,100 $406,000 $416,200
CVC Levy (08-403)4 $68,300 $77,100 $87,000 $95,000 $100,000 $102,500 $105,100 $107,700 $110,400 $113,200 $116,000 $118,900
CRWMSU Implementation - Source Control 5 $30,000 $30,000 $30,000 $30,000 $30,000 $30,000 $30,000 $30,000 $30,000
CRWMSU Implementation - Conveyance Control 6 $64,200 $64,200 $64,200 $64,200 $64,200 $64,200 $64,200 $64,200 $64,200
CRWMSU Implementation - Additional Education 7$11,500 $12,000 $12,000 $12,000 $12,000 $12,000 $12,000 $12,000 $12,000
Subtotal $318,300 $352,100 $387,000 $525,700 $556,200 $567,500 $579,100 $590,900 $603,000 $615,500 $628,200 $641,300 $589,700
Stormwater Management Program Total $1,162,300 $1,213,700 $1,272,600 $1,443,700 $1,507,300 $1,542,400 $1,578,500 $1,615,300 $1,653,100 $1,691,900 $1,731,400 $1,772,100 $1,615,100
Notes:
1. Costs have been estimated for illustrative purposes and are for discussion only. All costs have been rounded to the nearest hundred dollars.
2. Town budget activity codes are shown in brackets.
3. Costs from SWM Development Charges Study have been used for Capital Improvements. The non-growth share of each project was divided equally between the five years of the forecast and inflated by 2% per year for each year beyond 2006.
4. An annual inflation rate of 2.5% has been applied for each year beyond 2010.
5. Source control measures from Table 7.4.3 of CRWMSU Report ($1,499,000 over 50 years, does not include $643,000 for rooftop gardens, $4,239,000 for source controls located on private property, and uptake for roof disconnection has been
reduced to 10% from 25%).
6. Conveyance control measures from Table 7.4.3 of CRWMSU Report ($3,211,000 over 50 years).
7. Additional public education component for CRWMSU implementation, including private property source controls, spills, stewardship, new development standards, etc.

Credit River Water Management Strategy Update – Municipal Stormwater Financing Study 42
control cost of $7,347,000, however this study does not include $643,000 for rooftop gardens, $4,239,000 for source controls located on private property, and the adoption rate for roof disconnection has been reduced from 25 percent to 10 percent.
• Conveyance control measures are designed to reduce runoff by encouraging higher levels of infiltration into the ground and are generally applied within the existing collection system (e.g., porous stormwater pipes, grassed swales, and dual-pipe systems where one pipe infiltrates water into the ground through a gravel filter). These measures have been estimated at $3,211,000 over 50 years (see Table 7.4.3 of the CRWMSU Report, April 2007) and have been included as an annualized cost in Table 4-2.
• Additional public education to plan, promote and implement private property source controls, stewardship practices, including landowner and community outreach to build general awareness of environmental issues within the Credit Watershed and inform citizens and business owners on best management practices (BMPs), spill prevention, and new development standards, etc.
Table 4-3: Adoption Rate Targets of CRWMSU Implementation Measures
Measure Applicable Land Uses
Adoption
Rate %
Source Control
Roof Leader Disconnection Residential 25
Rain Barrels Residential 15
Tree Planting Residential 10
Roof Top Gardens Commercial / Industrial 10
Parking Lot Biofilters Commercial / Industrial 10
Conveyance Control
Pervious Pipe System Residential / Commercial / Industrial 50 The total SWM program costs are shown at the bottom of Table 4-2 and the average costs for the period FY 2009 to FY 2017 are given in the rightmost column. An average annual cost of $1,615,100 was used in the conceptual stormwater rate analysis described in Section 4.3.
4.1.2 City of Mississauga
The City of Mississauga is located in Peel Region at the downstream end of the Credit Valley watershed. Watersheds in the eastern half of the city limits are within the jurisdiction of the Toronto Region Conservation Authority (TRCA). Table 4-4 shows the projected SWM program activities and expenditures for Mississauga, which summarizes the efforts needed to achieve desired level of service goals and meet regulatory compliance targets. Actual expenditures are shown for the previous budget year (i.e., Fiscal Year, FY 2006), and the anticipated budget for stormwater expenditures is shown for the next eleven years (FY 2007 through FY 2017). SWM activities are classified into the O&M, Capital Projects, and Other categories as described above. For O&M activities, the City’s detailed budget activities are shown in brackets. Budget forecasts were not available for a number of O&M and environmental compliance activities. In these cases, an annual inflation rate of 2.5 percent was applied for each year beyond 2006. Capital expenditures listed are non-growth items taken from the tax-component of the Capital Works Budget.
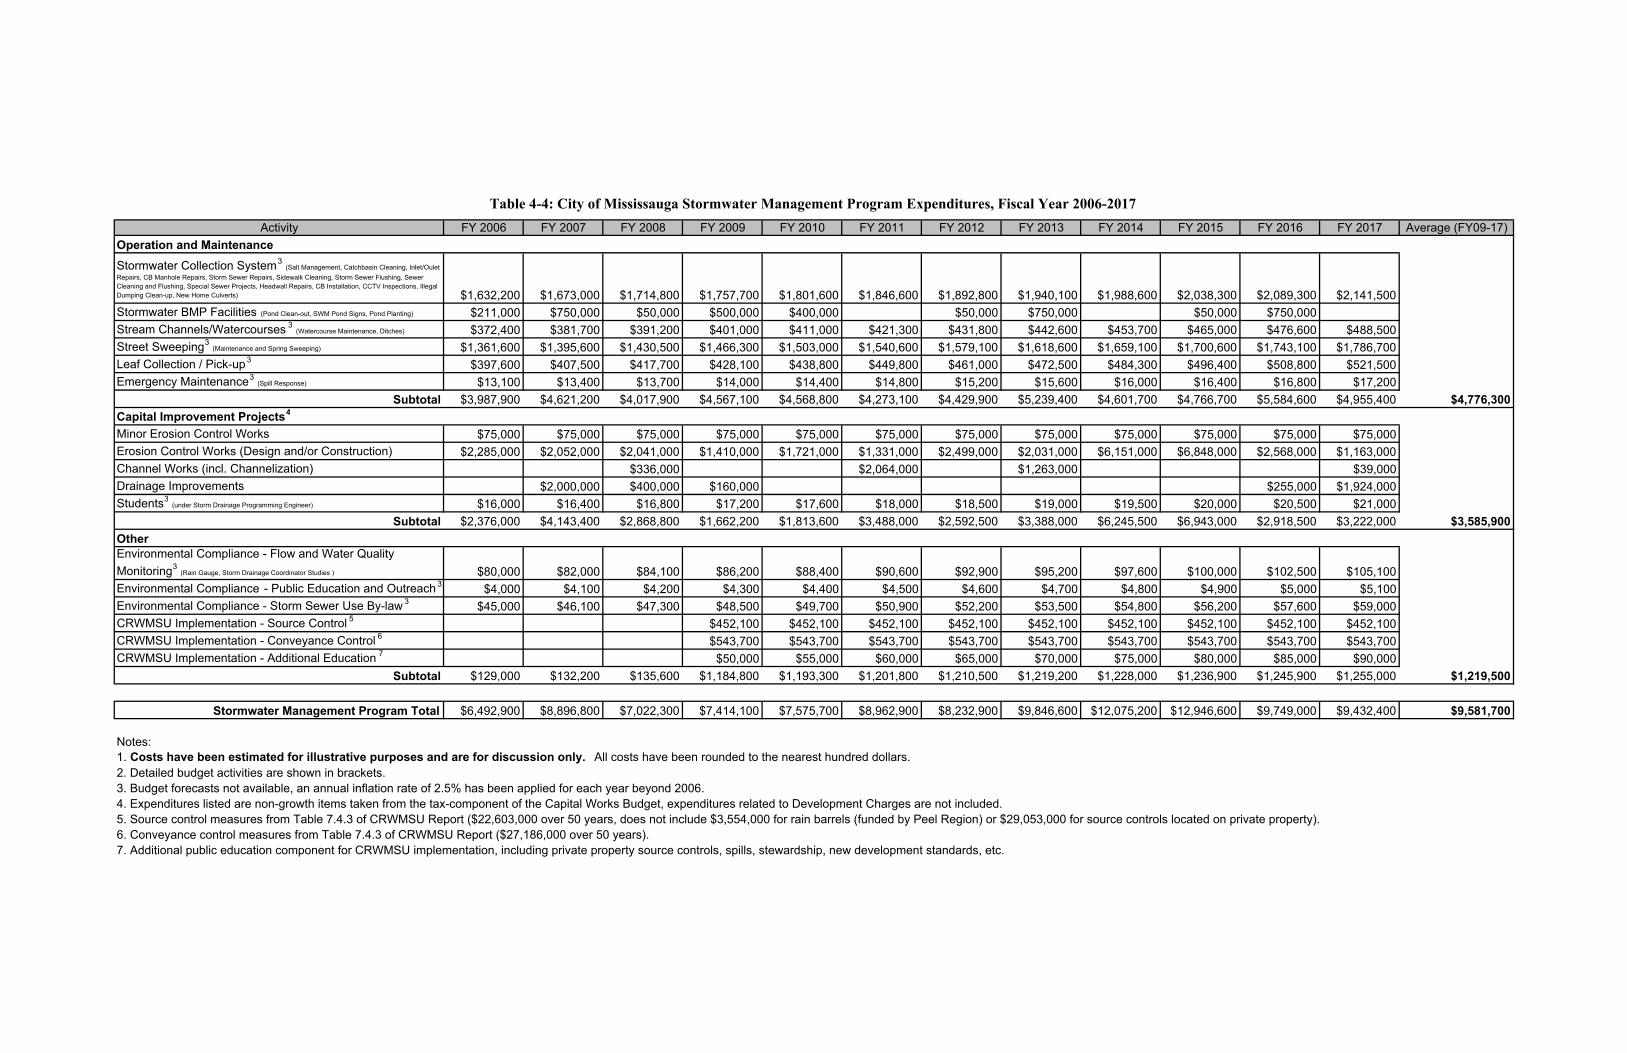
Table 4-4: City of Mississauga Stormwater Management Program Expenditures, Fiscal Year 2006-2017
Activity FY 2006 FY 2007 FY 2008 FY 2009 FY 2010 FY 2011 FY 2012 FY 2013 FY 2014 FY 2015 FY 2016 FY 2017 Average (FY09-17)
Operation and Maintenance
Stormwater Collection System3 (Salt Management, Catchbasin Cleaning, Inlet/Oulet
Repairs, CB Manhole Repairs, Storm Sewer Repairs, Sidewalk Cleaning, Storm Sewer Flushing, Sewer
Cleaning and Flushing, Special Sewer Projects, Headwall Repairs, CB Installation, CCTV Inspections, Illegal
Dumping Clean-up, New Home Culverts) $1,632,200 $1,673,000 $1,714,800 $1,757,700 $1,801,600 $1,846,600 $1,892,800 $1,940,100 $1,988,600 $2,038,300 $2,089,300 $2,141,500
Stormwater BMP Facilities (Pond Clean-out, SWM Pond Signs, Pond Planting) $211,000 $750,000 $50,000 $500,000 $400,000 $50,000 $750,000 $50,000 $750,000
Stream Channels/Watercourses 3 (Watercourse Maintenance, Ditches) $372,400 $381,700 $391,200 $401,000 $411,000 $421,300 $431,800 $442,600 $453,700 $465,000 $476,600 $488,500
Street Sweeping3 (Maintenance and Spring Sweeping) $1,361,600 $1,395,600 $1,430,500 $1,466,300 $1,503,000 $1,540,600 $1,579,100 $1,618,600 $1,659,100 $1,700,600 $1,743,100 $1,786,700
Leaf Collection / Pick-up 3$397,600 $407,500 $417,700 $428,100 $438,800 $449,800 $461,000 $472,500 $484,300 $496,400 $508,800 $521,500
Emergency Maintenance3 (Spill Response) $13,100 $13,400 $13,700 $14,000 $14,400 $14,800 $15,200 $15,600 $16,000 $16,400 $16,800 $17,200
Subtotal $3,987,900 $4,621,200 $4,017,900 $4,567,100 $4,568,800 $4,273,100 $4,429,900 $5,239,400 $4,601,700 $4,766,700 $5,584,600 $4,955,400 $4,776,300
Capital Improvement Projects4
Minor Erosion Control Works $75,000 $75,000 $75,000 $75,000 $75,000 $75,000 $75,000 $75,000 $75,000 $75,000 $75,000 $75,000
Erosion Control Works (Design and/or Construction) $2,285,000 $2,052,000 $2,041,000 $1,410,000 $1,721,000 $1,331,000 $2,499,000 $2,031,000 $6,151,000 $6,848,000 $2,568,000 $1,163,000
Channel Works (incl. Channelization) $336,000 $2,064,000 $1,263,000 $39,000
Drainage Improvements $2,000,000 $400,000 $160,000 $255,000 $1,924,000
Students3 (under Storm Drainage Programming Engineer) $16,000 $16,400 $16,800 $17,200 $17,600 $18,000 $18,500 $19,000 $19,500 $20,000 $20,500 $21,000
Subtotal $2,376,000 $4,143,400 $2,868,800 $1,662,200 $1,813,600 $3,488,000 $2,592,500 $3,388,000 $6,245,500 $6,943,000 $2,918,500 $3,222,000 $3,585,900
Other
Environmental Compliance - Flow and Water Quality
Monitoring3 (Rain Gauge, Storm Drainage Coordinator Studies ) $80,000 $82,000 $84,100 $86,200 $88,400 $90,600 $92,900 $95,200 $97,600 $100,000 $102,500 $105,100
Environmental Compliance - Public Education and Outreach 3$4,000 $4,100 $4,200 $4,300 $4,400 $4,500 $4,600 $4,700 $4,800 $4,900 $5,000 $5,100
Environmental Compliance - Storm Sewer Use By-law 3$45,000 $46,100 $47,300 $48,500 $49,700 $50,900 $52,200 $53,500 $54,800 $56,200 $57,600 $59,000
CRWMSU Implementation - Source Control 5$452,100 $452,100 $452,100 $452,100 $452,100 $452,100 $452,100 $452,100 $452,100
CRWMSU Implementation - Conveyance Control 6$543,700 $543,700 $543,700 $543,700 $543,700 $543,700 $543,700 $543,700 $543,700
CRWMSU Implementation - Additional Education 7$50,000 $55,000 $60,000 $65,000 $70,000 $75,000 $80,000 $85,000 $90,000
Subtotal $129,000 $132,200 $135,600 $1,184,800 $1,193,300 $1,201,800 $1,210,500 $1,219,200 $1,228,000 $1,236,900 $1,245,900 $1,255,000 $1,219,500
Stormwater Management Program Total $6,492,900 $8,896,800 $7,022,300 $7,414,100 $7,575,700 $8,962,900 $8,232,900 $9,846,600 $12,075,200 $12,946,600 $9,749,000 $9,432,400 $9,581,700
Notes:
1. Costs have been estimated for illustrative purposes and are for discussion only. All costs have been rounded to the nearest hundred dollars.
2. Detailed budget activities are shown in brackets.
3. Budget forecasts not available, an annual inflation rate of 2.5% has been applied for each year beyond 2006.
4. Expenditures listed are non-growth items taken from the tax-component of the Capital Works Budget, expenditures related to Development Charges are not included.
5. Source control measures from Table 7.4.3 of CRWMSU Report ($22,603,000 over 50 years, does not include $3,554,000 for rain barrels (funded by Peel Region) or $29,053,000 for source controls located on private property).
6. Conveyance control measures from Table 7.4.3 of CRWMSU Report ($27,186,000 over 50 years).
7. Additional public education component for CRWMSU implementation, including private property source controls, spills, stewardship, new development standards, etc.

Credit River Water Management Strategy Update – Municipal Stormwater Financing Study 44
The costs shown in Table 4-4 have been estimated and are for illustrative purposes in order to
satisfy the objectives of this study. Further cost details would need to be investigated should the
City wish to extend the financial analysis beyond the scope of this study. Any expenditures related to Development Charges are not included in this evaluation. Expenditures listed under the Other category include a number of environmental compliance activities including flow and water quality monitoring, public education and outreach, and enforcement of the City’s storm sewer use by-law. In addition to the expenditure items estimated by City staff, CRWMSU implementation costs have been incorporated into the analysis beginning in FY 2009 and include the following items:
• Source control measures are designed to reduce runoff, improve water quality and control flows that affect flooding and erosion within urban areas and are generally applied to individual lots (e.g., roof downspout disconnection, porous pavement; soak away pits, parking lots equipped with biofilters and rooftop storage). These measures have been estimated at $22,603,000 over 50 years and have been included as an annualized cost in Table 4-4. Table 7.4.3 of the CRWMSU report (CVC, April 2007) indicates a total source control cost of $55,210,000, however this study does not include $3,554,000 for rain barrels (which are funded by Peel Region) or $29,053,000 for source controls that are located on private property.
• Conveyance control measures are designed to reduce runoff by encouraging higher levels of infiltration into the ground and are generally applied within the existing collection system (e.g., porous stormwater pipes, grassed swales, and dual-pipe systems where one pipe infiltrates water into the ground through a gravel filter). These measures have been estimated at $27,186,000 over 50 years (see Table 7.4.3 of the CRWMSU Report, April 2007) and have been included as an annualized cost in Table 4-4.
• Additional public education to plan, promote and implement private property source controls, stewardship practices, including landowner and community outreach to build general awareness of environmental issues within the Credit Watershed and inform citizens and business owners on best management practices (BMPs), spill prevention, and new development standards, etc. These costs are in addition to the City’s environmental compliance budget item.
The total SWM program costs are shown at the bottom of Table 4-4 and the average costs for the period FY 2009 to FY 2017 are given in the rightmost column. An average annual cost of $9,581,700 was used in the conceptual stormwater rate analysis described in Section 4.3.
4.2 Land Use Analysis
This section identifies the impervious area characteristics for the land use categories in the selected CVC member municipalities. This data was used to determine the potential revenue from a stormwater rate as discussed in Section 4.3. 4.2.1 Basis for Rate Policy
A stormwater rate charges its customers a fee according to the runoff generated by the property owned or used. Customer properties are identified and characterized with regard to SWM impact through a parcel analysis. A parcel refers to any contiguous property, lot, or land tract under single ownership. A parcel analysis identifies the characteristics of parcels in a municipality, which in turn determines the stormwater user fee or charge for each property. The total number of

Credit River Water Management Strategy Update – Municipal Stormwater Financing Study 45
the various types of parcels located within a municipality affects how much revenue a stormwater rate can generate. A stormwater rate is a funding alternative developed to allocate an equitable share of the costs associated with SWM to customers who own or use parcels of land within a municipality according to their runoff contribution. A correlation exists between the runoff potential of a parcel and the municipal SWM services provided to the parcel. A history of flood damage is not required for a parcel to be served by a SWM program. Every parcel of land in a municipality contributes runoff to the municipal drainage system and impacts water quality, regardless of the flooding history of a parcel. The runoff must be safely transported by the municipal drainage system to prevent flooding of structures and roadways and must be managed to prevent pollution of surface water bodies and receiving waters. Several factors influence the characteristics of stormwater generated by a particular parcel of land. Parcel size, soil type, topography, impervious area, and development intensity interact to influence the volume of stormwater runoff and pollutant loading from a parcel. An analysis of extreme rainfall events used in stormwater planning and design has shown that the amount of impervious area is the most important parameter affecting the quantity and quality of runoff. Because this value is easily quantified, rate policies developed for stormwater rates typically focus on impervious area for allocating SWM costs to customers. The impervious area of a parcel refers to surfaces covered with material that is highly resistant to the infiltration of water (e.g., building rooftops, paved areas, and compacted gravel). Stormwater rates typically consider the owner or user of a parcel as the beneficiary of municipal SWM services. The parcel owner or user is, therefore, considered the program customer. Defining rate policies and developing rate policy models requires information regarding parcels within a program service area. 4.2.2 Parcel Characteristics
The distribution of parcels and residential dwelling units is shown in Table 4-5 and was based on information provided by CVC member municipalities and data from other sources as described in the footnotes. Residential properties comprise 88% of all parcels in Mississauga, with 12% categorized as non-residential. Parcel data were unavailable for Orangeville. The dwelling unit distributions show very diverse characteristics in the selected CVC member municipalities. Orangeville has a higher proportion of single detached houses whereas Mississauga has a much lower proportion of single detached houses compared to the Ontario average (56%). 4.2.3 Impervious Area Characteristics
Residential impervious area is an important parameter for developing the stormwater rate. Not only are the majority of developed parcels residential, but the conceptual stormwater rate analysis in Section 4.3 uses residential impervious area as the basis for charges to non-residential parcels. In a rate study, a statistical sampling process would be conducted to provide an accurate and defensible estimate for residential impervious area determinations. For the purposes of this study however, impervious area estimates are based on land use assumptions. 4.2.3.1 Town of Orangeville
The impervious area estimates for Orangeville are shown in Table 4-6. The Town provided area and impervious estimates for six land use categories (i.e., residential, industrial, commercial,

Credit River Water Management Strategy Update – Municipal Stormwater Financing Study 46
institutional, parklands, and conservation). These land uses were separated into residential and non-residential categories in Table 4-6. All residential property types were included as a single land use type. Ideally, multiple categories of single and multi-family residential would be useful for refining the average residential impervious area which is the basis for a stormwater rate analysis.
Table 4-5: Parcel Characteristics and Residential Dwelling Unit Distributions Orangeville Mississauga
Parcel Number Percent Dwelling Percent Number Percent Dwelling Percent
Type of Parcels1 of Total Units2 of Total of Parcels3 of Total Units4 of Total
Residential Detached n/a n/a 5,652 60.0% 93,226 63.5% 93,750 41.9%
Residential Semi-Detached n/a n/a 1,168 12.4% 29,091 19.8% 29,230 13.1%
Residential Row Dwellings n/a n/a 942 10.0% 6,056 4.1% 33,390 14.9%
Residential Apartments n/a n/a 1,649 17.5% 528 0.4% 64,740 28.9%
Residential Other Multiples n/a n/a 9 0.1% 189 0.1% 2,610 1.2%
Non-Residential n/a n/a n/a n/a 17,668 12.0% n/a n/a
Total 9,420 100.0% 146,758 223,720 100.0%
Notes:
1. Parcel data not available for Town of Orangeville.
2. Dwelling unit data from Statistics Canada, 2007, document available from
http://www12.statcan.ca/english/census06/data/profiles/community/Index.cfm?Lang=E
3. Total number of parcels within the City of Mississauga. Some properties may have multiple land uses and therefore
may have duplicate parcel counts.
4. Dwelling unit data from Mississauga Development Profile 2006 (Planning and Building Dep't, Nov 2006), document
available from http://www.mississauga.ca/file/COM/2006residential.pdf. Data unavailable for "Residential Other Multiples"
category, dwelling units estimated.
Table 4-6: Summary of Impervious Areas in the Town of Orangeville
Parcel Dwelling Total Est'd Imperv- Est'd Impervious Avg. Impervious
Type Units Area (ha)1 iousness2 Area (m2) Area (m2)
Residential
Residential 9,420 749 33% 2,486,680 264
Non-Residential
Industrial n/a 220 50% 1,095,600
Commercial n/a 150 50% 747,000
Institutional n/a 80 42% 332,000
Parklands n/a 38 9% 34,770
Conservation n/a 281 2% 51,423
Not Included in Rate
Right-of-Way2
n/a n/a 85% 962,727
Total 9,420 1,518 5,710,200
Average Equivalent Residential Unit (ERU) size: 264.0 m2
Notes: 2,841.4 ft2
1. Total area including public right-of-way (ROW).
2. Estimated imperviousness after removing ROW, assumed to represent between 10-20% of the area in each land use
category and is 85% impervious.

Credit River Water Management Strategy Update – Municipal Stormwater Financing Study 47
Public right-of-way (ROW) is not included in the rate calculation as it is considered part of the drainage collection system. During the rare rainfall events in which the minor system capacity is exceeded, runoff is also conveyed through the major system that includes curb and gutter drainage in the ROW and other surface overland flow routes and storage in detention facilities or floodplain areas. The number of dwelling units column is repeated from Table 4-5. The total area column was provided by Town staff and includes the ROW area. The estimated imperviousness represents the percentage of the area that is covered by impervious surfaces. In order to exclude the ROW from the impervious area calculations, the following assumptions were made:
• The imperviousness of ROW areas was 85%;
• The coverage of ROW in residential, industrial, commercial, and institutional areas was 20%; and
• The coverage of ROW in parkland and conservation areas was 10%. The estimated impervious area column shows the total square meters of impervious area in each land use category, excluding the ROW impervious area. This is the sum of the total area and estimated imperviousness columns. The final column divides the residential impervious area by the number of dwelling units to give an estimate of the average Equivalent Residential Unit (ERU) size, which is 264 m2 (2,841 ft2). This value forms the basis for the conceptual stormwater rate analysis and is described in detail in Section 4.3.
4.2.3.2 City of Mississauga
The impervious area estimates for Orangeville are shown in Table 4-7. The City provided area and impervious estimates for twenty-six land use categories. These land uses were separated into residential and non-residential categories in Table 4-7. The number of dwelling units column is repeated from Table 4-5. The total area and estimated imperviousness columns were provided by City staff. The estimated imperviousness represents the percentage of the area that is covered by impervious surfaces. The impervious area in three land use categories has not been included in the evaluation. Vacant lots, public utilities, and public right-of-way (ROW) are not typically included in a stormwater rate. Public ROW is not included in the rate calculation as it is considered part of the drainage collection system. During the rare rainfall events in which the minor system capacity is exceeded, runoff is also conveyed through the major system that includes curb and gutter drainage in the ROW and other surface overland flow routes and storage in detention facilities or floodplain areas. The estimated impervious area column shows the total square meters of impervious area in each land use category and is the sum of the total area and estimated imperviousness columns. The transportation ROW category defined by the City includes private roadways and ROW, which are not considered to be part of the municipal SWM system. It was assumed that 10% of transportation ROW areas was attributed to private roads and the corresponding impervious area was added to the Mixed Retail and Service Commercial / Residential land use category. The final column divides the impervious area by the number of dwelling units for each residential land use category. As expected, the higher density multi-family residential land uses have a lower amount of impervious area per dwelling unit. The calculation at the bottom of Table 4-7 averages the impervious area for all residential categories to give an estimate of the average Equivalent Residential Unit (ERU) size, which is 176 m2 (1,896 ft2). This value forms the basis for the conceptual stormwater rate analysis and is described in detail in Section 4.3.

Credit River Water Management Strategy Update – Municipal Stormwater Financing Study 48
Table 4-7: Summary of Impervious Areas in the City of Mississauga
Parcel Dwelling Total Est'd Imperv- Est'd Impervious Avg. Impervious
Type Units Area (ha) iousness Area (m2) Area (m2)
Residential
Residential Detached 93,750 5,999 45% 26,995,500 288
Residential Semi-Detached 29,230 987 45% 4,441,500 152
Residential Row Dwellings 33,390 842 60% 5,053,450 151
Residential Apartments 64,740 428 60% 2,569,388 40
Residential Other Multiples1 2,610 62 55% 338,966 130
Non-Residential
Not Classified n/a 285 50% 1,424,982
Community / Cultural n/a 134 55% 734,499
Farm n/a 91 10% 91,445
Industrial General n/a 3,454 75% 25,905,314
Industrial and Commercial Multiples n/a 228 75% 1,710,937
Industrial Heavy n/a 664 75% 4,977,233
Office n/a 456 75% 3,417,342
Open Space / Greenbelt n/a 3,173 25% 7,932,162
Public and Municipal Parking n/a 33 90% 294,159
Public / Institutional n/a 2,020 75% 15,150,378
Places of Religious Assembly n/a 126 75% 946,451
General Retail Commercial n/a 1,027 75% 7,700,282
Mixed Retail and Service Commercial / Res'l2 n/a 33 75% 5,364,340
Automotive Service Commercial n/a 148 75% 1,108,020
Other Retail n/a 7 75% 52,312
School n/a 672 60% 4,031,358
Walkways n/a 11 90% 96,324
Other n/a 32 50% 161,560
Not Included in Rate
Vacant n/a 1,882 25% 4,704,594
Utilities / Public Works n/a 665 50% 3,324,121
Transportation Right-of-Way2 n/a 5,687 90% 46,064,778
Total 223,720 29,144 174,591,393
Average Equivalent Residential Unit (ERU) size: 176.1 m2
Notes: 1,895.6 ft2
1. Dwelling unit data unavailable for "Residential Other Multiples" category, dwelling units and average impervious area
estimated.
2. Ten percent of "Transportation Right-of-Way" assumed to be private roads and added to "Mixed Retail and Service
Commercial / Res'l" category.
4.3 Conceptual Stormwater Rate Analysis
The most fundamental requirement of any rate system is equity, which assures that the benefits received are consistent with the fair share of the municipal SWM program cost. In the case of a stormwater rate, the primary benefits are measured in terms of reduced flooding and enhanced water quality throughout the area served by the SWM program. Inevitably, additional direct benefits are received by some individuals as a result of reduced flooding and increased property values, but the primary purpose of a SWM program is to provide community-wide control and management of stormwater. Equity is achieved by basing the stormwater rate on the user’s impervious area, which is directly related to runoff contribution, independent of the location of actual runoff.

Credit River Water Management Strategy Update – Municipal Stormwater Financing Study 49
Based on experience gained in previous stormwater rate studies prepared by the consultant team, the most convenient and equitable unit for establishing a stormwater rate is based on a residential billing unit. A residential billing unit is defined as the average impervious area of residential dwelling units. This includes patios, driveways, sheds, etc., which are associated with a residence in addition to the impervious area of the dwelling structure. A residential billing unit is often chosen for the stormwater rate because it describes the largest group of customers and generally represents a uniform runoff potential compared to non-residential properties. Therefore, this group provides a base for establishing the relative runoff potential for all other property and simplifies rate administration. The residential unit approach is consistent with other types of user fees in that the fee is based on the rate of use (potable water) or generation rate (solid waste), but the rate is independent of the user’s distance from the facility providing the service. In most cases, there is a base rate (i.e., 6,000 gallons/month; two 30-gallon cans per pickup, etc.) for all residential customers, and another rate structure for non-residential users. The base rate reflects the need to balance complete equity with the administrative cost of billing for the service provided. Typically, this balance is achieved by a rate structure that distinguishes between major differences in use (or generation), but simplifies administrative costs by establishing a series of user classes. 4.3.1 Stormwater Billing Units
There are a number of rate policies that have been developed for allocating the cost of a municipal SWM program based on a different definition of the residential billing unit. In this study, the Equivalent Residential Unit (ERU) was selected for its ease of use and given the many assumptions in estimated impervious areas. The ERU rate policy uses the average impervious area from all residential parcels and the stormwater billing units would be referred to as “ERUs”. As described in Section 4.2, the ERU base area values for CVC member municipalities are:
• Orangeville: 264 m2/ERU
• Mississauga: 176 m2/ERU The range in values highlights the difference in dwelling densities with the lower Mississauga value characteristic of high density residential dwellings, and Orangeville more representative of low density. The Florida Stormwater Association (FSA) published results of a stormwater rate survey of 115 Florida municipalities (counties and cities) in November 2007. An analysis of these results indicated the typical range of billing unit base areas to be between 150 and 320 m2 (1,600 to 3,400 ft2), with a typical average of 230 m2 (2,500 ft2). These values can also be compared to those determined in recent stormwater rate studies conducted by the consultant team in other southern Ontario municipalities, namely:
• Kitchener: 178 m2/ERU
• Stratford: 196 m2/ERU
• Waterloo: 167 m2/ERU Under the ERU rate policy, all residential properties would be charged one equivalent residential unit (1 ERU) per dwelling unit. Non-residential customers would be charged according to their total impervious area divided by the corresponding ERU size. The stormwater billing unit calculations for CVC member municipalities are developed in the following subsections.

Credit River Water Management Strategy Update – Municipal Stormwater Financing Study 50
4.3.1.1 Town of Orangeville
The ERU calculations for Orangeville are tabulated in Table 4-8. The first four columns are repeated from Table 4-6. By definition, the number of ERUs for all residential properties is equal to the number of dwelling units. For non-residential properties, the number of ERUs is determined by dividing the estimated impervious area by the corresponding ERU size, which has been estimated to be 264 m2 in Orangeville. The final column in the table shows the percentage of stormwater billing units in each land use category. As shown in Table 4-8, there are an estimated 18,000 stormwater billing units in Orangeville.
Table 4-8: Summary of Stormwater Billing Units in the Town of Orangeville
Parcel Dwelling Est'd Impervious Avg. Impervious Number of Percent of
Type Units Area (m2) Area (m2) ERUs Total ERUs
Residential
Residential 9,420 2,486,680 264 9,420 52.4%
Non-Residential
Industrial n/a 1,095,600 4,150 23.1%
Commercial n/a 747,000 2,830 15.7%
Institutional n/a 332,000 1,258 7.0%
Parklands n/a 34,770 132 0.7%
Conservation n/a 51,423 195 1.1%
Not Included in Rate
Right-of-Way2 n/a 962,727 0 0.0%
Total 9,420 5,710,200 17,984 100.0%
Average Equivalent Residential Unit (ERU) size: 264.0 m2
2,841.4 ft2
4.3.1.2 City of Mississauga
The ERU calculations for Mississauga are tabulated in Table 4-9. The first four columns are repeated from Table 4-7. By definition, the number of ERUs for all residential properties is equal to the number of dwelling units. For non-residential properties, the number of ERUs is determined by dividing the estimated impervious area by the corresponding ERU size, which has been estimated to be 176 m2 in Mississauga. The final column in the table shows the percentage of stormwater billing units in each land use category. As shown in Table 4-9, there are an estimated 684,000 stormwater billing units in Orangeville.
4.3.2 Revenue Potential
The calculation of the number of stormwater billing units in a municipality allows a determination of the annual revenue that could potentially be generated by a stormwater rate.
4.3.2.1 Town of Orangeville
The projection of potential stormwater rate revenue for Orangeville is shown in Table 4-10. This analysis considers revenue over the period from FY 2009 (i.e., the earliest year in which a rate could be implemented) through FY 2017 (i.e., the last year of the Town’s estimated revenue requirements shown in Table 4-2).

Credit River Water Management Strategy Update – Municipal Stormwater Financing Study 51
Table 4-9: Summary of Stormwater Billing Units in the City of Mississauga
Parcel Dwelling Est'd Impervious Avg. Impervious Number of Percent of
Type Units Area (m2) Area (m2) ERUs Total ERUs
Residential
Residential Detached 93,750 26,995,500 288 93,750 13.7%
Residential Semi-Detached 29,230 4,441,500 152 29,230 4.3%
Residential Row Dwellings 33,390 5,053,450 151 33,390 4.9%
Residential Apartments 64,740 2,569,388 40 64,740 9.5%
Residential Other Multiples1 2,610 338,966 130 2,610 0.4%
Non-Residential
Not Classified n/a 1,424,982 8,092 1.2%
Community / Cultural n/a 734,499 4,171 0.6%
Farm n/a 91,445 519 0.1%
Industrial General n/a 25,905,314 147,099 21.5%
Industrial and Commercial Multiples n/a 1,710,937 9,715 1.4%
Industrial Heavy n/a 4,977,233 28,262 4.1%
Office n/a 3,417,342 19,405 2.8%
Open Space / Greenbelt n/a 7,932,162 45,042 6.6%
Public and Municipal Parking n/a 294,159 1,670 0.2%
Public / Institutional n/a 15,150,378 86,029 12.6%
Places of Religious Assembly n/a 946,451 5,374 0.8%
General Retail Commercial n/a 7,700,282 43,725 6.4%
Mixed Retail and Service Commercial / Res'l2 n/a 5,364,340 30,461 4.5%
Automotive Service Commercial n/a 1,108,020 6,292 0.9%
Other Retail n/a 52,312 297 0.0%
School n/a 4,031,358 22,891 3.3%
Walkways n/a 96,324 547 0.1%
Other n/a 161,560 917 0.1%
Not Included in Rate
Vacant n/a 4,704,594 0 0.0%
Utilities / Public Works n/a 3,324,121 0 0.0%
Transportation Right-of-Way2 n/a 46,064,778 0 0.0%
Total 223,720 174,591,393 684,229 100.0%
Average Equivalent Residential Unit (ERU) size: 176.1 m2
1,895.6 ft2
As determined in Section 4.3.1.1, there are an estimated 18,000 stormwater billing units in Orangeville. Assuming an annual growth rate of 0.5 percent per year results in an average of 18,364 ERUs over the period of FY 2009 through FY 2017, as shown in the top part of Table 4-10. The bottom part of Table 4-10 shows the revenue scenarios for various monthly rates, ranging from $4 to $10/ERU/month. It is assumed that 5 percent of the potential revenue would go uncollected due to adjustments or credits, errors in billing, or delinquent accounts. Every dollar per ERU per month in Orangeville would generate $209,350 of annual revenue. By comparing the Town’s average annual revenue requirements in Table 4-2 with the values in Table 4-10, it is estimated that an appropriate stormwater rate charge for Orangeville would be between $7.50 and $8.00/ERU/month.

Table 4-10: Potential Rate Revenue in the Town of Orangeville
FY 2009 FY 2010 FY 2011 FY 2012 FY 2013 FY 2014 FY 2015 FY 2016 FY 2017 FY 2009-2017 Avg.
18,000 18,090 18,180 18,271 18,363 18,455 18,547 18,640 18,733 18,364
$4.00 $820,800 $824,900 $829,000 $833,200 $837,300 $841,500 $845,700 $850,000 $854,200 $837,400
$5.00 $1,026,000 $1,031,100 $1,036,300 $1,041,500 $1,046,700 $1,051,900 $1,057,200 $1,062,500 $1,067,800 $1,046,800
$6.00 $1,231,200 $1,237,400 $1,243,500 $1,249,800 $1,256,000 $1,262,300 $1,268,600 $1,274,900 $1,281,300 $1,256,100
$7.00 $1,436,400 $1,443,600 $1,450,800 $1,458,100 $1,465,300 $1,472,700 $1,480,000 $1,487,400 $1,494,900 $1,465,500
$8.00 $1,641,600 $1,649,800 $1,658,100 $1,666,300 $1,674,700 $1,683,100 $1,691,500 $1,699,900 $1,708,400 $1,674,800
$9.00 $1,846,800 $1,856,000 $1,865,300 $1,874,600 $1,884,000 $1,893,400 $1,902,900 $1,912,400 $1,922,000 $1,884,200
$10.00 $2,052,000 $2,062,300 $2,072,600 $2,082,900 $2,093,300 $2,103,800 $2,114,300 $2,124,900 $2,135,500 $2,093,500
Notes:
1. Assumes a 0.5% annual growth rate
2. Assumes a 95% collection rate
Table 4-11: Potential Rate Revenue in the City of Mississauga
FY 2009 FY 2010 FY 2011 FY 2012 FY 2013 FY 2014 FY 2015 FY 2016 FY 2017 FY 2009-2017 Avg.
684,000 687,420 690,857 694,311 697,783 701,272 704,778 708,302 711,844 697,841
$0.50 $3,898,800 $3,918,300 $3,937,900 $3,957,600 $3,977,400 $3,997,200 $4,017,200 $4,037,300 $4,057,500 $3,977,700
$1.00 $7,797,600 $7,836,600 $7,875,800 $7,915,100 $7,954,700 $7,994,500 $8,034,500 $8,074,600 $8,115,000 $7,955,400
$1.50 $11,696,400 $11,754,900 $11,813,700 $11,872,700 $11,932,100 $11,991,700 $12,051,700 $12,112,000 $12,172,500 $11,933,100
$2.00 $15,595,200 $15,673,200 $15,751,500 $15,830,300 $15,909,500 $15,989,000 $16,068,900 $16,149,300 $16,230,000 $15,910,800
$2.50 $19,494,000 $19,591,500 $19,689,400 $19,787,900 $19,886,800 $19,986,200 $20,086,200 $20,186,600 $20,287,500 $19,888,500
$3.00 $23,392,800 $23,509,800 $23,627,300 $23,745,400 $23,864,200 $23,983,500 $24,103,400 $24,223,900 $24,345,100 $23,866,200
$3.50 $27,291,600 $27,428,100 $27,565,200 $27,703,000 $27,841,500 $27,980,700 $28,120,700 $28,261,300 $28,402,600 $27,843,900
Notes:
1. Assumes a 0.5% annual growth rate
2. Assumes a 95% collection rate
FY:
ERU Billing Units1:
Monthly Rate2
($ per ERU per
Month)
FY:
ERU Billing Units1:
Monthly Rate2
($ per ERU per
Month)
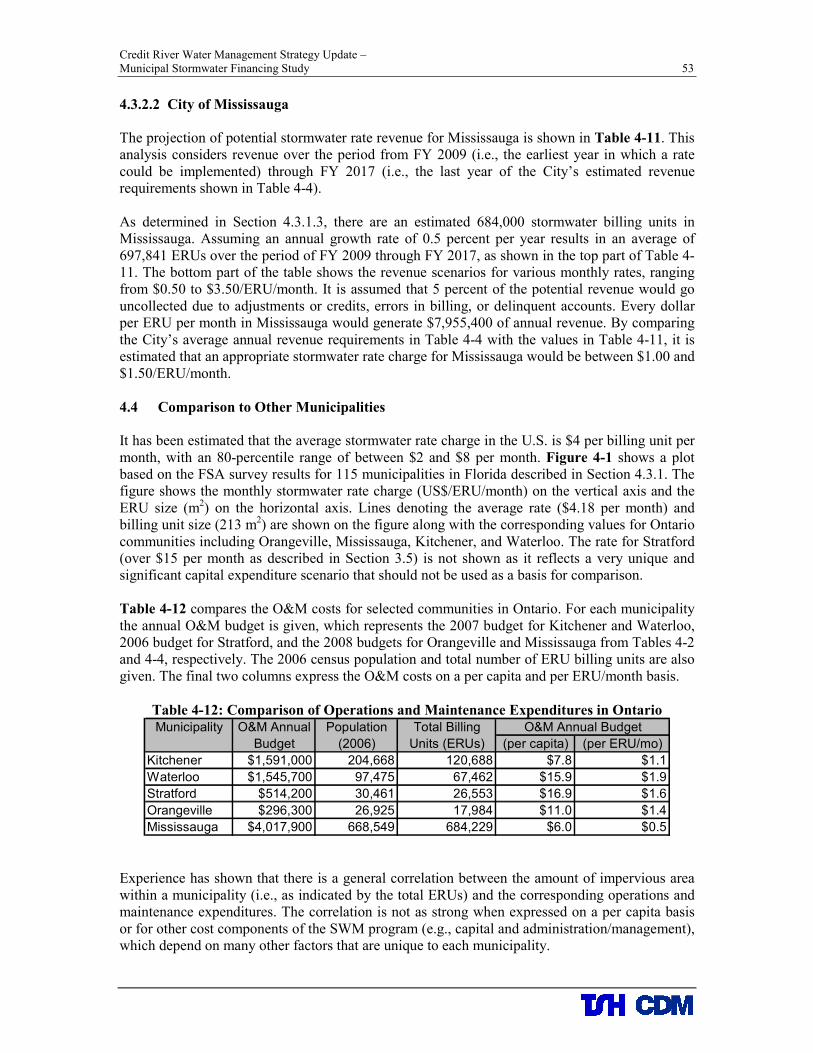
Credit River Water Management Strategy Update – Municipal Stormwater Financing Study 53
4.3.2.2 City of Mississauga
The projection of potential stormwater rate revenue for Mississauga is shown in Table 4-11. This analysis considers revenue over the period from FY 2009 (i.e., the earliest year in which a rate could be implemented) through FY 2017 (i.e., the last year of the City’s estimated revenue requirements shown in Table 4-4). As determined in Section 4.3.1.3, there are an estimated 684,000 stormwater billing units in Mississauga. Assuming an annual growth rate of 0.5 percent per year results in an average of 697,841 ERUs over the period of FY 2009 through FY 2017, as shown in the top part of Table 4-11. The bottom part of the table shows the revenue scenarios for various monthly rates, ranging from $0.50 to $3.50/ERU/month. It is assumed that 5 percent of the potential revenue would go uncollected due to adjustments or credits, errors in billing, or delinquent accounts. Every dollar per ERU per month in Mississauga would generate $7,955,400 of annual revenue. By comparing the City’s average annual revenue requirements in Table 4-4 with the values in Table 4-11, it is estimated that an appropriate stormwater rate charge for Mississauga would be between $1.00 and $1.50/ERU/month. 4.4 Comparison to Other Municipalities
It has been estimated that the average stormwater rate charge in the U.S. is $4 per billing unit per month, with an 80-percentile range of between $2 and $8 per month. Figure 4-1 shows a plot based on the FSA survey results for 115 municipalities in Florida described in Section 4.3.1. The figure shows the monthly stormwater rate charge (US$/ERU/month) on the vertical axis and the ERU size (m2) on the horizontal axis. Lines denoting the average rate ($4.18 per month) and billing unit size (213 m2) are shown on the figure along with the corresponding values for Ontario communities including Orangeville, Mississauga, Kitchener, and Waterloo. The rate for Stratford (over $15 per month as described in Section 3.5) is not shown as it reflects a very unique and significant capital expenditure scenario that should not be used as a basis for comparison. Table 4-12 compares the O&M costs for selected communities in Ontario. For each municipality the annual O&M budget is given, which represents the 2007 budget for Kitchener and Waterloo, 2006 budget for Stratford, and the 2008 budgets for Orangeville and Mississauga from Tables 4-2 and 4-4, respectively. The 2006 census population and total number of ERU billing units are also given. The final two columns express the O&M costs on a per capita and per ERU/month basis.
Table 4-12: Comparison of Operations and Maintenance Expenditures in Ontario
Municipality O&M Annual Population Total Billing O&M Annual Budget
Budget (2006) Units (ERUs) (per capita) (per ERU/mo)
Kitchener $1,591,000 204,668 120,688 $7.8 $1.1
Waterloo $1,545,700 97,475 67,462 $15.9 $1.9
Stratford $514,200 30,461 26,553 $16.9 $1.6
Orangeville $296,300 26,925 17,984 $11.0 $1.4
Mississauga $4,017,900 668,549 684,229 $6.0 $0.5 Experience has shown that there is a general correlation between the amount of impervious area within a municipality (i.e., as indicated by the total ERUs) and the corresponding operations and maintenance expenditures. The correlation is not as strong when expressed on a per capita basis or for other cost components of the SWM program (e.g., capital and administration/management), which depend on many other factors that are unique to each municipality.

Figure 4-1: Comparison of Monthly Rate Charge and Base Area Size
$0
$1
$2
$3
$4
$5
$6
$7
$8
$9
$10
$11
0 50 100 150 200 250 300 350 400 450 500
ERU Size (sq. m.)
$/E
RU
/mo
nth
Florida (2007 survey of 115 rate programs) Orangeville Mississauga Kitchener Waterloo
FL Avg Rate = $4.18/mo.
FL Avg Size = 213 sq.m.

Credit River Water Management Strategy Update – Municipal Stormwater Financing Study 55
The average O&M expenditures for municipalities in the U.S. that have implemented a stormwater rate typically range between $2-3 per ERU/month. Although a much smaller sample size, the average value in Table 4-12 is $1.5 per ERU/month. The lower Ontario values could be explained somewhat by differences in accounting practices. In the other studies, municipalities have generally included their total annual fleet and rolling stock costs (e.g., equipment replacement, regular maintenance, fuel costs, etc.) and stormwater costs from other departments (e.g., non-dedicated crews & equipment borrowed from sanitary sewer crews, etc.). Based on the results in Table 4-12, there is a noticeable discrepancy with Mississauga’s O&M program when compared with these benchmark costs (i.e., $0.5 per ERU/month), which is a third of the average of the other four Ontario municipalities . Kitchener is also low by comparison, but City staff acknowledged they have not had adequate funding to keep up with necessary maintenance activities (and one of the main reasons they decided to investigate a stormwater rate). When notified of this discrepancy, City of Mississauga staff indicated they are confident that O&M costs have included estimates of fleet and rolling stock costs, and acknowledge they consider themselves to be “frugal” with their maintenance budget. The Mississauga budget estimate does not account for senior management and administrative salaries. However, based on experience with indirect overhead costs for SWM, it is felt that accounting for senior management/admin salaries would only result in a 10-15 percent increase in the total O&M program costs. 4.5 Basis for Credit Policy
Municipal SWM systems have been constructed and maintained for the health and safety of the community and therefore their proper operation, maintenance and management is a critical responsibility. Each resident and business owner has an obligation to pay for an equitable share of the upkeep and administration of the system. The costs for replacement/renewal of deficient portions of the system are also the responsibility of the municipality. Credits, if awarded, should be based on the avoided cost to the municipal SWM program. In any instance, the method of awarding credits should be handled on a case-by-case basis. Adjustments should result only from direct savings to the municipality’s SWM program. It is common for the municipality or regulatory authorities to require developers to install Best Management Practices (BMPs). The fact that SWM systems are constructed in fulfillment of the municipality’s or agencies’ regulatory requirements is not sufficient justification for granting credits or adjustments, nor does it preclude the developer from paying the stormwater rate. Adjustments should be considered only if the system constructed allows the municipality to:
• Perform maintenance less frequently;
• Avoid construction of an identified capital improvement project; and
• Eliminate municipal expenditures for certain functions. In order to have a firm technical basis, the stormwater rate credits must be related to the benefits achieved by the private SWM facility that is the basis for the reduction. The municipality’s SWM program costs can be subdivided into two general categories:
• Program costs which have localized or “local” benefits; and
• Program costs which have “system-wide” benefits. Typically, SWM facilities for urban development projects provide primarily localized benefits. For example, because stormwater detention basins for development projects control a relatively

Credit River Water Management Strategy Update – Municipal Stormwater Financing Study 56
small percentage of the watershed, its benefits are typically limited to stream systems immediately downstream of the development site. Since it is unlikely that privately maintained SWM facilities significantly reduce the municipality’s system-wide costs, it is appropriate to express the benefits of these facilities in terms of potential reductions in the “local” SWM program costs. Therefore, the recommended approach to establishing a technical basis for the municipality’s credit policy is to base the “maximum total credit” (i.e., maximum stormwater rate reduction) on the total percentage of SWM program costs which provide “local” benefits. Likewise, the breakdown of the maximum total credit percentage between “peak flow control” and “water quality control” can be based upon the percentage of SWM program costs allocated to each of those functions. The credit factors require evaluation of the programmatic budgets for a reasonable period of time to reflect overall costs. Based on the consultant’s experience in similar jurisdictions, an initial set of credit values is suggested which add to a maximum of 50 percent credit. Upon the initial years of the stormwater rate it is advisable to further adjust such values to reflect the overall costs and benefits perceived by the municipality.
Appendix B includes various stormwater rate credit examples and shows sample calculations for properties that could receive credit. The specific credit and adjustment policy manual would be developed during the implementation phase of a stormwater rate study.

Credit River Water Management Strategy Update – Municipal Stormwater Financing Study 57
5.0 CONCLUSIONS AND RECOMMENDATIONS In this section, an overview summary of the funding options is given along with the study conclusions and recommendations related to stormwater financing for CVC municipalities. 5.1 Funding Option Overview
As directed by the CRWMSU steering committee, the goal of this study is to inform senior managers of the various funding mechanisms available to municipalities to support their SWM programs. This study is not meant to recommend a funding option for every municipality, but rather to provide a “toolkit” for municipalities to decide which options are the most appropriate to suit their individual needs and resources in supporting the implementation of CRWMSU recommendations. There is no single funding option presented in this report that is ideal for all CVC member municipalities. Further, the funding options can be blended (e.g., 50% stormwater rate, 50% dedicated tax levy). The funding options that were investigated as part of this study included:
• Property Tax which allocates charges to property owners based on assessed value. Funding a municipal SWM program with revenue from property taxes is the most common method of financing in Ontario. As an alternative, a dedicated levy could be administered specifically for SWM. The primary advantages of using property taxes to support the municipal SWM program, either through a general tax fund or dedicated levy, is that this method is already accepted as the primary existing source of revenue for municipalities and the billing system is already established. The primary disadvantages are that the fairness and equity in allocating charges is low, it is not a sustainable revenue stream, there are no incentive opportunities to reduce stormwater runoff and pollutant discharge, and many large properties do not contribute to the funding (i.e., tax-exempt).
• Development Related Charges and Fees which allocates charges to developers to fund eligible growth-related costs. Development charges are used to pay for capital costs of SWM facilities in specific areas. Cash-in-Lieu charges can be applied to both capital and operations/maintenance costs of SWM facilities in redevelopment/infill situations, and not necessarily in the location where the development is occurring. Subdivision agreements can also be used to pay for area-specific capital works and anticipated future operations/maintenance. The primary advantage is that these methods are currently accepted by the development community. The primary disadvantages are that these methods are limited by the amount of developable land within municipality and are directly dependent on growth and economic conditions.
• Stormwater Rate which allocates charges to property owners based on impervious area (i.e., the relative contribution of stormwater runoff and pollutant loading to the municipal SWM system). Funding through a stormwater rate has the primary advantages of a fair and equitable allocation of charges to property owners, it is a sustainable and dedicated funding source, provides incentive opportunities to reduce stormwater runoff and pollutant discharge, a provides a mechanism to charge tax-exempt properties for municipal SWM services. The primary disadvantages include additional costs for rate implementation and the possibility that a new fee may not be well received by the public. Methods of addressing these disadvantages were described in detail in Section 3.7.2. It is reiterated that a new fee structure might also be reluctantly received by municipal staff if it does not fit well within the current financial and policy framework dominated by property tax revenues.

Credit River Water Management Strategy Update – Municipal Stormwater Financing Study 58
5.2 Conclusions
The cost of the municipal SWM programs within CVC’s jurisdiction will increase significantly in future years. Not only will costs increase due to the implementation of CRWMSU recommendations, but also as municipalities increase their stormwater level of service to address new water quality regulations, replace/rehabilitate aging infrastructure, and increased maintenance burden as new development infrastructure is assumed. As a result, municipalities will need greater emphasis on sound asset management and financial planning, particularly a long-term outlook for municipalities with decreasing growth/development potential. As a result, a stormwater rate was chosen in Section 2 to be the focus of this study due to its unique advantages (i.e., it is the most fair, equitable and sustainable funding mechanism). A stormwater rate charges property owners based on their relative contribution of stormwater runoff volume and pollutant loading, whereas property tax funding is only based on assessed property value and development charges are based on total number of dwelling units or land area. As a dedicated and sustainable source of funding, a stormwater rate provides more budgeting flexibility than property tax or development-related funding. Section 3 included a summary of stormwater rate case studies, additional stormwater funding lessons learned, and the critical success factors involved in the implementation of a stormwater rate. In Section 4 of this report, a conceptual analysis was conducted for Orangeville and Mississauga to give an idea of the relative magnitude of a stormwater rate charge in each municipality to support their projected program expenditures. Details of the stormwater rate, including the base charge and impervious area statistics compared favorably with other stormwater rate studies in North America. To summarize; a stormwater rate offers additional benefits that support CRWMSU strategies, including incentives for private property source controls. Not only is there an inherent developer incentive for installing stormwater source controls (i.e., since they reduce land requirements for end-of-pipe facilities and therefore can reduce overall SWM construction costs), but property owners with source controls would be eligible for stormwater rate credits if these facilities are properly maintained. The biggest challenges for a stormwater rate are the costs associated with a rate implementation study and in achieving consensus among key stakeholders in an acceptable rate structure and credit policy details, particularly with tax-exempt property owners who would now be faced with a new charge, and commercial/industrial business owners, some of whom could be impacted greatly by redistributing the cost allocation from assessed value to an impervious area based charge. These challenges have been overcome in past studies through stakeholder involvement and the public consultation programs discussed in Section 3.7.2.1. Further, since the stormwater rate represents a major departure from current municipal financing policies, it would require a broader public finance framework, as well as a strong political will among councilors and ratepayers in order to implement. This challenge is neither unusual nor insurmountable, as experience in other jurisdictions has shown. In fact, a stormwater rate may be an attractive option to municipalities such as the City of Orangeville that already administers a water and wastewater billing system, as well as having an organizational and policy framework that may be more conducive to adopting a new fee structure for stormwater.
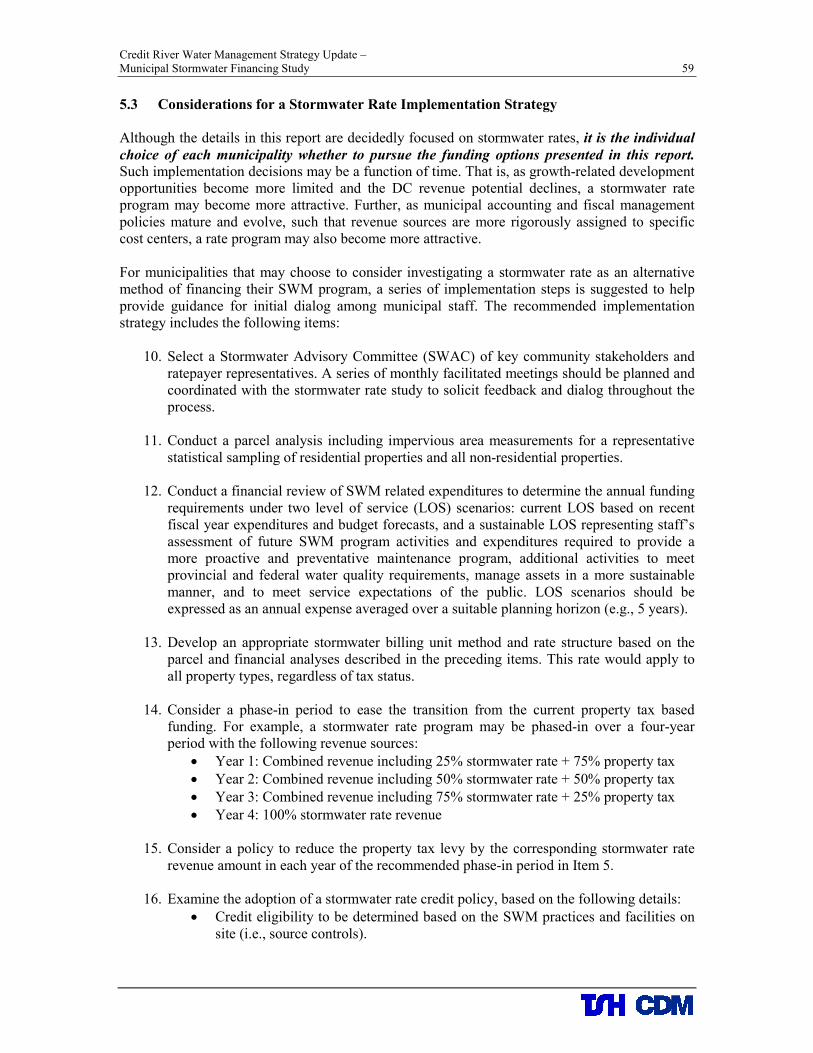
Credit River Water Management Strategy Update – Municipal Stormwater Financing Study 59
5.3 Considerations for a Stormwater Rate Implementation Strategy
Although the details in this report are decidedly focused on stormwater rates, it is the individual
choice of each municipality whether to pursue the funding options presented in this report. Such implementation decisions may be a function of time. That is, as growth-related development opportunities become more limited and the DC revenue potential declines, a stormwater rate program may become more attractive. Further, as municipal accounting and fiscal management policies mature and evolve, such that revenue sources are more rigorously assigned to specific cost centers, a rate program may also become more attractive. For municipalities that may choose to consider investigating a stormwater rate as an alternative method of financing their SWM program, a series of implementation steps is suggested to help provide guidance for initial dialog among municipal staff. The recommended implementation strategy includes the following items:
10. Select a Stormwater Advisory Committee (SWAC) of key community stakeholders and ratepayer representatives. A series of monthly facilitated meetings should be planned and coordinated with the stormwater rate study to solicit feedback and dialog throughout the process.
11. Conduct a parcel analysis including impervious area measurements for a representative
statistical sampling of residential properties and all non-residential properties.
12. Conduct a financial review of SWM related expenditures to determine the annual funding requirements under two level of service (LOS) scenarios: current LOS based on recent fiscal year expenditures and budget forecasts, and a sustainable LOS representing staff’s assessment of future SWM program activities and expenditures required to provide a more proactive and preventative maintenance program, additional activities to meet provincial and federal water quality requirements, manage assets in a more sustainable manner, and to meet service expectations of the public. LOS scenarios should be expressed as an annual expense averaged over a suitable planning horizon (e.g., 5 years).
13. Develop an appropriate stormwater billing unit method and rate structure based on the
parcel and financial analyses described in the preceding items. This rate would apply to all property types, regardless of tax status.
14. Consider a phase-in period to ease the transition from the current property tax based
funding. For example, a stormwater rate program may be phased-in over a four-year period with the following revenue sources:
• Year 1: Combined revenue including 25% stormwater rate + 75% property tax
• Year 2: Combined revenue including 50% stormwater rate + 50% property tax
• Year 3: Combined revenue including 75% stormwater rate + 25% property tax
• Year 4: 100% stormwater rate revenue
15. Consider a policy to reduce the property tax levy by the corresponding stormwater rate revenue amount in each year of the recommended phase-in period in Item 5.
16. Examine the adoption of a stormwater rate credit policy, based on the following details:
• Credit eligibility to be determined based on the SWM practices and facilities on site (i.e., source controls).

Credit River Water Management Strategy Update – Municipal Stormwater Financing Study 60
• All non-residential properties, regardless of tax status, and communal stormwater facilities that serve large residential subdivisions (e.g., >250 lots) would be eligible for credits.
• A maximum credit of no more than 50%.
• Property owners must apply for a credit on an annual basis and certify that all facilities have been constructed, operated, and maintained as designed.
17. Based on discussions with SWAC, consider adopting policies that would benefit tax-
exempt properties, including:
• A rebate policy for tax-exempt properties currently contributing Payment In-Lieu-Of Taxes (PILOT, e.g., post-secondary schools and hospitals), that would deduct the stormwater component of their PILOT charge from their stormwater bill, which will vary in proportion to the stormwater rate revenue during the phase-in period; and
• A tax subsidy for tax-exempt properties that do not currently contribute Payment In-Lieu-Of Taxes (e.g., elementary/secondary schools, churches, and charitable organizations that are defined as exempt from taxation under the Income Tax Act).
These tax subsidies and rebates would reduce the charge to tax-exempt properties. Although this consideration apparently goes against the benefit that a rate offers a mechanism to allocate charges to tax-exempt properties, it is a reality that will likely need to be addressed during the implementation phase. Feedback from recent discussions with SWAC members in the Kitchener, Waterloo and Stratford rate studies has indicated that stormwater rate charges essentially overlap the PILOT charge and would be double-counting. Similarly, church representatives have requested special recognition in-lieu-of the valuable social and community services they provide, which were downloaded on them by the municipality. The key ingredient is to engage and work with these tax-exempt groups to determine their specific needs and resolve to achieve a balance. Since schools, churches and other such institutions often have significant impervious areas, they represent important opportunities for incentive programs to reduce stormwater runoff and pollutant loading through source controls. Further, given the nature of these properties and the citizenry that they attract, there are many opportunities for educational programs that could be factored into a credit program, rather than resorting to subsidies or rebates.
18. Investigate efficiencies in coordinating SWM services that can be shared by neighboring
municipalities, CVC, TRCA, and the regional governments. Joint initiatives that can offer services on a multi-jurisdictional basis (e.g., operations and maintenance activities, capital projects, and administrative/management services) can help to reduce the overall SWM program costs in individual municipalities. Specific examples include sharing specialized equipment and/or trained personnel, and coordinating local and regional government programs such as integrating the municipality’s pond sediment removal activities with the region’s composting program.

APPENDIX A
LITERATURE REVIEW

General Discussion of Stormwater Rates
• Debo, T.N. and A. Reese. 2002. Municipal Stormwater Management. 2d ed. CRC Press. Boca Raton, FL. Leading desk reference on stormwater management that includes a comprehensive treatment of stormwater utilities
• Florida Stormwater Association. 2003. Establishing a Stormwater Utility in Florida. 2003 Edition. How-to manual from the state with the largest number of stormwater utilities. Available on-line at http://www.florida-stormwater.org/manual.html
• Pioneer Valley Planning Commission (Massachusetts). 199. How to Create a Stormwater Utility. Deals with creation of stormwater utilities in a northeastern state.
Surveys of Stormwater Rates
• Florida Stormwater Association, Inc. Stormwater Utilities Survey 2007. Tallahassee, FL. (2007 survey accessible online to members only, 2005 survey accessible to non-members at http://www.florida-stormwater.org/surveys/2005/03-FSA%20Page.htm). Florida has over 470 counties and cities and FSA’s best estimate is that there are now approximately 144 local governments that have established a stormwater utility (i.e., rate implementation). Ninety-one stormwater utilities responded to the 2007 survey questionnaire. A summary of each utility is presented, including the base for user fees, the type of billing system, and methods of compiling payment, among other information.
• Black & Veatch Corporation. 2001-2002. Stormwater Utility Survey. Findings summarized in: Benson, R.B. 2002. “A Current Review of North American Stormwater Management Utilities.” In Global Solutions for Urban Drainage: 9ICUD. Proceedings of the Ninth International Conference on Urban Drainage. Sept 8-13, 2002. Full survey includes information on 122 stormwater utilities in North America. For each utility, includes the base for user fees, the type of billing system, average monthly charges, and methods of compelling payment, among other information.
• Apogee Research, Inc. 1992. Stormwater Utilities: Innovative Financing of Stormwater Management. Prepared for the U.S. EPA Water Policy Branch, Office of Policy Analysis, Office of Policy, Planning and Management, Washington, D.C. Covers the legal, financial, and institutional components of a stormwater utility and discusses some of the most common obstacles to utility formation. Clean Water Act issues, NPDES permits, and other funding sources are also addressed. Based on a survey of fifty utilities nationwide.
• Summarized in: Doll, A., Lindsey, G., & Albani, R. 1998. “Stormwater Utilities: Key Components and Issues.” Advances in Urban Wet Weather Pollution Reduction Conference, Water Environment Federation, June 28-July 1, 1998, Cleveland, Ohio, pp. 293-302. Puts special emphasis on political challenges.
References Focusing on Financing Stormwater Management
• Hoag, Grant. 2004. “Developing Equitable Stormwater Fees.” Stormwater 5(1). Available online at http://www.forester.net/sw_0401_developing.html. Focuses on the issue of equity in implementing a stormwater utility. Discusses the evaluation process used to calculate pollutant-based fees for stormwater programs. Also discusses what customers perceive as fair, and how to set stormwater rates that reflect the cost of providing services.

• AMEC Earth & Environmental. 2002. Pro Forma Business Plan – Utility-bases Stormwater Management Program. Prepared for the Town of Chapel Hill, North Carolina. Includes an assessment of 10 potential funding mechanisms and a discussion of the feasibility of creating the database required for establishment of equitable user fees.
• Institute for Water Resources, a division of the American Public Works Association. 1991. Financing Stormwater Facilities: A Utility Approach. Chicago, Illinois. Emphasizes calculation of user charges and contains a worksheet for that purpose. Based on the following document:
• Lindsey, G. 1988. Financing Stormwater Management: The Utility Approach. Stormwater Management Administration, Maryland Department of the Environment. Baltimore, Maryland. Contains detailed information on calculation of utility charges for different types of property. Includes examples of rate structures intended to help decision-makers determine what types of properties should be included in the rate base.
• Hardten, R.D. et al. 1990. “How Much to Charge and How to Collect It – Stormwater Rate Setting and the Billing System.” Black & Veatch Corporation. Kansas City, Missouri.
• Cyre, H.J. 1982. “Stormwater Management Financing.” Presented to the International Public Works Congress, Houston, Texas. Water Resource Associates, Inc. Bellevue, Washington. Discusses conceptual differences between stormwater utilities and other types of utilities.
Other References
• Brisman, A. 2002. “Considerations in Establishing a Stormwater Utility.” Southern Illinois University Law Journal. Vol. 26, pp. 505-529. Discusses potential legal challenges to stormwater fee structures.
• Chlarson, J. and S.D. Hemsley. “Model Stormwater Utility Ordinance.” Municipal Technical Advisory Service, University of Tennessee.
• Busco, D. and G. Lindsey. 2002. An Annotated Bibliography of Stormwater Finance Resources. Centre for Urban Policy and the Environment, Indiana University-Purdue University Indianapolis. Available online as part of An Internet Guide to Financing Stormwater Management, http://stormwaterfinance.urbancenter.iupui.edu/

APPENDIX B
CREDIT POLICY EXAMPLES