credit-suisse Quarterly Review Q2/2001
31
CREDIT SUISSE GROUP QUARTERLY REVIEW 2001 Q2
-
Upload
quarterlyearningsreports2 -
Category
Economy & Finance
-
view
280 -
download
0
Transcript of credit-suisse Quarterly Review Q2/2001

CREDIT SUISSE GROUP QUARTERLY REVIEW 2001
Q2
1 Editorial
2 Financial highlights Q2/2001
4 An overview of Credit Suisse Group
8 Review of business units 8 Credit Suisse Financial Services
16 Credit Suisse Private Banking18 Credit Suisse Asset Management 20 Credit Suisse First Boston
23 Consolidated results 23 Income statement24 Balance sheet25 Off-balance sheet business25 Selected notes
Information for investors
CREDIT SUISSE GROUPMedia RelationsKarin Rhomberg Hug, Andreas HildenbrandTel. + 41 1 333 8844 Fax + 41 1 333 8877
Mailing address: P.O. Box 1, 8070 Zurich, Switzerland
Copies of all Credit Suisse Group’s financial publications may be ordered from:
CREDIT SUISSEKIDM 23Uetlibergstrasse 2318070 ZurichSwitzerlandFax + 41 1 332 7294
Credit Suisse Group shares Ticker symbolsStock exchange listings Bloomberg Reuters Telekurs
SWX (Swiss Exchange)/virt-x CSGN VX CSGZn.VX CSGN,004Frankfurt CSHN GR CSGZn.F 876800,13Tokyo 8653 JP CSGZn.T N1492,106
Also traded in
New York (ADS) 1) CSGKY US CSGKY.OB CSGKY,130London (SEAQ) CSG LI CSHZnq.LT C2,182Paris (OTC) CSHR FP CSHZ.PA 916190,25
1) 1 ADS represents 1 registered share from 15.8.2001.
Swiss security number 1213853 ISIN number CH0012138530 CUSIP number 225 401 108
RatingsAgencies Credit Suisse Group Credit Suisse First Boston Winterthur
Long term Short term Long term Short term Long term Short term
Moody’s, New York Aa3 - Aa3 P1 A1 P1 Aa3Standard & Poor’s, New York AA- A1+ AA A1+ AA A1+ AAFitch IBCA, New York AA- F1+ AA- F1+ AA F1+ AA-
Credit Suisse
Enquiries
CREDIT SUISSE GROUPInvestor RelationsGerhard Beindorff, Andreas PeterlikTel. + 41 1 333 4570, + 41 1 333 3169Fax + 41 1 333 2587
INFORMATION FOR INVESTORS
This symbol is used to indicate topics on which further information is available on our website. Go to www.credit-suisse.com/q2review2001/bookmarks.html to find links to the relevant information. The additional information indicated is openly accessible and does not form part of the Quarterly Review. Some areas of Credit Suisse Group’s websites are only available in English.
As already stated in the Annual Review 2000 and the Annual Report 2000/2001, Credit Suisse Group changed itsaccounting policies in the year 2000, within the framework of the Swiss Accounting and Reporting Recommendations, in order to increase the transparency for its insurance business and to align its reporting with a more internationally recog-nised standard. The Group’s half-year financial statements as of 30 June 2000 have been restated to conform with the current year’s presentation. The Group’s consolidated financial statements show both the restated (new basis) and the“previously reported” comparative figures for 30 June 2000. For detailed information, please refer to the Annual Report2000/2001, Note 2: Changes to accounting policies.
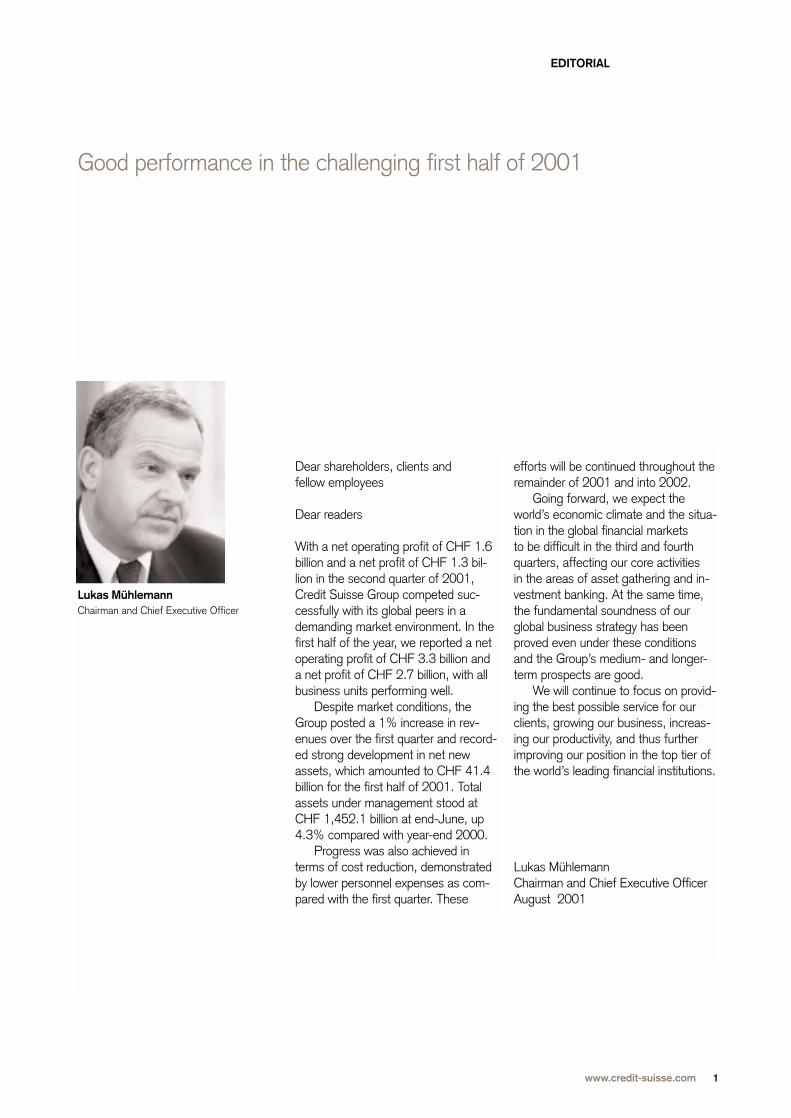
EDITORIAL
Good performance in the challenging first half of 2001
Lukas MühlemannChairman and Chief Executive Officer
Dear shareholders, clients and fellow employees
Dear readers
With a net operating profit of CHF 1.6billion and a net profit of CHF 1.3 bil-lion in the second quarter of 2001,Credit Suisse Group competed suc-cessfully with its global peers in ademanding market environment. In thefirst half of the year, we reported a netoperating profit of CHF 3.3 billion anda net profit of CHF 2.7 billion, with allbusiness units performing well.
Despite market conditions, theGroup posted a 1% increase in rev-enues over the first quarter and record-ed strong development in net newassets, which amounted to CHF 41.4billion for the first half of 2001. Totalassets under management stood atCHF 1,452.1 billion at end-June, up4.3% compared with year-end 2000.
Progress was also achieved interms of cost reduction, demonstratedby lower personnel expenses as com-pared with the first quarter. These
efforts will be continued throughout theremainder of 2001 and into 2002.
Going forward, we expect theworld’s economic climate and the situa-tion in the global financial markets to be difficult in the third and fourthquarters, affecting our core activities in the areas of asset gathering and in-vestment banking. At the same time,the fundamental soundness of ourglobal business strategy has beenproved even under these conditionsand the Group’s medium- and longer-term prospects are good.
We will continue to focus on provid-ing the best possible service for ourclients, growing our business, increas-ing our productivity, and thus furtherimproving our position in the top tier ofthe world’s leading financial institutions.
Lukas MühlemannChairman and Chief Executive OfficerAugust 2001
www.credit-suisse.com 1

CREDIT SUISSE GROUP FINANCIAL HIGHLIGHTS Q2/2001
Share data 1)
Number of shares issued in millions Shares ranking for dividend in millionsMarket capitalisation in CHF mBook value per share in CHF
Share price (as of 15 August 2001: CHF 71.25) at end of reporting periodhighlow
Average number of shares in millionsEarnings per share in CHFOperating earnings per share in CHF 4)
Earnings per share – diluted, in CHFOperating earnings per share – diluted, in CHF 4)
1) All share-related data have been adjusted for the 4-for-1 share split effective as of 15 August 2001.2) 7.6 m of the shares repurchased were approved for cancellation by the Annual General Meeting on 1 June 2001 and are not ranking for dividend.3) Adjusted for average number of shares repurchased. 4) Excl. amortisation of acquired intangible assets and goodwill.
Change vs.31 Dec. 2000
in %
00
(5 5
Change vs.2000in %
(4 (14(1
Change in %6 months
2001/2000
10(31 (18 (31(18
30 June 2001
1,203.601,196.00
88,29535.76
Q2/2001 in CHF
73.8883.1372.25
Q2/2000
3) 1,095.381.531.571.531.57
)
)))
))))
31 March 2001
1,202.992) 1,202.99
91,52934.56
Q1/2001in CHF
76.3887.0069.75
6 months 2001
1,198.962.272.782.242.76
Q2/2001
1,196.051.081.351.071.33
Q1/2001
3) 1,201.901.191.441.181.42
31 Dec. 2000
1,201.751,201.75
92,53534.08
2000in CHF
77.0097.1373.25
6 months 2000
3) 1,093.113.283.373.273.36
Share performanceSwiss Market Index Credit Suisse Group
19971996 1998 1999 2000 2001
1009080
70
60
50
40
30
20
2
Market capitalisationas of end of reporting period (in CHF bn)
90
100
80
70
50
30
20
60
40
10
0
91 92 93 94 95 96 97 98 99 00 Q2/01
Financial calendar
Third quarter results 2001 Tuesday, 20 November 2001
Investor’s Day Friday, 7 December 2001
Fourth quarter/full-year results 2001 Tuesday, 12 March 2002
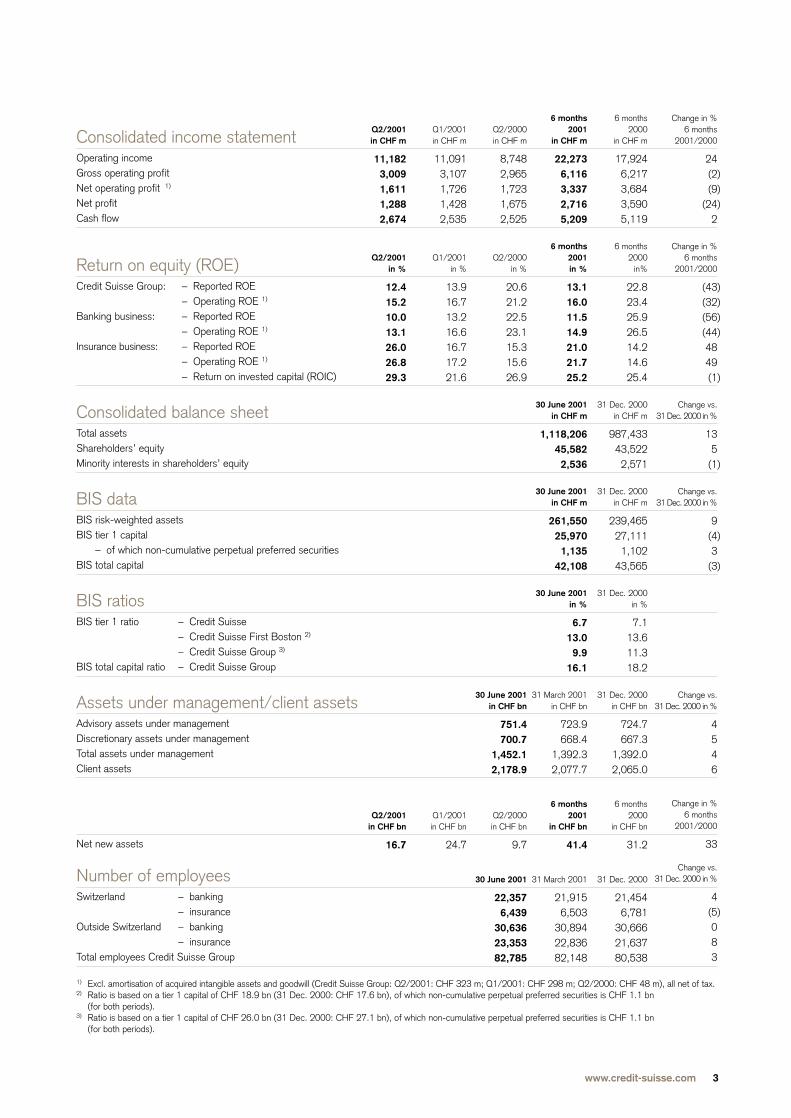
Consolidated income statementOperating incomeGross operating profitNet operating profit 1)
Net profitCash flow
Return on equity (ROE)Credit Suisse Group: – Reported ROE
– Operating ROE 1)
Banking business: – Reported ROE– Operating ROE 1)
Insurance business: – Reported ROE– Operating ROE 1)
– Return on invested capital (ROIC)
Consolidated balance sheetTotal assetsShareholders’ equityMinority interests in shareholders’ equity
BIS dataBIS risk-weighted assets BIS tier 1 capital
– of which non-cumulative perpetual preferred securitiesBIS total capital
BIS ratiosBIS tier 1 ratio – Credit Suisse
– Credit Suisse First Boston 2)
– Credit Suisse Group 3)
BIS total capital ratio – Credit Suisse Group
Assets under management/client assetsAdvisory assets under managementDiscretionary assets under managementTotal assets under managementClient assets
Net new assets
Number of employeesSwitzerland – banking
– insuranceOutside Switzerland – banking
– insuranceTotal employees Credit Suisse Group
1) Excl. amortisation of acquired intangible assets and goodwill (Credit Suisse Group: Q2/2001: CHF 323 m; Q1/2001: CHF 298 m; Q2/2000: CHF 48 m), all net of tax.2) Ratio is based on a tier 1 capital of CHF 18.9 bn (31 Dec. 2000: CHF 17.6 bn), of which non-cumulative perpetual preferred securities is CHF 1.1 bn
(for both periods).3) Ratio is based on a tier 1 capital of CHF 26.0 bn (31 Dec. 2000: CHF 27.1 bn), of which non-cumulative perpetual preferred securities is CHF 1.1 bn
(for both periods).
Change in %6 months
2001/2000
24(2(9
(242
Change in %6 months
2001/2000
(43(32(56(444849(1
Change vs.31 Dec. 2000 in %
135
(1
Change vs.31 Dec. 2000 in %
9(43
(3
Change vs.31 Dec. 2000 in %
4546
Change in %6 months
2001/2000
33
Change vs.31 Dec. 2000 in %
4(5083
)))
))))
)
)
)
)
)
6 months2000
in CHF m
17,9246,2173,6843,5905,119
6 months 2000
in%
22.823.425.926.514.214.625.4
31 Dec. 2000in CHF m
987,43343,5222,571
31 Dec. 2000in CHF m
239,46527,1111,102
43,565
31 Dec. 2000 in %
7.1 13.6 11.3 18.2
31 Dec. 2000in CHF bn
724.7667.3
1,392.02,065.0
6 months2000
in CHF bn
31.2
31 Dec. 2000
21,4546,781
30,66621,63780,538
Q2/2000in CHF m
8,7482,9651,7231,6752,525
Q2/2000in %
20.621.222.523.115.315.626.9
30 June 2001in CHF bn
751.4700.7
1,452.12,178.9
Q2/2000in CHF bn
9.7
30 June 2001
22,3576,439
30,63623,35382,785
6 months2001
in CHF m
22,2736,1163,3372,7165,209
6 months 2001in %
13.116.011.514.921.021.725.2
30 June 2001in CHF m
1,118,20645,5822,536
30 June 2001in CHF m
261,55025,9701,135
42,108
30 June 2001in %
6.713.09.9
16.1
31 March 2001in CHF bn
723.9668.4
1,392.32,077.7
6 months2001
in CHF bn
41.4
31 March 2001
21,9156,503
30,89422,83682,148
Q2/2001in CHF m
11,1823,0091,6111,2882,674
Q2/2001in %
12.415.210.013.126.026.829.3
Q2/2001 in CHF bn
16.7
Q1/2001in CHF m
11,0913,1071,7261,4282,535
Q1/2001in %
13.916.713.216.616.717.221.6
Q1/2001 in CHF bn
24.7
www.credit-suisse.com 3

AN OVERVIEW OF CREDIT SUISSE GROUP
Credit Suisse Group posted a net operating profit of CHF 1.6billion in the second quarter of 2001, representing a 7%decrease compared to the second quarter of 2000 and to thefirst quarter of 2001. Net operating profit for the first half of2001 totalled CHF 3.3 billion, down 9% year-on-year. Assetsunder management grew by 4.3% to CHF 1,452.1 billion sinceyear-end 2000, with a very strong net inflow of new assets ofCHF 41.4 billion (3.0%).
11 0917 984
3 107
483238
2 386
(22
1 773
298
1 475
1 428
1 726
Overview of business unit results
6 months 2001in CHF m
Operating incomeOperating expenses
Gross operating profit
Depreciation and write-offs on non-current assets 1)
Valuation adjustments, provisions and losses 2)
Profit before extraordinary items, taxes 1)
Extraordinary income/(expenses), net Taxes
Net operating profit before minority interests 1)
Amortisation of acquired intangible assets, and goodwill, net of tax
Net profit before minority interests
Minority interests
Net profit
Net operating profit 1)
Value added 3)
Average allocated capitalReturn on average allocated capitalReturn on average allocated capital (operating) 1)
Increased/(decreased) credit-related valuation adjustments 2)
1) Excl. amortisation of acquired intangible assets and goodwill. 2) Increased/decreased valuation adjustments taken at Group level resulting from the difference between the statistical and actual credit provisions.3) Value Added is a measure of value creation in the period under review. It is derived from Credit Suisse Group’s Value Based Analysis (VBA) and complements the per-
formance metrics which are currently used, but does not replace them. The measure is aimed at enhancing the management’s awareness of value creation. For thispurpose, accounting figures are adjusted by adding back accounting distortions such as selected non-cash charges (e.g. amortisation of goodwill), and cost of equity ischarged to the business unit as well as the consolidated accounts.
4) For the Winterthur business units within Credit Suisse Financial Services, average invested capital is used for the calculation of return on invested capital (ROIC).
Credit SuisseGroup
) 22,273) 16,157
6,116
985650
) 4,481
22(1,035
) 3,468
) 621
) 2,847
) (131
) 2,716
) 3,337
) 1,587
)
)
)
)
)
)
)
)
)
Adjustmentsincluding
CorporateCenter
(181(321
140
2049
(73
) 13) 29
(31
(9
(22
(43
(65
(74
(408
CreditSuisse
FirstBoston
13,35811,147
2,211
439390
1,382
) (1) (279
1,102
537
565
0
565
1,102
250
17,2176.6%
12.8%
0
CreditSuisseAsset
Management
794607
187
150
172
(1) (15
156
52
104
) 0
104
156
92
1,265n/an/a
–
CreditSuissePrivate
Banking
3,0811,379
1,702
2685
1,591
3) (362
1,232
8
1,224
) (11
1,213
1,221
1,095
4) 3,3734) n/a4) n/a
) 1
CreditSuisse
FinancialServices
5,2213,345
1,876
301166
1,409
8(408
1,009
33
976
(77
899
932
558
10,88717.9%18.5%
(5
4

0.91.90.7
1.5– 1.11.0
(0.(0.9(0.4
(1.3
Net new assetsCredit Suisse Financial ServicesCredit Suisse Private BankingCredit Suisse Asset Management 2)
Credit Suisse First Boston 3)
Credit Suisse Group
1) Certain restatements have been made to prior period amounts to conform to the current presentation.2) Net new discretionary assets.3) Measured as the balance from accounts opened minus accounts closed.
Assets under management/client assets
Credit Suisse Financial ServicesAssets under management
– of which discretionaryClient assets
Credit Suisse Private BankingAssets under management
– of which discretionaryClient assets
Credit Suisse Asset ManagementAssets under management
– of which discretionaryClient assets
Credit Suisse First Boston 1)
Assets under management– of which discretionary– of which Private Equity on behalf of clients
Client assets
Credit Suisse GroupAssets under management
– of which discretionaryClient assets
Change vs.31 Dec. 2000 in %
1.73.41.5
7.212.76.3
3.33.43.3
3.84.31.67.9
4.35.05.5
Change in %6 months
2001/2000
(3988
(45–
33
31 Dec. 2000in CHF bn
273.8142.6289.6
456.4108.7495.6
487.2360.1487.2
174.655.931.9
792.6
1,392.0667.3
2,065.0
6 months2000
in CHF bn
5.710.914.60.0
31.2
31 March 2001in CHF bn
276.4145.3291.7
463.6110.7502.2
485.4356.7485.4
166.955.732.0
798.4
1,392.3668.4
2,077.7
6 months2001
in CHF bn
3.520.58.0
) 9.4
41.4
30 June 2001in CHF bn
278.4147.5293.8
489.1122.5526.7
503.4372.4503.4
181.258.332.4
855.0
1,452.1700.7
2,178.9
Q2/2000 in CHF bn
0.55.34.3
(0.4
9.7
Q1/2001 in CHF bn
) 4.68.46.84.9
24.7
Q2/2001 in CHF bn
(1.112.11.24.5
16.7
)
)
Credit Suisse Group performed well inthe second quarter of 2001, despite a demanding market environmentwhich contrasted sharply with the posi-tive market developments in 2000.Net operating profit – which excludesthe amortisation of acquired intangibleassets and goodwill – was CHF 1.6billion, representing a decrease of 7%over the second quarter of 2000 andover the first quarter of 2001. CreditSuisse Group’s consolidated secondquarter results include a CHF 100 mil-lion reserve for potential writedowns inthe private equity portfolio.
Net operating profit for the first halfof 2001 amounted to CHF 3.3 billion,down 9% over the first half of 2000.
Taking into account the 4-for-1share split effective 15 August 2001,operating earnings per share for thesecond quarter of 2001 were CHF1.35, compared to CHF 1.57 for thesecond quarter of 2000 and CHF 1.44for the first quarter of 2001. Operatingearnings per share for the first half of2001 decreased to CHF 2.78 fromCHF 3.37 in the first half of 2000.
Net new assets developed verystrongly in the first half of 2001, con-tributing CHF 41.4 billion or 3.0% ofassets under management (CHF 16.7billion or 1.2% in the second quarter).The Group’s total assets under man-agement stood at CHF 1,452.1 billionas of 30 June 2001, an increase of
4.3% since year-end 2000 (4.3%since the end of the first quarter of2001). In the first half of 2001, CreditSuisse Private Banking contributedCHF 20.5 billion (CHF 12.1 billion inthe second quarter of 2001), CreditSuisse Asset Management CHF 8.0billion (CHF 1.2 billion), Credit SuisseFinancial Services CHF 3.5 billion(CHF –1.1 billion) and Credit SuisseFirst Boston CHF 9.4 billion (CHF 4.5billion) to the Group’s net new assets.
Operating income amounted toCHF 11.2 billion for the secondquarter of 2001, representing a 1%increase quarter-on-quarter. Operatingexpenses were up 2% over the firstquarter of 2001, to CHF 8.2 billion,
www.credit-suisse.com 5
AN OVERVIEW OF CREDIT SUISSE GROUP
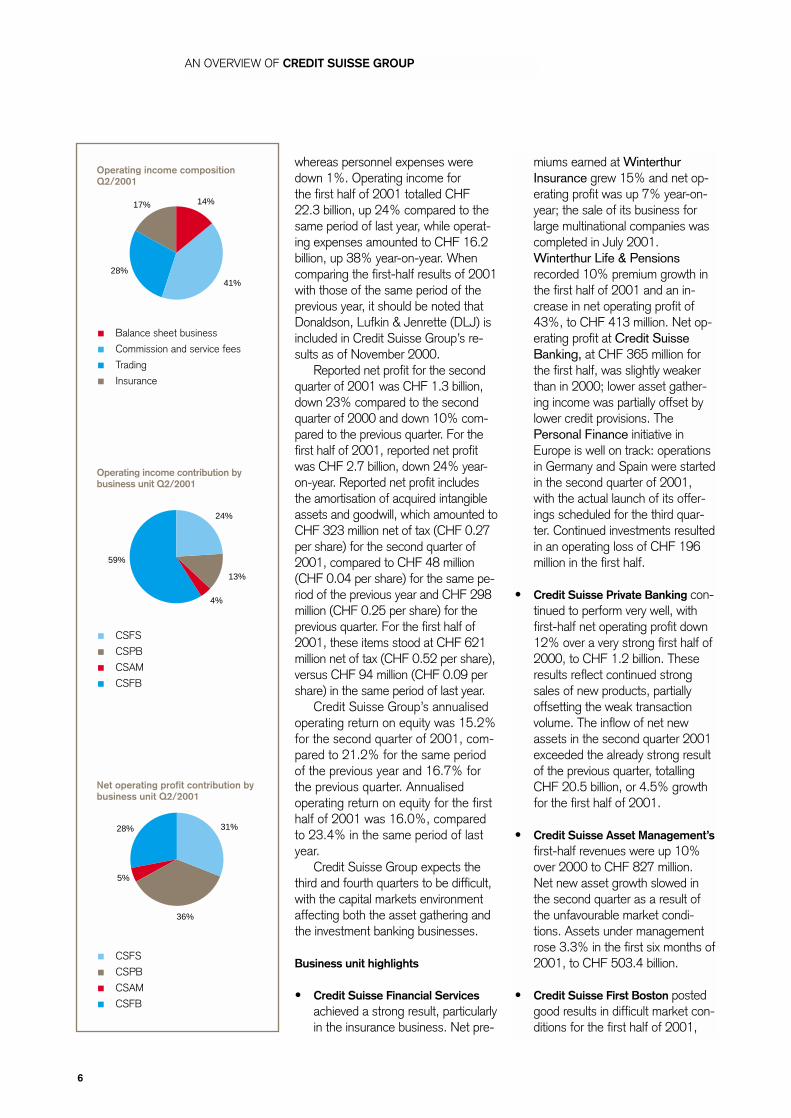
Net operating profit contribution by business unit Q2/2001
CSFS
CSPB
CSAM
CSFB
Operating income composition Q2/2001
Balance sheet business
Commission and service fees
Trading
Insurance
Operating income contribution by business unit Q2/2001
CSFS
CSPB
CSAM
CSFB
36%
5%
31%28%
4%
13%
59%
24%
41%
14%17%
28%
6
whereas personnel expenses weredown 1%. Operating income for the first half of 2001 totalled CHF22.3 billion, up 24% compared to thesame period of last year, while operat-ing expenses amounted to CHF 16.2billion, up 38% year-on-year. Whencomparing the first-half results of 2001with those of the same period of theprevious year, it should be noted thatDonaldson, Lufkin & Jenrette (DLJ) isincluded in Credit Suisse Group’s re-sults as of November 2000.
Reported net profit for the secondquarter of 2001 was CHF 1.3 billion,down 23% compared to the secondquarter of 2000 and down 10% com-pared to the previous quarter. For thefirst half of 2001, reported net profitwas CHF 2.7 billion, down 24% year-on-year. Reported net profit includesthe amortisation of acquired intangibleassets and goodwill, which amounted toCHF 323 million net of tax (CHF 0.27per share) for the second quarter of2001, compared to CHF 48 million(CHF 0.04 per share) for the same pe-riod of the previous year and CHF 298million (CHF 0.25 per share) for theprevious quarter. For the first half of2001, these items stood at CHF 621million net of tax (CHF 0.52 per share),versus CHF 94 million (CHF 0.09 pershare) in the same period of last year.
Credit Suisse Group’s annualisedoperating return on equity was 15.2%for the second quarter of 2001, com-pared to 21.2% for the same periodof the previous year and 16.7% forthe previous quarter. Annualisedoperating return on equity for the firsthalf of 2001 was 16.0%, comparedto 23.4% in the same period of lastyear.
Credit Suisse Group expects thethird and fourth quarters to be difficult,with the capital markets environmentaffecting both the asset gathering andthe investment banking businesses.
Business unit highlights
• Credit Suisse Financial Servicesachieved a strong result, particularlyin the insurance business. Net pre-
miums earned at WinterthurInsurance grew 15% and net op-erating profit was up 7% year-on-year; the sale of its business forlarge multinational companies wascompleted in July 2001.Winterthur Life & Pensionsrecorded 10% premium growth inthe first half of 2001 and an in-crease in net operating profit of43%, to CHF 413 million. Net op-erating profit at Credit SuisseBanking, at CHF 365 million forthe first half, was slightly weakerthan in 2000; lower asset gather-ing income was partially offset bylower credit provisions. ThePersonal Finance initiative inEurope is well on track: operationsin Germany and Spain were startedin the second quarter of 2001,with the actual launch of its offer-ings scheduled for the third quar-ter. Continued investments resultedin an operating loss of CHF 196million in the first half.
• Credit Suisse Private Banking con-tinued to perform very well, withfirst-half net operating profit down12% over a very strong first half of2000, to CHF 1.2 billion. Theseresults reflect continued strongsales of new products, partiallyoffsetting the weak transactionvolume. The inflow of net newassets in the second quarter 2001exceeded the already strong resultof the previous quarter, totallingCHF 20.5 billion, or 4.5% growthfor the first half of 2001.
• Credit Suisse Asset Management’sfirst-half revenues were up 10%over 2000 to CHF 827 million.Net new asset growth slowed inthe second quarter as a result ofthe unfavourable market condi-tions. Assets under managementrose 3.3% in the first six months of2001, to CHF 503.4 billion.
• Credit Suisse First Boston postedgood results in difficult market con-ditions for the first half of 2001,
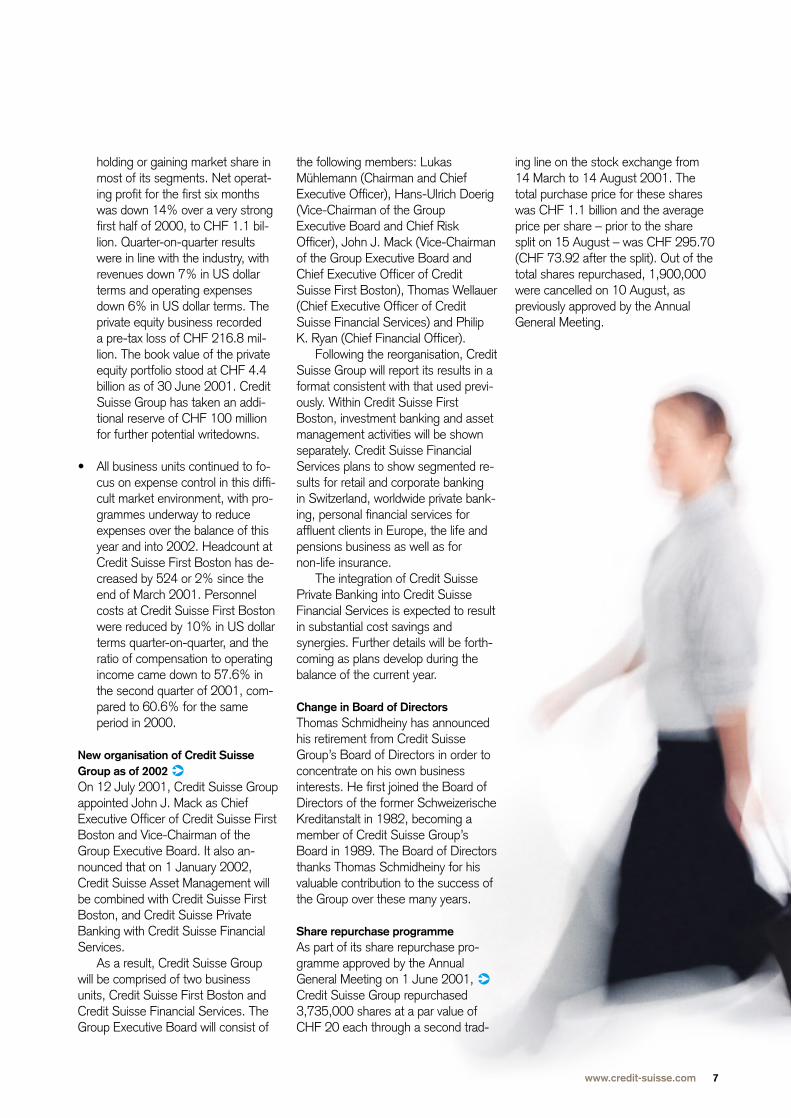
holding or gaining market share inmost of its segments. Net operat-ing profit for the first six monthswas down 14% over a very strongfirst half of 2000, to CHF 1.1 bil-lion. Quarter-on-quarter resultswere in line with the industry, withrevenues down 7% in US dollarterms and operating expensesdown 6% in US dollar terms. Theprivate equity business recorded a pre-tax loss of CHF 216.8 mil-lion. The book value of the privateequity portfolio stood at CHF 4.4billion as of 30 June 2001. CreditSuisse Group has taken an addi-tional reserve of CHF 100 millionfor further potential writedowns.
• All business units continued to fo-cus on expense control in this diffi-cult market environment, with pro-grammes underway to reduceexpenses over the balance of thisyear and into 2002. Headcount atCredit Suisse First Boston has de-creased by 524 or 2% since theend of March 2001. Personnelcosts at Credit Suisse First Bostonwere reduced by 10% in US dollarterms quarter-on-quarter, and theratio of compensation to operatingincome came down to 57.6% inthe second quarter of 2001, com-pared to 60.6% for the sameperiod in 2000.
New organisation of Credit SuisseGroup as of 2002 On 12 July 2001, Credit Suisse Groupappointed John J. Mack as ChiefExecutive Officer of Credit Suisse FirstBoston and Vice-Chairman of theGroup Executive Board. It also an-nounced that on 1 January 2002,Credit Suisse Asset Management willbe combined with Credit Suisse FirstBoston, and Credit Suisse PrivateBanking with Credit Suisse FinancialServices.
As a result, Credit Suisse Groupwill be comprised of two businessunits, Credit Suisse First Boston andCredit Suisse Financial Services. TheGroup Executive Board will consist of
the following members: LukasMühlemann (Chairman and ChiefExecutive Officer), Hans-Ulrich Doerig(Vice-Chairman of the GroupExecutive Board and Chief RiskOfficer), John J. Mack (Vice-Chairmanof the Group Executive Board andChief Executive Officer of CreditSuisse First Boston), Thomas Wellauer(Chief Executive Officer of CreditSuisse Financial Services) and PhilipK. Ryan (Chief Financial Officer).
Following the reorganisation, CreditSuisse Group will report its results in aformat consistent with that used previ-ously. Within Credit Suisse FirstBoston, investment banking and assetmanagement activities will be shownseparately. Credit Suisse FinancialServices plans to show segmented re-sults for retail and corporate banking in Switzerland, worldwide private bank-ing, personal financial services foraffluent clients in Europe, the life andpensions business as well as for non-life insurance.
The integration of Credit SuissePrivate Banking into Credit SuisseFinancial Services is expected to resultin substantial cost savings andsynergies. Further details will be forth-coming as plans develop during thebalance of the current year.
Change in Board of DirectorsThomas Schmidheiny has announcedhis retirement from Credit SuisseGroup’s Board of Directors in order toconcentrate on his own businessinterests. He first joined the Board ofDirectors of the former SchweizerischeKreditanstalt in 1982, becoming amember of Credit Suisse Group’sBoard in 1989. The Board of Directorsthanks Thomas Schmidheiny for hisvaluable contribution to the success ofthe Group over these many years.
Share repurchase programme As part of its share repurchase pro-gramme approved by the AnnualGeneral Meeting on 1 June 2001, Credit Suisse Group repurchased3,735,000 shares at a par value ofCHF 20 each through a second trad-
ing line on the stock exchange from14 March to 14 August 2001. Thetotal purchase price for these shareswas CHF 1.1 billion and the averageprice per share – prior to the sharesplit on 15 August – was CHF 295.70(CHF 73.92 after the split). Out of thetotal shares repurchased, 1,900,000were cancelled on 10 August, aspreviously approved by the AnnualGeneral Meeting.
www.credit-suisse.com 7

REVIEW OF BUSINESS UNITS
Credit Suisse Financial Services
Thomas WellauerChief Executive Officer
8
Credit Suisse Financial Servicesreported a net operating profit of CHF504 million for the second quarter of2001, up 18% on the first quarter. Netoperating profit for the first half of2001 stood at CHF 932 million, down2% on the strong first half of 2000. Netnew assets totalled CHF 3.5 billion forthe first half year.
Credit Suisse Financial Servicesachieved a strong result in the secondquarter of 2001, particularly in the in-surance businesses, despite the con-
tinuing difficult market environment.Excluding the Credit Suisse PersonalFinance business unit – which is in-vesting heavily in pan-European expan-sion – net operating profit for the firsthalf of 2001 rose 13% to CHF 1.1 bil-lion, corresponding to an annualisedoperating return on average equitycapital of 22.2%.
Winterthur InsuranceIn the first half of 2001, WinterthurInsurance reported a 15% increase innet premiums earned compared with
2 4621 628
834
13186
617
(1168
450
436
4.6145.3
Overview of business area Credit Suisse Financial Services6 months 2001in CHF m
Operating incomeOperating expenses
Gross operating profit
Depreciation and write-offs on non-current assets 2)
Valuation adjustments, provisions and losses 3)
Profit before extraordinary items, taxes 2)
Extraordinary income/(expenses), netTaxes
Net operating profit before minority interests 2)
Amortisation of goodwill, net of tax
Net profit before minority interests
Minority interests
Net profit
Net operating profit 2)
Average allocated capital Return on average allocated capitalReturn on average allocated capital (operating) 2)
Increased/(decreased) credit-related valuation adjustments 3)
Assets under management in CHF bn– of which discretionary
Net new assets in CHF bnClient assets in CHF bn
1) Defined as premiums earned (net), less claims and annuities incurred and expenses for processing claims as well as provisions for future policy benefits, less commissions(net), plus investment income from insurance business; expenses from the handling of both claims and investments are allocated to revenue; personnel expenses WinterthurInsurance: CHF 224 m, Winterthur Life & Pensions: CHF 68 m; operating expenses Winterthur Insurance: CHF 94 m, Winterthur Life & Pensions: CHF 48 m.
2) Excl. amortisation of goodwill.3) Increased/decreased valuation adjustments taken at Group level resulting from the difference between the statistical and actual credit provisions.4) For Winterthur business units, average invested capital is used for calculation of return on invested capital (ROIC).
CreditSuisse
FinancialServices
5,2213,345
) 1,876
301166
) 1,409
) 8(408
) 1,009
33
976
(77
) 899
) 932
10,88717.9%18.5%
(5
278.4147.5
3.5293.8
)
)
)
)
14
)
4)
4)
4)
)
CreditSuisse
PersonalFinance
29240
(211
111
(223
(1) 28
(196
3
(199)
) 0
(199
(196
28n/an/a
) –
6.13.00.76.1
Credit Suisse
Banking
1) 1,9651) 1,2611) 704
55165
484
9) (127
366
5
361
) (1
360
365
4,39416.4%16.7%
(5
130.32.50.1
145.7
Winterthur Life &
Pensions
1) 1,4161) 6951) 721
1580
563
0) (129
434
14
420
) (21
399
413
–
109.4109.4
2.7109.4
6,465 4)
25.2% 4)
26.0% 4)
WinterthurInsurance
1,8111,149
662
770
585
0(180
405
11
394
(55
339
350
–
32.632.6n/a
32.6

eränderungseit
Q1/2000in %
388
42
103
17
15
–
10
10
70
5
19 757 -
12
Winterthur Insurance income statement (non-life business)
Gross premiums writtenReinsurance ceded
Net premiums writtenChange in provision for unearned premiums and in
provision for future policy benefits (health)
Net premiums earnedClaims and annuities incurred, netDividends to policyholders incurred, netOperating expenses, net (incl. commissions paid)
Underwriting result, net
Net investment incomeInterest received on deposits and bank accountsInterest paidOther income/(expenses) (incl. exchange rate differences) 1)
Profit before extraordinary items, taxes 1)
Extraordinary income/(expenses), netTaxes
Net operating profit before minority interests 1)
Amortisation of goodwill
Net profit before minority interests
Minority interests
Net profit
Net operating profit 1)
1) Excl. amortisation of goodwill.2) Incl. a partial recognition of CHF 43 m before tax related to the sale of Winterthur International.
6 months2000
in CHF m
8,736) (993
7,743
) (1,190
6,553) (5,069) (188) (1,960
) (664
1,12646
) (6868
508
0) (144
364
8
356
) (36
320
328
Change in %6 months
2001/2000
27) 5
30
) 115
15) 16) (3) 13
) 14
20(48
) (1(57
15
–) 25
11
38
11
) 53
6
7
V
)
)))
)
2 3
6 months2001
in CHF m
11,113) (1,046
10,067
(2,563
7,504) (5,855) (183) (2,221
) (755
1,35424
) (6729
585
0) (180
405
11
394
) (55
339
350
Q2/2000in CHF m
3,834) (436
3,398
) 70
3,468) (2,668) (94) (1,005
) (299
59423
) (342) 41
325
0) (97
228
4
224
) (26
198
202
Q1/2001in CHF m
6,774) (601
6,173
) (2,556
3,617) (2,799) (112) (1,049
) (343
5297
) (26) 43
210
0) (60
150
5
145
) (17
128
133
Q2/2001in CHF m
4,339(445
3,894
(7
3,887(3,056
(71(1,172
(412
82517
(41(14
375
0(120
255
6
249
(38
211
217
Winterthur Insurance key information(non-life business)
Combined ratio (excl. dividends to policyholders)
Claims ratio
Expense ratio
Assets under management in CHF bn
Technical provisions in CHF m
Number of employees
6 months2001
107.6%
78.0%
29.6%
31 March 2001
32.7
30,132
22,244
Q1/2001
106.4%
77.4%
29.0%
Q2/2000
105.9%
76.9%
29.0%
30 June 2001
32.6
30,339
22,516
Q2/2001
108.8%
78.6%
30.2%
6 months2000
107.3%
77.4%
29.9%
31 Dec. 2000
32.5
26,653
21,796
www.credit-suisse.com 9

REVIEW OF BUSINESS UNITS
19991999
io USD1999
io USD
464
3
Winterthur Life & Pensions income statement(life business)
Gross premiums writtenReinsurance ceded
Net premiums writtenChange in provision for unearned premiums
Net premiums earnedDeath and other benefits incurredChange in provision for future policyholder benefitsDividends to policyholders incurredOperating expenses, net (incl. commissions paid)Net investment incomeInterest received on deposits and bank accountsInterest on bonuses credited to policyholdersOther interest paidOther income/(expenses) (incl. exchange rate differences) 1)
Profit before extraordinary items, taxes 1)
Extraordinary income/(expenses), netTaxes
Net operating profit before minority interests 1)
Amortisation of goodwill
Net profit before minority interests
Minority interests
Net profit
Net operating profit 1)
1) Excl. amortisation of goodwill.
Winterthur Life & Pensions key information (life business)
Expense ratio 1)
Net return on average technical provisions 2)
Net new assets in CHF bn 3)
Assets under management in CHF bn 4)
Technical provisions in CHF m
Number of employees
1) Operating expenses/earned premiums.2) Net profit before minority interests/average technical provisions.3) Based on change in technical provisions for traditional business, adjusted for technical interests; net cash flow unit-linked business; and change in off-balance sheet
business such as funds.4) Based on savings-related provisions for policyholders plus off-balance sheet assets.
6 months2000
in CHF m
8,561) (156
8,405) 0
8,405) (4,908) (4,064) (1,161) (756
3,15044
) (58) (118) (164
370
0) (53
317
7
310
) (28
282
289
Change in %6 months
2001/2000
10) (63
11–
11) 30) (19) (46) 26
(14(16
) 24) (16) (60
52
–) 143
37
100
35
) (25
41
43
in M
in M
)
))
))
))
)
6 months2001
in CHF m
9,376) (58
9,318(11
9,307) (6,373) (3,299) (631) (953
2,71237
) (72) (99) (66
563
0) (129
434
14
420
) (21
399
413
Q2/2000in CHF m
3,340) (61
3,279) 0
3,279) (2,558) (984) (450) (363
1,37822
) (29) (59) (72
164
0) (23
141
4
137
) (14
123
127
Q2/2001in CHF m
3,187(7
3,1803
3,183(2,687(1,205
(228(581
1,91924
(40(62(27
296
0(66
230
9
221
(16
205
214
Q1/2001in CHF m
6,189) (51
6,138(14
6,124) (3,686) (2,094) (403) (372
79313
) (32) (37) (39
267
0) (63
204
5
199
) (5
194
199
6 months2001
10.2%
39 bp
2.7
31 March 2001
107.1
107,390
7,095
Q2/2000
11.1%
15 bp
0.2
30 June 2001
109.4
108,926
7,276
Q1/2001
6.1%
19 bp
2.1
Q2/2001
18.3%
21 bp
0.6
6 months2000
9.0%
35 bp
1.6
31 Dec. 2000
104.7
105,522
6,562
10
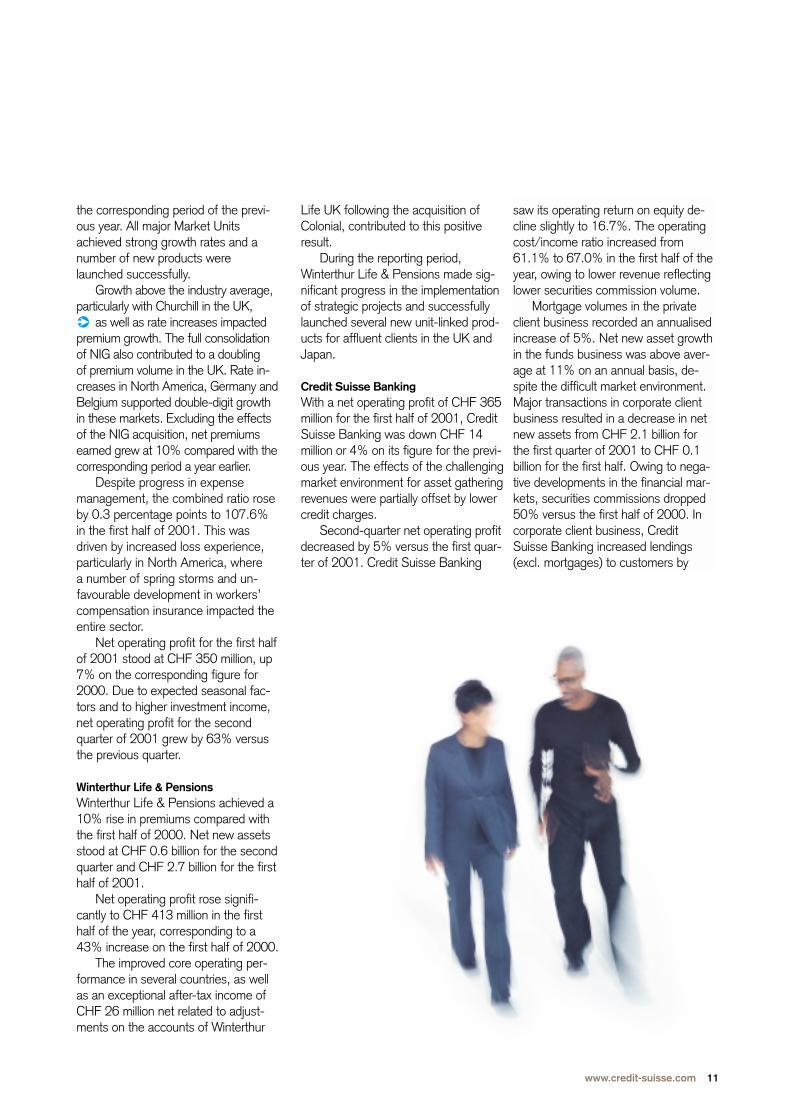
the corresponding period of the previ-ous year. All major Market Unitsachieved strong growth rates and anumber of new products werelaunched successfully.
Growth above the industry average,particularly with Churchill in the UK,
as well as rate increases impactedpremium growth. The full consolidationof NIG also contributed to a doubling of premium volume in the UK. Rate in-creases in North America, Germany andBelgium supported double-digit growthin these markets. Excluding the effectsof the NIG acquisition, net premiumsearned grew at 10% compared with thecorresponding period a year earlier.
Despite progress in expensemanagement, the combined ratio roseby 0.3 percentage points to 107.6%in the first half of 2001. This wasdriven by increased loss experience,particularly in North America, where a number of spring storms and un-favourable development in workers’compensation insurance impacted theentire sector.
Net operating profit for the first halfof 2001 stood at CHF 350 million, up7% on the corresponding figure for2000. Due to expected seasonal fac-tors and to higher investment income,net operating profit for the secondquarter of 2001 grew by 63% versusthe previous quarter.
Winterthur Life & PensionsWinterthur Life & Pensions achieved a10% rise in premiums compared withthe first half of 2000. Net new assetsstood at CHF 0.6 billion for the secondquarter and CHF 2.7 billion for the firsthalf of 2001.
Net operating profit rose signifi-cantly to CHF 413 million in the firsthalf of the year, corresponding to a43% increase on the first half of 2000.
The improved core operating per-formance in several countries, as wellas an exceptional after-tax income ofCHF 26 million net related to adjust-ments on the accounts of Winterthur
Life UK following the acquisition ofColonial, contributed to this positiveresult.
During the reporting period,Winterthur Life & Pensions made sig-nificant progress in the implementationof strategic projects and successfullylaunched several new unit-linked prod-ucts for affluent clients in the UK andJapan.
Credit Suisse BankingWith a net operating profit of CHF 365million for the first half of 2001, CreditSuisse Banking was down CHF 14million or 4% on its figure for the previ-ous year. The effects of the challengingmarket environment for asset gatheringrevenues were partially offset by lowercredit charges.
Second-quarter net operating profitdecreased by 5% versus the first quar-ter of 2001. Credit Suisse Banking
saw its operating return on equity de-cline slightly to 16.7%. The operatingcost/income ratio increased from61.1% to 67.0% in the first half of theyear, owing to lower revenue reflectinglower securities commission volume.
Mortgage volumes in the privateclient business recorded an annualisedincrease of 5%. Net new asset growthin the funds business was above aver-age at 11% on an annual basis, de-spite the difficult market environment.Major transactions in corporate clientbusiness resulted in a decrease in netnew assets from CHF 2.1 billion forthe first quarter of 2001 to CHF 0.1billion for the first half. Owing to nega-tive developments in the financial mar-kets, securities commissions dropped50% versus the first half of 2000. Incorporate client business, CreditSuisse Banking increased lendings(excl. mortgages) to customers by
www.credit-suisse.com 11

REVIEW OF BUSINESS UNITS
Credit Suisse Banking income statement 1)
Net interest incomeNet commission and service fee incomeNet trading incomeOther ordinary income
Operating income
Personnel expensesOther operating expenses
Operating expenses
Gross operating profit
Depreciation and write-offs on non-current assets 2)
Valuation adjustments, provisions and losses 3)
Profit before extraordinary items, taxes 2)
Extraordinary income/(expenses), netTaxes 4)
Net operating profit before minority interests 2)
Amortisation of goodwill, net of tax
Net profit before minority interests
Minority interests
Net profit
Net operating profit 2)
Increased/(decreased) credit-related valuation adjustments Tax on amortisation of goodwill
1) Half-year comparative figures have been adjusted to reflect the current business unit reporting structure. 2) Excl. amortisation of goodwill.3) Increased/decreased valuation adjustments taken at Group level resulting from the difference between the statistical and actual credit provisions.4) Excl. tax on amortisation of goodwill
Q2/2000in CHF m
58227985(1
945
378183
561
384
16116
252
1) (61
192
3
189
0
189
192
) (180
Change in %6 months
1) 2001/2000
6(9(8
160
1
122
8
(10
112(42
1
(59) 7
(4
(17
(3
) 0
(3
(4
) ––
))
)
)
)
)
)
)
)
)
6 months 2000
in CHF m
1,16659917710
1,952
734432
1,166
786
26283
477
22) (119
380
6
374
(1
373
379
) (660
6 months2001
in CHF m
1,232544163
) 26
1,965
820441
1,261
704
55165
484
9) (127
366
5
361
(1)
360
365
) (51
Q2/2001in CHF m
6182637922
982
417229
646
336
2279
235
7(63
179
2
177
(1
176
178
281
Q1/2001in CHF m
614281844
983
403212
615
368
3386
249
2) (64
187
3
184
) 0
184
187
(330
18% in the first half of 2001, whilealso further improving the risk structureof its credit portfolio. Credit provisionand losses decreased 42% comparedwith the first half of 2000.
In the second quarter of 2001, thenumber of Direct Net customersgrew by almost 25,000, or 9%, to313,000 (+44% versus the end ofJune 2000). The number of paymentorders executed electronically remainedstable versus the first quarter, totallingapproximately 3 million (+90% com-pared with the second quarter of2000).
12
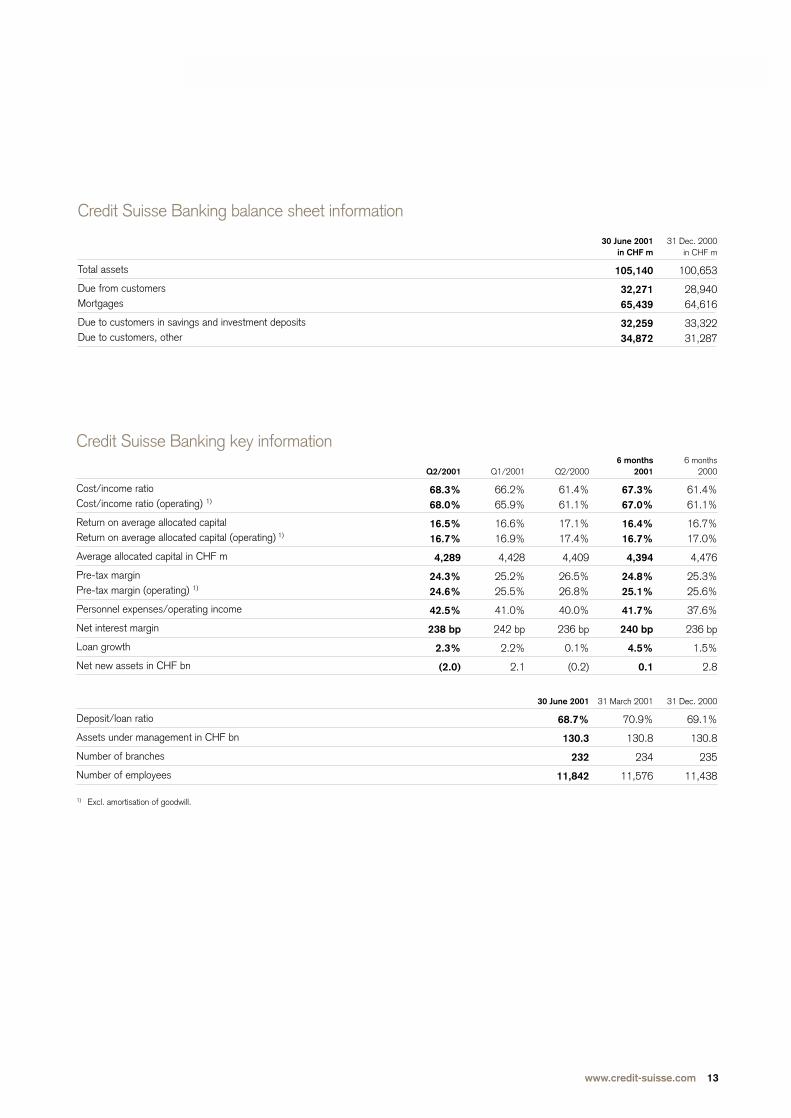
Credit Suisse Banking balance sheet information
Total assets
Due from customersMortgages
Due to customers in savings and investment depositsDue to customers, other
30 June 2001in CHF m
105,140
32,27165,439
32,25934,872
31 Dec. 2000in CHF m
100,653
28,94064,616
33,32231,287
Credit Suisse Banking key information
Cost/income ratioCost/income ratio (operating) 1)
Return on average allocated capital Return on average allocated capital (operating) 1)
Average allocated capital in CHF m
Pre-tax margin Pre-tax margin (operating) 1)
Personnel expenses/operating income
Net interest margin
Loan growth
Net new assets in CHF bn
Deposit/loan ratio
Assets under management in CHF bn
Number of branches
Number of employees
1) Excl. amortisation of goodwill.
6 months2000
61.4%61.1%
16.7%17.0%
4,476
25.3%25.6%
37.6%
236 bp
1.5%
2.8
31 Dec. 2000
69.1%
130.8
235
11,438
6 months2001
67.3%67.0%
16.4%16.7%
4,394
24.8%25.1%
41.7%
240 bp
4.5%
0.1
31 March 2001
70.9%
130.8
234
11,576
Q2/2000
61.4%61.1%
17.1%17.4%
4,409
26.5%26.8%
40.0%
236 bp
0.1%
(0.2)
30 June 2001
68.7%
130.3
232
11,842
Q1/2001
66.2%65.9%
16.6%16.9%
4,428
25.2%25.5%
41.0%
242 bp
2.2%
2.1
Q2/2001
68.3%68.0%
16.5%16.7%
4,289
24.3%24.6%
42.5%
238 bp
2.3%
(2.0)
www.credit-suisse.com 13
REVIEW OF BUSINESS UNITS
(27
78–
5034
46
24
74(32
33
29
34
285
25
200
25
34 58
59
Credit Suisse Personal Finance income statement 1)
Net interest incomeNet commission and service fee incomeNet trading incomeOther ordinary income
Operating income
Personnel expensesOther operating expenses
Operating expenses
Gross operating profit
Depreciation and write-offs on non-current assets 2)
Valuation adjustments, provisions and losses
Profit before extraordinary items, taxes 2)
Extraordinary income/(expenses), netTaxes
Net operating profit before minority interests 2)
Amortisation of goodwill
Net profit before minority interests
Minority interests
Net profit
Net operating profit 2)
1) Half-year comparative figures have been adjusted to reflect the current business unit reporting structure.2) Excl. amortisation of goodwill.
Q2/2000in CHF m
31710
21
2328
51
) (30
10
) (31
) 08
) (23
2
) (25
0
) (25
) (23
Change in %6 months
1) 2001/2000
40(23
0–
(15
130174
155
) 252
450–
) 260
–87
) 317
0
) 298
–
) 298
) 317
)
)
)
6 months2000
in CHF m
5263
) 0
34
4054
94
) (60
20
) (62
) 015
) (47
3
) (50
0
) (50
) (47
6 months 2001
in CHF m
7203
(1
29
92148
240
) (211
111
) (223
(128
) (196
3
) (199
0
) (199
) (196
Q2/2001in CHF m
491
(1
13
4378
121
(108
51
(114
09
(105
2
(107
0
(107
(105
Q1/2001in CHF m
3112
) 0
16
4970
119
) (103
60
) (109
(119
) (91
1
) (92
0
) (92
) (91
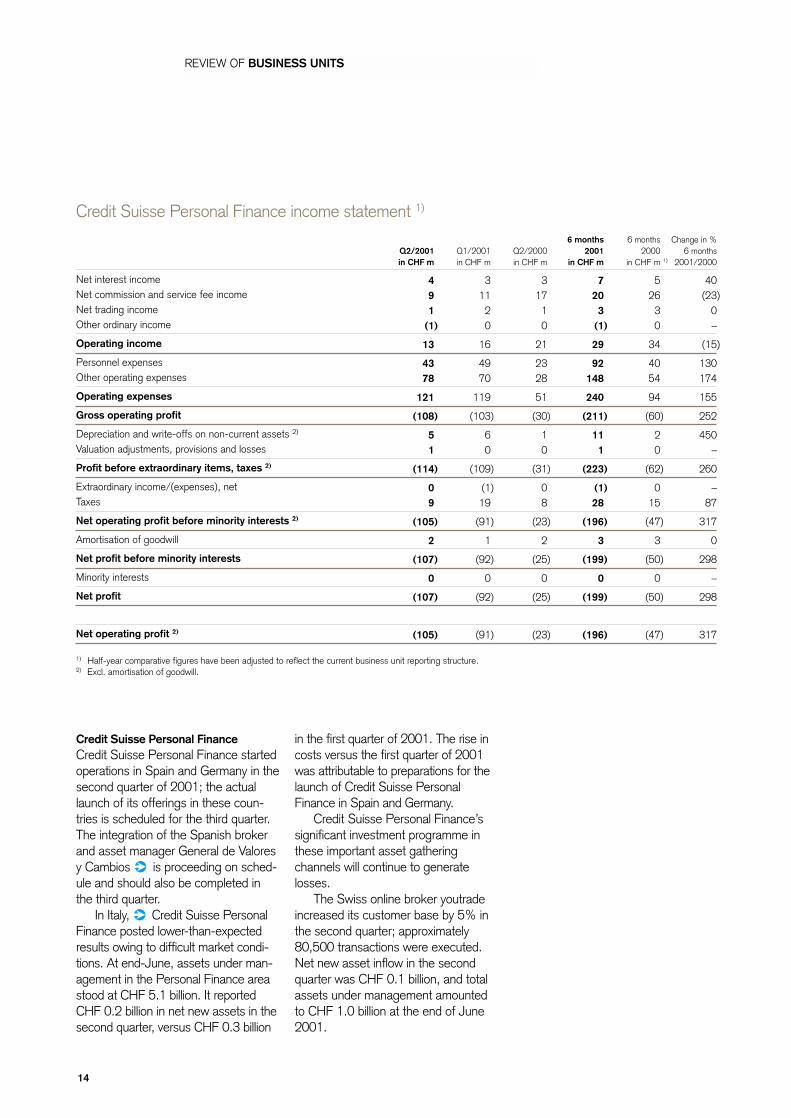
Credit Suisse Personal FinanceCredit Suisse Personal Finance startedoperations in Spain and Germany in thesecond quarter of 2001; the actuallaunch of its offerings in these coun-tries is scheduled for the third quarter.The integration of the Spanish brokerand asset manager General de Valoresy Cambios is proceeding on sched-ule and should also be completed inthe third quarter.
In Italy, Credit Suisse PersonalFinance posted lower-than-expectedresults owing to difficult market condi-tions. At end-June, assets under man-agement in the Personal Finance areastood at CHF 5.1 billion. It reportedCHF 0.2 billion in net new assets in thesecond quarter, versus CHF 0.3 billion
14
in the first quarter of 2001. The rise incosts versus the first quarter of 2001was attributable to preparations for thelaunch of Credit Suisse PersonalFinance in Spain and Germany.
Credit Suisse Personal Finance’ssignificant investment programme inthese important asset gatheringchannels will continue to generate losses.
The Swiss online broker youtradeincreased its customer base by 5% inthe second quarter; approximately80,500 transactions were executed.Net new asset inflow in the secondquarter was CHF 0.1 billion, and totalassets under management amountedto CHF 1.0 billion at the end of June2001.

Credit Suisse Personal Finance key information
Personal FinanceGrowth in assets under management
– of which net new assets – of which market movement and structural effects
youtradeNumber of transactions (in ’000s)
Credit Suisse Personal FinanceAverage allocated capital in CHF m
Personal FinanceAssets under management in CHF bnNumber of clientsNumber of advisors
youtradeAssets under management in CHF bnNumber of clients
Credit Suisse Personal FinanceNumber of employees
6 months2000
30.6%31.3%
) (0.7%
234
n/a
31 Dec. 2000
4.817,898
331
0.925,228
764
)
6 months 2001
5.7%10.8%
) (5.1%
189
28
31 March 2001
4.919,381
337
0.927,267
900
Q2/2000
3.7%10.0%
) (6.3%
101
n/a
30 June 2001
5.120,097
407
1.028,656
1,011
Q1/2001
1.4%7.2%
(5.8%
108
32
Q2/2001
4.3%3.5%0.8%
81
29
www.credit-suisse.com 15
REVIEW OF BUSINESS UNITS
Credit Suisse Private Banking
Oswald J. GrübelChief Executive Officer
16
Credit Suisse Private Banking record-ed a net operating profit of CHF 576million in the second quarter of 2001.This 11% decrease on the previousquarter is attributable to lower trans-action volumes and to investments ininformation technology and training,as well as to the expansion of interna-tional business. Net new assetsamounted to CHF 20.5 billion in thefirst half of 2001, up 88% from thesame period of 2000.
At the end of the second quarter2001, Credit Suisse Private Bankingreported CHF 489.1 billion in assetsunder management, an increase of
CHF 32.7 billion or 7.2% over the endof 2000. Of this increase, CHF 20.5billion or 4.5% was attributable to netnew assets. At CHF 12.1 billion, netnew assets for the second quarterwere up 44% on the healthy first quar-ter. Owing to significantly lower trans-action volumes, operating incomedecreased by 5% to CHF 1.5 billionversus the first quarter of 2001. Thisresulted in a 4% drop in operatingincome in the first half of 2001 com-pared with the previous year. The dropin transaction-related commissionincome was partially offset by strongdemand for innovative market-neutralinvestment products.
12
Credit Suisse Private Banking income statement
Net interest incomeNet commission and service fee incomeNet trading incomeOther ordinary income
Operating income
Personnel expensesOther operating expenses
Operating expenses
Gross operating profit
Depreciation and write-offs on non-current assets 1)
Valuation adjustments, provisions and losses 2)
Profit before extraordinary items, taxes 1)
Extraordinary income/(expenses), netTaxes
Net operating profit before minority interests 1)
Amortisation of goodwill
Net profit before minority interests
Minority interests
Net profit
Net operating profit 1)
Increased/(decreased) credit-related valuation adjustments 2)
1) Excl. amortisation of goodwill.2) Increased/decreased valuation adjustments taken at Group level resulting from the difference between the statistical and actual credit provisions.
Q2/2000in CHF m
3191,018
17017
1,524
431204
635
889
1239
838
(8) (181
649
2
647
) (6
641
643
(13
Q1/2001in CHF m
3141,024
161) 80
1,579
436237
673
906
1142
853
1) (202
652
3
649
) (7
642
645
1
Q2/2001in CHF m
2981,058
152(6
1,502
438268
706
796
1543
738
2(160
580
5
575
(4
571
576
0
Change in %6 months
2001/2000
0(2
(2664
(4
030
9
(12
30(18
(13
) –) (12
(12
100
(12
) (27
(12
(12
) –
))
)
)
)
)
)
)
)
)
)
)
6 months2000
in CHF m
6122,128
42145
3,206
874387
1,261
1,945
20104
1,821
(9) (411
1,401
4
1,397
) (15
1,382
1,386
(22
6 months 2001
in CHF m
6122,082
31374
3,081
874505
1,379
1,702
2685
1,591
) 3) (362
1,232
8
1,224
) (11
1,213
1,221
) 1
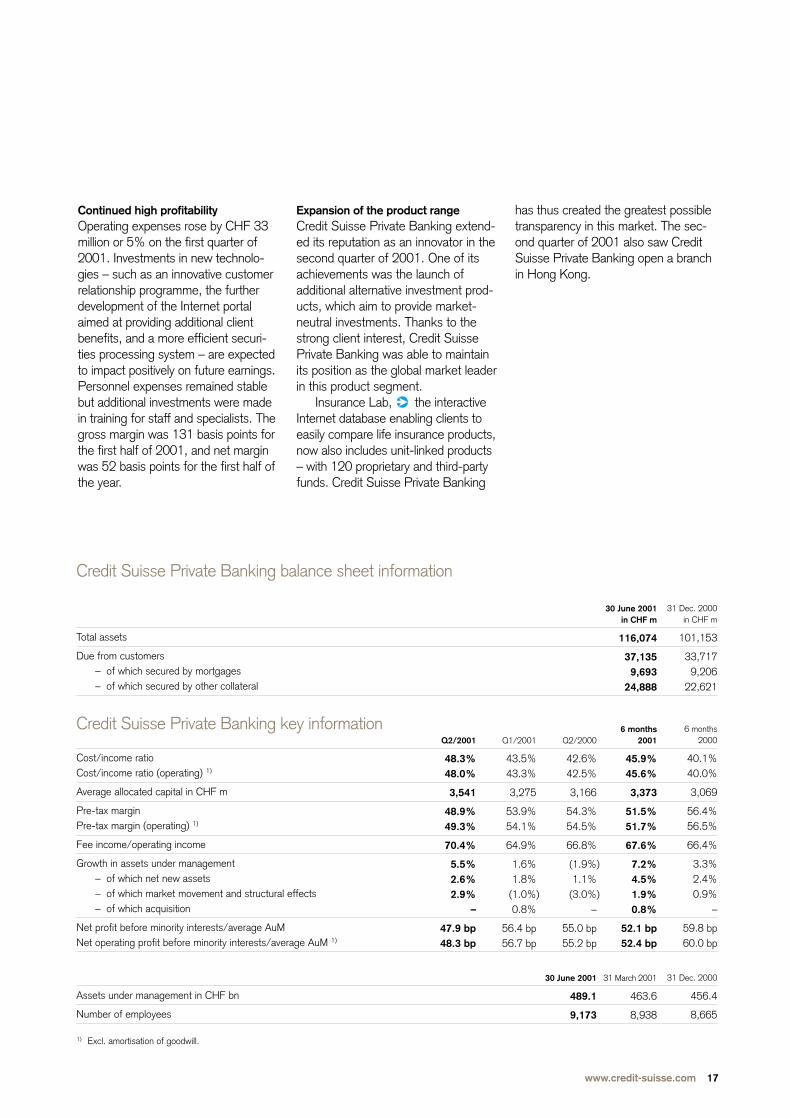
Continued high profitabilityOperating expenses rose by CHF 33million or 5% on the first quarter of2001. Investments in new technolo-gies – such as an innovative customerrelationship programme, the furtherdevelopment of the Internet portalaimed at providing additional clientbenefits, and a more efficient securi-ties processing system – are expectedto impact positively on future earnings.Personnel expenses remained stablebut additional investments were madein training for staff and specialists. Thegross margin was 131 basis points forthe first half of 2001, and net marginwas 52 basis points for the first half ofthe year.
Expansion of the product rangeCredit Suisse Private Banking extend-ed its reputation as an innovator in thesecond quarter of 2001. One of itsachievements was the launch ofadditional alternative investment prod-ucts, which aim to provide market-neutral investments. Thanks to thestrong client interest, Credit SuissePrivate Banking was able to maintainits position as the global market leaderin this product segment.
Insurance Lab, the interactiveInternet database enabling clients toeasily compare life insurance products,now also includes unit-linked products– with 120 proprietary and third-partyfunds. Credit Suisse Private Banking
has thus created the greatest possibletransparency in this market. The sec-ond quarter of 2001 also saw CreditSuisse Private Banking open a branchin Hong Kong.
Credit Suisse Private Banking balance sheet information
Total assets
Due from customers– of which secured by mortgages– of which secured by other collateral
Credit Suisse Private Banking key information
Cost/income ratioCost/income ratio (operating) 1)
Average allocated capital in CHF m
Pre-tax margin Pre-tax margin (operating) 1)
Fee income/operating income
Growth in assets under management– of which net new assets – of which market movement and structural effects– of which acquisition
Net profit before minority interests/average AuMNet operating profit before minority interests/average AuM 1)
Assets under management in CHF bn
Number of employees
1) Excl. amortisation of goodwill.
31 Dec. 2000in CHF m
101,153
33,7179,206
22,621
6 months2000
40.1%40.0%
3,069
56.4%56.5%
66.4%
3.3%2.4%0.9%
–
59.8 bp60.0 bp
31 Dec. 2000
456.4
8,665
30 June 2001in CHF m
116,074
37,1359,693
24,888
6 months2001
45.9%45.6%
3,373
51.5%51.7%
67.6%
) 7.2%4.5%
) 1.9%0.8%
52.1 bp52.4 bp
31 March 2001
463.6
8,938
Q2/2000
42.6%42.5%
3,166
54.3%54.5%
66.8%
(1.9%1.1%
) (3.0%–
55.0 bp55.2 bp
30 June 2001
489.1
9,173
Q1/2001
43.5%43.3%
3,275
53.9%54.1%
64.9%
1.6%1.8%
(1.0%0.8%
56.4 bp56.7 bp
Q2/2001
48.3%48.0%
3,541
48.9%49.3%
70.4%
5.5%2.6%2.9%
–
47.9 bp48.3 bp
www.credit-suisse.com 17

REVIEW OF BUSINESS UNITS
Credit Suisse Asset Management
18
Phillip M. ColebatchChief Executive Officer
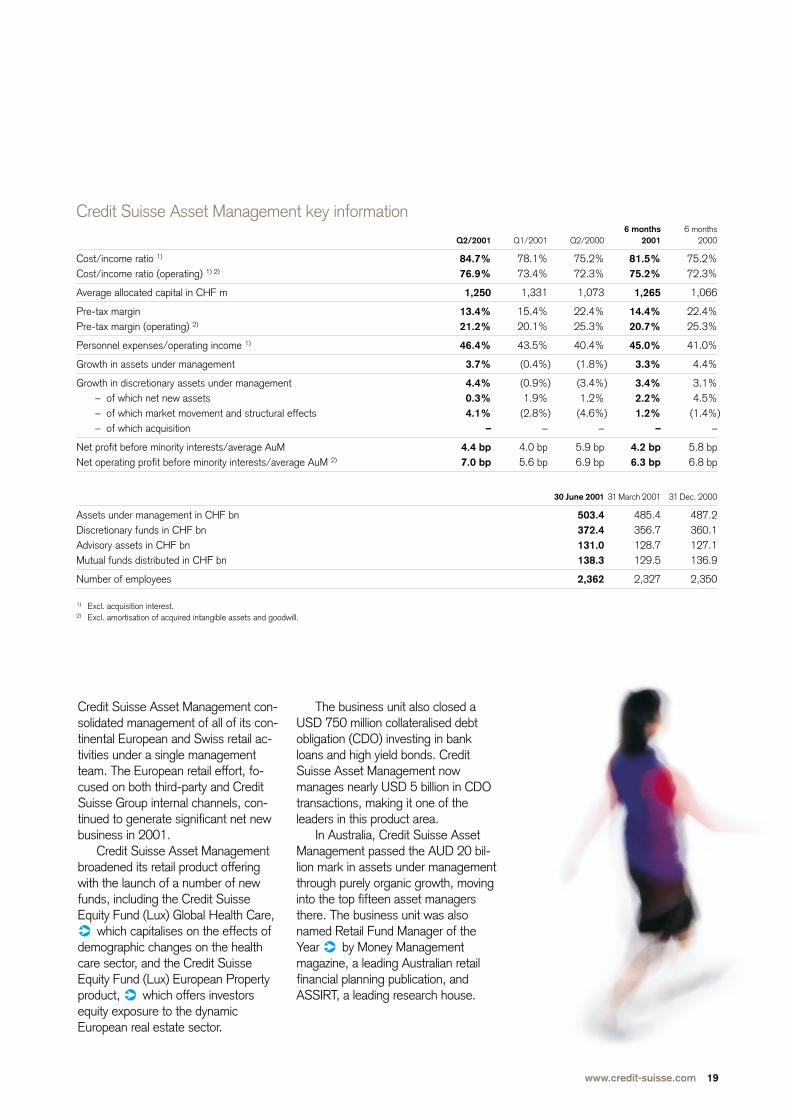
Credit Suisse Asset Management re-ported net operating profit of CHF 88million for the second quarter of 2001,up 29% on the first quarter. Net oper-ating profit for the first half was CHF156 million, up 3% on year. This re-silience in a difficult operating environ-ment has enabled Credit Suisse AssetManagement to continue advancing itsstrategic initiatives.
During the first half of 2001, assetsunder management rose from CHF487.2 billion as of 31 December 2000to CHF 503.4 billion as of 30 June2001, an increase of 3.3%.
Discretionary assets under man-agement rose 3.4% in the first half ofthe year to CHF 372.4 billion (CHF
360.1 billion as of 31 December2000). Of this increase, CHF 8.0 bil-lion or 2.2% was attributable to netnew discretionary assets.
Revenues of CHF 827 million forthe first six months of the year were10% higher than a year ago, primarilydue to the acquisition of DLJ’s AssetManagement Group in November2000. Adjusting for DLJ, revenueswould be down by approximately 2%.Operating expenses were 14% higherthan in the first half of 2000, againalmost entirely due to the DLJ-AMGacquisition. After adjusting for thiseffect, expenses would be running at a similar level to the previous year.
In order to accelerate the develop-ment of its retail business in Europe,
Credit Suisse Asset Management income statement 1)
Management and advisory feesNet mutual fund feesOther revenues 2)
Operating income 2)
Personnel expensesOther operating expenses
Operating expenses
Gross operating profit 2)
Depreciation and write-offs on non-current assets 3)
Valuation adjustments, provisions and losses
Profit before extraordinary items, acquisition impact, taxes
Extraordinary income/(expenses), netTaxes
Net operating profit before acquisition impact, minority interests
Acquisition interest Amortisation of retention payments, acquired intangible assets
and goodwill
Net profit before minority interests
Minority interests
Net profit
Net operating profit 3)
1) Certain reclassifications have been made to prior period amounts to conform to the current presentation.2) Excl. acquisition interest.3) Excl. amortisation of acquired intangible assets and goodwill.
Q2/2000in CHF m
3016810
379
153116
269
110
50
105
) 0) (19
86
9
11
66
0
66
77
Change in %6 months
2001/2000
13292
10
214
14
1
50–
(1
–) (62
12
83
136
(19
–
(19
3
)
)
)
)
6 months 2000
in CHF m
57315226
751
308225
533
218
100
208
) 0) (39
169
18
22
129
0
129
151
6 months2001
in CHF m
57720050
827
372235
607
220
150
205
(1) (15
189
33
52
104
0
104
156
Q2/2001in CHF m
28611029
425
197122
319
106
80
98
0(2
96
8
33
55
0
55
88
Q1/2001in CHF m
2919021
402
175113
288
114
70
107
(1) (13
93
25
19
49
0
49
68
Credit Suisse Asset Management key information
Cost/income ratio 1)
Cost/income ratio (operating) 1) 2)
Average allocated capital in CHF m
Pre-tax marginPre-tax margin (operating) 2)
Personnel expenses/operating income 1)
Growth in assets under management
Growth in discretionary assets under management– of which net new assets– of which market movement and structural effects– of which acquisition
Net profit before minority interests/average AuMNet operating profit before minority interests/average AuM 2)
Assets under management in CHF bnDiscretionary funds in CHF bn Advisory assets in CHF bn Mutual funds distributed in CHF bn
Number of employees
1) Excl. acquisition interest.2) Excl. amortisation of acquired intangible assets and goodwill.
6 months2000
75.2%72.3%
1,066
22.4%25.3%
41.0%
4.4%
3.1%4.5%
(1.4%–
5.8 bp6.8 bp
31 Dec. 2000
487.2360.1127.1136.9
2,350
)
6 months2001
81.5%75.2%
1,265
14.4%20.7%
45.0%
) 3.3%
) 3.4%2.2%
) 1.2%–
4.2 bp6.3 bp
31 March 2001
485.4356.7128.7129.5
2,327
Q2/2000
75.2%72.3%
1,073
22.4%25.3%
40.4%
) (1.8%
) (3.4%1.2%
) (4.6%–
5.9 bp6.9 bp
30 June 2001
503.4372.4131.0138.3
2,362
Q1/2001
78.1%73.4%
1,331
15.4%20.1%
43.5%
(0.4%
(0.9%1.9%
(2.8%–
4.0 bp5.6 bp
Q2/2001
84.7%76.9%
1,250
13.4%21.2%
46.4%
3.7%
4.4%0.3%4.1%
–
4.4 bp7.0 bp
Credit Suisse Asset Management con-solidated management of all of its con-tinental European and Swiss retail ac-tivities under a single managementteam. The European retail effort, fo-cused on both third-party and CreditSuisse Group internal channels, con-tinued to generate significant net newbusiness in 2001.
Credit Suisse Asset Managementbroadened its retail product offeringwith the launch of a number of newfunds, including the Credit SuisseEquity Fund (Lux) Global Health Care,
which capitalises on the effects ofdemographic changes on the healthcare sector, and the Credit SuisseEquity Fund (Lux) European Propertyproduct, which offers investorsequity exposure to the dynamicEuropean real estate sector.
The business unit also closed aUSD 750 million collateralised debtobligation (CDO) investing in bankloans and high yield bonds. CreditSuisse Asset Management nowmanages nearly USD 5 billion in CDOtransactions, making it one of theleaders in this product area.
In Australia, Credit Suisse AssetManagement passed the AUD 20 bil-lion mark in assets under managementthrough purely organic growth, movinginto the top fifteen asset managersthere. The business unit was alsonamed Retail Fund Manager of theYear by Money Managementmagazine, a leading Australian retailfinancial planning publication, andASSIRT, a leading research house.
www.credit-suisse.com 19
REVIEW OF BUSINESS UNITS
Credit Suisse First Boston
John J. MackChief Executive Officer
20
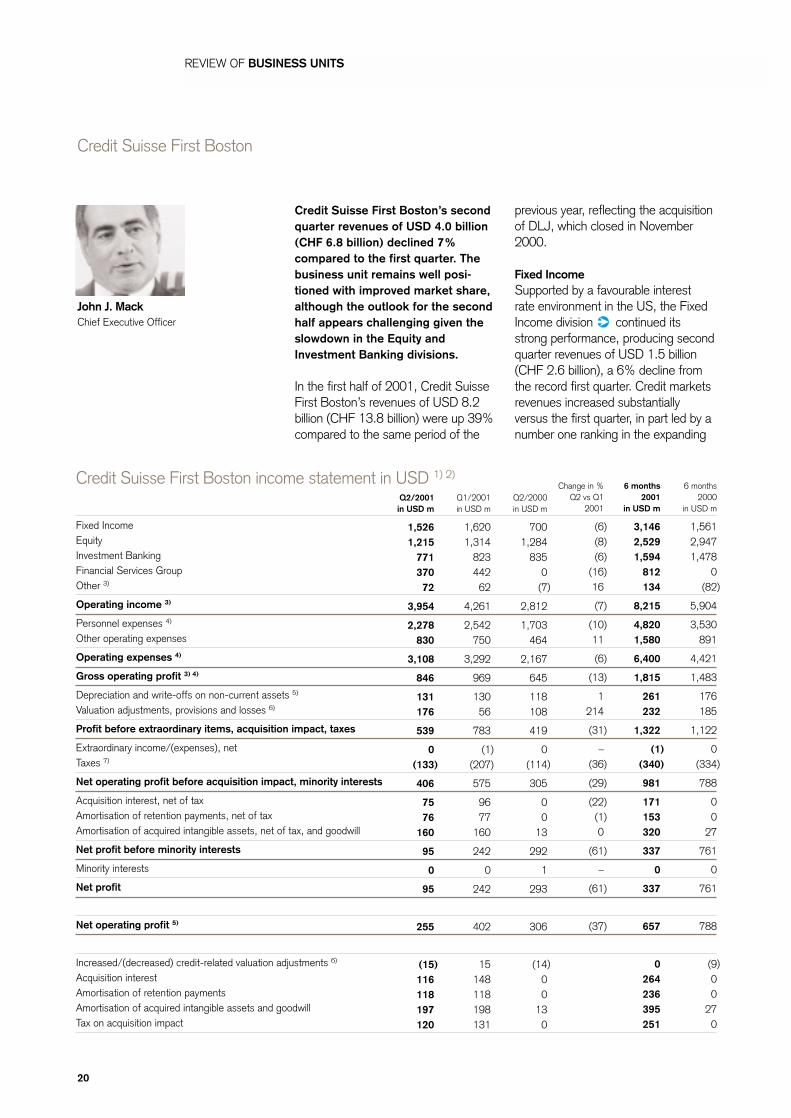
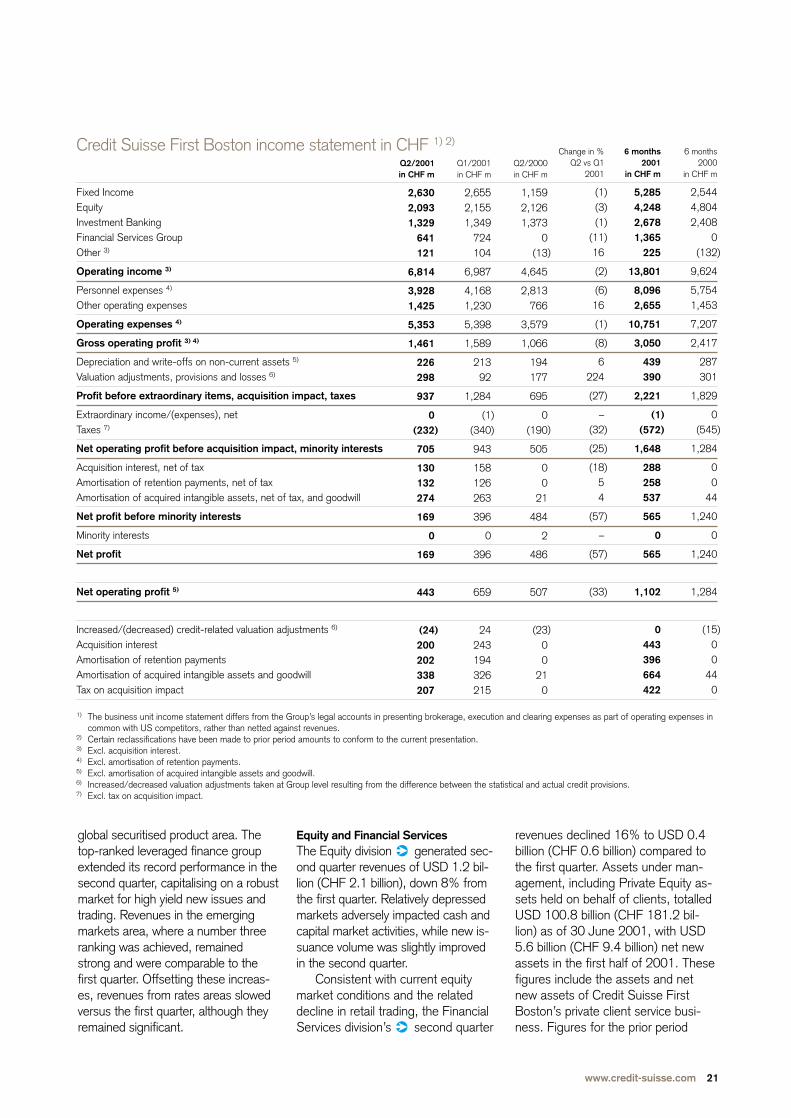
Credit Suisse First Boston’s secondquarter revenues of USD 4.0 billion(CHF 6.8 billion) declined 7%compared to the first quarter. Thebusiness unit remains well posi-tioned with improved market share,although the outlook for the secondhalf appears challenging given theslowdown in the Equity andInvestment Banking divisions.
In the first half of 2001, Credit SuisseFirst Boston’s revenues of USD 8.2billion (CHF 13.8 billion) were up 39%compared to the same period of the
previous year, reflecting the acquisitionof DLJ, which closed in November2000.
Fixed Income Supported by a favourable interest rate environment in the US, the FixedIncome division continued itsstrong performance, producing secondquarter revenues of USD 1.5 billion(CHF 2.6 billion), a 6% decline fromthe record first quarter. Credit marketsrevenues increased substantiallyversus the first quarter, in part led by anumber one ranking in the expanding
Credit Suisse First Boston income statement in USD 1) 2)
Fixed IncomeEquityInvestment BankingFinancial Services GroupOther 3)
Operating income 3)
Personnel expenses 4)
Other operating expenses
Operating expenses 4)
Gross operating profit 3) 4)
Depreciation and write-offs on non-current assets 5)
Valuation adjustments, provisions and losses 6)
Profit before extraordinary items, acquisition impact, taxes
Extraordinary income/(expenses), netTaxes 7)
Net operating profit before acquisition impact, minority interests
Acquisition interest, net of tax Amortisation of retention payments, net of tax Amortisation of acquired intangible assets, net of tax, and goodwill
Net profit before minority interests
Minority interests
Net profit
Net operating profit 5)
Increased/(decreased) credit-related valuation adjustments 6)
Acquisition interestAmortisation of retention paymentsAmortisation of acquired intangible assets and goodwillTax on acquisition impact
)
)
)
Q2/2000in USD m
7001,284
8350
(7
2,812
1,703464
2,167
645
118108
419
) 0) (114
305
00
13
292
1
293
306
(1400
130
Q1/2001in USD m
1,6201,314
82344262
4,261
2,542750
3,292
969
13056
783
(1) (207
575
9677
160
242
0
242
402
) 15148118198131
Q2/2001in USD m
1,5261,215
77137072
3,954
2,278830
3,108
846
131176
539
0(133
406
7576
160
95
0
95
255
(15116118197120
Change in %Q2 vs Q1
2001
(6(8(6
(16) 16
(7
(1011
(6
(13
1214
(31
–) (36
(29
(22(10
(61
–
(61
(37
)
6 months2000
in USD m
1,5612,9471,478
0(82
5,904
3,530891
4,421
1,483
176185
1,122
) 0) (334
788
00
27
761
0
761
788
(900
270
6 months 2001
in USD m
) 3,146) 2,529) 1,594) 812
134
) 8,215
) 4,8201,580
) 6,400
) 1,815
261232
) 1,322
(1) (340
) 981
) 171) 153
320
) 337
0
) 337
) 657
0264236395251
Credit Suisse First Boston income statement in CHF 1) 2)
Fixed IncomeEquityInvestment BankingFinancial Services GroupOther 3)
Operating income 3)
Personnel expenses 4)
Other operating expenses
Operating expenses 4)
Gross operating profit 3) 4)
Depreciation and write-offs on non-current assets 5)
Valuation adjustments, provisions and losses 6)
Profit before extraordinary items, acquisition impact, taxes
Extraordinary income/(expenses), netTaxes 7)
Net operating profit before acquisition impact, minority interests
Acquisition interest, net of tax Amortisation of retention payments, net of tax Amortisation of acquired intangible assets, net of tax, and goodwill
Net profit before minority interests
Minority interests
Net profit
Net operating profit 5)
Increased/(decreased) credit-related valuation adjustments 6)
Acquisition interestAmortisation of retention paymentsAmortisation of acquired intangible assets and goodwillTax on acquisition impact
1) The business unit income statement differs from the Group’s legal accounts in presenting brokerage, execution and clearing expenses as part of operating expenses incommon with US competitors, rather than netted against revenues.
2) Certain reclassifications have been made to prior period amounts to conform to the current presentation.3) Excl. acquisition interest.4) Excl. amortisation of retention payments.5) Excl. amortisation of acquired intangible assets and goodwill.6) Increased/decreased valuation adjustments taken at Group level resulting from the difference between the statistical and actual credit provisions.7) Excl. tax on acquisition impact.
Q2/2000in CHF m
1,1592,1261,373
0(13
4,645
2,813766
3,579
1,066
194177
695
) 0) (190
505
00
21
484
2
486
507
(2300
210
Change in % Q2 vs Q1
2001
(1(3(1
(11) 16
(2
(616
(1
(8
6224
(27
–) (32
(25
(1854
(57
–
(57
(33
)
6 months 2000
in CHF m
2,5444,8042,408
0(132
9,624
5,7541,453
7,207
2,417
287301
1,829
) 0) (545
1,284
00
44
1,240
0
1,240
1,284
(1500
440
6 months2001
in CHF m
) 5,285) 4,248) 2,678) 1,365
225
) 13,801
) 8,0962,655
) 10,751
) 3,050
439390
) 2,221
(1) (572
) 1,648
) 288258537
) 565
0
) 565
) 1,102
0443396664422
Q2/2001in CHF m
2,6302,0931,329
641121
6,814
3,9281,425
5,353
1,461
226298
937
0(232
705
130132274
169
0
169
443
(24200202338207
Q1/2001in CHF m
2,6552,1551,349
724104
6,987
4,1681,230
5,398
1,589
21392
1,284
(1) (340
943
158126263
396
0
396
659
) 24243194326215
)
)
)
global securitised product area. Thetop-ranked leveraged finance groupextended its record performance in thesecond quarter, capitalising on a robustmarket for high yield new issues andtrading. Revenues in the emergingmarkets area, where a number threeranking was achieved, remainedstrong and were comparable to thefirst quarter. Offsetting these increas-es, revenues from rates areas slowedversus the first quarter, although theyremained significant.
Equity and Financial Services The Equity division generated sec-ond quarter revenues of USD 1.2 bil-lion (CHF 2.1 billion), down 8% fromthe first quarter. Relatively depressedmarkets adversely impacted cash andcapital market activities, while new is-suance volume was slightly improvedin the second quarter.
Consistent with current equitymarket conditions and the relateddecline in retail trading, the FinancialServices division’s second quarter
revenues declined 16% to USD 0.4billion (CHF 0.6 billion) compared tothe first quarter. Assets under man-agement, including Private Equity as-sets held on behalf of clients, totalledUSD 100.8 billion (CHF 181.2 bil-lion) as of 30 June 2001, with USD5.6 billion (CHF 9.4 billion) net newassets in the first half of 2001. Thesefigures include the assets and netnew assets of Credit Suisse FirstBoston’s private client service busi-ness. Figures for the prior period
www.credit-suisse.com 21
REVIEW OF BUSINESS UNITS
31 Dec. 1999in CHF m
439,781
275,224
169,030134,40654,13223,7837,352
122,837
222,80267,1509,536
11069,55031,35712,455
1999
9,925
10,4949.9%
6.7%76.3%
19.0%
15,185
55.0%
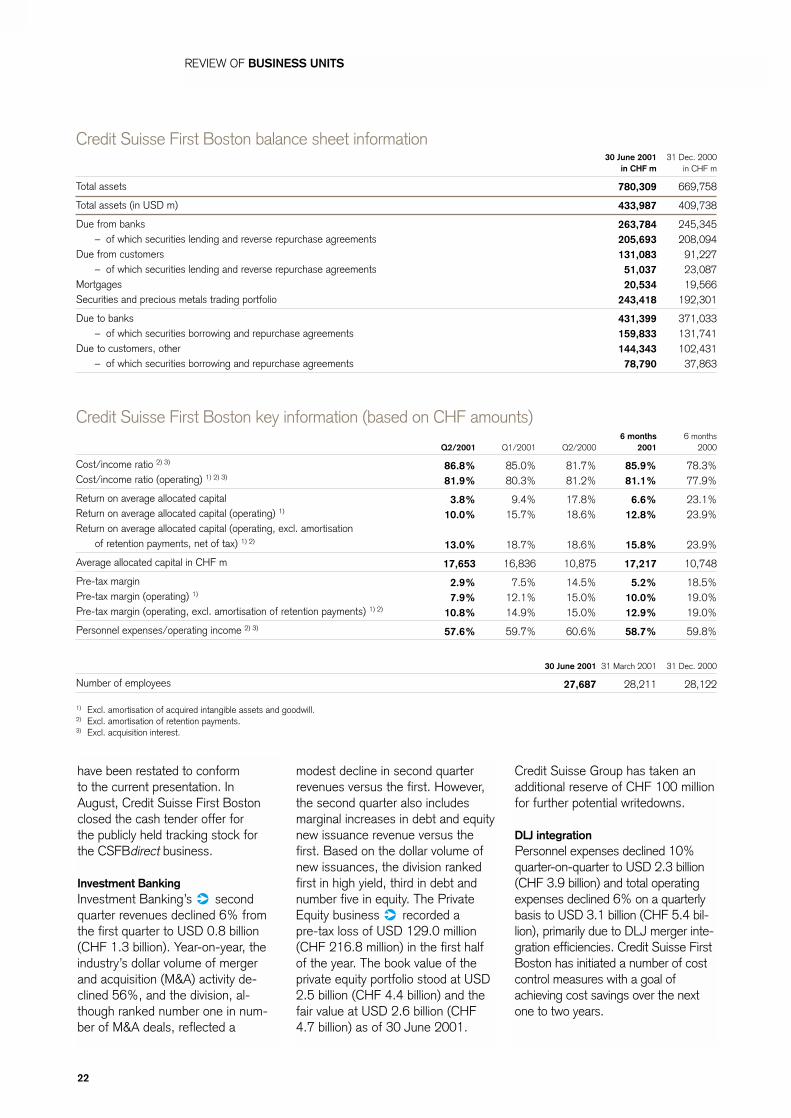
Credit Suisse First Boston balance sheet information
Total assets
Total assets (in USD m)
Due from banks– of which securities lending and reverse repurchase agreements
Due from customers– of which securities lending and reverse repurchase agreements
Mortgages Securities and precious metals trading portfolio
Due to banks– of which securities borrowing and repurchase agreements
Due to customers, other– of which securities borrowing and repurchase agreements
Credit Suisse First Boston key information (based on CHF amounts)
Cost/income ratio 2) 3)
Cost/income ratio (operating) 1) 2) 3)
Return on average allocated capitalReturn on average allocated capital (operating) 1)
Return on average allocated capital (operating, excl. amortisation of retention payments, net of tax) 1) 2)
Average allocated capital in CHF m
Pre-tax margin Pre-tax margin (operating) 1)
Pre-tax margin (operating, excl. amortisation of retention payments) 1) 2)
Personnel expenses/operating income 2) 3)
Number of employees
1) Excl. amortisation of acquired intangible assets and goodwill.2) Excl. amortisation of retention payments.3) Excl. acquisition interest.
31 Dec. 2000in CHF m
669,758
409,738
245,345208,09491,22723,08719,566
192,301
371,033131,741102,43137,863
6 months2000
78.3%77.9%
23.1%23.9%
23.9%
10,748
18.5%19.0%19.0%
59.8%
31 Dec. 2000
28,122
30 June 2001in CHF m
780,309
433,987
263,784205,693131,08351,03720,534
243,418
431,399159,833144,34378,790
6 months2001
85.9%81.1%
6.6%12.8%
15.8%
17,217
5.2%10.0%12.9%
58.7%
31 March 2001
28,211
Q2/2000
81.7%81.2%
17.8%18.6%
18.6%
10,875
14.5%15.0%15.0%
60.6%
30 June 2001
27,687
Q1/2001
85.0%80.3%
9.4%15.7%
18.7%
16,836
7.5%12.1%14.9%
59.7%
Q2/2001
86.8%81.9%
3.8%10.0%
13.0%
17,653
2.9%7.9%
10.8%
57.6%
have been restated to conform to the current presentation. InAugust, Credit Suisse First Bostonclosed the cash tender offer for the publicly held tracking stock for the CSFBdirect business.
Investment Banking Investment Banking’s secondquarter revenues declined 6% fromthe first quarter to USD 0.8 billion(CHF 1.3 billion). Year-on-year, theindustry’s dollar volume of mergerand acquisition (M&A) activity de-clined 56%, and the division, al-though ranked number one in num-ber of M&A deals, reflected a
22
modest decline in second quarterrevenues versus the first. However,the second quarter also includesmarginal increases in debt and equitynew issuance revenue versus thefirst. Based on the dollar volume ofnew issuances, the division rankedfirst in high yield, third in debt andnumber five in equity. The PrivateEquity business recorded a pre-tax loss of USD 129.0 million(CHF 216.8 million) in the first halfof the year. The book value of theprivate equity portfolio stood at USD2.5 billion (CHF 4.4 billion) and thefair value at USD 2.6 billion (CHF4.7 billion) as of 30 June 2001.
Credit Suisse Group has taken anadditional reserve of CHF 100 millionfor further potential writedowns.
DLJ integration Personnel expenses declined 10%quarter-on-quarter to USD 2.3 billion(CHF 3.9 billion) and total operatingexpenses declined 6% on a quarterlybasis to USD 3.1 billion (CHF 5.4 bil-lion), primarily due to DLJ merger inte-gration efficiencies. Credit Suisse FirstBoston has initiated a number of costcontrol measures with a goal ofachieving cost savings over the nextone to two years.

CONSOLIDATED RESULTS
Income statement 1)
Interest and discount incomeInterest and dividend income from trading portfoliosInterest and dividend income from financial investments Interest expenses
Net interest income
Commission income from lending activitiesCommissions from securities and investment transactionsCommissions from other servicesCommission expenses
Net commission and service fee income
Net trading income
Premiums earned, netClaims incurred and actuarial provisionsCommission expenses, netInvestment income from the insurance business
Net income from the insurance business
Income from the sale of financial investmentsIncome from investment activities
– from participations valued according to the equity method– from other non-consolidated participations
Real estate incomeSundry ordinary incomeSundry ordinary expenses
Other ordinary income/(expenses), net
Operating income
Personnel expensesOther operating expenses
Operating expenses
Gross operating profit
Depreciation and write-offs on non-current assetsAmortisation of goodwillValuation adjustments, provisions and losses from the banking business
Depreciation, valuation adjustments, losses
Profit before extraordinary items, taxes and minority interests
Extraordinary incomeExtraordinary expensesTaxes
Net profit before minority interests
Minority interests
Net profit
Net operating profit
1) Certain reclassifications have been made to prior period amounts to conform to the current presentation.2) For details of the changes to accounting policies, see inside cover.
Previouslyreported
6 months2000
in CHF m
11,4951,486
360) (11,010
2,331
3117,450
221) (447
7,535
5,396
13,992) (14,526) (1,061
4,356
2,761
19591771422
358) (841
) (175
17,848
8,9172,798
11,715
6,133
55983
606
1,248
4,885
44) (134) (1,084
3,711
) (101
3,610
3,693
New basis2)
Change in %6 months
2001/2000
2667
(41) 36
22
2315
234) (7
23
28
12) 6) 9
(4
23
251209
10025
(15) 42
) 14
24
3449
38
(2
120279
7
80
(24
21) (78) (17
(23
) 16
(24
(9
)
)
)
)
)
)
))
)
)
)
New basis 2)
6 months2000
in CHF m
13,1293,964
360) (14,872
2,581
3117,741
221) (491
7,782
4,901
14,958) (15,390) (1,038
4,255
2,785
19585751059
602) (1,066
) (125
17,924
8,9182,789
11,707
6,217
62594
606
1,325
4,892
43) (134) (1,098
3,703
) (113
3,590
3,684
6 months2001
in CHF m
16,5466,616
213) (20,224
3,151
3828,915
739) (455
9,581
6,265
16,811) (16,342) (1,127
4,077
3,419
684102822074
509) (1,512
) (143
22,273
11,9894,168
16,157
6,116
1,378356650
2,384
3,732
52) (30) (907
2,847
) (131
2,716
3,337
Q2/2000in CHF m
7,0372,449
213) (8,460
1,239
1633,868
113) (243
3,901
2,342
6,747) (6,754) (526
1,962
1,429
5854459
30313
) (618
(163
8,748
4,3901,393
5,783
2,965
37248
303
723
2,242
12) (66) (440
1,748
) (73
1,675
1,723
Q1/2001in CHF m
8,7402,673
108) (9,978
1,543
2214,505
380) (220
4,886
3,049
9,741) (9,093) (442
1,310
1,516
22076751
48330
) (577
) 97
11,091
6,0301,954
7,984
3,107
674170238
1,082
2,025
47) (25) (572
1,475
) (47
1,428
1,726
Q2/2001in CHF m
7,8063,943
105(10,246
1,608
1614,410
359(235
4,695
3,216
7,070(7,249
(6852,767
1,903
464267
1926
179(935
(240
11,182
5,9592,214
8,173
3,009
704186412
1,302
1,707
5(5
(335
1,372
(84
1,288
1,611
www.credit-suisse.com 23
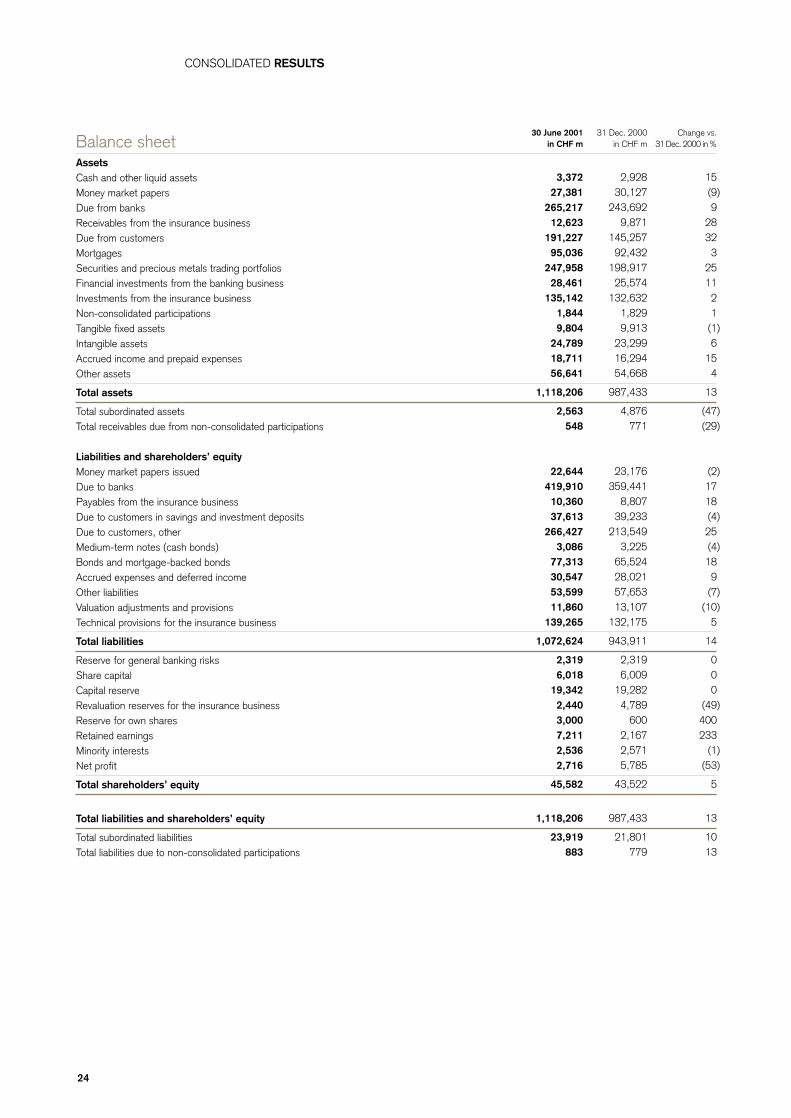
CONSOLIDATED RESULTS
Balance sheetAssetsCash and other liquid assets Money market papersDue from banksReceivables from the insurance businessDue from customers MortgagesSecurities and precious metals trading portfoliosFinancial investments from the banking businessInvestments from the insurance businessNon-consolidated participationsTangible fixed assetsIntangible assetsAccrued income and prepaid expensesOther assets
Total assets
Total subordinated assetsTotal receivables due from non-consolidated participations
Liabilities and shareholders’ equityMoney market papers issuedDue to banksPayables from the insurance businessDue to customers in savings and investment depositsDue to customers, otherMedium-term notes (cash bonds)Bonds and mortgage-backed bonds Accrued expenses and deferred income Other liabilitiesValuation adjustments and provisionsTechnical provisions for the insurance business
Total liabilities
Reserve for general banking risksShare capital Capital reserveRevaluation reserves for the insurance businessReserve for own sharesRetained earnings Minority interestsNet profit
Total shareholders’ equity
Total liabilities and shareholders’ equity
Total subordinated liabilitiesTotal liabilities due to non-consolidated participations
Change vs.31Dec. 2000 in%
15(99
28323
251121
(16
154
13
(47(29
(21718(425(4189
(7(10
5
14
000
(49400233
(1(53
5
13
1013
31 Dec. 2000in CHF m
2,92830,127
243,6929,871
145,25792,432
198,91725,574
132,6321,8299,913
23,29916,29454,668
987,433
4,876771
23,176359,441
8,80739,233
213,5493,225
65,52428,02157,65313,107
132,175
943,911
2,3196,009
19,2824,789
6002,1672,5715,785
43,522
987,433
21,801779
)
)
))
)
)
)
))
)
))
30 June 2001in CHF m
3,37227,381
265,21712,623
191,22795,036
247,95828,461
135,1421,8449,804
24,78918,71156,641
1,118,206
2,563548
22,644419,91010,36037,613
266,4273,086
77,31330,54753,59911,860
139,265
1,072,624
2,3196,018
19,3422,4403,0007,2112,5362,716
45,582
1,118,206
23,919883
24

Off-balance sheet businessContingent liabilitiesCredit guarantees in form of avals, guarantees
and indemnity liabilities Bid bonds, delivery and performance bonds,
letters of indemnity, other performance-related guarantees Irrevocable commitments in respect of documentary credits Other contingent liabilities
Total contingent liabilities
Irrevocable commitments
Liabilities for calls on shares and other equity
Confirmed credits
Fiduciary transactions
Derivative instrumentsInterest rate productsForeign exchange productsPrecious metals productsEquity/index-related productsOther products
Total derivative instruments
Change vs.31Dec.2000 in%
(1
07
(1
1
19
(55
(37
6
Negative grossreplacement
value31 Dec. 2000
in CHF bn
66.332.12.0
18.13.3
121.8
)
)
)
)
31 Dec. 2000in CHF m
7,013
4,8243,1425,026
20,005
126,998
305
150
41,974
Positive grossreplacement
value31 Dec. 2000
in CHF bn
66.430.41.5
15.22.7
116.2
30 June 2001in CHF m
6,956
4,8433,3545,000
20,153
151,428
136
95
44,365
Nominal value
31 Dec. 2000in CHF bn
5,793.31,139.4
34.8473.980.4
7,521.8
Negative grossreplacement
value30 June 2001
in CHF bn
74.936.92.1
14.83.1
131.8
Positive grossreplacement
value30 June 2001
in CHF bn
78.234.41.7
13.42.6
130.3
Nominalvalue
30 June 2001in CHF bn
6,932.81,579.8
37.7414.9112.1
9,077.3
Selected notes
USD translation ratesAverage rate year-to-dateClosing rate as of reporting period end
Securities and precious metals trading portfoliosDebt instruments
– listed on stock exchange– unlisted
Total debt instruments– of which own bonds and medium-term notes
Equity instruments– listed on stock exchange– unlisted
Total equity instruments– of which own shares
Precious metals
Total securities and precious metals trading portfolios
– of which securities rediscountable or pledgeable at central banks
Q2/2000
1.631.6342
Change vs. 31Dec.2000 in%
2852
4074
(4(3
(4(10(15
25
56
))
)))
Q4/2000
1.671.6346
31 Dec. 2000in CHF m
63,68465,678
129,362837
59,4548,081
67,5357,4742,020
198,917
72,618
Q1/2001
1.641.7325
30 June 2001in CHF m
81,66199,720
181,3811,459
57,0047,866
64,8706,7541,707
247,958
113,262
Q2/2001
1.681.7980
www.credit-suisse.com 25

CONSOLIDATED RESULTS
Split of income statementbanking/insurance1)
Net interest income Net commission and service fee incomeNet trading incomeIncome from the insurance business 2)
Other ordinary income/(expenses), net
Operating income
Personnel expenses 2)
Other operating expenses 2)
Operating expenses
Gross operating profit
Depreciation and write-offs on non-current assetsAmortisation of goodwillValuation adjustments, provisions and losses
Depreciation, valuation adjustments, losses
Profit before extraordinary items,taxes and minority interests
Extraordinary incomeExtraordinary expensesTaxes
Net profit before minority interests
Minority interests
Net profit
1) Income statements for the banking and insurance business are presented on a stand-alone basis.2) Insurance business: expenses due to the handling of both claims and investments are allocated to the income from the insurance business, of which: CHF 292 m
(6 months 2000: CHF 253 m) are related to personnel expenses and CHF 142 m (6 months 2000: CHF 170 m) to other expenses.
Statement of shareholders’ equityTotal shareholders’ equity as of 1 January 2001Dividends paidCapital increases, par value and capital surplusChanges in scope of consolidation affecting minority interestsForeign exchange impactChange in revaluation reserves from the insurance business, netMinority interest in net profitNet profit
Total shareholders’ equity as of 30 June 2001
in CHF m
43,522(144
70(13
1,733(2,433
1312,716
45,582
)
)
)
2000in CHF m
6182
(1,986911
(1190
0
(2)237
5,785
Banking business TotalInsurance business
6 months2001
in CHF m
3,1259,5906,265
0103
19,083
10,8503,461
14,311
4,772
1,142331650
2,123
2,649
17(30
(598
2,038
(55
1,983
6 months 2000
in CHF m
2,5817,7824,901
044
15,308
7,9572,137
10,094
5,214
49679
606
1,181
4,033
43) (134) (901
3,041
) (49
2,992
6 months2001
in CHF m
000
3,436(246
3,190
1,139707
1,846
1,344
236250
261
1,083
35) 0) (309
809
) (76
733
6 months2000
in CHF m
000
2,785) (169
2,616
961652
1,613
1,003
129150
144
859
00
) (197
662
) (64
598
6 months2001
in CHF m
3,1519,5816,2653,419
) (143
22,273
11,9894,168
16,157
6,116
1,378356650
2,384
3,732
52(30
) (907
2,847
) (131
2,716
6 months2000
in CHF m
2,5817,7824,9012,785
) (125
17,924
8,9182,789
11,707
6,217
62594
606
1,325
4,892
43) (134) (1,098
3,703
) (113
3,590
)
))
)
26
43,522
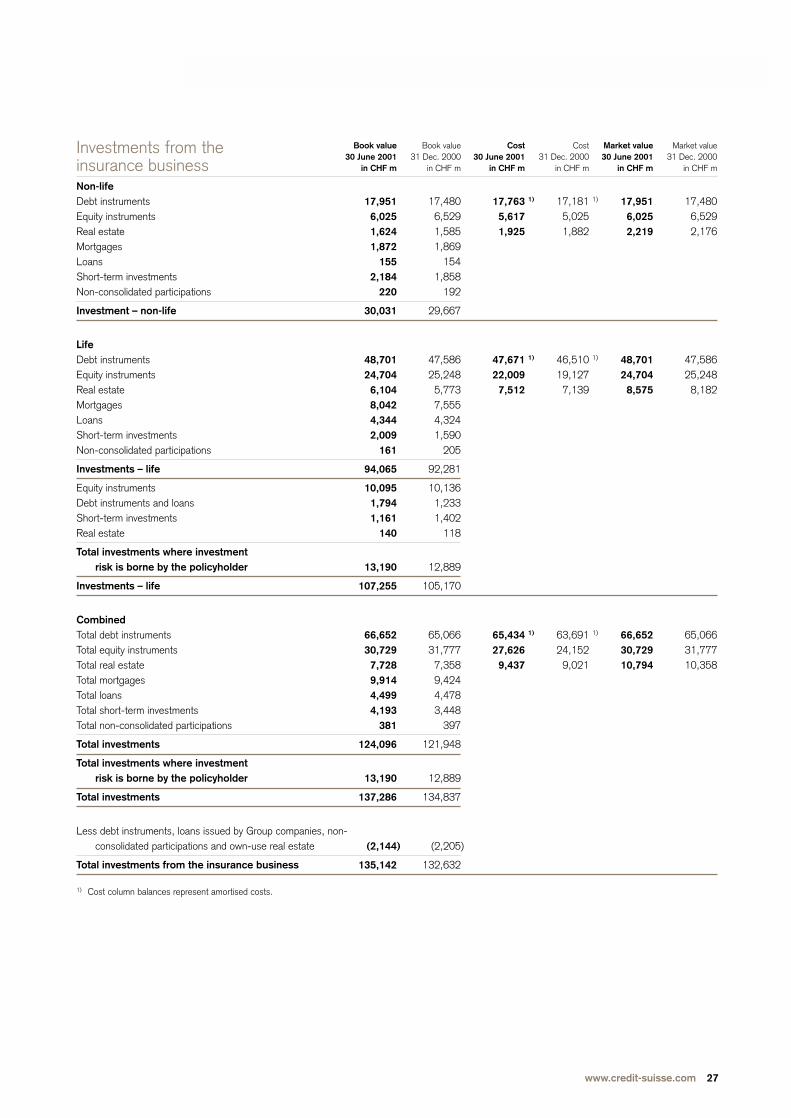
air Valuew basis1)
c. 1999 CHF m
6,5934,193
0,786
7,0482,199
9,247
2,2097,903
0,112
Investments from theinsurance businessNon-lifeDebt instrumentsEquity instrumentsReal estateMortgagesLoansShort-term investmentsNon-consolidated participations
Investment – non-life
LifeDebt instrumentsEquity instrumentsReal estateMortgagesLoansShort-term investmentsNon-consolidated participations
Investments – life
Equity instrumentsDebt instruments and loansShort-term investmentsReal estate
Total investments where investmentrisk is borne by the policyholder
Investments – life
CombinedTotal debt instrumentsTotal equity instrumentsTotal real estateTotal mortgagesTotal loansTotal short-term investmentsTotal non-consolidated participations
Total investments
Total investments where investmentrisk is borne by the policyholder
Total investments
Less debt instruments, loans issued by Group companies, non-consolidated participations and own-use real estate
Total investments from the insurance business
1) Cost column balances represent amortised costs.
Market value31 Dec. 2000
in CHF m
17,4806,5292,176
47,58625,2488,182
65,06631,77710,358
FNe
31 Dein
14
6
2
2
1
Market value30 June 2001
in CHF m
1) 17,9516,0252,219
1) 48,70124,7048,575
1) 66,65230,72910,794
Cost31 Dec. 2000
in CHF m
1) 17,1815,0251,882
1) 46,51019,1277,139
1) 63,69124,1529,021
Cost30 June 2001
in CHF m
17,7635,6171,925
47,67122,0097,512
65,43427,6269,437
)
Book value30 June 2001
in CHF m
17,9516,0251,6241,872
1552,184
220
30,031
48,70124,7046,1048,0424,3442,009
161
94,065
10,0951,7941,161
140
13,190
107,255
66,65230,7297,7289,9144,4994,193
381
124,096
13,190
137,286
(2,144
135,142
Book value31 Dec. 2000
in CHF m
17,4806,5291,5851,869
1541,858
192
29,667
47,58625,2485,7737,5554,3241,590
205
92,281
10,1361,2331,402
118
12,889
105,170
65,06631,7777,3589,4244,4783,448
397
121,948
12,889
134,837
) (2,205
132,632
www.credit-suisse.com 27
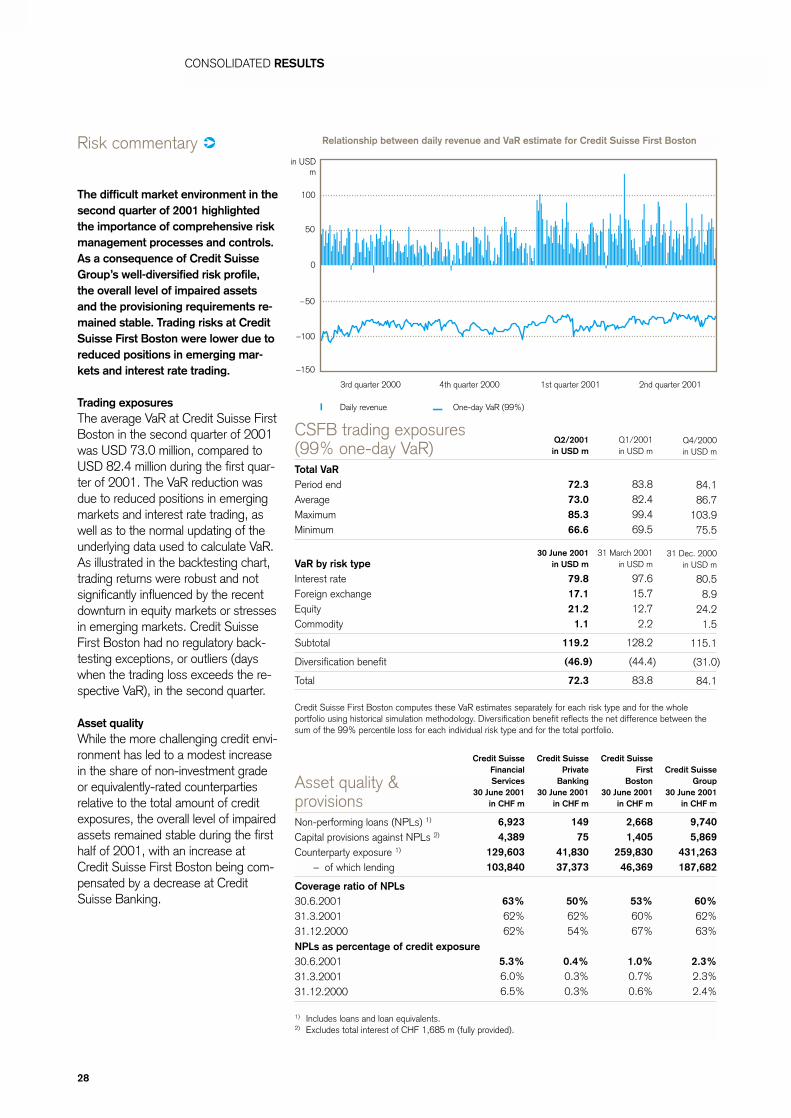
CONSOLIDATED RESULTS
Risk commentary
The difficult market environment in thesecond quarter of 2001 highlightedthe importance of comprehensive riskmanagement processes and controls.As a consequence of Credit SuisseGroup’s well-diversified risk profile,the overall level of impaired assetsand the provisioning requirements re-mained stable. Trading risks at CreditSuisse First Boston were lower due toreduced positions in emerging mar-kets and interest rate trading.
Trading exposures The average VaR at Credit Suisse FirstBoston in the second quarter of 2001was USD 73.0 million, compared toUSD 82.4 million during the first quar-ter of 2001. The VaR reduction wasdue to reduced positions in emergingmarkets and interest rate trading, aswell as to the normal updating of theunderlying data used to calculate VaR.As illustrated in the backtesting chart,trading returns were robust and notsignificantly influenced by the recentdownturn in equity markets or stressesin emerging markets. Credit SuisseFirst Boston had no regulatory back-testing exceptions, or outliers (dayswhen the trading loss exceeds the re-spective VaR), in the second quarter.
Asset quality While the more challenging credit envi-ronment has led to a modest increasein the share of non-investment gradeor equivalently-rated counterpartiesrelative to the total amount of creditexposures, the overall level of impairedassets remained stable during the firsthalf of 2001, with an increase atCredit Suisse First Boston being com-pensated by a decrease at CreditSuisse Banking.
28
Asset quality &provisionsNon-performing loans (NPLs) 1)
Capital provisions against NPLs 2)
Counterparty exposure 1)
– of which lending
Coverage ratio of NPLs30.6.200131.3.200131.12.2000NPLs as percentage of credit exposure30.6.200131.3.200131.12.2000
1) Includes loans and loan equivalents.2) Excludes total interest of CHF 1,685 m (fully provided).
Credit SuisseGroup
30 June 2001in CHF m
9,7405,869
431,263187,682
60%62%63%
2.3%2.3%2.4%
113,4131,8198,889,7
Credit SuisseFirst
Boston30 June 2001
in CHF m
2,6681,405
259,83046,369
53%60%67%
1.0%0.7%0.6%
4,1
113,5
201,9
Credit SuissePrivate
Banking30 June 2001
in CHF m
14975
41,83037,373
50%62%54%
0.4%0.3%0.3%
3rd quarter 2000 4th quarter 2000 1st quarter 2001 2nd quarter 2001
Daily revenue One-day VaR (99%)
Relationship between daily revenue and VaR estimate for Credit Suisse First Boston
Credit Suisse FinancialServices
30 June 2001in CHF m
6,9234,389
129,603103,840
63%62%62%
5.3%6.0%6.5%
CSFB trading exposures (99% one-day VaR)Total VaRPeriod endAverageMaximumMinimum
VaR by risk typeInterest rateForeign exchangeEquityCommodity
Subtotal
Diversification benefit
Total
Credit Suisse First Boston computes these VaR estimates separately for each risk type and for the wholeportfolio using historical simulation methodology. Diversification benefit reflects the net difference between thesum of the 99% percentile loss for each individual risk type and for the total portfolio.
Q4/2000in USD m
84.186.7
103.975.5
31 Dec. 2000in USD m
80.58.9
24.21.5
115.1
) (31.0
84.1
)
Q1/2001in USD m
83.882.499.469.5
31 March 2001in USD m
97.615.712.72.2
128.2
) (44.4
83.8
Q2/2001in USD m
72.373.085.366.6
30 June 2001in USD m
79.817.121.21.1
119.2
(46.9
72.3
in USD m
100
50
0
–50
–100
–150
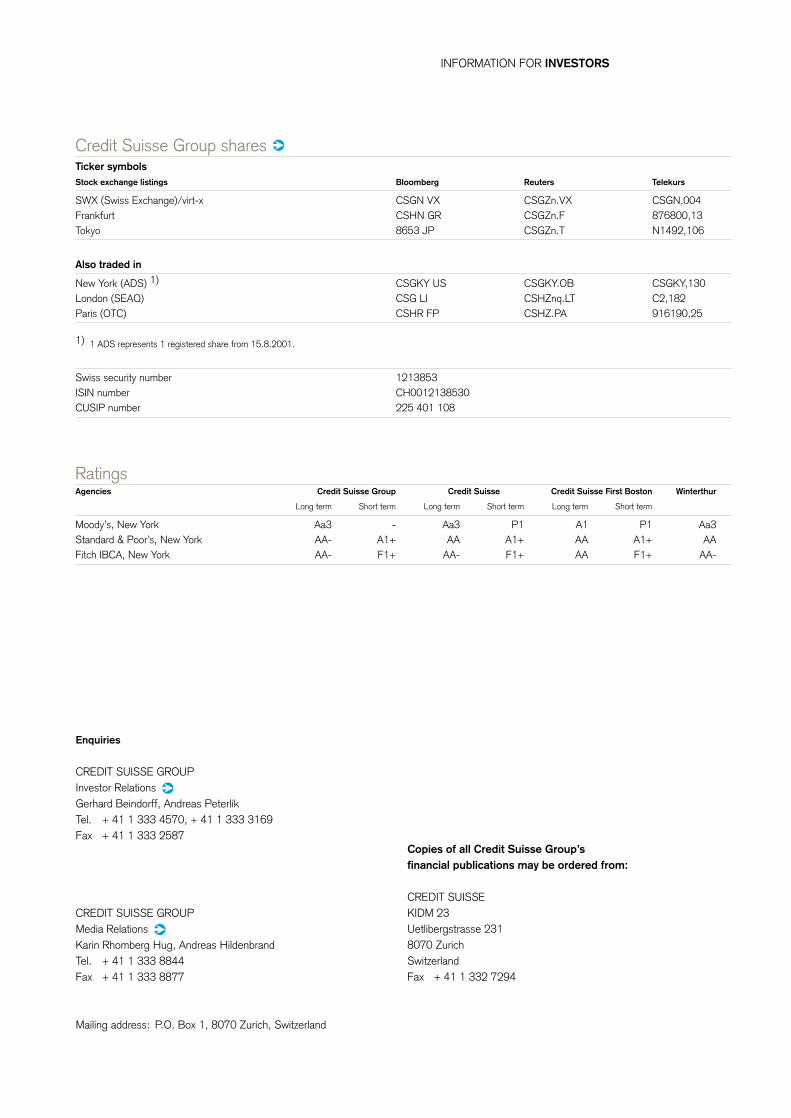
INFORMATION FOR INVESTORS
Credit Suisse Group shares Ticker symbolsStock exchange listings Bloomberg Reuters Telekurs
SWX (Swiss Exchange)/virt-x CSGN VX CSGZn.VX CSGN,004Frankfurt CSHN GR CSGZn.F 876800,13Tokyo 8653 JP CSGZn.T N1492,106
Also traded in
New York (ADS) 1) CSGKY US CSGKY.OB CSGKY,130London (SEAQ) CSG LI CSHZnq.LT C2,182Paris (OTC) CSHR FP CSHZ.PA 916190,25
1) 1 ADS represents 1 registered share from 15.8.2001.
Swiss security number 1213853 ISIN number CH0012138530 CUSIP number 225 401 108
RatingsAgencies Credit Suisse Group Credit Suisse First Boston Winterthur
Long term Short term Long term Short term Long term Short term
Moody’s, New York Aa3 - Aa3 P1 A1 P1 Aa3Standard & Poor’s, New York AA- A1+ AA A1+ AA A1+ AAFitch IBCA, New York AA- F1+ AA- F1+ AA F1+ AA-
Credit Suisse
CREDIT SUISSE GROUPMedia RelationsKarin Rhomberg Hug, Andreas HildenbrandTel. + 41 1 333 8844 Fax + 41 1 333 8877
Mailing address: P.O. Box 1, 8070 Zurich, Switzerland
Enquiries
CREDIT SUISSE GROUPInvestor RelationsGerhard Beindorff, Andreas PeterlikTel. + 41 1 333 4570, + 41 1 333 3169Fax + 41 1 333 2587
Copies of all Credit Suisse Group’s financial publications may be ordered from:
CREDIT SUISSEKIDM 23Uetlibergstrasse 2318070 ZurichSwitzerlandFax + 41 1 332 7294