Credit Risk in the Leasing Business
34
Credit Risk in the Leasing Business - A case study of low probability of default - by Mathias SCHMIT & DEGOUYS C. – DELZELLE D. – STUYCK J. – WAUTELET F. 1 Université Libre de Bruxelles, Solvay Business School LEASEUROPE 2 Final Version – April 3, 2003 Abstract The process of review of both the Basel Capital Adequacy Accord and the EU New Capital Adequacy Framework is now entering its final phase. Although leasing falls within the scope of the Basel Committee’s proposals for measuring appropriate capital requirements, little is known empirically about the credit risk associated with leasing. Many studies have recently been conducted in order to measure credit risk and assess the implications of the Basel Committee’s proposals, but none has considered certain distinctive characteristics of the leasing segment, such as physical collaterals. In this context, the present paper examines the credit risk associated with the lease portfolios of a major European financial institution. Furthermore, it analyses whether or not a capital allocation gain derived from a corporate/retail distinction (applied to the exposures of the portfolios) might exist. All the research has been conducted on the basis of data directly provided by the financial institution on a set of 40,721 individual leases concerning two different kinds of leased asset (automotive and equipment). The study first estimates and analyses credit risk and its components (probability of default, recovery rates of defaulted leases and exposures at default). To estimate credit risk, a re-sampling method called the bootstrap is used to compute loss distributions and determine the 99.9 th percentile. Secondly, these estimations are compared with the three approaches proposed by the New Accord to determine risk-weights: the Standardised Approach, the Internal Rating-Based (IRB) Foundation Approach and the IRB Advanced Approach. The comparison includes consideration of the distinction between retail and corporate exposures so as to analyse the differences in capital requirement gain. The results confirm that leasing is a low-risk activity and show that physical collaterals play a major role in reducing credit risk in the case of lease portfolios. The IRB Advanced Approach seems to be the most appropriate, but significant differences still exist between estimations of credit risk. Furthermore, it appears that drawing the corporate/retail distinction leads to gains in terms of capital allocation. 1 Very special thanks to Marie-Paule Laurent. 2 LEASEUROPE is the European Federation of Leasing Company Associations, with currently 25 National Member Associations comprising more than 1,150 individual leasing companies in Europe.
Transcript of Credit Risk in the Leasing Business

Credit Risk in the Leasing Business
- A case study of low probability of default -
by Mathias SCHMIT
& DEGOUYS C. – DELZELLE D. – STUYCK J. – WAUTELET F. 1
Université Libre de Bruxelles, Solvay Business School
LEASEUROPE2
Final Version – April 3, 2003
Abstract The process of review of both the Basel Capital Adequacy Accord and the EU New Capital Adequacy Framework is now entering its final phase. Although leasing falls within the scope of the Basel Committee’s proposals for measuring appropriate capital requirements, little is known empirically about the credit risk associated with leasing. Many studies have recently been conducted in order to measure credit risk and assess the implications of the Basel Committee’s proposals, but none has considered certain distinctive characteristics of the leasing segment, such as physical collaterals. In this context, the present paper examines the credit risk associated with the lease portfolios of a major European financial institution. Furthermore, it analyses whether or not a capital allocation gain derived from a corporate/retail distinction (applied to the exposures of the portfolios) might exist. All the research has been conducted on the basis of data directly provided by the financial institution on a set of 40,721 individual leases concerning two different kinds of leased asset (automotive and equipment). The study first estimates and analyses credit risk and its components (probability of default, recovery rates of defaulted leases and exposures at default). To estimate credit risk, a re-sampling method called the bootstrap is used to compute loss distributions and determine the 99.9th percentile. Secondly, these estimations are compared with the three approaches proposed by the New Accord to determine risk-weights: the Standardised Approach, the Internal Rating-Based (IRB) Foundation Approach and the IRB Advanced Approach. The comparison includes consideration of the distinction between retail and corporate exposures so as to analyse the differences in capital requirement gain. The results confirm that leasing is a low-risk activity and show that physical collaterals play a major role in reducing credit risk in the case of lease portfolios. The IRB Advanced Approach seems to be the most appropriate, but significant differences still exist between estimations of credit risk. Furthermore, it appears that drawing the corporate/retail distinction leads to gains in terms of capital allocation.
1 Very special thanks to Marie-Paule Laurent. 2 LEASEUROPE is the European Federation of Leasing Company Associations, with currently 25 National Member Associations comprising more than 1,150 individual leasing companies in Europe.

Credit Risk in the Leasing Business - A case study of low probability of default 5
The low probabilities of default which characterise our database imply that weak variations in probability of default lead to big swings in terms of capital requirement. The capital requirement levels observed in the studied institution are low, but it should be noted that they are particularly sensitive to changes in probability of default. In the light of our findings, it might be essential to amend the Basel proposal to prevent undue differences in regulatory capital requirements, and hence competitive distortions, resulting from the adoption of one or the other approach. With this aim in mind, and in order to provide some additional observations which strengthen our conclusions, the position paper sent by Leaseurope to all its members on 7 February 2003, dealing with the refinement and calibration of the new Basel proposal, is attached as an appendix to the present study.

Credit Risk in the Leasing Business - A case study of low probability of default 6
CONTENTS
Introduction .............................................................................................................................. 7
1. Methodology for the estimation of credit risk..................................................................... 8 1.1 Measuring probability of default ......................................................................................... 8 1.2 Determination of recovery, loss-given-default and loss rates............................................... 8 1.3 Measuring exposure at default ............................................................................................ 9 1.4 Calculation of loss distribution ........................................................................................... 9
2. The data ............................................................................................................................... 11
3. The results ........................................................................................................................... 14 3.1 Probability of default ........................................................................................................ 14 3.2 Recovery rate.................................................................................................................... 14 3.3 Loss distribution............................................................................................................... 16
4. Discussion ........................................................................................................................... 19 4.1 Sample Bias ...................................................................................................................... 19 4.2 Assumptions..................................................................................................................... 19 4.3 Sub-portfolio size and diversification................................................................................ 20
5. Comparison with the Basel Accords (QIS 3). Regulatory implications ......................... 21 5.1 Overview of the approaches proposed by the Basel Committee ....................................... 21 5.2 Comparison between the capital requirements derived from the proposed internal model and those derived from capital regulation ............................................................................... 25 5.3 Regulatory implications .................................................................................................... 32
Conclusion............................................................................................................................... 34
References ............................................................................................................................... 35 Appendix

Credit Risk in the Leasing Business - A case study of low probability of default 7
Introduction With a view to improving monetary and financial stability, in June 1999 the Basel Committee issued a consultative document on a new Capital Adequacy framework to replace the 1988 Accord. The document provides new approaches to capital adequacy which are more comprehensive and more sensitive to risks. A further consultative document, the Third Quantitative Impact Study (QIS 3), launched on 1st October 2002, focuses on the proposed minimum capital requirements of the new Basel Capital Accord, which will be published by the end of 2003 and implemented by the end of 2006. Three methods are proposed for financial institutions to determine risk-weights: the Standardised Approach, the Internal Rating-Based (IRB) Foundation Approach and the IRB Advanced Approach. In the context of the current review process, this paper aims, firstly, to provide a better understanding of the credit risk associated with leasing portfolios in order to determine the most effective approach. The second goal of this study is to estimate the potential gain in terms of capital allocation by establishing a distinction between corporate and retail exposures. A particular feature of the studied financial institution is that its leasing portfolio presents low probabilities of default. The implications of this fact for capital allocation will also be considered in the present study. All the research has been carried out on the basis of data directly provided by the financial institution on a portfolio of 40,721 individual leases concerning two different kinds of leased asset (automotive and equipment). In the following, Section 1 outlines the methodology used to estimate the default rate and losses given default as well as the re-sampling technique for the calculation of loss distribution tails. Section 2 describes the database. Section 3 provides the empirical results, which are discussed at some length in Section 4. Section 5 provides a comparison between the capital requirements derived from the proposed internal model and those derived from New Basel Accord. It then focuses on the potential gain resulting from a distinction between corporate and retail exposures, and this is followed by a discussion of regulatory implications. A position paper concerning the refinement and calibration of the new Basel proposal was sent by Leaseurope to all its members on 7 February 2003. This is included as an appendix since it provides some additional observations and strengthens the conclusions drawn in the present study.

Credit Risk in the Leasing Business - A case study of low probability of default 8
1. Methodology for the estimation of credit risk In the leasing industry, credit risk is generally defined as the risk of losses generated by the default of the lessee. Theoretically it is estimated by a loss distribution calibrated at the 99.9th percentile. This section outlines the methodologies used to measure the three components of credit risk (the probability of default, the recovery rates of defaulted leases, and the exposures at default) which will be used to build loss distributions.
1.1 Measuring probability of default Lease contracts specify penalties and the conditions under which the lessee is considered to be in default. The contracts will be defined as defaulted when the company has decided to cancel the agreement because the lessee has not paid the scheduled rentals (interests and/or principal). ‘Defaulted’ does not refer to an interruption of the contracts for any other reason. If the lessee were to surrender the lease, the lessor would recover the leased good. As for other unfulfilled obligations, the lessor would be treated like any other creditor as far as the economic loss, unpaid rentals, unpaid fees, and the loss of potential earnings on rentals are concerned. To estimate probability of default, we use the concept of mortality rate introduced by Altman (1989). His approach is based on the method used by actuaries to assess the mortality of human beings. Altman defined the marginal mortality rate [MMR(t)] and the cumulative mortality rate [CMR(T)] over a specific period of time (1,2,..., T years) for bonds. These rates have been transposed for leases. They are expressed in Equations 1 and 2 below. To determine the marginal mortality rate after T years, one takes the number of lease contracts issued in year x00 and defaulted in year x00 + T, the number of lease contracts issued in x01 and defaulted in year x01 + T, and so on. Afterwards, the number obtained is divided by the number of lease contracts respectively in force in x00 + T, x01 + T, etc. MMR (T) = Number of defaulted lease contracts after T years (1) Number of leases in force at the start of Tth year and CMR (T) = 1 - Πt=1
T SR(t) where SR(t) is the survival rate in t, [1-MMR(t)] (2) This method takes into account the fact that the risk associated with lease contracts can vary through time until maturity. The probability of default for different time-horizons is then measured.
1.2 Determination of recovery, loss-given-default and loss rates Recovery rates are calculated, starting from individual defaulted lease contracts, as the discounted amounts recovered in comparison with the outstanding amount on the date of default (see Equation 3 below). In calculating the discounted value at the default date, a conservative discount rate of 10% is used. Recovery rate = Discounted amounts recovered (3) Outstanding amount at default

Credit Risk in the Leasing Business - A case study of low probability of default 9
Loss given default for a contract is defined as the product of the outstanding amount at default by the factor one minus the recovery rate (see Equation 4 below)3. Loss given default = Outstanding amount at default × (1 – Recovery rate) (4) Loss given default can be either positive or negative. In the latter case, it means that the recovery rate is higher than 100%. Loss rate for a given sub-portfolio is the sum of all individual losses given default divided by the total exposed outstanding amounts belonging to that sub-portfolio (see Equation 5). Loss rate = Σ individual loss given default (5) total exposed outstanding Sub-portfolios include all leases pooled according to the asset category (automotive or equipment) and the age (term-to-maturity). Note that this segmentation fulfils the Basel Committee’s exposure assignment requirements, given that the asset category and the age of the contracts are transaction risk characteristics which influence exposures at default, recovery rates and losses given default (and thus the collateral’s value).
1.3 Measuring exposure at default Exposure at default (EAD) is defined as the total exposed outstanding. It is calculated as the product between the total initial value and a depreciation rate, both estimated for each sub-portfolio (see Equation 6). EAD = total initial value × depreciation rate (6) The total initial value is the average initial value times the number of contracts, for the considered sub-portfolio. The depreciation rate is estimated as the ratio of the average outstanding value at term of the defaulted contracts to the average initial value of the defaulted contracts, for the considered sub-portfolio.
1.4 Calculation of loss distribution In the present empirical study, the loss distribution of a sub-portfolio is estimated by a non-parametric simulation, namely a form of re-sampling known as the ‘bootstrap technique’. This technique offers two advantages: it is based only on historical data and makes no assumptions about the distribution of the components of credit-risk modelling. Furthermore, the difficulty of modelling the default rate, which is generally a major problem in credit-risk assessment, is avoided.
3 In the present study, LGD = 1 – Recovery rate.

Credit Risk in the Leasing Business - A case study of low probability of default 10
For a given sub-portfolio of our database, the basic process consists of choosing randomly a year to constitute a portfolio of n leases, also chosen at random, inside that year. The draw of any particular year can be interpreted as a draw from the best available representation of the potential macroeconomic conditions influencing the risk factor. The assumption is that each year has the same probability of being drawn (e.g. as we have 5 observation years, each year has a probability of 1/5 of being drawn). When a non-defaulted lease or a contract in force is drawn, the associated loss is zero. When the draw is related to a default, the associated loss is the loss given default (see 1.2 Determination of recovery, loss-given-default and loss rate).4 A single iteration i of the procedure yields a loss rate for a given state of the economy (or a given year). This basic process is iterated i times to build up a probability distribution of loss rates. In our case, we ran the simulation procedure for portfolios consisting of 500 - 1,000 - 2,000 – 4,000 – 6,000 and 8,000 lease contracts (n) by carrying out 50,000 iterations (i). Statistical summaries of the expected and total losses for the 95th, 99th, 99.5th and 99.9th percentiles of each sub-portfolio are reported in Table 6 and Table 8 below. Finally, the 99.9th percentile gives for each sub-portfolio an estimation of its credit risk.
4 Consequently, the inputs are constituted as tables of 5 columns (one for each year). The number of lines depends on the number of contracts in force at the end of the year and completed or in default during that year. All contracts within a sub-portfolio present the same characteristics in respect of category and age.

Credit Risk in the Leasing Business - A case study of low probability of default 11
2. The data The studied financial institution provided information about a set of 46,006 individual lease contracts. 5,285 contracts were deleted for one or both of the following reasons:
- some information required to apply the previously defined methodology was missing5. - only contracts in force and terminated between 1st January 1997 and 31 December 2001
are considered in this study 6. The net database consists of 40,721 individual lease contracts, including:
- a set of 19,824 individual lease contracts terminated between 1997 and 2001, which contains all the relevant information concerning the leases throughout their life. The available variables can be classified into two categories: ex-ante and ex-post. Ex-ante variables are the market category, the start date, the original value, the leasing period, the term date, the term period and the turnover of the customer (incomplete). As regards ex-post variables, we consider the final status of the contract (completed or defaulted), the outstanding at term and some specific information for the defaulted contracts (the default date, the time to default, the recovery date, the recovery value, the charge off date, and the time from default to charge off).
- a set of 20,897 contracts indicating the number of leases in force on 31 October 2001, which enables us to determine the number of leases in force during the studied period. This is essential to compute the loss rate distribution. For these contracts, no information was provided about the ex-ante and ex-post variables.
Table 1 shows a set of descriptive statistics about the sample of 19,824 individual lease contracts terminated between 1997 and 2001. Panels A, B, C, D, E and F respectively provide the frequency distribution of the type of leased asset, the start date of the lease, the leasing period of the lease, the term date of the lease, the original value of the lease, and the status of the lease. Panel G provides the frequency distribution of the ratio obtained by dividing the outstanding at term by the original value of a lease. Panel H gives the proportion of terminated leases in comparison with the number of leases in force in the company. 71.07% of the database consist of contracts from the automotive category and 28.93% from the equipment category. The percentage of defaulted contracts in our database is 0.70% or 140 contracts out of 19,824 terminated contracts. 5 471 contracts were cancelled, including 358 contracts for the equipment category, 111 contracts for the automotive category, and 2 defaulted contracts. 6 4,821 contracts were cancelled, including 951 contracts for the equipment category (asset type) and 3,870 contracts for the automotive category.
Credit Risk in the Leasing Business - A case study of low probability of default 12
Table 1: Descriptive statistics characterising the sample of 19,824 individual lease contracts terminated between 1997 and 2001
Panel A: Frequency distribution by type of leased asset Type of leased asset Number of leases Percent of total Automotive 14,088 71.07% Equipment 5,736 28.93% TOTAL 19,824 100.00% Panel B: Frequency distribution by status of the lease Status of the lease Number of leases Percent of total Completed contracts 19,684 99.30% Defaulted contracts 7 140 0.70% TOTAL 19,824 100.00% Panel C: Frequency distribution by start date of the lease Start date Number of leases Percent of total Cumulative percent 1987 1 0.00% 0.00% 1989 3 0.02% 0.02% 1990 8 0.04% 0.06% 1991 11 0.06% 0.12% 1992 56 0.28% 0.40% 1993 143 0.72% 1.12% 1994 1,446 7.29% 8.41% 1995 2,617 13.20% 21.61% 1996 3,253 16.41% 38.02% 1997 5,542 27.96% 65.98% 1998 5,005 25.25% 91.23% 1999 1,191 6.01% 97.24% 2000 462 2.33% 99.57% 2001 86 0.43% 100.00% TOTAL 19,824 100.00% 100.00% Panel D: Frequency distribution by leasing period of the lease Term-to-maturity in months Number of leases Percent of total Cumulative percent 0 to 11 1,047 5.28% 5.28% 12 to 23 2,868 14.47% 19.75% 24 to 35 3,614 18.23% 37.98% 36 to 47 10,300 51.96% 89.94% 48 to 59 1,216 6.13% 96.07% 60 to 71 691 3.49% 99.56% over 71 88 0.44% 100.00% TOTAL 19,824 100.00% 100.00% Minimum = 1 month Maximum = 144 months Mean = 32 months Median = 36 months Panel E: Frequency distribution by term date of the lease Term date Number of leases Percent of total Cumulative percent 1997 2,478 12.50% 12.50% 1998 3,461 17.46% 29.96% 1999 3,889 19.62% 49.58% 2000 4,394 22.16% 71.74% 2001 5,602 28.26% 100.00% TOTAL 19,824 100.00% 100.00%
7 Including 64 defaulted contracts for the equipment category and 76 defaulted contracts for the automotive category.

Credit Risk in the Leasing Business - A case study of low probability of default 13
Panel F: Frequency distribution by original value of the lease Original value in € Number of leases Percent of total Cumulative percent under 14,999.99 8,419 42.47% 42.47% 15,000.00 to 29,999.99 9,525 48.05% 90.52% 30,000.00 to 44,999.99 666 3.36% 93.88% 45,000.00 to 59,999.99 242 1.22% 95.10% over 60,000.00 972 4.90% 100.00% TOTAL 19,824 100.00% 100.00% Minimum = € 240.32 Maximum =€ 8,898,119.57 Mean = € 32,244.03 Median = € 16,347.83 Panel G: Frequency distribution by ratio (outstanding at term / original value) of the lease Ratio Number of leases Percent of total Cumulative percent 0 – 25% 4,262 21.50% 21.50% 26 – 50% 5,731 28.91% 50.41% 51 – 75% 6,013 30.33% 80.74% 76 – 100% 3,818 19.26% 100.00% TOTAL 19,824 100.00% 100.00% Panel H: Proportion of terminated leases in the sample in comparison with the number of leases in force in the company Term date Proportion 1997 19.28% 1998 21.38% 1999 21.41% 2000 25.03% 2001 26.81% All contracts were issued between 1987 and 2001, with a maximum of 5,542 in 1997. The average leasing period was 32 months, with a minimum term of 1 month and a maximum term of 144 months (12 years). The ‘36-47 months’ leasing period is the most represented, with 51.96%. The proportion of terminated contracts within the studied portfolio increased from 12.50% to 28.26% over the 5 studied years while the proportion of terminated contracts in comparison with the number of leases in force increased from 19.28% to 26.81% over the same 5-year period. More than nine-tenths of the database (90.52%) consist of contracts with an original value below € 29,999.99. The median of the sample is € 16,347.83. Approximately half of the terminated contracts have an outstanding at term higher than 50% of their original value. Table 2 summarises the number of observations available for each sub-portfolio and their distribution over the observed years. Table 2: Number of observations per year for each studied sub-portfolio over five-year period
Years of observation Type of asset Age in months 1997 1998 1999 2000 2001 Automotive 0 – 11 3,912 3,946 3,419 3,803 4,680 12 – 23 2,483 3,826 3,582 3,084 3,508 24 – 35 1,444 1,391 2,686 2,970 2,585
over 36 246 343 430 998 1,164
Equipment 0 – 11 1,708 3,016 2,612 2,705 1,912 12 – 23 1,306 1,721 3,085 2,575 2,647 24 – 35 1,139 1,174 1,399 2,800 2,372 36 – 47 342 448 553 713 1,402 over 48 269 324 400 485 627

Credit Risk in the Leasing Business - A case study of low probability of default 14
3. The results In this section, the results concerning the probability of default, recovery rate and loss distribution are given following the methodology presented above (cf. 1. Methodology).
3.1 Probability of default Table 3 exhibits the yearly average default rate and its standard deviation according to asset type and age. These results are weighted by the number of contracts8. Table 3: Weighted average and standard deviation of the yearly probability of default by type of asset and by age (in months)
0 – 11 12 – 23 24 – 35 over 36 Automotive 0.08% 0.19% 0.12% 0.44% 0.09% 0.07% 0.12% 0.34% 0 – 11 12 – 23 24 – 35 36 – 47 over 48 Equipment 0 0.02% 0.09% 1.36% 0.33% 0 0.03% 0.07% 0.70% 0.31% In the table, observed means and standard deviations of probability of default are respectively given in normal characters and in italics. Overall, fairly low default rates are observed. All the averages are below 0.50% except for the equipment category (see ‘36-47 months’ age segment). Moreover, the average yearly probability of default increases with the age of the defaulted contract (except for equipment over 48 months). Note that we do not have any defaulted contracts between 0 and 11 month(s) for the equipment category.
3.2 Recovery rate The weighted average recovery rate can be calculated in two different ways: (i) when only recoveries from the sale of the leased asset are considered (WRR1) and (ii) when recoveries are also obtained from guarantees, collaterals, the debtor’s net liquidation and late payments (WRR2). As the database does not contain the information required to draw this distinction, the recovery is assumed to result from any of several circumstances, including the sale of the leased asset, guarantees, collaterals and other means. In other words, only WRR2 can be estimated. Table 4 exhibits WRR2 for contracts defaulted between 1997 and 2001 as well as the recovery lag (average elapsed time between the default date and the recovery date).
8 The yearly default rate weighted by the outstanding amount could not be calculated because the relevant data concerning the outstanding at term were not available for all the contracts in force.

Credit Risk in the Leasing Business - A case study of low probability of default 15
Table 4: Recovery rate by type of asset and by age
Automotive WRR2 Age in months N AVG STD Recovery lag (in months) 0 – 11 13 93.81% 8.17% 1.22 12 – 23 36 91.60% 18.68% 2.42 24 – 35 13 71.36% 17.35% 4.06 over 36 14 92.50% 15.96% 1.95 TOTAL 76 89.46% 16.36% 2.43 Equipment WRR2 Age in months N AVG STD Recovery lag (in months) 0 – 11 0 12 – 23 2 105.94% 1.67% 4.80 24 – 35 8 77.45% 40.21% 3.25 36 – 47 47 62.93% 33.91% 3.22 over 48 7 82.49% 25.28% 6.49 TOTAL 64 69.82% 34.39% 4.04 AVG stands for Average and STD for Standard Deviation Recovery rates from defaulted leases vary substantially depending on the type of leased asset. The weighted average recovery rate is 89.46% for the automotive category and 69.82% for the equipment category. Furthermore, the equipment category shows greater variation by age than the automotive segment9. The weighted average recovery rate tends to decrease substantially with the age of the lease contracts in the equipment segment while automotive leases seem to have more consistent recovery rates. The recovery lags are low: on average 2 and a half months for the automotive category and 4 months for the equipment category. The observed recovery rates are of the same order of magnitude as those observed by Schmit and Stuyck (2002) for a number of European countries. These authors’ results are based on a wide sample consisting of 37,259 individual defaulted lease contracts issued between 1976 and 2002 (most of them between 1990 and 2000) by twelve companies in six different countries. The results are summarised in Table 5. Table 5: Average recovery rates for defaulted lease contracts in Europe (Schmit and Stuyck, 2002)
Automotive Equipment Country WRR1/ WRR1/ N WRR1 WRR2 WRR2 N WRR1 WRR2 WRR2 Austria 3,753 84% 96% 87% 309 15% 49% 29% Belgium 4,639 70% 86% 81% 1,796 58% 71% 83% France 4,048 46% 70% 66% 13,100 23% 70% 32% Italy 936 49% 65% 75% 1,815 31% 45% 69% Luxembourg 268 77% 91% 84% 121 39% 56% 70% Sweden 193 82% 82% 100% 158 73% 74% 99% WRR1: Weighted average Recovery Rate when only recoveries from the sale of the leased asset are considered
9 Given the low number of defaulted contracts in each age segment, only the ‘Total’ line should be considered for each asset type in Table 4.

Credit Risk in the Leasing Business - A case study of low probability of default 16
WRR2: Weighted average Recovery Rate when recoveries are obtained from the sale of the leased asset, guarantees, collaterals, the debtor’s net liquidation and late payments.
3.3 Loss distribution The results of the bootstrap computation for the loss distribution are presented in two steps: without the retail/corporate distinction, and with the distinction. Summary statistics on loss distribution are given for both types of asset and according to the age of the sub-portfolios. The credit risk is estimated for each sub-portfolio by the 99.9th percentile of the computed loss distribution. Tables 6 and 8 show the results obtained by running simulations (50,000 iterations) on sub-portfolios comprising 8,000 contracts. A sub-portfolio size of 8,000 contracts was chosen in order to base the results on a satisfactory estimation of each sub-portfolio’s absolute contribution to the total risk of the portfolio.
3.3.1 Without the retail/corporate distinction Table 6 provides the summary statistics on loss distribution for each type of asset.
Table 6: Summary statistics on loss distribution without retail/corporate distinction
Automotive Age in months 0 – 11 12 – 23 24 – 35 over 36 # iterations 50,000 50,000 50,000 50,000 Size of portfolio 8,000 8,000 8,000 8,000 Mean 0.01% 0.02% 0.06% 0.02% Standard deviation 0.01% 0.03% 0.10% 0.06% Skewness 1.07 0.41 1.75 1.22 Kurtosis 3.06 2.82 4.49 3.51 50% percentile 0.00% 0.01% 0.01% 0.00% 95% percentile 0.02% 0.07% 0.28% 0.15% 99% percentile 0.02% 0.09% 0.34% 0.18% 99.5% percentile 0.02% 0.10% 0.36% 0.19% 99.9% percentile 0.03% 0.11% 0.40% 0.20%
Equipment
Age in months 0 – 11 12 – 23 24 – 35 36 – 47 over 48 # iterations 50,000 50,000 50,000 50,000 50,000 Size of portfolio 8,000 8,000 8,000 8,000 8,000 Mean 0.00% 0.00% 0.01% 0.20% 0.04% Standard deviation
0.00% 0.00% 0.01% 0.15% 0.05%
Skewness 0.00 -2.58 2.29 0.48 0.67 Kurtosis 0.00 9.34 7.90 2.32 1.76 50% percentile 0.00% 0.00% 0.00% 0.16% 0.00% 95% percentile 0.00% 0.00% 0.04% 0.48% 0.12% 99% percentile 0.00% 0.00% 0.06% 0.54% 0.13% 99.5% percentile 0.00% 0.00% 0.06% 0.56% 0.14% 99.9% percentile 0.00% 0.00% 0.07% 0.60% 0.16% Due to the low probability of default and high recovery rates observed in the studied financial institution, relatively low percentile values are found for the loss distributions. Note that the observations are also valid when the corporate/retail distinction is considered (see 3.3.2 With retail/corporate distinction ).

Credit Risk in the Leasing Business - A case study of low probability of default 17
A higher estimated credit risk is observed for the ‘24-35 months’ age segment in the automotive category and the ‘36-47 months’ group in the equipment category. Regardless of other possible trends, the calculation shows that the loss distribution for lower-age contracts is lower than that for higher-age ones. This holds for both types of asset. Furthermore, both the equipment and the automotive categories experience similar loss rate levels. The automotive category seems to be, on average, riskier than the equipment category except for the ‘36-47 months’ age segment.
3.3.2 With retail/corporate distinction Table 7 provides the distribution of the 19,824 contracts between corporate and retail exposures10. Corporate contracts include leases to a single company exceeding € 1 million, sovereign leases and bank leases (companies within the group). The rest of the portfolio is considered as retail exposures. Table 7: Frequency distribution by retail/corporate category
Status of the lease Number of leases Percent of total Corporate contracts 3,412 17.21% Retail contracts 16,412 82.79% TOTAL 19,824 100.00%
In the studied portfolio, all the defaulted contracts are retail lease contracts. The probability of default for the corporate category is therefore nil. Consequently, the theoretical corporate credit risk is also nil and no computation for this category was carried out. For these reasons, Table 8 provides the results of the loss distribution for the retail category only. Table 8: Summary statistics on loss distribution in the retail category
Automotive
Age in months 0 – 11 12 – 23 24 – 35 over 36 # iterations 50,000 50,000 50,000 50,000 Size of portfolio 8,000 8,000 8,000 8,000 Mean 0.01% 0.02% 0.06% 0.03% Standard deviation 0.01% 0.04% 0.10% 0.08% Skewness 0.97 0.22 1.73 1.38 Kurtosis 2.70 2.62 4.44 3.51 50% percentile 0.00% 0.01% 0.01% 0.00% 95% percentile 0.02% 0.08% 0.28% 0.21% 99% percentile 0.03% 0.10% 0.34% 0.24% 99.5% percentile 0.03% 0.11% 0.36% 0.25% 99.9% percentile 0.03% 0.12% 0.40% 0.28%
Equipment
Age in months 0 – 11 12 – 23 24 – 35 36 - 47 Over 48 # iterations 50,000 50,000 50,000 50,000 50,000 Size of portfolio 8,000 8,000 8,000 8,000 8,000 Mean 0.00% 0.00% 0.01% 0.34% 0.06% Standard deviation
0.00% 0.00% 0.02% 0.25% 0.08%
Skewness 0.00 -2.42 2.13 0.36 0.66 Kurtosis 0.00 8.34 6.87 2.15 1.70 50% percentile 0.00% 0.00% 0.00% 0.28% 0.00% 95% percentile 0.00% 0.00% 0.07% 0.78% 0.20%
10 The main differences in treatment are explained below (see 5.1 Overview of the approaches proposed by the Basel Committee).

Credit Risk in the Leasing Business - A case study of low probability of default 18
99% percentile 0.00% 0.00% 0.09% 0.88% 0.22% 99.5% percentile 0.00% 0.00% 0.11% 0.91% 0.23% 99.9% percentile 0.00% 0.00% 0.12% 0.98% 0.26% An increase in each given percentile as well as in the standard deviation of the loss distribution can be observed for both assets in comparison with Table 6. In order not to make misleading interpretations, it should be stressed that Table 6 deals with the portfolio as a whole (corporate and retail exposures) while Table 8 exhibits the results for the retail sub-portfolio only. Higher rates are found in the case of the retail sub-portfolio because the same number of defaulted contracts is considered for a lower number of treated contracts. Nevertheless, to estimate the risk of the total portfolio when making the distinction, both the corporate and the retail parts of the total portfolio need to be considered. Both the equipment and the automotive categories still show similar loss rate levels. The highest estimated loss rate at the 99.9th percentile, i.e. 0.98%, is that of ‘equipment’ aged between 36 and 47 months.
Credit Risk in the Leasing Business - A case study of low probability of default 19
4. Discussion
4.1 Sample Bias We have estimated loss rates with simulated portfolios built by drawing leased assets from an observed sample. This non-parametric technique should provide good estimates of total loss rates. However, we are aware that our simulation has been performed on a limited universe of data for the years 1997 to 2001. The number of years and the individual year taken into account depend on the sub-portfolio (see Table 2: Number of observations per year for each studied sub-portfolio over five-year period). Therefore, our sample does not cover all possible incidences of systematic factors. Nevertheless, this methodological weakness is virtually unavoidable. The solution would be to have a data set covering a very long period, including all kinds of incidences of systematic factors. Regulators are well aware of this problem. For instance, the Basel Committee recommends using data from at least 5 years (as we have done for all studied sub-portfolios) but, if possible, 7 years, to calculate the regulatory capital requirement. Furthermore, for each studied portfolio, the draw of any particular year (underlying the realisation of the systematic factor) is equiprobable.
4.2 Assumptions Our current research has certain limitations stemming from assumptions that must be put to the test in future investigations.
4.2.1 Independence of systematic factors
The present study assumes that systematic factors are serially independent. This means that, when a year is chosen in calculating a loss distribution (cf. 1.4 Calculation of loss distribution), it is assumed that the year in question reflects the state of the economy independently of other years. One major issue to be investigated in the near future concerns the implications of abandoning this assumption, given that economic cycles are longer than one year. Further research should be conducted to estimate the proportion of additional capital required because of this time-dependence.
4.2.2 Correlation between default and recovery rates
In credit risk models, as in our own study, recovery rates and probability of default are usually treated as two independent variables. However, Altman, Resti and Sironi (2001) report a negative correlation between these two variables for corporate bonds over the period 1982-2000. Their central argument is that aggregate recovery rates are basically a function of the supply and demand of corporate bonds. As probability of default and loss given default are driven by the same causes, the consequence is that high default rate periods are correlated with high loss given default expectations. Not taking into account this correlation might therefore lead to systematic underestimation of total credit losses. In the case of leasing, no research has been carried out on the correlation between default and recovery rates. Nevertheless, there is a rather strong consensus, in the leasing industry, that for

Credit Risk in the Leasing Business - A case study of low probability of default 20
assets with a well-developed secondary market, such as cars, no significant correlation is to be found.
4.3 Sub-portfolio size and diversification For each category, we performed simulations for different portfolio sizes n (500 - 1,000 - 2,000 4,000 and 8,000). Table 9 shows loss rates at the 99.9th percentile for the various portfolio sizes (without the corporate/retail distinction). When the size of the sub-portfolios increases respectively from 500 – 1,000 – 2,000 – 4,000 and 6,000 to 8,000 contracts, the 99.9th percentile loss rates decrease on average by respectively 44%, 18%, 14%, 11% and 5%. Indeed, in all sub-portfolios, the marginal loss rates at the bad-tail percentile decrease when the number of contracts rises. The total loss rates shown in a given percentile (e.g. 99.9%) indicate an absolute value for the risk of a studied sub-portfolio, provided the latter is well diversified (i.e. provided the number of contracts in the sub-portfolio is high). In our case, we suggest that a sub-portfolio size of n = 8,000 contracts is adequate to estimate an absolute value of risk. Table 9: 99.9th percentile loss rates for different sub-portfolio sizes (without corporate/retail distinction)
Automotive Age in months 0 – 11 12 – 23 24 – 35 over 36 # iterations 50,000 50,000 50,000 50,000 n = 500 0.12% 0.32% 1.00% 0.46% n = 1,000 0.07% 0.22% 0.77% 0.34% n = 2,000 0.05% 0.17% 0.58% 0.28% n = 4,000 0.04% 0.14% 0.47% 0.24% n = 6,000 0.03% 0.12% 0.43% 0.21% n = 8,000 0.03% 0.11% 0.40% 0.20% Equipment Age in months 0 – 11 12 - 23 24 - 35 36 - 47 over 48 # iterations 50,000 50,000 50,000 50,000 50,000 n = 500 0.00% 0.00% 0.26% 1.23% 0.40% n = 1,000 0.00% 0.00% 0.19% 0.96% 0.31% n = 2,000 0.00% 0.00% 0.13% 0.80% 0.24% n = 4,000 0.00% 0.00% 0.10% 0.68% 0.19% n = 6,000 0.00% 0.00% 0.08% 0.63% 0.17% n = 8,000 0.00% 0.00% 0.07% 0.60% 0.16%

Credit Risk in the Leasing Business - A case study of low probability of default 21
5. Comparison with the Basel Accords (QIS 3). Regulatory implications The 1988 BIS11 Accord sets a standard for measuring the appropriate capital requirement for an internationally active bank in order to protect it against systematic risk. Capital allocation is calculated as being the product of the regulatory capital ratio (the risk-weighting ratio times 8%) and exposure at default (EAD). Since June 1999, the Basel Committee, a working group of the BIS, has released two consultative documents for a New Accord. The Committee intends to provide a number of approaches that are both more comprehensive and more sensitive to risks than the 1988 Accord, while maintaining the overall level of regulatory capital. A third consultative paper will be published in spring 2003 and should reflect in its substance the indications given in the Third Quantitative Impact Study (QIS 3) launched by the Basel Committee in October 2002. The New Accord on regulatory capital should be implemented in the European Union through a directive by 2005. In the following, Section 1 briefly describes the three approaches as currently proposed in the technical guidance to QIS 3. Section 2 then provides a comparison between the capital requirement calculations resulting from our model and those derived from the schemes proposed by the Basel Committee. Finally, Section 3 discusses the regulatory implications of the proposals.
5.1 Overview of the approaches proposed by the Basel Committee
5.1.1 Three approaches The New Accord comprises three approaches: the Standardised Approach, the Internal Rating-Based (IRB) Foundation Approach and the IRB Advanced Approach. a) The Standardised Approach The Standardised Approach is conceptually similar to the present Accord, but is more risk-sensitive. After subdividing leases into several categories, including corporate and retail portfolios, the bank allocates a supervisory risk-weight to each of its credit exposures. This risk-weight has to be multiplied by 8% to calculate the capital requirement (K). Corporate exposures are assigned a risk-weight according to their external credit assessment (e.g. 100% for unrated claims) while claims presenting retail exposures are risk-weighted at 75%. Furthermore, loans fully secured by mortgage on residential property or a mortgage on commercial real estate are assigned respectively a risk-weight of 40% and 100%. To be classified as retail exposures, claims must satisfy four criteria:
- Orientation criterion: the exposure is to an individual person or persons or to a small business;
- Product criterion: the exposure takes the form of revolving credits and lines of credit, personal term loans and leases, or business facilities and commitments;
- Granularity criterion: no aggregate exposure to one single borrower can exceed 0.2% of the overall regulatory retail portfolio;
11 The Basel Committee on Banking Supervision is composed of central banks’ and supervisory authorities’ representatives from Belgium, Canada, France, Germany, Italy, Japan, Luxembourg, the Netherlands, Sweden, Switzerland, the United Kingdom and the United States.

Credit Risk in the Leasing Business - A case study of low probability of default 22
- Low value of individual exposures: aggregate retail exposures to one single borrower must be lower or equal to € 1 million.
Note that, in spite of the fact that financial collaterals are recognised, no full recognition of physical collaterals is currently provided under this approach. b) The IRB Foundation and Advanced Approaches The key features of the IRB Approaches rely on measures of borrower creditworthiness generated internally by financial institutions as primary inputs to capital requirement calculation. These internal assessments must comply with a series of quantitative criteria so as to ensure their robustness and appropriateness. One main difference between the two IRB Approaches lies in the fact that, under the Advanced Approach, financial institutions are allowed to supply more quantitative inputs themselves: estimates of LGD, of EAD and of effective maturity. Under the IRB Foundation Approach, these inputs are assumed to have a specific value depending on various characteristics of the exposures. Another main difference is that, whereas retail exposures are explicitly excluded from the IRB Foundation Approach, financial institutions will have to follow different rules for their corporate and retail portfolios under the IRB Advanced Approach. Retail portfolios under the IRB Advanced Approach include claims meeting two criteria:
- Nature of borrower or low value of individual exposures (loans to individuals, residential mortgage loans, loans extended too small business not exceeding € 1 million);
- Large number of exposures. The different rules assigned to retail and corporate portfolios under the IRB Advanced Approach tend to lower the capital requirement for retail exposures in order to recognise the wider risk diversification allowed by large portfolios of small exposures. When all the parameters are available, capital requirement is defined through an algebraic formula based on credit risk models. The total capital requirement of a financial institution is then calculated as the sum of requirements for all sub-portfolios.

Credit Risk in the Leasing Business - A case study of low probability of default 23
c) Overview of the three approaches An overview of the three approaches is given in Table 10. Table 10: Overview of the three approaches of the Basel Committee’s proposed new framework.12
Standardised IRBF IRBA All exposures
(incl. corporate and retail) Corporate exposures Corporate exp. Retail exp.
Inputs Limited (Supervisory risk-weights are allocated to each credit exposure depending on its external credit assessment).
PD estimates (LGD and M are given by supervisory estimates)
PD estimates, LGD estimates, EAD estimates, M estimates.
PD estimates, LGD estimates, EAD estimates, M estimates.
Credit Risk Mitigants
Financial collaterals, Limited array of eligible
guarantors.
Financial and physical collaterals eligible (adjustment of LGD subject to regulatory floors),
Adjustment of risk-weight or PD for guarantees.
Internal assessment of collaterals,
Adjustment of borrower grade or LGD for guarantees.
Internal assessment of collaterals,
Adjustment of PD or LGD for guarantees, without limitation to eligible guarantors.
The abbreviations PD, LGD, EAD and M stand respectively for probability of default, loss given default, exposure at default, and maturity – i.e. the four credit components used under the IRB Approaches.
5.1.2 Formula for determining capital requirement
The capital required is equal to K times EAD. As previously indicated, under the Standardised Approach, K is defined as the risk-weighting ratio times 8% while, under the IRB Approaches, it is calculated through an algebraic formula. The algebraic formula is as follows:
K= LGD × N [(1-ρ) - 0.5 × G(PD) + (ρ /(1- ρ ))0.5 × G(0.999)] × Madj (7)
where
N(x) denotes the cumulative distribution function for a standard normal random variable and G(z) denotes the inverse cumulative distribution function for a standard normal random variable (the confidence level being set at 99.9%).
LGD is the loss given default.
Under the IRB Foundation Approach, LGD is set at respectively 45% and 75% for secured and subordinated claims without specifically recognised collaterals. It may be adjusted in order to take into account the risk mitigation effect of recognised collaterals, subject to operational requirements and regulatory floors. Under the IRB Advanced Approach, LGD is estimated on the basis of banks’ internal risk assessment data.
PD is the probability of default.
12 Schmit M., Stuyck J. and Duchemin S., 2003, ‘Credit Risk Issues in the automotive leasing industry’, Working Paper, Brussels.

Credit Risk in the Leasing Business - A case study of low probability of default 24
Madj is the adjustment for maturity and is expressed as [1 – 1.5 × b(PD) -1 × [1 + (M – 2.5) × b(PD)] with M being the effective maturity of exposure and b given by [0.08451 – 0.05898 * ln(PD)] 2. In the case of retail exposure, there is no maturity adjustment.
ρ = ρmin × (1-e (-x × PD)) / (1- e(-x)) + ρmax × [1- (1 - e(-x × PD)) / (1 - e(-x))] – S adj (8)
with • ρmin is the minimum asset return correlation. It is equal to 12% for corporate exposures
and 2% for retail exposures. • ρmax is the maximum asset return correlation. It is equal to 24% for corporate exposures
and 17% for retail exposures. • x is a constant indicating the steepness of the risk-weight curve. It is equal to 50 for
corporate exposures and 35 for retail exposures.
• S adj is the firm-size adjustment. It is given by 0.04 × [1 – ((S-5) / 45)] where S is the total annual sales in millions of €. In the case of retail exposures, there is no size adjustment.
5.1.3 Diversification effect of retail exposures
Given the criteria used to classify claims as retail exposures, a greater diversification effect can be expected for this type of contract inasmuch as the exposure is shared between a larger number of smaller lessees than in the case of a corporate one (see 5.1.1 Three approaches). This diversification effect leads to lower capital requirements for a retail portfolio than for a corporate one, all else being equal. Figure 1 illustrates this fact for a loss given default (LGD) of 40% and a maturity of 2.5 years under the IRB Advanced Approach. Capital requirements are higher for corporate exposures than for retail exposures.
Figure 1: Capital requirements for retail and corporate exposure using the IRB Advanced Approach
Capital RequirementsAssumptions: LGD=40% & Maturity= 2.5 years
0
5
10
15
20
25
30
0% 1% 2% 3% 4% 5% 6% 7% 8% 9% 10%
11%
12%
13%
14%
15%
16%
17%
18%
19%
20% PD
K (%)
Corporate Retail (other retail exposures)

Credit Risk in the Leasing Business - A case study of low probability of default 25
Figure 1 highlights the specificity of ‘low probability of default’ companies. The key feature is the slope of the plotted curve: the slope is steep for low probabilities of default and stabilises thereafter at a lower level (from approximately 2% in this case). One major consequence for low probability of default companies is that weak variations in probability of default lead to big swings in terms of capital requirement. The capital requirement levels observed in the studied institution are certainly low, but it should be emphasised that they are particularly sensitive to changes in probability of default.
5.2 Comparison between the capital requirements derived from the proposed internal model and those derived from capital regulation
The economic impact of choosing one approach rather than another is a major concern for European leasing companies. In order to help the (studied) financial institution to select the most appropriate of the three (Standardised, IRB Foundation or IRB Advanced), this section provides a comparison between capital requirement calculations resulting from our internal model at the 99.9th percentile and those derived from the weighting scheme set forth in the technical guidance to QIS 3. This comparison is carried out first without considering the retail/corporate distinction and then taking into account such a distinction. The results are then analysed to determine whether or not a gain in terms of capital allocation can be achieved by distinguishing corporate from retail exposures. Finally, we perform the same comparison but without considering the previous age segmentation. The aim of this latter procedure is to see whether similar conclusions can be drawn from a larger sub-portfolio.
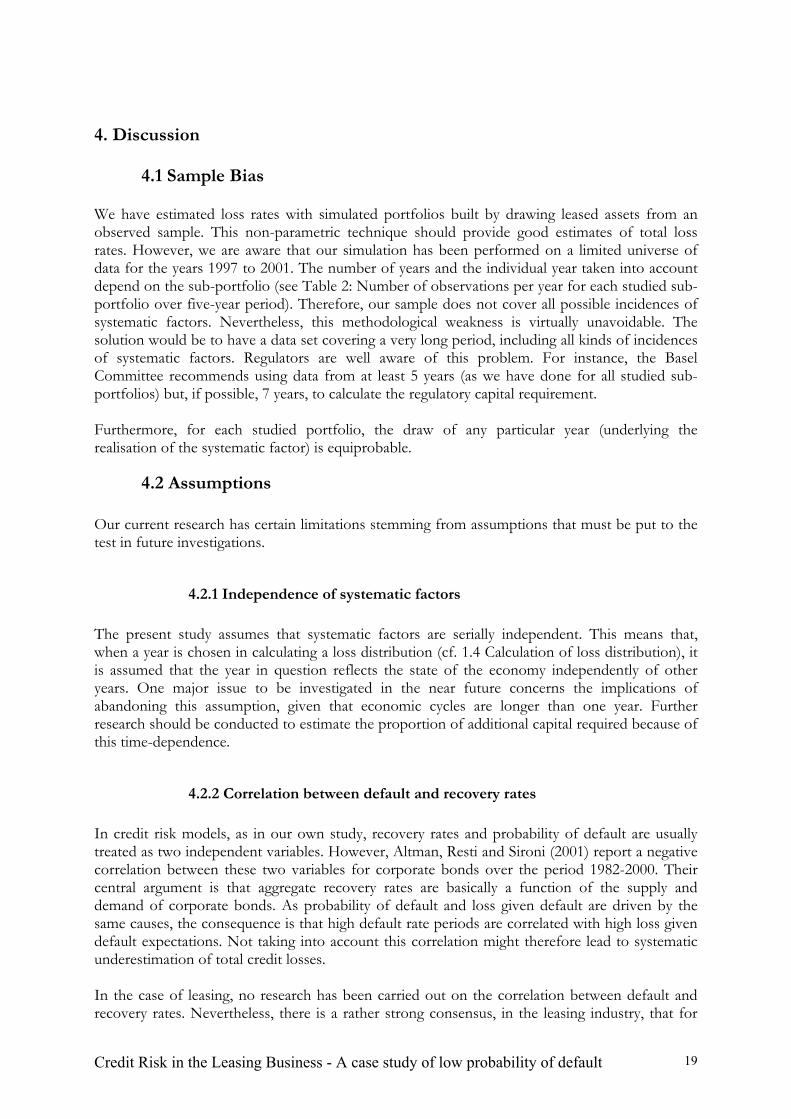
5.2.1 Without the retail/corporate distinction In the following analysis, given that we wish to examine the total lease contract portfolio without considering the distinction between retail and corporate exposures, we use the corporate risk-weight functions and risk components. The results of previous studies show that, under the Standardised Approach, the capital charge assignment is generally far above the capital requirement calculated with the re-sampling method. Indeed, additional physical collaterals are not fully recognised in the Standardised Approach. In this study, the differences between the IRB Foundation Approach and the internal model are very significant but less so than the differences between the Standardised Approach and our own internal model. As apparent from Table 11, the ratio of the IRB Foundation Approach to the internal model [‘ratio (2)/(4)’] varies between 5.75 and 74.50. This difference stems from the fact that the IRB Foundation Approach does not allow full recognition of physical collaterals or regulatory capital requirement deductions for retail exposures. In contrast with the analysis carried out for the standardised and the IRB Foundation Approaches, the capital calculated with our internal model is more in line with the regulatory capital arising from the IRB Advanced Approach. Clearly, this is due to the fact that the IRB Advanced Approach allows wider physical collateral recognition and provides capital requirement adjustment for retail exposures.

Credit Risk in the Leasing Business - A case study of low probability of default 26
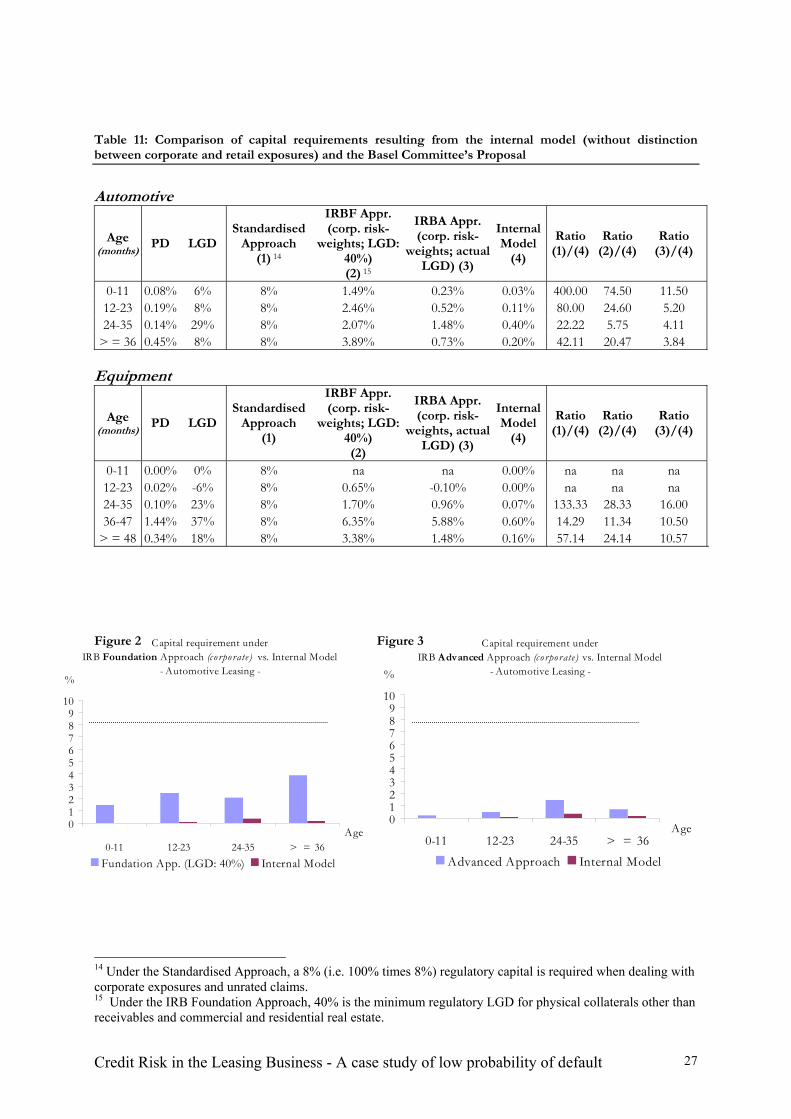
The IRB Advanced Approach seems more appropriate because, as apparent from Table 11, the rates we obtain by using this method are closer to the results obtained with the internal model. Nevertheless significant differences still exist. However, despite the substantial differences in regulatory capital requirements, the choice between approaches also depends on the ability of financial institutions to obtain complete data sets on probabilities of default and loss given default. Most probably, given the structure of leasing businesses in Europe, some financial institutions will not meet all the requirements set by national supervisors as regards the internal development of adequate databases and risk assessment capacity13. Bearing these considerations in mind, the ability to adopt one approach rather than another could result in competitive distortions. The comparison between capital requirements resulting from the Basel Committee’s Proposal and our internal model is presented in Table 11 and illustrated in Figures 2, 3, 4 and 5.
13 See IBM Institute for Business Value (2002).
Credit Risk in the Leasing Business - A case study of low probability of default 27
Capital requirement under IRB Advanced Approach (c o rpo rate) vs. Internal Model
- Automotive Leasing -
0123456789
10
0-11 12-23 24-35 > = 36Age
%
Advanced Approach Internal Model
Capital requirement under IRB Foundation Approach (c o rpo rate) vs. Internal Model
- Automotive Leasing -
0123456789
10
0-11 12-23 24-35 > = 36Age
%
Fundation App. (LGD: 40%) Internal Model
Table 11: Comparison of capital requirements resulting from the internal model (without distinction between corporate and retail exposures) and the Basel Committee’s Proposal
Automotive
Age (months) PD LGD
Standardised Approach
(1) 14
IRBF Appr. (corp. risk-
weights; LGD: 40%) (2) 15
IRBA Appr. (corp. risk-
weights; actual LGD) (3)
Internal Model
(4)
Ratio (1)/(4)
Ratio (2)/(4)
Ratio (3)/(4)
0-11 0.08% 6% 8% 1.49% 0.23% 0.03% 400.00 74.50 11.50 12-23 0.19% 8% 8% 2.46% 0.52% 0.11% 80.00 24.60 5.20 24-35 0.14% 29% 8% 2.07% 1.48% 0.40% 22.22 5.75 4.11
> = 36 0.45% 8% 8% 3.89% 0.73% 0.20% 42.11 20.47 3.84
Equipment
Age (months) PD LGD
Standardised Approach
(1)
IRBF Appr. (corp. risk-
weights; LGD: 40%) (2)
IRBA Appr. (corp. risk-
weights, actual LGD) (3)
Internal Model
(4)
Ratio (1)/(4)
Ratio (2)/(4)
Ratio (3)/(4)
0-11 0.00% 0% 8% na na 0.00% na na na 12-23 0.02% -6% 8% 0.65% -0.10% 0.00% na na na 24-35 0.10% 23% 8% 1.70% 0.96% 0.07% 133.33 28.33 16.00 36-47 1.44% 37% 8% 6.35% 5.88% 0.60% 14.29 11.34 10.50
> = 48 0.34% 18% 8% 3.38% 1.48% 0.16% 57.14 24.14 10.57
Figure 2 Figure 3
14 Under the Standardised Approach, a 8% (i.e. 100% times 8%) regulatory capital is required when dealing with corporate exposures and unrated claims. 15 Under the IRB Foundation Approach, 40% is the minimum regulatory LGD for physical collaterals other than receivables and commercial and residential real estate.

Credit Risk in the Leasing Business - A case study of low probability of default 28
Capital Requirement under IRB Foundation Approach (corporate) vs. Internal Model
-Equipment Leasing -
0123456789
10
0-11 12-23 24-35 36-47 > = 48Age
%
Fundation App. (LGD: 40%) Internal Model
Capital Requirement under IRB Advanced Approach (c o rpo rate) vs. Internal Model
- Equipment Leasing -
0123456789
10
0-11 12-23 24-35 36-47 > = 48 Age
%
Advanced App. Internal Model
Figure 4 Figure 5
5.2.2 With the retail/corporate distinction The distinction between corporate and retail exposures should lead to two different computations: one for the retail portfolio and another for the corporate one. But, given that all the defaulted contracts are retail lease contracts and the probability of default for the corporate category is nil, the theoretical corporate credit risk is nil and no computation for this category is required. In the following, therefore, we will focus only on the retail exposures of the total portfolio. Differences in relation to the previous section are important and need to be made clear. In Section 5.2.1, we did not draw any distinction between corporate and retail exposures and we considered the entire database using the corporate risk-weight functions and risk components; in this section we will draw a distinction between corporate and retail exposures and consider the retail part of the entire database using the retail risk-weight functions and risk components (except for the IRBF Approach, which is only based on corporate risk-weights). Table 12 provides the results of this method. The choice of an optimal method to achieve the best results with our internal model is not modified by taking into account the distinction between retail and corporate exposures: the IRB Advanced Approach still appears to be the best approach.

Credit Risk in the Leasing Business - A case study of low probability of default 29
Capital requirement under IRB Foundation Approach (c o rpo rate) vs. Internal Model
- Automotive Leasing -
0123456789
10
0-11 12-23 24-35 > = 36Age
%
Fundation App. (LGD: 40%) Internal Model
Capital requirement under IRB Advanced Approach (re tail) vs. Internal Model
- Automotive Leasing -
0123456789
10
0-11 12-23 24-35 > = 36Age
%
Advanced Approach Internal Model
Table 12: Comparison between capital requirements under the internal model (with distinction between corporate and retail exposures) vs. the Basel Committee’s Proposal
Automotive
Age (months) PD LGD
Standardised Approach
(1) 16
IRBF Appr. (corp. risk-
weight; LGD: 40%) (2)
IRBA Appr. (retail risk-
weight, actual LGD) (3)
Internal Model
(4)
Ratio (1)/(4)
Ratio (2)/(4)
Ratio (3)/(4)
0-11 0.10% 6% 6% 1.70% 0.14% 0.03% 200.00 56.67 4.60 12-23 0.24% 8% 6% 2.81% 0.35% 0.12% 54.55 25.51 3.16 24-35 0.14% 29% 6% 2.07% 0.82% 0.40% 16.67 5.75 2.26
> = 36 0.55% 8% 6% 4.28% 0.52% 0.28% 24.00 17.13 2.08
Equipment
Age (months) PD LGD
Standardised Approach
(1)
IRBF Appr. (corp. risk-
weight; LGD: 40%) (2)
IRBA Appr. (retail risk-
weight, actual LGD) (3)
Internal Model
(4)
Ratio (1)/(4)
Ratio (2)/(4)
Ratio (3)/(4)
0-11 0.00% 0% 6% Na na 0.00% na na na 12-23 0.02% -6% 6% 0.65% -0.04% 0.00% na na na 24-35 0.11% 23% 6% 1.80% 0.54% 0.12% 54.55 16.35 4.90 36-47 1.61% 37% 6% 6.60% 4.24% 0.98% 6.59 7.26 4.66
> = 48 0.41% 18% 6% 3.72% 1.02% 0.26% 26.09 16.15 4.44
Figure 6 Figure 7
16 Under the IRB Foundation Approach, 6% (i.e. 75% times 8%) regulatory capital is required when dealing with retail lease portfolios.
Credit Risk in the Leasing Business - A case study of low probability of default 30
Capital Requirement under IRB Foundation Approach (c o rpo rate) vs. Internal Model
-Equipment Leasing -
0123456789
10
0-11 12-23 24-35 36-47 > = 48 Age
%
Fundation App. (LGD: 40%) Internal Model
Capital Requirement under IRB Advanced Approach (retail) vs. Internal Model
- Equipment Leasing -
0123456789
10
0-11 12-23 24-35 36-47 > = 48 Age
%
Advanced App. Internal Model
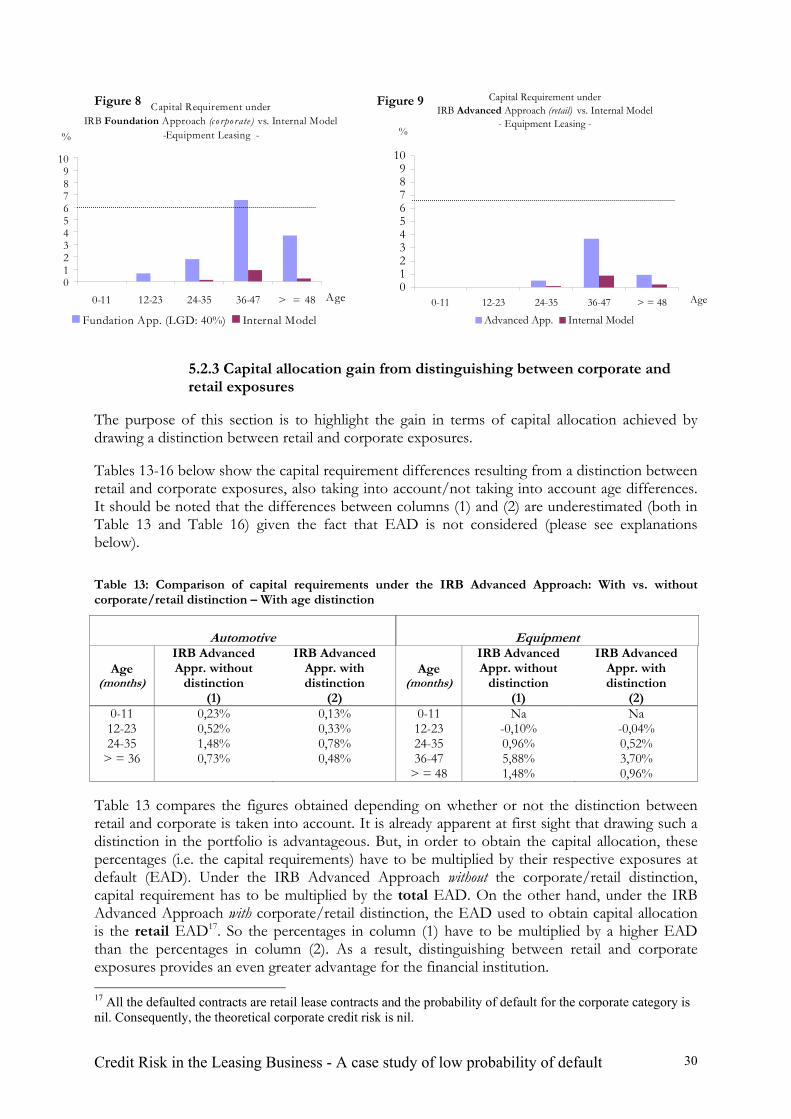
Figure 8 Figure 9
5.2.3 Capital allocation gain from distinguishing between corporate and retail exposures
The purpose of this section is to highlight the gain in terms of capital allocation achieved by drawing a distinction between retail and corporate exposures. Tables 13-16 below show the capital requirement differences resulting from a distinction between retail and corporate exposures, also taking into account/not taking into account age differences. It should be noted that the differences between columns (1) and (2) are underestimated (both in Table 13 and Table 16) given the fact that EAD is not considered (please see explanations below). Table 13: Comparison of capital requirements under the IRB Advanced Approach: With vs. without corporate/retail distinction – With age distinction
Automotive
Equipment
Age (months)
IRB Advanced Appr. without
distinction (1)
IRB Advanced Appr. with distinction
(2)
Age (months)
IRB Advanced Appr. without
distinction (1)
IRB Advanced Appr. with distinction
(2) 0-11 0,23% 0,13% 0-11 Na Na 12-23 0,52% 0,33% 12-23 -0,10% -0,04% 24-35 1,48% 0,78% 24-35 0,96% 0,52%
> = 36 0,73% 0,48% 36-47 5,88% 3,70% > = 48 1,48% 0,96%
Table 13 compares the figures obtained depending on whether or not the distinction between retail and corporate is taken into account. It is already apparent at first sight that drawing such a distinction in the portfolio is advantageous. But, in order to obtain the capital allocation, these percentages (i.e. the capital requirements) have to be multiplied by their respective exposures at default (EAD). Under the IRB Advanced Approach without the corporate/retail distinction, capital requirement has to be multiplied by the total EAD. On the other hand, under the IRB Advanced Approach with corporate/retail distinction, the EAD used to obtain capital allocation is the retail EAD17. So the percentages in column (1) have to be multiplied by a higher EAD than the percentages in column (2). As a result, distinguishing between retail and corporate exposures provides an even greater advantage for the financial institution. 17 All the defaulted contracts are retail lease contracts and the probability of default for the corporate category is nil. Consequently, the theoretical corporate credit risk is nil.

Credit Risk in the Leasing Business - A case study of low probability of default 31
When the corporate/retail distinction is made under the IRB Advanced Approach, two opposite effects in terms of capital requirement can be expected. First, higher PD estimates should lead to higher capital requirements, other things being equal. Secondly, the use of retail risk-weight functions should result in some favourable adjustments and, hence, lower capital requirements. In the light of our results, we can conclude that the second effect is rather more marked than the first one.
5.2.4 Comparison without age segmentation This analysis is useful to check the previous conclusions at a more general level. It should be stressed that these figures result from a totally new bootstrap computation whose details are not presented here. Instead of considering four and five age segments for the automotive and equipment segments respectively, we consider only two sub-portfolios by pooling leases by asset category. By doing so, a higher number of defaulted contracts can be considered in the computation. Tables 14, 15 and 16 show our results. Table 14: Comparison of capital requirements under the internal model (without distinction between corporate and retail exposures) vs. the Basel Committee’s Proposal
PD LGD Standardised
Approach (1)
IRBF Appr. (corp. risk-
weights; LGD: 40%) (2)
IRBA Appr. (corp. risk-
weights; actual LGD)
(3)
Internal Model
(4)
Ratio (1)/(4)
Ratio (2)/(4)
Ratio (3)/(4)
Automotive 0.15% 10.54% 8% 2.15% 0.57% 0.11% 72.73 19.59 5.16
Equipment 0.16% 30.18% 8% 2.24% 1.69 % 0.08%
(18) 100.00 27.94 21.08
Table 15: Comparison of capital requirements under the internal model (with distinction between corporate and retail exposures) vs. the Basel Committee’s Proposal
PD LGD Standardised
Approach (1)
IRBF Appr. (corp. risk-
weights; LGD: 40%)
(2)
IRBA Appr. (retail risk-
weights; actual LGD)
(3)
Internal Model
(4)
Ratio (1)/(4)
Ratio (2)/(4)
Ratio (3)/(4)
Automotive 0.18% 10.54% 6% 2.39% 0.36% 0.13% 46.15 18.39 2.76 Equipment 0.20% 30.18% 6% 2.54% 1.10% 0.14% 42.86 18.12 7.88
Table 16: Comparison of capital requirements under the IRB Advanced Approach: With vs. without corporate/retail distinction – Without age distinction
IRB Advanced Appr. (without distinction)
(1)
IRB Advanced Appr. (with distinction)
(2) Automotive 057% 0.36% Equipment 1.69% 1.10%
18 Since the equipment segment shows a higher PD and higher LGD than the automotive segment, we might expect a higher rate for the equipment segment under the internal model. However, the opposite situation is observed. One explanation may lie in the standard deviation of the PD factors.

Credit Risk in the Leasing Business - A case study of low probability of default 32
These results confirm our previous conclusions: the IRB Advanced Approach is more appropriate since institutions can calculate the required inputs internally, and a capital allocation gain can be achieved through the corporate/retail distinction.
5.3 Regulatory implications The empirical results show that lease exposures are relatively low-risk as compared to other means of financing. The presence of physical collaterals – in the form of a marketable asset owned by the lessor throughout the lease term – greatly contributes to this reduced risk profile. However, since the Basel Committee’s current proposal only provides for partial recognition of physical collaterals as credit risk mitigants, the leasing industry is concerned that this shortcoming might prevent capital requirements from adequately reflecting the actual risk profile of leases. The empirical results show that there is room for refinement and calibration of the Basel proposed new framework on capital adequacy so as to take into account the peculiarities of exposures such as leases. Indeed, because no distinct set of principles is provided for leases in the new framework (for example, in respect of mortgage lending), certain characteristics that distinguish lease exposures from other exposures may give rise to inconsistencies and/or confusion. In the following we discuss some of the regulatory implications confirmed by the present case study of ‘low probability of default’19. As far as the Standardised Approach is concerned, it is apparent that the 75% weighting ratio assigned to leases qualifying as retail exposures is very conservative. Indeed, because leases are low-LGD exposures, this weighting ratio suggests implied PDs that are significantly higher than the actual ones. This difference results in capital requirements varying significantly according to the approach selected by a leased company and is thus contrary to the EU Commission Services’ stated objective of providing modest incentives for institutions moving to a more Advanced Approach20. In order to prevent the new framework from entailing competitive distortion, one approach would be to extend the capital relief provided in the Standardised Approach of the current proposal to ‘other types of physical collaterals’, by reducing risk-weighting ratios for certain types of assets, subject to adequate minimum requirements (such as the existence of a liquid market for disposal of collateral in an expeditious and economically efficient manner, and the availability of well established market prices for the collateral). Given the risk profile of automotive leases, it appears that a 50% weighting ratio would be adequate – tough still conservative – for such exposures. Under the IRBF Approach, LGD is set by regulators and PD is the only input that should be estimated internally in order to calculate capital requirements. The absence of capital requirement adjustment for retail exposures and the low capital requirement relief granted for physical collaterals (LGD adjustment is limited to 5%)21 mean that this approach might not be economically sound for a significant proportion of leasing companies. This runs counter to the
19 See appendix for more general regulatory implications. 20 Cover Document to the Working Document of the Commission Services on Capital Requirements for Credit Institutions and Investments Firms, § 17, p.5. 21 A regulatory floor on LGD limits LGD adjustment to 40% for ‘other physical collaterals’ (cf. Working Document, Annex E-3, §3.1.4.2, p.29).

Credit Risk in the Leasing Business - A case study of low probability of default 33
Commission Services’ view of the IRBF Approach as being a core feature of the new Accord and of particular significance in the EU, where it can be expected to be adopted by a large number of institutions seeking to improve their risk measurement and management techniques and to receive appropriate recognition for this in their capital requirements22. It is worth highlighting that leased assets are among the collaterals for which the most stringent requirements must be met for their credit risk mitigating effects to be recognised. However, neither the extent of the capital relief granted nor the relatively low-risk profile of both assets [vehicle and equipment] exposures seem to justify this matter of fact. Some of the minimum requirements set for recognition of ‘other physical collaterals’ and leases should therefore be adjusted, notably in order to prevent such provisions from penalising retail exposures. Under the IRBA Approach, the minimum requirements set under the standardised and IRBF Approaches are used as a point of reference for financial institutions to establish internal requirements for collateral management, operational procedures, legal certainty and the risk management process. As these requirements are not designed for retail asset-based exposures, but rather, for financial-based and corporate ones, some adjustments may be required so as to provide a more appropriate framework for the assessment of leasing companies’ inputs according to their actual characteristics and risk profile. In the light of our results, it is apparent that the Standardised Approach will lead to much higher regulatory capital requirements than the IRB Approaches. In practice, therefore, institutions are more likely to choose the IRBF Approach or the IRBA Approach. The latter seems to be more appropriate because the capital requirements it entails take more fully into account the characteristics and risk profile of lease exposures. However, these benefits in terms of capital relief may be offset by the additional procedures and resource investment required for a financial institution to be allowed to apply the IRBA Approach.
22 Cover Document to the Working Document of the Commission Services on Capital Requirements for Credit Institutions and Investments Firms, §16, p.5.

Credit Risk in the Leasing Business - A case study of low probability of default 34
Conclusion This paper presents empirical results on the default and loss severity of leases, focusing on a major European leasing company and taking into account ex-ante and ex-post data for two types of leased asset. By implementing a non-parametric simulation – modelled on that used by Carey (1998) on privately debt portfolios in the U.S – to assess the credit risk associated with lease portfolios, we computed the total losses of lease portfolios for any confidence level. Our results confirm that leasing is a low-risk activity and point to the need to review the Basel proposal in order to provide for better recognition of physical collaterals other than real estate. Amending the proposal in the light of our findings might be essential to prevent undue differences in regulatory capital requirements, and hence competitive distortions, resulting from the adoption of one or the other approach Secondly, our study shows that the Standardised and IRB Foundation Approaches are not viable options for leasing businesses active in the retail segment, given that both of these approaches lead, in our case, to higher regulatory capital requirements than the IRB Advanced Approach. Consequently, the latter seems more appropriate since its capital requirements are closer to our internal model. Furthermore, given the low probabilities of default, which characterise our database, there appears that a small variation in term of probability of default could lead to higher change in capital requirement than in the case of other leasing companies. Finally, our research suggests it is advantageous to distinguish between retail exposures and corporate exposures. The leasing company examined in our study will benefit from making the corporate-retail distinction under the IRB Advanced Approach. Since the studied portfolio is mostly made up of retail exposures, the distinction may have significant implications in terms of lowering the required regulatory capital by taking into account the diversification effect of retail exposures. Our study should be helpful in defining a benchmark for adequate capital requirements for leasing businesses. Additionally, the results are relevant to issues concerning the insurance and securitisation of lease portfolios. However, we are aware that the data we used in our research to estimate credit risk come from only one (albeit highly representative) European financial institution. Certain methodological improvements could be introduced in future research, firstly by working with a larger database and, secondly, by removing certain problematic assumptions. At any rate this paper highlights the legitimate concerns of an industry dealing with a specific product that has not yet been given sufficient consideration by the Basel Committee.

Credit Risk in the Leasing Business - A case study of low probability of default 35
References
ALTMAN E. and KISHORE V., 1996, ‘Almost everything you wanted to know about recoveries on defaulted bonds’, Financial Analyst Journal, November-December, pp. 56-62.
ALTMAN E., 1989, ‘Measuring corporate bond mortality and performance’, Journal of Finance, Vol. 44, pp. 909-922.
BASEL COMMITTEE ON BANKING SUPERVISION, 2001a, ‘A proposal for a new Basel capital accord’, BIS, Basel Switzerland, 139 pages.
BASEL COMMITTEE ON BANKING SUPERVISION, 2001b, ‘Potential modifications to the committee’s proposals’ , BIS, Basel, Switzerland, 6 pages.
BASEL COMMITTEE ON BANKING SUPERVISION, 2001c, ‘Results of the second quantitative impact study’, BIS, Basel, Switzerland, 10 pages.
BASEL COMMITTEE ON BANKING SUPERVISION, 2002, ‘Note from the models task force: Summary of current MTF proposals on the IRB treatment of retail exposures’, 8 pages.
BASEL COMMITTEE ON BANKING SUPERVISION, 2002, ‘Quantitative Impact Study 3 – Technical Guidance’, BIS, Basel, Switzerland, 164 pages.
CAREY M., 1998, ‘Credit risk in private debt portfolios’, Journal of Finance, Vol. 53, No.4, pp.1363-1387.
EUROPEAN COMMISSION – DG INTERNAL MARKET, 2002, ‘Working document of the Commission Services on capital requirements for credit institutions and investment firms’, November 18th, 44 pages.
IBM Institute for Business Value, 2002, ‘Banks and Basel II: How Prepared are they?’, October 21.
LEASEUROPE, 2002, Newsletter - Overview of Basel II Latest Developments and Quantitative Impact Study (QIS 3), November, 14 pages.
LEASEUROPE, 2003, Position Paper on the Working Document of the Commission Services on Capital Requirements for Credit Institutions and Investment Firms, 7 February, 14 pages.
RESTI, A., 2002, ‘The new Basel capital accord: Structure, possible changes, micro- and macroeconomic effects’, A report submitted to the Centre for European policy Studies (CEPS), Brussels, 37 pages.
SCHMIT M. and STUYCK J., 2002, ‘Recovery rates in the leasing industry’. Working paper, Leaseurope,http://www.leaseurope.org/pages/Studies_and_Statements/Studies/, 39 pages.

Credit Risk in the Leasing Business - A case study of low probability of default 36
SCHMIT M., STUYCK J. and DUCHEMIN S., 2003, ‘Credit Risk Issues in the automotive leasing industry’, Working Paper, Brussels, 11 pages.

Credit Risk in the Leasing Business - A case study of low probability of default 37
Appendix
On 7 February LEASEUROPE sent a position paper to its members in order to share the federation’s expertise in credit risk issues of concern to the leasing business with a view to contributing to the refinement and calibration of the new Basel proposal. The paper outlines the industry’s main concerns as regards the likely impact of the new regulatory framework. Backed by empirical results, the arguments advanced highlight the importance that should be attached to certain key characteristics of leasing – such as the existence of physical collaterals – in determining adequate capital requirements for the leasing industry. A number of practical recommendations are also proposed. The position paper is available on Leaseurope’s website at
http://www.leaseurope.org/pages/Matters_of_concern/Details.asp?ITEM_id=436&SUBJECT_name=Capital%20Adequacy .