CREDIT AND LIQUIDITY SUPPORT IN … AND LIQUIDITY SUPPORT IN SECURITISATIONS AND IMPLICATIONS FOR...
40
CREDIT AND LIQUIDITY SUPPORT IN SECURITISATIONS AND IMPLICATIONS FOR BANK SOLVENCY Anna Sarkisyan † , Barbara Casu ‡ This version: 03 March 2012 ABSTRACT Using US bank holding company data for the period 2001 to 2007, this paper examines the relationship between banks’ involvement in securitisations and insolvency risk. We find that the overall level of retained interests and guarantees increases bank risk. Breaking down retained interests by the form of the underlying facility, we find that credit enhancements and seller’s interest have a risk-increasing effect, while the provision of liquidity support appears to lessen risk. Credit-enhancing interest-only strips have the strongest risk-increasing effect, consistently with their subordinated (first loss) position, while the effect of subordinated securities is positive although not statistically significant. This appears to (weakly) support the theoretical literature on the mitigating effect on bank risk taking of holding a subordinated/equity tranche. Finally, we find that that engagement in third-party securitisations does not have significant effect on bank risk. Keywords: securitisation; insolvency risk; contractual retained interests JEL Classification: G21; G32 This paper has been prepared by the authors under the Lamfalussy Fellowship Program sponsored by the ECB. Any views expressed are only those of the authors and do not necessarily represent the views of the ECB or the Eurosystem. † Corresponding author. Essex Business School, University of Essex, Wivenhoe Park, Colchester CO4 3SQ. Email: [email protected] ‡ Cass Business School, City University London, 106 Bunhill Row, London EC1Y 8TZ. Email: [email protected]
Transcript of CREDIT AND LIQUIDITY SUPPORT IN … AND LIQUIDITY SUPPORT IN SECURITISATIONS AND IMPLICATIONS FOR...

CREDIT AND LIQUIDITY SUPPORT IN SECURITISATIONS AND IMPLICATIONS FOR BANK SOLVENCY
Anna Sarkisyan†, Barbara Casu‡
This version: 03 March 2012
ABSTRACT
Using US bank holding company data for the period 2001 to 2007, this paper examines the relationship between banks’ involvement in securitisations and insolvency risk. We find that the overall level of retained interests and guarantees increases bank risk. Breaking down retained interests by the form of the underlying facility, we find that credit enhancements and seller’s interest have a risk-increasing effect, while the provision of liquidity support appears to lessen risk. Credit-enhancing interest-only strips have the strongest risk-increasing effect, consistently with their subordinated (first loss) position, while the effect of subordinated securities is positive although not statistically significant. This appears to (weakly) support the theoretical literature on the mitigating effect on bank risk taking of holding a subordinated/equity tranche. Finally, we find that that engagement in third-party securitisations does not have significant effect on bank risk.
Keywords: securitisation; insolvency risk; contractual retained interests
JEL Classification: G21; G32
This paper has been prepared by the authors under the Lamfalussy Fellowship Program sponsored by the ECB. Any views expressed are only those of the authors and do not necessarily represent the views of the ECB or the Eurosystem. † Corresponding author. Essex Business School, University of Essex, Wivenhoe Park, Colchester CO4 3SQ. Email: [email protected] ‡ Cass Business School, City University London, 106 Bunhill Row, London EC1Y 8TZ. Email: [email protected]

2
1 INTRODUCTION
The development of securitisation over the past three decades has had a remarkable impact on the world financial systems. It has modified the functioning of banking markets from the traditional “originate-to-hold” model to the “originate-to-distribute” model, thereby significantly increasing the reliance of financial intermediaries on capital markets as a source of finance. This finance technique of packaging, underwriting, and selling assets in the form of asset-backed securities has allowed originators to manage credit and concentration risks, diversify funding sources, reduce funding costs, and improve performance indicators. Securitisation markets experienced a decade of tremendous growth from the mid-1990s: the US market increased from $2.9 trillion in 1996 to $11.6 trillion outstanding at year-end 2007, while the EU market reached $1.97 trillion at year-end 2007 from $7.9 billion in 1996 (SIFMA). After the extended period of growth, global securitisation markets collapsed during the financial crisis of 2007-2009.
The financial crisis exposed the risks inherent in the securitisation process. One of the key issues that came to light was evidence that banks used increasingly complex securitisation structures that ultimately resulted in little credit risk transfer (Acharya, Schnabl, and Suarez, 2012). Although securitisation has commonly been seen as a credit risk transfer technique, the ultimate amount of risk transference achieved depends of the specific structure of a transaction (Ryan, 2008; Chen, Liu and Ryan, 2008). A typical securitisation structure may contain one or more credit enhancements, with varying subordination (first loss) structure. Credit enhancements are contractual arrangements in which the bank retains or assumes a securitisation exposure and, in substance, provides some degree of added protection to other parties in the transaction (BCBS, 2002). Effectively, the practice of providing internal credit enhancements to own securitisation structures resulted in banks retaining on their balance sheet the risks of their off-balance sheet securitised assets.
The type and the amount of credit enhancements are normally determined by rating agencies and underwriters, and are based on the expected performance of the underlying pool of assets. One or more credit enhancement facilities are usually required in order to receive a high enough debt rating to make the resulting asset backed securities readily marketable. Although no two deals are the same, a typical securitisation structure may contain any of the following contractual retained interests (as well as third-party guarantees): credit enhancements; liquidity provisions and seller's interest (over-collateralisation). Senior/subordinate structures are layered so that each position benefits from the credit protection of all the positions subordinate to it. The junior positions are subordinated in the payment of both principal and interest to the senior positions. The priority of claims is an important feature of a structured transaction although the mechanisms of interest subordination are somewhat opaque and ad-hoc in complex structures.
While the motivations for the provision of contractual credit enhancements and guarantees put forward by the theoretical literature differ and may not be mutually exclusive

3
(mitigation of information asymmetries, regulatory arbitrage, liquidity creation) the 2007-2009 crisis has shown the importance of fully understanding the potential risk implications of retained interests for the originating institutions, and thereby for the banking system.
Against this background, this study aims to contribute to the current debate and examines the relationship between banks’ involvement in their off-balance sheet securitisations and bank insolvency risk. Specifically, we develop and test the following hypotheses. First, if the level of contractual retained interests is designed to mitigate information asymmetries and is a signal to the markets of the commitment of the bank to its own securitisation structures, then retained interests should increase banks' incentives to screen and monitor borrowers and should therefore decreases bank overall risk. Instead, if the level of contractual retained interests is designed to reflect the risk of the underlying assets, and it is close to the expected probability of default, this will result in no credit risk transfer. We hypothesise a positive association between the overall level of retained interests and bank insolvency risk.
Second, the level and type of contractual retained interests is typically determined by costs and market placement factors. On one hand, as the costs of credit enhancements and other guarantees are one of the largest expenses for the securitising bank (aside from the coupon rate paid to investors), we would expect banks seeking to minimise the costs associated with providing credit protection. On the other hand, a substantial level of credit enhancement might be required by credit rating agencies in order to award a high debt rating. These two conflicting aims might in turn be achieved through a greater reliance on internally provided enhancements and guarantees. This is because internally provided guarantees are contingent claims and are only triggered when a loss occurs. Third-party guarantees are more costly in terms of up-front fees, normally have limits on the exposure and are typically used after the internally provided guarantees have been exhausted. Ex-ante, internal credit enhancements are less costly than external ones. Ex-post, in case of losses, they can potentially entail much greater costs. We therefore hypothesise that internal credit enhancements have a greater positive association with bank insolvency than support offered to third-party structures.
Finally, given the subordinated structure of some credit-enhancing mechanisms, we hypothesise that different arrangements have different implications for bank overall risk. In addition, the interaction between different forms of support may increase the complexity of the relationship. Given regulators' attempts to revive the securitisation market post-crisis, and the importance attached to risk retention mechanisms (the so-called "skin in the game”) by recent regulatory proposals, it is therefore of paramount importance to understand the implications of various mechanisms for bank solvency. 1 Recent research examines the power of different contractual mechanisms and concludes that equity tranche retention might not always be the most effective mechanism (Fender and Mitchel, 2009). However, attention has 1 For example, in the US the proposed rules implementing the credit risk retention requirement as mandated by the Dodd-Frank Wall Street Reform and Consumer Protection Act for certain securitisation transactions.

4
focused mainly on tranching and has largely ignored other commitment mechanisms. We complement this recent strand of the literature and consider a wide range of contractual characteristics, including credit enhancements and liquidity provisions and their relationship with bank insolvency risk. We hypothesise a stronger impact of credit enhancements on bank overall risk, while the impact of liquidity support is ambiguous.
As a way of preview, our results provide support for all the three hypotheses and remain consistent across several specifications. While there is no evidence of a significant relationship between securitisation outstanding and bank risk, we find that the impact of retained interests is negative and statistically significant. In other words, it is not the level of securitisation that affects banks insolvency risk but the level of retained interests and guarantees offered to the securitisation structures. Looking at the form of the underlying facility, we find that credit enhancements and seller’s interest have a risk-increasing effect, while the provision of liquidity support appears to lessen risk, although the coefficient is not statistically significant. We explain this result by the intrinsic nature of liquidity support; liquidity provisions are in general excess funds provided by the originator to the SPV, to provide the SPV with a buffer, so the first loss is absorbed by the SPV.
Further, to analyse credit enhancements in more detail, we decompose them into: credit-enhancing interest-only strips, subordinated securities, and standby letters of credit. The results show that credit-enhancing interest-only strips have the strongest risk-increasing effect, consistently with their subordinated (first loss) position. Standby letters of credit also have a risk increasing effect, while subordinated securities seem to have a positive (albeit statistically insignificant) risk reducing effect. This is a particularly interesting result as it offers some support the theoretical literature on the mitigating effect on bank risk taking of holding a subordinated/equity tranche. Finally, we find that engagement in third-party securitisations in either form does not have significant effect on risk of the banks.
The remainder of the paper is organised as follows: Section 2 provides some institutional background on securitisation; Section 3 develops our hypotheses and briefly reviews previous findings; Section 4 describes the data and provides descriptive statistics of the sample; the empirical specification is presented in Section 5; Section 6 reports the results of the analysis conducted to test our hypotheses; Section 6 describes the robustness tests performed on the results, and finally, Section 7 discusses the findings and concludes the paper.
2 INSTITUTIONAL BACKGROUND
Traditionally, a securitisation transaction involves the pooling of assets with fixed or nearly fixed cash flows that are then transferred to a special purpose vehicle (SPV), a bankruptcy-remote entity that in turn finances the purchase through the issuance of securities backed by the pool.
The first step in the securitisation process is the pooling of assets, which should enable issuers to achieve lower credit risk by decreasing the risk of idiosyncratic shocks among

5
assets. The second step involves the creation of a securitisation vehicle (SPV) and the transfer of the pool of assets to the SPV, as a way to reduce bankruptcy costs. The third step is the structuring of the transaction. This is commonly done by tranching, and the provision of credit enhancements and guarantees, with the aim of isolating and distributing credit risk.
Tranching is a technique used by issuers to create securities with a subordinated structure, that is to create bond classes with different degrees of priority and therefore re-distribute the risk of the underlying assets among the different tranches. In addition to tranching, in order to reduce credit risk for investors, and thereby increasing the credit rating (and therefore the pricing and marketability) of the asset-backed securities, the SPV can obtain credit enhancements. Credit enhancements are contractual provisions which aim to reduce the likelihood that losses from the underlying assets are borne by investors.
Credit enhancements can be provided both on a contractual and non-contractual basis. 2 Contractual credit enhancements may take different forms and can be provided internally, externally, or a combination of both. Internal contractual credit enhancements, also known as contractual retained interests, can be generated by the cash flows from the underlying assets (excess spread), by the structure of the transaction (subordinated securities), or can be provided by the originating bank (liquidity provisions, stand-by letters of credit). External contractual credit enhancements include the credit support provided by other institutions and may take the form of a third-party letter of credit, cash collateral account, and surety bonds.
A typical securitisation structure may contain one or more credit enhancements, with varying subordination (first loss) arrangements. Figure 1 illustrates the waterfall structure of claims (in order from junior to senior). The priority of claims is an important feature of a structured transaction. However, apart from the subordination of tranches of different credit rating, there is little consensus among industry practitioners and regulators over a clear waterfall structure.
<Insert Figure 1 about here>
Contractual Retained Interests
Examples of internal contractual arrangements include: excess spread (spread account), subordinated securities (tranches), seller's interest (over-collateralisation), and standby letters of credit. In addition, liquidity provisions might also serve as a credit-enhancing facility if they provide credit support to the securitisation structure.3 Below we review the forms of contractual retained interest that are most relevant for this study.
2 The seller/originator may also provide non-contractual internal credit enhancements, which can be defined as credit support beyond the originator’s contractual obligations and is commonly referred to as “implicit recourse”. This is a particular problem normally associated with the securitisation of revolving assets, such as for example, credit card receivables. The existence of implicit recourse is difficult to prove. 3 Letters of credit and liquidity provisions can also be provided to third-party structures (or acquired by third-party providers). The intrinsic features of the instrument remain the same and therefore we do not review externally provided commitments and guarantees separately.

6
Excess Spread
Excess spread is a general feature of securitisations, as the yield on the underlying loan portfolio for a given month generally exceeds the expenses of the SPV including the interest paid on the asset-backed securities, servicing costs, and expected losses. The excess spread is typically held on the originator’s balance sheet in the form of interest-only (IO) strips, which, in effect, represent the present value of the future expected income that the bank expects to receive on the securitised assets. An IO strip is defined as credit-enhancing (CE IO) if it provides credit support to the securitisation, that is, its value declines with credit losses on underlying assets (FDIC, 2007).4 Excess spread normally bears the first loss.
Subordinated Securities
Securitisations also typically have a senior/subordinated or tranched structure, where the senior tranche of investment grade is supported by mezzanine tranches, which in turn are supported by an unrated subordinated equity tranche. The latter is the most risky tranche as it absorbs first losses and is commonly held by the originating bank as retained interest in the securitisation.5 In securitisations with both CE IO strips (which are present in every transaction) and retained subordinated securities, typically the subordinated securities bear losses only after the CE IO strips are exhausted.
Letter of Credit
The credit quality of asset-backed securities can also be enhanced by a letter of credit, which is an unfunded commitment that guarantees limited protection against losses, typically catastrophic losses, on the underlying assets. A letter of credit obliges the issuer to honour demands for payment up to the specified amount, which is normally determined by the perceived credit risk in the underlying assets.
Seller’s Interest (Over-collateralisation)
Another form of credit enhancing the securitised pool is over-collateralisation, which represents bank’s ownership interest, or the so called seller’s interest, in the SPV’s assets that has not been securitised and is, therefore, not pledged to back the issued securities.6 Seller’s interest can be held in the form of loans and/or securities; in terms of subordination, it has the same priority on claims on the underlying assets as asset-backed securities (FDIC, 2007).
Liquidity Provision
Securitisations also require liquidity support, which can be provided in the form of any arrangement, including servicer cash advances, where the issuing entity is obliged to provide funding to the securitisation to ensure investors of timely payments on asset-backed securities or to ensure investors of payments in the event of market disruptions. Typically, advances
4 CE IO strips are recorded as “other assets” on the originator’s balance sheet and as “credit-enhancing interest-only strips” on the off-balance sheet securitisation schedule. 5 The retained subordinated assets are reflected as “other assets” on the bank’s balance sheet. 6 The principal amount of the seller’s interest in a securitisation is defined as the total principal amount of assets included in the securitisation less the principal amount of assets attributable to investors in the form of issued securities (FDIC, 2007).

7
under liquidity facility are reimbursed from subsequent collections from the securitisation and are not subordinated to other claims on the cash flows from the underlying assets and, therefore, should generally not be construed as a form of credit enhancement. However, if the advances under such a facility are subordinated to other claims on the cash flows, the facility constitutes a credit enhancement (FDIC, 2010). A cash account is a separate reserve fund, created by the issuer at the beginning of the deal, that is commonly used as to cover shortfalls in interest and principal. This is junior to the claims of holders of all other classes of bonds, including the equity tranche.
As discussed above, securitisations structures may contain any combination of the above contractual retained interests, and the choice is largely driven by cost considerations and market placement factors. This, in effect, resulted in banks retaining significant credit risk exposure in connection to the securitised portfolios through both explicit and implicit arrangements.
3 THEORETICAL HYPOTHESES AND PREVIOUS FINDINGS
The process of securitisation raises issues of information asymmetries and misaligned incentives between banks and investors. Banks have private information on the quality of loans they securitise. As investors do not have this information, they may require a 'lemon discount' which can drive the price of the resulting securities below their book value. This results from the fact that the incentive structure of securitisation can create adverse selection (low quality loans are securitised) and moral hazard problems (as loans can be sold, lenders lack incentives to screen and monitor borrowers).
These asymmetric information problems may constrain a bank's ability to securitise loans. As a consequence, in order to attract investors to buy asset-backed securities, banks must be able to offer explicit or implicit contractual design features that help mitigate adverse selection and moral hazard (Pennacchi, 1988). Gorton and Pennacchi (1995) consider two possible features of bank loan sales which could reduce the asymmetric information problem: (i) offering an implicit guarantee on the value of the loan, and (ii) retaining a portion of the loan on the bank’s balance sheet. The authors argue that in these cases a bank retains some of the default risk of loans and, therefore, there still remains an incentive for the bank to screen and monitor borrowers. Further, Gorton and Souleles (2005) show that an originator’s ability to finance off-balance sheet via the debt of an SPV critically depends on the implicit guarantee contract between the originator and investors. Fender and Mitchell (2009a) examine the power of different contractual mechanisms to influence an originator’s effort to screen borrowers when the originator plans to securitise the loans.
However, if an originating financial intermediary retains a subordinated piece of a securitisation or a level of recourse close to the expected level of loss, essentially all of the economic risk remains with the intermediary. Evidence consistent with the perception that originating banks retain most of the risk related to the transfer of assets is provided by Calomiris and Mason (2004) and Niu and Richardson (2006). Landsman, Peasnell and Shakespeare (2008) show that markets view securitisation transactions by originating firms with relatively low retained interest as sales (i.e., risk transfer has taken place), whereas asset

8
securitisations with high retained interest are viewed as secured borrowings (i.e., risk transfer is incomplete). Chen, Liu and Ryan (2008) examine characteristics of loan securitisations that determine the extent to which banks retain the risks of the off-balance sheet securitised loans and find that the structure of the securitisation is not independent of the risks of the pool. Specifically, the type and magnitude of retained contractual interest depend on the characteristics of the assets being securitised and increase when assets have higher or less externally verifiable credit risk. These results are consistent with Park (2011), which shows that credit enhancement mechanisms, including tranching, reflect the risk of the underlying portfolio.
Dang, Gorton and Holmstrom (2011) argue that that the purpose of securitisation is to create information-insensitive securities, which are defined as securities that are immune from adverse selection when trading (that is, the values of these securities do not depend on the information known only to informed agents). This property makes the information-insensitive security liquid. The idea is that, by offering credit enhancements, the originator can delink the ex-ante credit risk of the asset pool and therefore issue securities that are independent from the credit risk of the collateral. The incentive for structuring transactions with credit enhancements and other contractual retained interests is thus to ensure the liquidity of the securities.
A recent study by Acharya, Schnabl and Suarez (2012) also investigates the lack of credit risk transference in structured securitisation transactions by analysing ABCP conduits (a type of SPV) and shows how the structure of risk-sharing in the conduits implied recourse back to bank balance sheets. They find that banks used conduits to securitise assets without transferring credit risk and explain the results as evidence of regulatory capital arbitrage. In other words, the provision of contractual guarantees to conduits allowed banks to reduce their economic capital while maintaining a stable regulatory capital ratio.
While the theoretical motives for providing additional support to securitisation structures might vary, the empirical evidence across the studies is consistent and suggests that retention of interest, including contractual and non-contractual credit enhancements, leads to a lack of credit risk transfer. Whether this commitment to keep part of the risk generates positive incentives for banks to screen and monitor borrowers, and securitise high quality loans (and therefore reduce banks overall risk) or whether it simply results in increased risk exposure and therefore increased probability of default is controversial.
This study aims to contribute to the current debate and examine the relationship between banks’ involvement in their off-balance sheet securitisations and bank insolvency risk. Specifically, we develop and test the following hypotheses.
H1: If the level of contractual retained interests is designed to mitigate information asymmetries and signals the commitment of the bank to its own securitisation structures, then retained interests should decreases bank overall risk. If it is designed to reflect the risk of the underlying assets, and the level of retained interests is close to the expected level of loss, this will result in a increase in banks overall risk. We hypothesise a positive association between the overall level of retained interests and bank insolvency risk.

9
In theoretical models of securitisation, the issues of moral hazard and adverse selection issues have been examined by focusing on two, non-mutually exclusive, features of securitisation (Gorton, 2011). The first relates to the design of securitisation, that is the pooling (the choice of assets to sell to the SPV); the second relates to the structuring of the transaction (tranching, credit enhancement and implicit recourse). In practice, originators have little choice over the level and type of contractual retained interests as these are typically determined by credit rating agencies, underwriters and market placement factors. A recent study by Chen, Liu and Ryan (2008) provides evidence that certain general characteristics of banks’ loan securitisations determine the extent to which banks retain risks in connection to the off-balance sheet securitised assets. The authors find that banks retain more risk when: (i) the types of loans have higher and/or less externally verifiable credit risk; (ii) the loans are closed-ended and banks retain larger contractual interests in the loans; and (iii) the loans are closed-ended and banks retain types of contractual interests that more strongly concentrate the risk of the securitised loans. Another factor driving the choice of the type and amount of guarantees provided are cost considerations. Third-party guarantees are more costly in terms of up-front fees, normally have limits on the exposure and are typically used after the internally provided guarantees have been exhausted. The characteristics of the loans securitised, the amount of guarantees required to achieve higher credit rating as well as the cost of such guarantees all play a role in the structuring of the transaction and may give banks incentives to provide internal credit enhancements Banks may retain a larger amount of contractual interest if the assets securitised are more opaque, if the assets are riskier and if the cost of obtaining external guarantees is ex-ante higher.
H2: If internal contractual credit enhancements are preferred on the basis of ex-ante cost and risk considerations, then we expect a positive association between the level of internal contractual retained interests and bank insolvency risk.
Finally, given the subordination mechanism of some credit-enhancing arrangements, we hypothesise that different arrangements have different implications for bank overall risk. Recent research examines the power of different contractual mechanisms and concludes that equity tranche retention might not always be the most effective mechanism (Fender and Mitchell, 2009). In a theoretical analysis, the authors find that contractual mechanisms, including holding an equity tranche, a mezzanine tranche, or a “vertical” slice of the portfolio (a share of the entire portfolio), do affect the screening effort by the originating institution; however, the effect varies across the arrangements depending on their sensitivities to systemic risk factors. They find that the equity tranche may be dominated by either a vertical slice or by a mezzanine slice if a downturn is likely. We complement this recent strand of the literature and consider a wide range of contractual characteristics, including credit enhancements (excess spread, subordination and stand-by letters of credit); seller’s interest, and liquidity provisions and their relationship with bank insolvency risk.
H3: Different types of contractual retained interests may have a different impact on bank insolvency risk. We expect the relationship to be driven, to a large extent, by the level of subordination.

10
Proper alignment of incentives in securitisation remains of crucial importance for both market practitioners and regulators. Retention practices may have different impact on bank overall risk. An improved understanding of the commitment mechanisms that banks offer to their securitisation structures, as well as their interactions, are one of the key issues to help align bank incentives with those of investors and markets. Policy recommendations concerning the future of securitisation require a better understanding of these issues. However, while there is a large literature on the relationship between securitisation and risk, the literature on interest retention in securitisation is still relatively scant. This study attempts to address these questions and makes three main contributions to the literature. First, we focus on analysing the relationship between banks’ securitisation activities and insolvency risk measured as a distance to default (a z-score measure). Second, we consider a wide range of retained interests, including credit-enhancing interest-only strips, subordinated securities, standby letters of credit, seller’s interest, and liquidity provisions. Finally, we examine credit and liquidity support provided to other institutions’ securitisations. These analyses provide wider insights into banks’ securitisation activities and make a valuable contribution to the existing research on securitisation.
4 DATA AND DESCRIPTIVE STATISTICS
4.1 Data and Sample Selection
To study the effect of securitisation on bank insolvency risk, we use US bank holding company (BHC) data from Y-9C forms obtained from the Federal Reserve Bank of Chicago.7 The Y-9C reports are filed by all BHCs since 1986 and collated quarterly bank financial data on a consolidated basis in the form of a balance sheet, an income statement, and detailed supporting schedules, including a schedule of off-balance sheet items.
Since June 2001, US banks have been required to provide detailed information on their securitisation activities in the regulatory forms. Specifically, banks are required to report the following items on the securitisation schedule (Schedule HC-S of the Y-9C report): (i) securitised assets, as an outstanding principal balance of assets sold and securitised with servicing retained or with recourse or other seller-provided credit enhancements; (ii) maximum credit exposure arising from recourse or other seller-provided credit enhancements provided to the reported securitisation structures in the form of (a) credit-enhancing interest-only strips, (b) subordinated securities and other residual interests, and (c) standby letters of credit and other enhancements;8 (iii) unused commitments to provide liquidity to securitisation structures; (iv) past due amounts, charge-offs, and recoveries on the securitised
7 We use data for bank holding companies rather than for commercial banks because risk and capital management are typically administered at the highest level of the financial group. Additionally, securitisation may involve several subsidiaries of a BHC and affect capital and liquidity planning for the whole group (Aggarwal and Jacques, 2001; Thomas and Wang, 2004). 8 Credit-enhancing interest-only strips are reported from the second quarter of 2001; subordinated securities and standby letters of credit are reported from the first quarter of 2003.

11
assets; (v) seller’s interests in the form of securities and loans9; (vi) past due amounts, charge-offs, and recoveries in seller’s interests. The schedule also provides information on: (i) maximum amount of credit exposure arising from credit enhancements provided by the reporting institution to other institutions’ securitisation structures (an aggregate measure of credit enhancements including standby letters of credit, purchased subordinated securities, and other enhancements); and (ii) reporting institution’s unused commitments to provide liquidity to other institutions’ securitisation structures. The data on securitisation activities are reported broken down into seven categories according to the underlying assets: (i) 1-4 family residential loans; (ii) home equity lines; (iii) credit card receivables; (iv) auto loans; (v) other consumer loans; (vi) commercial and industrial loans; and (viii) all other loans, all leases, and all other assets.
The incorporation of the new data into the Y-9C reporting forms and the empirical design of this study determine year 2001 as the start date of the sample period, which yields 27 quarters from the second quarter of 2001 to the fourth quarter of 2007. In our study we use data only on securitising banks. When constructing the data set, we first exclude banks with missing information on total assets, liquidity, loans, deposits, capital, income, and securitisation activities for any quarter of the sample period. We also exclude banks with data for less than 2 full years.10 When banks go through a merger or an acquisition, we maintain the code of the acquiring BHC while the acquired bank is eliminated from the sample. We then define a bank as a securitiser if there is a non-zero outstanding securitisation in at least one quarter and keep in the final data set only securitising banks. Next, we average the quarterly data over the quarters in a year to create bank-year observations. Finally, to prevent the possibility of outliers driving the results, we winsorise all yearly variables at 1% level.11 This selection procedure yields 1097 bank-years for 197 securitising BHCs.12
4.2 Descriptive Statistics
Before turning to the main regression analysis, we analyse the sample banks along: (i) balance sheet structure; (ii) loan portfolio; (iii) regulatory capital; (iv) risk; (v) operating performance; and (vi) securitisation activities.13 In doing, so we calculate time-series averages for each BHC, which are then used to obtain the statistics for the sample. Results of the descriptive analysis are presented in Table 1.
<Insert Table 1 about here>
We find that the average size of BHCs in the sample is slightly over $46 billion with a wide range from $2 billion to $1,150 billion total assets. Of those, on average, 25% is held in
9 Seller’s interest is reported only for home equity line, credit card, and commercial and industrial loan securitisations. 10 For 2001, “full year” refers to the last three quarters of the year as the sample starts from the second quarter of 2001. 11 Winsorisation consists of replacing the data below the Nth percentile with the Nth, i.e., a 1% winsorisation implies replacing the data below 1st percentile with the 1st percentile data. 12 The 197 securitising BHCs used in this study constitute around 80% (by total assets) of the original data set of 1,871 BHCs. 13 The construction of the variables is described in detail in Appendix A.

12
the form of liquid assets and around 1.3% in the form of trading assets. The loan portfolio constitutes around 64% of BHCs’ total assets and is, on average, diversified as suggested by the loan Herfindahl-Hirschman Index (HHI) of 0.56.14 Turning to the liability side, the sample banks are mainly financed by deposits, which constitute around 60% of total assets. The capitalisation of the sample BHCs is around 10%; looking at the regulatory capital, the sample BHCs tend to be relatively highly capitalised (e.g., 14% for the total risk-based capital ratio).
Considering performance measures, the data suggest that interest income constitutes the main source of revenue for the sample banks (around 70%) with the two-part revenue HHI of 0.64. As for the net income, it constitutes, on average, around 14% of equity or 1.3% of total assets of the sample banks. Looking at the risk characteristics of the banks, we find that for the average BHC in the sample the risk-weighted assets to total assets (RWATA) ratio is 0.73; non-performing loans constitute 1% of total loans, while the charge-offs and loan loss provisions constitute around 0.1% relative to total loans.
We next proceed to discuss some securitisation statistics, which are reported in the last panel of Table 1. The data show that the amount of outstanding securitised assets constitutes, on average, around 8% of banks’ total assets, while contractual interests retained in connection to securitised assets in the form of credit enhancements, liquidity support, and seller’s interest, constitute in aggregate 0.5% of total assets. Looking at the distribution across the forms of retained interests, credit enhancements constitute 0.2% of total assets, liquidity provisions constitute 0.02%, and seller’s interest constitutes 0.3% of total assets.15 Finally, breaking down credit enhancements by the form of facility, we find that credit-enhancing interest-only strips constitute, on average, 0.07% of total assets, subordinated securities constitute 0.1%, and standby letters of credit constitute 0.06% of total assets. Table 1 also reports information on banks’ engagement in other institutions’ securitisations in the form of credit and/or liquidity support. We find that the credit exposure arising from credit enhancements provided by the sample banks to other institutions’ securitisations constitutes 0.003% of banks’ total assets, while banks’ commitments to provide liquidity constitute 0.004% of total assets.
To analyse banks’ securitisation activities not diluted by zero securitisation values, Table 2 provides statistics for observations with: (i) non-zero total outstanding securitisation; (ii) non-zero mortgage securitisation; (iii) non-zero home equity line securitisation; (iv) non-zero credit card securitisation; (v) non-zero auto securitisation; (vi) non-zero other consumer loan securitisation; (vii) non-zero commercial and industrial securitisation; and (viii) non-zero all other loans, leases, and assets securitisation.
<Insert Table 2 about here>
14 Loan Herfindahl-Hirschman Index (HHI) is calculated using four loan categories: (i) real estate loans, (ii) commercial and industrial loans, (iii) consumer loans, and (iv) other loans; a higher HHI value indicates higher loan portfolio concentration. 15 Seller’s interest in home equity line, credit card, commercial and industrial loan securitisations.

13
First, looking at the statistics on the number of banks across the securitised asset classes in Table 2, one can see that most of the sample banks conduct mortgage securitisations, followed by securitisations of other loans and leases; while the lowest number of banks is engaged in other consumer loan securitisation.16 Looking further at the securitisation statistics, we find that the mean of outstanding securitisation constitutes is around 9% of banks’ total assets. Considering the structure of securitisations, retained interests constitute, on average, 8% of securitised assets outstanding with the highest value of 17% in credit card securitisations. Of those 8% of retained interests, (i) credit enhancements constitute around 5% of securitised assets with 1% in the form of credit-enhancing interest-only strips, 2% in the form of subordinated securities, and around 1.5% in the form of standby letters of credit; (ii) liquidity provisions constitute around 0.5%, and (iii) the seller’s interest constitutes around 2% of securitised assets. Analysing the statistics by the type of assets securitised, we find that the highest level of credit enhancements (credit-enhancing interest-only strips) is provided in auto securitisations; the highest level of liquidity provisions is found in other consumer loan securitisations; while the highest seller’ interest is retained in credit card securitisations. Looking at the quality of assets, non-performing securitised loans constitute around 0.6% of securitised assets, which is nearly half the size of the on-balance sheet non-performing loan ratio (1%, reported in Table 1); however, the charge-offs on securitised loans of 0.4% are comparable to those of on the on-balance sheet loans (0.5%, reported in Table 1). Interestingly, other consumer securitisations show the highest non-performing loan ratio and the second highest charge-off ratio, exceeded only by charge-offs in credit card securitisations; while securitisations of all other loans and assets seem to have the highest credit quality of underlying assets in terms of non-performing loans and charge-offs.
5 EMPIRICAL SPECIFICATION
To address the research questions of this study, we estimate the relationship between banks’ securitisation activities and insolvency risk controlling for a number of risk-relevant bank characteristics.
5.1 Bank Risk
Our primary measure of bank insolvency risk is a z-score, denoted by Z. The z-score has become a popular measure of bank risk and has been widely used in the banking literature.17 Specifically, the z-score measures the distance from insolvency for a given bank combining bank profitability, capitalisation, and volatility of returns:
(1)
16 It is common for a bank to engage in several types of securitisation (e.g., most of the mortgage securitisers in the sample engage in securitisations of other asset classes). 17 See Hesse and Čihák, 2007; Laeven and Levine, 2009; Mercieca, Schaeck, and Wolfe, 2007; Stiroh and Rumble, 2006.

14
where is the average return on assets, is the average equity capital ratio, and is the standard deviation of return on assets.18
In other words, the z-score is an indicator of a bank’s probability of insolvency in the sense that it estimates the number of standard deviations that the bank’s profits have to fall below its expected value before its equity becomes negative. A higher z-score indicates that a bank is more stable, where the value of the z-score depends positively on the bank’s profitability and capital ratio and negatively on the variability of the bank’s profits.
There are different approaches to the construction of the z-score in terms of the standard deviation of return on assets used that have been applied in the literature. Some studies use the standard deviation of returns over the lifetime of a bank in the sample (Laeven and Levine, 2009), while others use a rolling time window (Čihák, Maechler, Schaeck, and Stolz, 2012). As we have quarterly data, we follow Stiroh and Rumble (2006) and use the standard deviation of return on assets over four quarters in a year. This approach avoids that the z-score is exclusively driven by the variation in the levels of capital and profitability.
5.2 Securitisation
We consider securitisation activities of a bank as: (i) total outstanding securitised assets (Sec); (ii) contractual interests retained in connection to securitised assets (RetInt) including credit enhancements (CredEnh), liquidity provisions (LiqProv), and seller’s interest (SellerInterest); (iii) credit enhancements (OthersCredEnh) and (iv) liquidity support (OthersLiqProv) provided by the bank to other institutions’ securitisations. We also decompose the aggregate credit enhancements provided by a bank to its own securitisations, CredEnh, by the form of underlying facility into: (i) credit-enhancing interest-only strips (CEIOS); (ii) retained subordinated securities (SubSec); and (iii) standby letters of credit (SLC). All the securitisation variables are scaled by total assets.
5.3 Control Variables
We control for a number of additional bank balance sheet and income statement characteristics potentially affecting insolvency risk. We include bank liquidity in the form of cash and securities (Liq) and anticipate higher liquidity buffers to be associated with lower insolvency risk (Laeven and Levine, 2009). Trading assets (Trading) are included to control for their potential risk-increasing effect due to their highly volatile nature. Both liquidity and trading assets are scaled by total assets.
To control for possible differences in riskiness of banks with different loan portfolio concentration, we introduce a four-loan Herfindahl-Hirschman Index (HHILoan); we expect loan portfolio concentration to be positively associated with risk (Hirtle and Stiroh, 2007; Mercieca, Schaeck and Wolfe, 2007). We also control for bank’s capitalisation introducing an equity capital ratio (Capital) as lower capital has been shown to be associated with higher risk (Hirtle and Stiroh, 2007; Mercieca, Schaeck and Wolfe, 2007; Stiroh and Rumble, 2006).
18 See Appendix C for the exposition of the z-score.

15
Further, we control for potential revenue diversification effect on bank risk using a two-part revenue Herfindahl-Hirschman Index (HHIRev); diversification in revenue sources has been shown to be negatively associated with return volatility and insolvency risk (Hirtle and Stiroh, 2007; Stiroh and Rumble, 2006). Following Stiroh and Rumble (2006), we include bank’s asset growth (AssetGrowth).19 Finally, to control for any systematic differences across banks of different size, we create indicators based on total assets. Following Cebenoyan and Strahan (2004) and Demsetz (2000), to avoid imposing a linear (or log-linear) relationship between size and the dependent variable, we include dummy indicators for eight asset classes (AssetLev), with the lowest size group acting as the omitted category.
5.4 Model Specification
We use panel regressions to estimate the relationship between banks’ securitisation activities and insolvency risk. Our baseline specification is:
, , , , , , ,
, , , , ,
(2)
where , , and are coefficient estimates, and , is the error term for bank i in period t. The
dependent variable, , , is insolvency risk of bank i in period t; , is total outstanding
securitisation in period t-1; , is contractual interests retained in the bank’s own securitisations;
, is liquidity; , is loan portfolio concentration; ,
is trading assets; , is equity capital;
, is revenue diversification;
, is asset growth; , is asset level; and is year dummies capturing time effects.
Our most expanded model is:
, , , , , ,
, , ,
, , , , ,
, , , ,
(3)
where , is credit enhancements provisions provided to the bank’s own securitisations; , is liquidity provisions provided to the bank’s own securitisations;
, is seller’s interest in the bank’s own securitisations; , is bank’s credit enhancements provided to other institutions’ securitisations; and
, is bank’s liquidity provisions to other institutions’ securitisations;
, is an interaction term between credit enhancements and a high liquidity provisions dummy; , is an interaction term between liquidity provisions and a high credit enhancements dummy.
19 See Appendix A for detailed construction of the variables.

16
In testing H1, we expect the coefficient on retained interests in equation (2) to be negative (positive association with insolvency risk). In testing H2, we expect the coefficients on internal credit enhancements and liquidity provisions in equation (3) to be higher than those on credit and liquidity support provided to third-party structures. Finally, to test H3, we slightly modify equation (3) and substitute , with its component parts (where
, is credit enhancing interest-only strips; , is subordinated securities; and
, is standby letters of credit. We expect the relationships between the different types of contractual retained interests and bank insolvency risk to be driven by the level of subordination. In addition, we expect the interactions terms to have an impact on the relationships between credit and liquidity support and bank insolvency risk.
5.5 Regression Data Set
For the regression analysis, we build a data set from annual bank observations. In particular, for each bank-year we: (i) calculate averages and standard deviations of variables over the four quarterly observations; (ii) calculate yearly z-score, risk-adjusted return on assets and equity based on the yearly averages and standard deviations; and (iii) construct a panel of BHC/year observations. As previously mentioned, we keep banks with at least 2 full years of data.
As shown in Figure 2, the yearly z-score obtained for the sample is highly skewed; therefore, we use a natural logarithm of the z-score, which is normally distributed. Further, the examination of the relationship between the yearly z-score and securitisation variables suggests non-linear association. Therefore, in the regression analysis we use a logarithmic form for all the securitisation variables.20
<Insert Figure 2 about here>
6 RESULTS
6.1 Primary Regression Analysis
We now turn to the primary regression analysis testing our three hypotheses on the relationship between banks’ engagement in securitisation activities and insolvency risk. We use a random effects regression model21 on a sample of 900 bank-years for 197 BHCs from 2002 to 2007.22 The results of the estimations are presented in Table 3.23
<Insert Table 3 about here>
We test H1 using the model reported in the first column of Table 3, where we estimate the baseline equation (2) and regress the z-score on contractual retained interests, controlling
20 As there are zero securitisation observations in the data set, we use a natural logarithm of a unit plus the according securitisation measure. 21 Appendix D reports the results of the Hausman specification test. 22 As the empirical specification requires lagging the explanatory variables, the 2001 observations have to be dropped from the estimations. 23 Appendix B reports the correlation coefficients for the explanatory variables.

17
for total outstanding securitisation and bank-specific characteristics. In line with our expectations, the coefficient on contractual retained interests is negative and statistically significant at the 1% level. In other words, the interests retained by originating banks in their securitisations and constituting, on average, only 0.6% of the banks’ total assets have a significant risk-increasing effect. The data, however, show no significant relationship between outstanding securitisation and bank risk.
We next test H3 using the models reported in columns 2-4 of Table 3. Specifically, in column 2, we break down the contractual retained interests by the form of underlying facility into credit enhancements, liquidity provisions, and seller’s interest (equation 3). We find that credit enhancements and seller’s interest have a risk-increasing effect, in both cases the coefficients are statistically significant at the 5% level; the effect of liquidity provisions, in contrast, is positive, although not statistically significant. This evidence indicates that credit enhancements have the strongest risk-increasing effect, consistent with the subordination to other forms of retained interests.
As credit enhancements seem to drive the negative impact of contractual retained interests on bank risk, we analyse this relationship in more detail and expand the model by the type of underlying credit-enhancing facility. Specifically, in column 3 of Table 3, we decompose credit enhancements into credit-enhancing interest-only strips, subordinated securities, and standby letters of credit. This model specification requires a caveat. Credit-enhancing interest-only strips are reported by banks starting from the second quarter of 2001, while the starting reporting date for subordinated securities and standby letters of credit is the first quarter of 2003. As this model specification is crucial in terms of this study, we drop the 2002 and 2003 observations (the latter is dropped due to lagging the explanatory variables) and estimate the model for the 2004-2007 period.24 The results show that among the three forms of credit enhancements, credit-enhancing interest-only strips have the strongest and statistically significant risk-increasing effect, consistent with their subordinated (first loss) position. Standby letters of credit also have a risk-increasing effect, while the coefficient on subordinated securities emerges positive albeit not statistically significant. This results are consistent with the subordinated structure of securitisation transactions and indicate that further efforts should be made to understand the subordination mechanisms clearly. While it might be desirable to keep retention mechanisms flexible, our results support the idea of increased disclosure of the retained interests and the capital structure of the resulting charges.
As suggested by H3, the interaction between forms of support may add complexity to the relationship between retained interests and insolvency risk. We therefore test the effect of credit enhancements for a given level of liquidity provisions, and vice versa, by introducing in the model (column 4 of Table 3) interaction terms between credit enhancements and a high liquidity provision dummy (the latter is equal to one for observations with liquidity provision above the mean value) and between liquidity provision and a high credit enhancements dummy (the latter is equal to one for observations with credit enhancements above the mean
24 In the following specifications (columns 4-6 of Table 3) we control for credit enhancements in the aggregated form to avoid losing the data for year 2002.

18
value). Interestingly, the evidence suggests that the effect of credit enhancements is reversed to risk-decreasing in securitisations with high liquidity provisions; while the level of credit enhancements is found to have no significant impact of the risk effect of liquidity provisions. We tentatively explain this result by the intrinsic nature of liquidity provisions; for example, if liquidity is offered to the SVP in the form of a cash account, the latter is junior to the claims of subordinated securities.
Finally, we test the risk effects of banks’ engagement in third-party securitisations through the provision of credit and liquidity support. We find that engagement in third-party securitisations in either form does not have significant effect on risk of the banks; in general, this evidence is consistent with our hypothesis that internal credit enhancements and liquidity support have a greater positive association with bank insolvency than those provided to third-party securitisations.
Examining the control variables, we find, as expected, a negative and statistically significant effect of liquidity on bank insolvency risk (a positive effect on the z-score) suggesting that higher levels of liquid assets reduce bank risk. In contrast, the effect of trading assets on risk is found to be positive and statistically significant at 1% level. Further, the estimates for capital, asset growth, loan and revenue diversification emerge statistically insignificant. These results remain consistent in all the specifications.
Summarising the main results, we find evidence to support all our three hypotheses on the effects that different forms of banks’ engagement in securitisation activities have on bank insolvency risk. In our test of H1, we find that contractually retained interests significantly increase bank insolvency risk. Specifically, we find that credit enhancements and seller’s interest have a positive and statistically significant association with bank insolvency risk, while this is not the case for liquidity provisions. In our test of H3, we find evidence to suggest that the risk-increasing effect of credit enhancements is mainly driven by credit-enhancing interest-only strips and standby letters of credit, consistently with the claims subordination structure. In addition, we find that the interaction between credit and liquidity support has a reversing effect on the relationship between credit enhancements and bank insolvency risk. Finally, in our test H2, we find that banks’ engagement in securitisations of other institutions has no significant effect on the risk of the banks.
6.2 Components of Z-Score
The use of the z-score as a measure of risk entails the possibility of the results being driven by one of the components constituting the measure. To analyse the negative effect of contractual retained interests on the z-score in more detail and to identify the drivers of the relationship between the two, we decompose the z-score into its individual components: capital ratio, return on assets, and standard deviation of return on assets. We then re-estimate equation (3) with each of the components as the dependent variable. However, when regressing the capital ratio, we have to omit the capital ratio from the control variables to avoid biased estimates. The results of the three estimations are presented in Table 4.
<Insert Table 4 about here>

19
Interestingly, the coefficients on both credit enhancements and seller’s interest are positive and statistically significant in the regression of the standard deviation of return on assets; while they are not statistically significant in the regressions of capital and return on assets. This suggests that the estimated negative relationship between the z-score and retained interests is mainly driven by the increasing effect of the retained interests on the volatility of returns.
7 ROBUSTNESS TESTS
We conduct a number of additional tests to verify the robustness of our basic results to outliers, alternative risk measures, sub-periods, and level of securitisation. The tests are discussed below in more detail with the results presented in Table 5.
<Insert Table 5 about here>
7.1 Winsorisation Level
Our first concern is the possibility that outliers in terms of risk, that is banks close to insolvency, drive our results. We address this concern by winsorising our risk measure, the z-score, at higher 2.5% and 5% levels. We then re-estimate equation (3) for each of the winsorisation levels. The results of the regressions are reported in columns 1-2 of Table 5. The data show that all the coefficients remain qualitatively unchanged confirming our basic results.
7.2 Alternative Measures of Risk
The second concern is the robustness of our results to alternative measures of risk. To address this, we use different measures for the dependent variable. Following Stiroh and Rumble (2006), we use banks’ risk-adjusted return on assets and equity. We re-estimate equation (3), consistently winsorising the measures at 1% level. The results of the regressions are reported in columns 3-4 of Table 5. The evidence from both estimations confirms our baseline result of a significant risk-increasing effect of credit enhancements and seller’ interest.
7.3 Sub-Periods
As our sample covers 2001-2007 period, there is a concern that the results might be affected by the outset of the financial crisis. To test the robustness of the results to alternative time periods, we split the sample period into 2002-2005 (which can be considered a more "stable" period) and 2006-2007 (when the first signs of the crisis could be reflected in the amount and risk effect of contractual retained interests). We re-estimate equation (3) for each of the sub-periods and report the results in column 5 of Table 5.
We find that the effect of credit enhancements remains risk-increasing and statistically significant for both periods; interestingly though, the magnitude of the effect nearly doubles in the 2006-2007 regression. The latter is consistent with the view that the risk effect of credit enhancements provided by banks in securitisations was magnified by the outset of the financial crisis of 2007-2009. This could be driven either by a deterioration in the quality of

20
the assets being securitised (as posited by recent literature, including Dell'Ariccia, Deniz, and Laeven, 2009; Mian and Sufi, 2009; Keys, Mukherjee, Seru, and Vig, 2010); or by an increase in the use of commitments and guarantees (Acharya, Schnabl, and Suarez, 2012), or possibly both.
7.4 Level of Securitisation
Finally, we test whether the effect of contractual retained interests varies with the level of securitisation. In our baseline regression, we control for the level of securitisation by means of introducing an outstanding securitisation variable in the model. The data show no significant effect of outstanding securitisation on the risk of the banks. However, the outstanding securitisation might have an impact on the risk effect of contractual retained interests. To test this, we split the sample banks into three sub-samples according their average level of securitisation across years. We create three quantile categories (low, medium, and high) for the total outstanding securitised assets variable (Sec) for the sample and then assign each bank to one of the three categories based on the bank’s time-series average securitisation. We then estimate the regression in equation (3) for each sub-sample; we use the same set of control variables, however, we have to omit the interaction terms and variables on banks’ engagement in other institutions’ securitisations as these are in most cases equal to zero in the sub-sample of banks with low level of securitisation outstanding. The results are reported in Table 6.
<Insert Table 6 about here>
The data suggest that the risk effect of contractual retained interests varies with the level of securitisation. Specifically, we find that the effect of retained interests gradually reverses from risk-reducing for banks with the low level of securitisation to risk-increasing for banks with the high level of securitisation. This evidence is particularly interesting and emphasises the importance of a bank’s level of securitisation activity for the risk implications of contractual retained interests.
Overall, we find that our baseline findings are consistent across several robustness tests and that the positive relationship between contractual retained interests and risk holds throughout the analysis.
8 CONCLUSIONS
Using US bank holding company data for the period from 2001 to 2007, this paper investigates the relationships between banks’ engagement in securitisations and insolvency risk. We focus on contractual credit enhancements and liquidity support provided by banks to their own and to third-party securitisations. Credit enhancements and liquidity support are contractual provisions in which banks retain or assume a securitisation exposure with the aim of reducing the credit risk borne by investors. There are various motivations put forward by the theoretical literature for the provision of contractual credit and liquidity support (mitigation of information asymmetries, regulatory arbitrage, liquidity creation). As the 2007-2009 financial crisis has shown, the practice of retaining contractual interests in their own securitisation structures resulted in banks retaining on their balance sheet the risk of their
21
securitised assets. This had important consequences for the banking sector and contributed to the collapse of the securitisation market. Given the current regulatory efforts to revive the market and the importance attached to risk retention mechanisms in terms of their role in potentially aligning the incentives of banks and investors in the securitisation process (the so-called "skin in the game"), a better understanding of these issues is crucial. However, regulators have focussed mainly on tranching and the retention of the equity tranche and have largely ignored other commitment mechanisms as well as their interactions.
To contribute to the current debate, we develop and test three hypotheses. First, we hypothesise that, if the level of contractual retained interests is designed to reflect the risk of the underlying assets, there should be a positive association between the overall level of retained interests and bank insolvency risk. Second, we hypothesise that internal credit enhancements have a greater positive association with bank insolvency risk than support offered to third-party structures. Finally, we hypothesise a stronger impact on bank overall risk of credit enhancements with a subordinated/first loss position.
Overall, we find that it is not the level of securitisation outstanding that affects bank insolvency risk but the level of contractual retained interests and guarantees offered to the securitisation structures. Examining retained interests by the form of the underlying facility, we find that credit enhancements and seller’s interest have a risk-increasing effect, while the provision of liquidity support appears to lessen risk. We explain this result by the intrinsic nature of liquidity support. Liquidity can be provided to the SPV under different arrangements; if it is provided as a separate reserve fund then it is commonly used to cover shortfalls and it is junior to all other claims. This entails that the losses that can be covered by the provision are borne by the SPV and do not affect the originating bank's overall risk. Analysing credit enhancements in more detail, we find that credit-enhancing interest-only strips have the strongest risk-increasing effect, consistently with their subordinated (first loss) position. Standby letters of credit also have a risk increasing effect, while the empirical results show no evidence of a significant risk effect of subordinated securities. This is a particularly interesting result as it supports (weakly) the theoretical literature on the mitigating effect on bank risk taking of holding a subordinated/equity tranche. Finally, we find that engagement in third-party securitisations through providing credit and/or liquidity support does not have significant effect on the risk of the banks.
Our results highlight that the relationship between contractual retained interests and bank insolvency risk varies according to the type of provision offered, the subordination structure, and it is altered by interactions among provisions. While it might be desirable not to become prescriptive in the choice of retention mechanisms available to originating banks, we support the idea of increased transparency and mandatory disclosure of the retained interests with a clear indication of the subordination mechanisms.
Our results also indicate that the risk effect of credit enhancements increased at the onset of the crisis. This could be explained either by a deterioration of the quality of assets being securitised at the time (hence requiring higher credit and liquidity support to achieve a high enough debt rating to be marketable) or by an increased use of commitments and guarantees on behalf of banks for other purposes (for example, regulatory capital arbitrage

22
and liquidity creation). Finally, our results show that for high levels of securitisation, the risk increasing effect of contractual retained interests becomes stronger. This seems to indicate that the credit risk transfer mechanism of securitisation lessens when the amount of asset securitised increases.
Overall, our results contribute to a deeper understanding of the risks arising from banks’ securitisation activities, and have direct implications for the ongoing discussions on how to redesign the securitisation model and restart this important market. Indeed, policy-makers acknowledge the potential benefits of securitisation in credit risk transfer and diversification and aim at reviving the securitisation market by introducing more standardised and simple securitisation structures reducing the dependence and involvement of the originator in the transactions.

23
Figure 1 Contractual Retained Interests
Source: Asset Securitization: The Comptroller's Handbook (OCC, 1997), adapted and updated.
“AAA” tranche
“AA” tranche
“BBB” tranche
Equity tranche
Collateral cash account (CCA)
Spread account (excess spread)
LOS
S P
OS
ITIO
N
First loss
Last lossAdditional contractual
retained
interests
Liquidity
provisions
Seller’s interest
(over-collateralisation)
Stand-by letter of credit (LOC)
Cash
Receivables
Third party guarantees
Third party LOC
Surety Bonds
Cash Collateral Account

24
Figure 2 Distribution of Z-Score and Ln(Z-Score)
Note: The graphs plot the distribution of Z-Score and ln(Z-Score) derived from the regression data set for the 2002-2007 period, where the z-score of a bank is calculated yearly using the averages and standard deviations across four quarters of a year and winsorised at 1% level.
05
.0e
-04
.001
.001
5.0
02.0
025
Den
sity
0 500 1000 1500 2000 2500
Z-Score
0.1
.2.3
.4.5
Den
sity
2 4 6 8
ln(Z-Score)

25
Table 1 Sample Descriptive Statistics
Full Sample Variable Mean StdDev Min Max
Balance Sheet Structure Total Assets ($ billions) 46.0724 150.8538 0.1692 1150.00 Liquidity Ratio 0.2502 0.1147 0.0360 0.6048 Loan Ratio 0.6408 0.1420 0.0762 0.8863 Trading Assets/Assets Ratio 0.0130 0.0391 0.0000 0.2294 Deposits/Assets Ratio 0.5976 0.1485 0.0457 0.8350 Equity/Assets Ratio 0.0954 0.0458 0.0477 0.4640
Loan Portfolio Real Estate Loan Ratio 0.6566 0.1925 0.0296 0.9732 C&I Loan Ratio 0.1609 0.0854 0.0003 0.4156 Consumer Loan Ratio 0.1008 0.1169 0.0004 0.7206 Other Loan Ratio 0.0779 0.1163 0.0000 0.6635 Loan HHI 0.5551 0.1636 0.2820 0.9530
Regulatory Capital Tier I Leverage Ratio 9.0867 4.5593 3.2075 46.1747 Tier I Risk-Based Capital Ratio 12.4529 6.5569 4.5300 65.7928 Total Risk-Based Capital Ratio 14.3632 6.3301 5.8450 67.1647
Performance Interest Income/NOR 0.6920 0.1751 0.1154 0.9435 Revenue HHI 0.6431 0.0978 0.5007 0.9377 Interest Margin 0.0218 0.0053 0.0056 0.0426 ROA 0.0129 0.0097 -0.0041 0.0928 ROE 0.1366 0.0604 -0.0696 0.4429
Risk Characteristics RWATA Ratio 0.7245 0.1248 0.3724 1.0204 NPL/Loans Ratio 0.0101 0.0074 0.0002 0.0404 Charge-Off Ratio 0.0047 0.0066 0.0000 0.0427 Loan Loss Provision Ratio 0.0057 0.0073 -0.0005 0.0515 Loan Loss Allowance Ratio 0.0143 0.0059 0.0023 0.0415 Z-Score 95.1717 69.5363 7.2231 327.8096 RAROA 11.3932 9.3022 -0.4005 43.4955 StdDevROA 0.0037 0.0037 0.0007 0.0331 RAROE 10.7410 8.7599 -0.3514 53.4815 StdDevROE 0.0717 0.0737 0.0133 0.4144
Securitisation Activity Sec Ratio 0.0755 0.2048 0.0000 1.5390 RetInt Ratio 0.0052 0.0159 0.0000 0.1032 CredEnh Ratio 0.0021 0.0062 0.0000 0.0416
CEIOS Ratio 0.0007 0.0025 0.0000 0.0206 SubSec Ratio 0.0011 0.0040 0.0000 0.0272 SLC Ratio 0.0006 0.0036 0.0000 0.0353
LiqProv Ratio 0.0002 0.0010 0.0000 0.0100 SellerInterest Ratio 0.0028 0.0121 0.0000 0.0817 SecNPL/Sec Ratio 0.0044 0.0082 0.0000 0.0466 SecChargeOff/Sec Ratio 0.0034 0.0086 0.0000 0.0416 OthersCredEnh Ratio 0.00003 0.0001 0.0000 0.0012 OthersLiqProv Ratio 0.00004 0.0003 0.0000 0.0033
Note: The table presents general descriptive statistics for the full sample of 197 banks covering the period from 2001 to 2007. Mean, Std Dev, Min, and Max stand for the cross-sectional mean, standard deviation, minimum and maximum values of the individual bank time-series averages, accordingly. All variables are winsorised at 1% level. For the definition and construction of the variables see Appendix A.

26
Table 2 Statistics on Securitisation Activity by Asset Type
Total Securitisation Mortgage HEL Credit Card Auto Other Consumer C&I All Other
Variable Mean StdDev Mean StdDev Mean StdDev Mean StdDev Mean StdDev Mean StdDev Mean StdDev Mean StdDev
Outstanding Securitisation Sec Ratio 8.98 22.43 7.70 18.83 0.90 0.95 4.44 6.90 1.37 2.15 1.36 1.90 0.95 0.87 1.60 2.16
Retained Interests RetInt Ratio 0.60 1.73 0.16 0.61 0.12 0.20 1.78 2.83 0.08 0.11 0.08 0.10 0.08 0.15 0.11 0.22 RetInt/Sec Ratio 7.85 18.21 5.03 17.18 14.03 14.54 17.29 22.66 7.89 6.17 10.77 8.90 10.37 14.54 6.94 10.33 Credit Enhancements CredEnh Ratio 0.26 0.78 0.16 0.61 0.06 0.07 0.20 0.39 0.07 0.10 0.06 0.07 0.01 0.02 0.04 0.08 CredEnh/Sec Ratio 4.89 14.61 4.38 15.05 5.47 4.76 2.26 2.83 7.25 5.75 6.11 4.49 1.69 2.39 4.79 7.42
CEIOS Ratio 8.00 0.32 0.06 0.30 0.02 0.02 0.06 0.11 0.04 0.06 0.04 0.06 0.00 0.01 0.01 0.02 CEIOS/Sec Ratio 0.99 2.65 0.64 2.51 1.65 1.66 0.53 0.65 4.14 3.81 2.75 2.42 0.61 1.33 0.59 1.35
SubSec Ratio 0.16 0.49 0.04 0.12 0.05 0.10 0.21 0.34 0.02 0.03 0.03 0.06 0.01 0.02 0.03 0.08 SubSec/Sec Ratio 2.28 6.71 2.43 9.04 3.06 3.30 2.48 2.49 2.93 3.81 3.20 4.83 1.58 2.01 3.15 5.07
SLC Ratio 0.08 0.40 0.08 0.45 0.00 0.01 0.00 0.01 0.02 0.04 0.00 0.00 0.00 0.00 0.01 0.02 SLC/Sec Ratio 1.39 6.19 1.26 5.42 0.20 0.36 0.16 0.43 0.68 1.26 0.46 0.89 0.29 0.68 2.06 6.41
Liquidity Provisions LiqProv Ratio 0.02 0.12 0.00 0.00 0.00 0.00 0.00 0.00 0.00 0.00 0.01 0.03 0.00 0.00 0.01 0.04 LiqProv/Sec Ratio 0.39 2.20 0.07 0.52 0.08 0.19 0.00 0.00 0.00 0.00 2.63 4.64 0.00 0.00 0.35 1.15
Seller's Interest SellerInterest Ratio 0.30 1.26 0.02 0.03 1.58 2.60 0.02 0.04 SellerInterest/Sec Ratio 1.72 5.68 4.87 5.97 15.65 21.54 6.23 12.18
Non-Performing Assets and Charge-Offs SecNPL/Sec Ratio 0.55 0.96 0.70 1.51 1.26 1.44 0.97 0.88 0.36 0.41 2.64 2.20 0.26 0.39 0.14 0.26 SecChargeOff/Sec Ratio 0.42 0.99 0.14 0.56 0.39 0.43 1.98 1.78 1.39 1.91 1.44 1.75 0.14 0.25 0.01 0.03
No. of BHCs 197 147 27 36 34 22 26 44
Note: The table presents descriptive statistics on securitisation activities for observations with: (i) non-zero total outstanding securitisation; (ii) non-zero mortgage securitisation; (iii) non-zero home equity line securitisation; (iv) non-zero credit card securitisation; (v) non-zero auto securitisation; (vi) non-zero other consumer loan securitisation; (vii) non-zero commercial and industrial securitisation; and (viii) non-zero all other loan, lease and asset securitisation. Mean and Std Dev stand for the cross-sectional mean and standard deviation values (in %) of the individual bank time-series averages, accordingly. All variables are winsorised at 1% level. N reports the number of observations in the according sub-sample. For the definition and construction of the variables see Appendix A.

27
Table 3 Securitisation and Bank Insolvency Risk
(1) (2) (3) (4) (5) (6)
Seci,t-1 0.29 0.34 -0.02 0.37 0.38 0.39
(0.659) (0.763) (-0.040) (0.839) (0.866) (0.867) RetInti,t-1 -12.67***
(-3.109) CredEnhi,t-1 -18.55** -21.06** -20.94** -20.93**
(-2.124) (-2.425) (-2.405) (-2.400) CEIOSi,t-1 -48.75**
(-2.555) SubSeci,t-1 16.99
(0.815) SLCi,t-1 -25.56***
(-2.689) LiqProvi,t-1 12.00 -21.67 -6.98 -6.55 -7.28
(0.240) (-0.330) (-0.161) (-0.151) (-0.153) SellerInteresti,t-1 -8.82** -15.64** -8.04* -8.23** -8.27**
(-2.249) (-2.042) (-1.957) (-2.044) (-1.987) CredEnhHighLiqProvDi,t-1 89.40*** 89.68*** 89.61***
(3.308) (3.348) (3.341) LiqProvHighCredEnhDi,t-1 -41.12 -40.93 -40.54
(-0.580) (-0.579) (-0.559) OthersCredEnhi,t-1 191.47 187.06
(1.130) (1.095) OthersLiqProvi,t-1 7.73
(0.094) Liqi,t-1 0.87* 0.89* 0.59 0.91* 0.90* 0.90*
(1.847) (1.870) (1.225) (1.928) (1.918) (1.907) HHILoani,t-1 -0.45 -0.48 -0.30 -0.45 -0.44 -0.44
(-1.167) (-1.239) (-0.686) (-1.170) (-1.145) (-1.133) Tradingi,t-1 -5.95*** -5.94*** -5.22** -6.18*** -6.26*** -6.26***
(-2.940) (-2.855) (-2.439) (-2.942) (-3.020) (-3.010) Capitali,t-1 -0.41 -0.31 -1.33 -0.29 -0.28 -0.27
(-0.373) (-0.285) (-1.096) (-0.266) (-0.263) (-0.252) HHIRevi,t-1 -0.13 -0.08 0.19 -0.07 -0.07 -0.07
(-0.243) (-0.157) (0.322) (-0.131) (-0.126) (-0.132) AssetGrowthi,t-1 0.88 0.80 0.16 0.75 0.79 0.80
(0.981) (0.910) (0.144) (0.857) (0.896) (0.900) AssetLev2i,t-1 0.21 0.22 0.28 0.22 0.22 0.22
(1.321) (1.331) (1.510) (1.330) (1.353) (1.348) AssetLev3i,t-1 0.36** 0.36** 0.36** 0.35** 0.36** 0.36**
(2.250) (2.262) (1.968) (2.244) (2.267) (2.261) AssetLev4i,t-1 0.29* 0.30* 0.40** 0.30* 0.31* 0.31*
(1.872) (1.879) (2.236) (1.909) (1.940) (1.935) AssetLev5i,t-1 0.52*** 0.53*** 0.39* 0.54*** 0.54*** 0.54***
(2.959) (3.006) (1.715) (3.014) (3.042) (3.034) AssetLev6i,t-1 0.39** 0.39** 0.31* 0.40** 0.40*** 0.40**
(2.498) (2.509) (1.753) (2.555) (2.595) (2.563) AssetLev7i,t-1 0.63*** 0.60*** 0.54** 0.60*** 0.60*** 0.60***
(3.055) (2.880) (2.347) (2.882) (2.892) (2.884) AssetLev8i,t-1 0.55** 0.53** 0.51* 0.50* 0.49* 0.49*
(2.290) (2.081) (1.696) (1.942) (1.886) (1.876) Yeart Yes Yes Yes Yes Yes Yes Constant 4.09*** 4.05*** 3.92*** 4.02*** 4.01*** 4.01***
(10.297) (9.923) (8.998) (9.933) (9.937) (9.928)
No. of Observations 900 900 573 900 900 900 No. of BHCs 197 197 181 197 197 197 R-Squared 0.137 0.140 0.169 0.150 0.150 0.150
Note: The table presents the results of random effects regressions of bank insolvency risk on securitisation variables. The dependent variable is a z-score (Z) calculated yearly as the bank's yearly average return on assets plus yearly average capital to assets ratio divided by the standard deviation of return on assets over the four quarters of the year. We use a natural logarithm of the z-score, winsorised at 1% level. The independent variables are computed as averages for each BHC over four quarters in a given year. We use natural logarithms for securitisation variables, which include: (i) outstanding securitisation (Sec); (ii) retained interests in connection to securitised assets (RetInt); (iii) credit enhancements (CredEnh); (iv) credit-enhancing interest-only strips (CEIOS); (v) subordinated securities (SubSec); (vi) standby letters of credit (SLC); (vii) liquidity provisions (LiqProv); (viii) sellers' interest (SellerInterest); (ix) interaction terms between credit enhancements and a high liquidity provisions dummy (CredEnhHighLiqProvD) and between liquidity provisions and a high credit enhancements dummy (LiqProvHighCredEnhD); (x) credit enhancements to other institutions' securitisations (OthersCredEnh); (xi) liquidity provisions to other institutions' securitisations (OthersLiqProv). The control variables include: (i) liquidity ratio (Liq); (ii) loan concentration (HHILoan); (iii) trading assets ratio (Trading); (iv) capital ratio (Capital); (v) revenue concentration (HHIRev); (vi) asset growth (Growth); and (vii) asset size indicators (AssetLev*) (see Appendix A for the definition and construction of the variables). All independent variables winsorised at 1% level and lagged one period. Regressions are run for the full sample of BHCs covering the period from 2002 to 2007 with exemption of column 3 where the regression is run for 2004-2007. Year dummies are incorporated in all regressions. Robust standard errors reported in parentheses are corrected for clustering at the BHC-level. *, **,*** indicate significance at 10%, 5%, and 1% levels, respectively.

28
Table 4 Z-Score Components and Securitisation
EA ROA sdROA
Seci,t-1 0.03** 0.01** -0.00 (2.156) (2.386) (-0.691)
CredEnhi,t-1 0.09 -0.06 0.06** (0.337) (-1.131) (2.384)
LiqProvi,t-1 -0.19 0.14 0.04 (-0.438) (0.857) (0.352)
SellerInteresti,t-1 -0.73 0.14** 0.07* (-1.318) (2.163) (1.805)
CredEnhHighLiqProvDi,t-1 -0.55 0.12 -0.23** (-1.590) (1.233) (-2.367)
LiqProvHighCredEnhDi,t-1 -0.14 0.06 0.20 (-0.319) (0.294) (0.975)
OthersCredEnhi,t-1 4.34 1.07 -0.32 (1.430) (1.022) (-0.346)
OthersLiqProvi,t-1 1.62 -0.98 -0.14 (0.571) (-0.907) (-0.196)
Liqi,t-1 0.04 0.00 -0.00* (1.610) (0.124) (-1.807)
HHILoani,t-1 -0.02 -0.00 0.00 (-1.185) (-0.228) (0.577)
Tradingi,t-1 0.04 -0.01 0.02* (0.404) (-0.194) (1.891)
Capitali,t-1 0.08* 0.04*** (1.688) (3.759)
HHIRevi,t-1 -0.01 0.00 -0.00 (-0.244) (0.143) (-0.215)
AssetGrowthi,t-1 -0.05 -0.01 -0.01** (-0.839) (-0.863) (-2.328)
AssetLev2i,t-1 -0.00 0.00 -0.00 (-0.358) (0.613) (-0.304)
AssetLev3i,t-1 -0.00 0.00 -0.00 (-0.679) (0.991) (-0.438)
AssetLev4i,t-1 -0.00 0.00 -0.00 (-0.477) (0.974) (-0.099)
AssetLev5i,t-1 -0.01* 0.00* -0.00 (-1.850) (1.893) (-0.226)
AssetLev6i,t-1 -0.01 0.00* -0.00 (-0.812) (1.799) (-0.575)
AssetLev7i,t-1 -0.01 0.00 -0.00 (-0.882) (0.755) (-0.860)
AssetLev8i,t-1 -0.01 0.00 -0.00 (-0.825) (0.250) (-0.907)
Yeart Yes Yes Yes Constant 0.10*** 0.00 0.00
(5.948) (0.460) (0.022) No. of Observations 900 900 900 No. of BHCs 197 197 197 R-Squared 0.00132 0.536 0.389
Note: The table presents the results of regressions of z-score components. EA is capital ratio; ROA is return on assets; sdROA is standard deviation of return on assets (all winsorised at 1%). The dependent variables in all the regressions are computed on a yearly basis using averages and standard deviations for each BHC over four quarters in a given year. The independent variables are averages of four quarterly observations in a year for each BHC. We use natural logarithms for securitisation variables, which include: (i) outstanding securitisation (Sec); (ii) credit enhancements (CredEnh); (iii) liquidity provisions (LiqProv); (iv) sellers' interest (SellerInterest); (v) interaction terms between credit enhancements and a high liquidity provisions dummy (CredEnhHighLiqProvD) and between liquidity provisions and a high credit enhancements dummy (LiqProvHighCredEnhD); (vi) credit enhancements to other institutions' securitisations (OthersCredEnh); (vii) liquidity provisions to other institutions' securitisations (OthersLiqProv). The control variables include: (i) liquidity ratio (Liq); (ii) loan concentration (HHILoan); (iii) trading assets ratio (Trading); (iv) capital ratio (Capital); (v) revenue concentration (HHIRev); (vi) asset growth (Growth); and (vii) asset size indicators (AssetLev*) (see Appendix A for the definition and construction of the variables). All independent variables are winsorised at 1% level and lagged one period. Random effects regressions are run for the full sample of BHCs covering the period from 2002 to 2007. Year dummies are incorporated in all regressions. Robust standard errors reported in parentheses are corrected for clustering at the BHC-level. *, **,*** indicate significance at 10%, 5%, and 1% levels, respectively.

29
Table 5 Robustness Tests for Securitisation and Bank Insolvency Risk
(1) (2) (3) (4) (5)
Z-Score(2.5) Z-Score(5) RAROA RAROE 2002-2005 2006-2007
Seci,t-1 0.35 0.35 4.72 9.00* 0.24 -0.17 (0.822) (0.886) (0.742) (1.816) (0.504) (-0.154)
CredEnhi,t-1 -19.82** -18.78** -222.68** -168.42*** -18.95** -38.61*** (-2.441) (-2.459) (-2.002) (-2.881) (-2.077) (-5.129)
LiqProvi,t-1 -4.40 0.05 -804.94 -472.19 -14.52 -0.63 (-0.093) (0.001) (-0.983) (-0.990) (-0.274) (-0.014)
SellerInteresti,t-1 -7.46* -7.02* -110.82*** -128.37*** -10.11** 13.71* (-1.942) (-1.923) (-2.809) (-3.143) (-1.989) (1.800)
CredEnhHighLiqProvDi,t-1 83.94*** 78.30*** 1,394.19*** -8.52 59.44* -299.24 (3.121) (2.925) (3.026) (-0.015) (1.721) (-0.916)
LiqProvHighCredEnhDi,t-1 -43.59 -47.10 1,094.47 1,633.84 -5.60 441.03 (-0.590) (-0.629) (1.099) (0.903) (-0.063) (1.478)
OthersCredEnhi,t-1 188.77 194.25 1,659.67 711.60 -22.22 244.42 (1.156) (1.235) (0.788) (0.435) (-0.144) (0.517)
OthersLiqProvi,t-1 6.01 2.47 327.22 -250.69 35.30 -295.44 (0.077) (0.033) (0.288) (-0.356) (0.434) (-1.396)
Liqi,t-1 0.85* 0.80* 6.57 0.26 0.88* 0.56 (1.859) (1.841) (1.112) (0.050) (1.698) (0.826)
HHILoani,t-1 -0.42 -0.40 -3.60 -3.40 -0.46 -0.25 (-1.110) (-1.089) (-0.835) (-0.915) (-1.113) (-0.400)
Tradingi,t-1 -5.75*** -5.34*** -73.86*** -65.62*** -7.66*** -5.05** (-2.966) (-2.957) (-3.589) (-3.100) (-3.603) (-1.991)
Capitali,t-1 -0.47 -0.64 -10.13 -7.59 -0.29 -0.80 (-0.446) (-0.631) (-1.192) (-0.908) (-0.280) (-0.417)
HHIRevi,t-1 -0.04 -0.05 -2.20 2.49 -0.02 0.05 (-0.074) (-0.100) (-0.370) (0.478) (-0.027) (0.052)
AssetGrowthi,t-1 0.63 0.51 13.40 0.70 0.57 -3.28 (0.736) (0.615) (1.057) (0.059) (0.558) (-1.596)
AssetLev2i,t-1 0.22 0.21 3.09* 2.50 0.23 -0.25 (1.349) (1.344) (1.879) (1.514) (1.633) (-0.577)
AssetLev3i,t-1 0.35** 0.34** 6.45*** 6.07*** 0.39** -0.31 (2.285) (2.264) (4.221) (4.465) (2.569) (-1.069)
AssetLev4i,t-1 0.30* 0.28* 6.51*** 5.77*** 0.19 -0.00 (1.908) (1.844) (4.695) (3.803) (1.067) (-0.008)
AssetLev5i,t-1 0.53*** 0.50*** 12.77*** 9.95*** 0.50** -0.54 (3.051) (2.965) (5.397) (5.129) (2.445) (-1.614)
AssetLev6i,t-1 0.39** 0.37** 9.18*** 8.84*** 0.53*** -0.46 (2.549) (2.518) (5.038) (5.232) (3.230) (-1.473)
AssetLev7i,t-1 0.59*** 0.56*** 14.98*** 13.93*** 0.83*** -0.39 (2.893) (2.895) (5.362) (5.205) (4.082) (-1.114)
AssetLev8i,t-1 0.46* 0.41* 13.74*** 13.07*** 0.86*** -0.53 (1.807) (1.690) (3.564) (3.824) (2.974) (-1.202)
Yeart Yes Yes Yes Yes Yes Yes Constant 4.02*** 4.06*** 9.91** 9.32** 3.97*** 4.16***
(10.284) (10.749) (2.244) (2.379) (9.003) (5.993) No. of Observations 900 900 900 900 663 237 No. of BHCs 197 197 197 197 191 126 R-Squared 0.146 0.144 0.163 0.154 0.143 0.236
Note: The table presents the results of robustness tests. Columns 1-4 use different dependent variables, where Z-Score(2.5) and Z-Score(5) are z-scores winsorised at 2.5% and 5%, respectively; RAROA and RAROE are risk-adjusted return on assets and equity, respectively (winsorised at 1% ). Column 5 uses a z-score winsorised at 1% as the dependent variable breaking the sample period into two sub-periods: 2002-2005 and 2006-2007. The dependent variables in all the regressions are computed on a yearly basis using averages and standard deviations for each BHC over four quarters in a given year. The independent variables are averages of four quarterly observations in a year for each BHC. We use natural logarithms for securitisation variables, which include: (i) outstanding securitisation (Sec); (ii) credit enhancements (CredEnh); (iii) liquidity provisions (LiqProv); (iv) sellers' interest (SellerInterest); (v) interaction terms between credit enhancements and a high liquidity provisions dummy (CredEnhHighLiqProvD) and between liquidity provisions and a high credit enhancements dummy (LiqProvHighCredEnhD); (vi) credit enhancements to other institutions' securitisations (OthersCredEnh); (vii) liquidity provisions to other institutions' securitisations (OthersLiqProv). The control variables include: (i) liquidity ratio (Liq); (ii) loan concentration (HHILoan); (iii) trading assets ratio (Trading); (iv) capital ratio (Capital); (v) revenue concentration (HHIRev); (vi) asset growth (Growth); and (vii) asset size indicators (AssetLev*) (see Appendix A for the definition and construction of the variables). All independent variables are winsorised at 1% level and lagged one period. Random effects regressions are run for the full sample of BHCs covering the period from 2002 to 2007 with exemption of column 5. Year dummies are incorporated in all regressions. Robust standard errors reported in parentheses are corrected for clustering at the BHC-level. *, **,*** indicate significance at 10%, 5%, and 1% levels, respectively.

30
Table 6 Securitisation and Bank Insolvency Risk by Level of Securitisation
(1) (2) (3)
Low Medium High
Seci,t-1 94.46*** 6.55** 0.25
(3.192) (2.542) (0.638) CredEnhi,t-1 615.07** 25.96*** -20.05**
(2.199) (3.887) (-2.319) LiqProvi,t-1 -4,375.65*** -15.77 49.75
(-3.480) (-0.377) (0.706) SellerInteresti,t-1 462.58 -128.86* -10.18***
(0.335) (-1.767) (-2.913) Liqi,t-1 0.90 0.70 1.20
(0.999) (1.166) (1.294) HHILoani,t-1 0.51 -1.30** -0.77
(0.630) (-2.249) (-1.447) Tradingi,t-1 30.63** -9.75*** -4.51**
(2.234) (-4.289) (-2.010) Capitali,t-1 -0.61 -0.08 -0.24
(-0.141) (-0.051) (-0.194) HHIRevi,t-1 -0.60 0.21 -0.19
(-0.567) (0.238) (-0.196) AssetGrowthi,t-1 -1.61 2.38 2.35
(-1.072) (1.544) (1.410) AssetLev2i,t-1 0.26 0.11 -0.08
(0.894) (0.566) (-0.249) AssetLev3i,t-1 0.20 0.28 0.35
(0.688) (1.197) (0.824) AssetLev4i,t-1 0.53** 0.00 -0.28
(2.300) (0.016) (-1.046) AssetLev5i,t-1 0.43 -0.05 0.87***
(1.405) (-0.145) (2.621) AssetLev6i,t-1 0.20 0.05 0.66**
(0.732) (0.174) (2.357) AssetLev7i,t-1 -0.21 0.77** 0.50
(-0.398) (2.515) (1.459) AssetLev8i,t-1 0.19 0.73*
(0.496) (1.892) Yeart Yes Yes Yes Constant 3.86*** 4.44*** 4.12***
(4.378) (6.780) (5.362) No. of Observations 305 299 296 No. of BHCs 63 66 68 R-Squared 0.102 0.240 0.320
Note: The table presents the results of regressions of the z-score by level of securitisation. Columns 1-3 use sub-samples of banks with low, mediun, and high level of securitisation, accordingly. The dependent variable is a z-score computed on a yearly basis using averages and standard deviations for each BHC over four quarters in a given year and winsorised at 1%. The independent variables are averages of four quarterly observations in a year for each BHC. We use natural logarithms for securitisation variables, which include: (i) outstanding securitisation (Sec); (ii) credit enhancements (CredEnh); (iii) liquidity provisions (LiqProv); and (iv) sellers' interest (SellerInterest). The control variables include: (i) liquidity ratio (Liq); (ii) loan concentration (HHILoan); (iii) trading assets ratio (Trading); (iv) capital ratio (Capital); (v) revenue concentration (HHIRev); (vi) asset growth (Growth); and (vii) asset size indicators (AssetLev*) (see Appendix A for the definition and construction of the variables). All independent variables are winsorised at 1% level and lagged one period. Random effects regressions are covering the period from 2002 to 2007. Year dummies are incorporated in all regressions. Robust standard errors reported in parentheses are corrected for clustering at the BHC-level. *, **,*** indicate significance at 10%, 5%, and 1% levels, respectively.

31
Appendix A Bank Holding Company Data Definition and Construction
Variable Definition Construction (FR Y-9C Data Items)
Balance Sheet Structure Total Assets Total Assets BHCK2170 Liquidity Ratio Liquid Assets/Assets Ratio (BHCK0081 + BHCK0395 + BHCK0397 + BHCK1754 + BHCK1773)/BHCK2170 Loan Ratio Loans/Assets Ratio BHCK 2122/BHCK2170 Trading Assets/Assets Ratio Trading Assets/Assets Ratio BHCK3545/BHCK2170 Deposits/Assets Ratio Deposits/Assets Ratio (BHCK3517+ BHCK3404)/BHCK3368 Equity/Assets Ratio Equity Capital/Assets Ratio BHCK3210/BHCK2170
Loan Portfolio Real Estate Loan Ratio Real Estate Loans/Assets Ratio BHCK1410/(BHCK2122 + BHCK2123) C&I Loan Ratio Commercial and Industrial Loans/Assets
Ratio (BHCK1763 + BHCK1764)/(BHCK2122 + BHCK2123)
Consumer Loan Ratio Consumer Loans/Assets Ratio (BHCKB538 + BHCKB539 + BHCK2011)/(BHCK2122 + BHCK2123) Other Loan Ratio Other Loans/Assets Ratio (BHCK2122 + BHCK2123 - BHCK1410 - BHCK1763 - BHCK1764 - BHCKB538 -
BHCKB539 - BHCK2011)/(BHCK2122 + BHCK2123)
Loan HHI Loan Herfindahl-Hirschman Index (BHCK1410/(BHCK2122 + BHCK2123))^2 + ((BHCK1763 + BHCK1764)/ (BHCK2122 + BHCK2123))^2 + ((BHCKB538 + BHCKB539 + BHCK2011)/ (BHCK2122 + BHCK2123))^2 + ((BHCK2122 + BHCK2123 - BHCK1410 - BHCK1763 - BHCK1764 - BHCKB538 - BHCKB539 - BHCK2011)/(BHCK2122 + BHCK2123))^2
Regulatory Capital Tier I Leverage Ratio Tier I Leverage Ratio BHCK7204 Tier I Risk-Based Capital Ratio Tier I Risk-Based Capital Ratio BHCK7206 Total Risk-Based Capital Ratio Total Risk-Based Capital Ratio BHCK7205 Performance Interest Income/NOR Interest Income/Net Operating Revenue BHCK4074/(BHCK4074 + BHCK4079) Revenue HHI Revenue Herfindahl-Hirschman Index (BHCK4074/(BHCK4074 + BHCK4079))^2 + (BHCK4079/(BHCK4074 +
BHCK4079))^2 Interest Margin Net Interest Income/Total Assets BHCK4074/BHCK3368 Return on Assets (ROA) Net Income/Total Assets BHCK4340/BHCK3519 Return on Equity (ROE) Net Income/Equity Capital BHCK4340/BHCK3368
(continued on next page)

32
Appendix A (continued)
Variable Definition Construction (FR Y-9C Data Items)
Risk Characteristics RWATA Ratio Risk-Weighted Assets/Total Assets Ratio BHCKA223/BHCK2170 NPL/Loans Ratio Non-Performing Loans/Loans Ratio (BHCK5525 + BHCK5526 - BHCK3506 - BHCK3507)/BHCK3516 Charge-Off Ratio Net Charge-Offs/Loans Ratio (BHCK4635 - BHCK4605)/BHCK3516 Loan Loss Provision Ratio Quarterly Provision for Loan Losses/Loans
Ratio BHCK4230/BHCK3516
Loan Loss Allowance Ratio Allowance for Loan Losses/Loans Ratio BHCK3123/BHCK3516 Z-Score (Z) Z-Score RAROA Risk-Adjusted Return on Assets StdDevROA Standard Deviation of Return on Assets RAROE Risk-Adjusted Return on Equity
Securitisation Sec Ratio Securitised Assets/Total Assets Ratio (BHCKB705 + BHCKB706 + BHCKB707 + BHCKB708 + BHCKB709 + BHCKB710+
BHCKB711)/BHCK2170 CredEnh Ratio Credit Enhancements/Total Assets Ratio (BHCKB712 + BHCKB713 + BHCKB714 + BHCKB715 + BHCKB716 + BHCKB717 +
BHCKB718 + BHCKC393 + BHCKC394 + BHCKC395 + BHCKC396 + BHCKC397 + BHCKC398 + BHCKC399 + BHCKC400 + BHCKC401 + BHCKC402 + BHCKC403 + BHCKC404 + BHCKC405 + BHCKC406)/BHCK2170
CredEnh/Sec Ratio Credit Enhancements/Securitised Assets Ratio
(BHCKB712 + BHCKB713 + BHCKB714 + BHCKB715 + BHCKB716 + BHCKB717 + BHCKB718 + BHCKC393 + BHCKC394 + BHCKC395 + BHCKC396 + BHCKC397 + BHCKC398 + BHCKC399 + BHCKC400 + BHCKC401 + BHCKC402 + BHCKC403 + BHCKC404 + BHCKC405 + BHCKC406)/(BHCKB705 + BHCKB706 + BHCKB707 + BHCKB708 + BHCKB709 + BHCKB710 + BHCKB711)
CEIOS Ratio Credit-Enhancing Interest-Only Strips/Total Assets Ratio
(BHCKB712 + BHCKB713 + BHCKB714 + BHCKB715 + BHCKB716 + BHCKB717 + BHCKB718)/BHCK2170
CEIOS/Sec Ratio Credit-Enhancing Interest-Only Strips/Securitised Assets Ratio
(BHCKB712 + BHCKB713 + BHCKB714 + BHCKB715 + BHCKB716 + BHCKB717 + BHCKB718)/(BHCKB705 + BHCKB706 + BHCKB707 + BHCKB708 + BHCKB709 + BHCKB710 + BHCKB711)
(continued on next page)

33
Appendix A (continued)
Variable Definition Construction (FR Y-9C Data Items)
SubSec Ratio Subordinated Securities/Total Assets Ratio (BHCKC393 + BHCKC394 + BHCKC395 + BHCKC396 + BHCKC397 + BHCKC398 + BHCKC399)/BHCK2170
SubSec/Sec Ratio Subordinated Securities/Securitised Assets Ratio
(BHCKC393 + BHCKC394 + BHCKC395 + BHCKC396 + BHCKC397 + BHCKC398 + BHCKC399)/(BHCKB705 + BHCKB706 + BHCKB707 + BHCKB708 + BHCKB709 + BHCKB710 + BHCKB711)
SLC Ratio Standby Letters of Credit/Total Assets Ratio
(BHCKC400 + BHCKC401 + BHCKC402 + BHCKC403 + BHCKC404 + BHCKC405 + BHCKC406)/BHCK2170
SLC/Sec Ratio Standby Letters of Credit/Securitised Assets Ratio
(BHCKC400 + BHCKC401 + BHCKC402 + BHCKC403 + BHCKC404 + BHCKC405 + BHCKC406)/(BHCKB705 + BHCKB706 + BHCKB707 + BHCKB708 + BHCKB709 + BHCKB710 + BHCKB711)
LiqProv Ratio Liquidity Provision Commitments/Total Assets Ratio
(BHCKB726 + BHCKB727 + BHCKB728 + BHCKB729 + BHCKB730 + BHCKB731 + BHCKB732)/BHCK2170
LiqProv/Sec Ratio Liquidity Provision Commitments/Securitised Assets Ratio
(BHCKB726 + BHCKB727 + BHCKB728 + BHCKB729 + BHCKB730 + BHCKB731 + BHCKB732)/(BHCKB705 + BHCKB706 + BHCKB707 + BHCKB708 + BHCKB709 + BHCKB710 + BHCKB711)
SellerInterest Ratio Seller's Interest/Total Assets (BHCKB761 + BHCKB762 + BHCKB763 + BHCKB500 + BHCKB501 + BHCKB502)/BHCK2170
SellerInterest/Sec Ratio Seller's Interest/Securitised Assets (BHCKB761 + BHCKB762 + BHCKB763 + BHCKB500 + BHCKB501 + BHCKB502)/(BHCKB705 + BHCKB706 + BHCKB707 + BHCKB708 + BHCKB709 + BHCKB710 + BHCKB711)
SecNPL/Sec Ratio Past Due Securitised Assets/Securitised Assets Ratio
(BHCKB740 + BHCKB741 + BHCKB742 + BHCKB743 + BHCKB744 + BHCKB745 + BHCKB746)/(BHCKB705 + BHCKB706 + BHCKB707 + BHCKB708 + BHCKB709 + BHCKB710 + BHCKB711)
SecChargeOff/Sec Ratio Net Charge-Offs on Securitised Assets/Securitised Assets
(BHCKB747 + BHCKB748 + BHCKB749 + BHCKB750+ BHCKB751 + BHCKB752 + BHCKB753 - BHCKB754 - BHCKB755 - BHCKB756 - BHCKB757 - BHCKB758 - BHCKB759 - BHCKB760)/(BHCKB705 + BHCKB706 + BHCKB707 + BHCKB708 + BHCKB709 + BHCKB710 + BHCKB711)
OthersCredEnh Ratio Credit Enhancements to Other Institutions' Securitisations/Total Assets
(BHCKB776+ BHCKB777+ BHCKB778 + BHCKB779 + BHCKB780 + BHCKB781 + BHCKB782)/BHCK2170
OthersSecLiqProv Ratio Liquidity Provision Commitments to Other Institutions' Securitisations/Total Assets
(BHCKB783 + BHCKB784+ BHCKB785+ BHCKB786+ BHCKB787+ BHCKB788 + BHCKB789)/BHCK2170
Note: Definition and construction of variables used in the study. Bank holding company data items are taken from FR Y-9C forms.
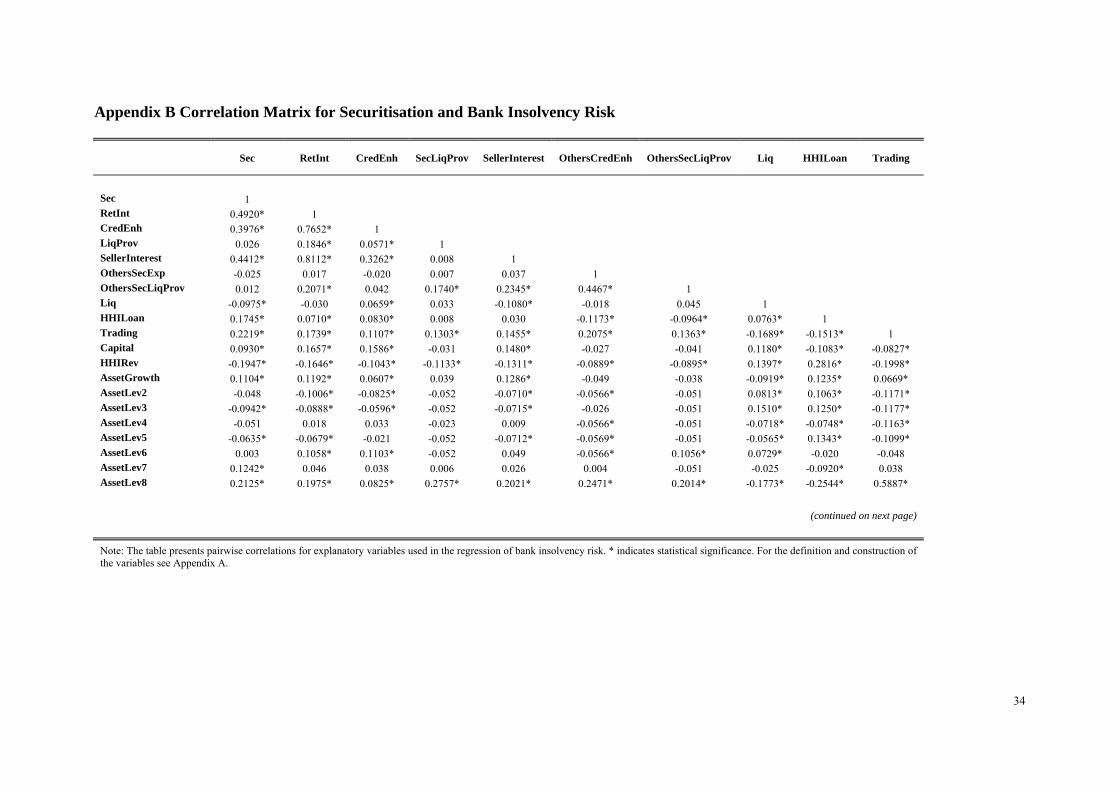
34
Appendix B Correlation Matrix for Securitisation and Bank Insolvency Risk
Sec RetInt CredEnh SecLiqProv SellerInterest OthersCredEnh OthersSecLiqProv Liq HHILoan Trading
Sec 1 RetInt 0.4920* 1 CredEnh 0.3976* 0.7652* 1 LiqProv 0.026 0.1846* 0.0571* 1 SellerInterest 0.4412* 0.8112* 0.3262* 0.008 1 OthersSecExp -0.025 0.017 -0.020 0.007 0.037 1 OthersSecLiqProv 0.012 0.2071* 0.042 0.1740* 0.2345* 0.4467* 1 Liq -0.0975* -0.030 0.0659* 0.033 -0.1080* -0.018 0.045 1 HHILoan 0.1745* 0.0710* 0.0830* 0.008 0.030 -0.1173* -0.0964* 0.0763* 1 Trading 0.2219* 0.1739* 0.1107* 0.1303* 0.1455* 0.2075* 0.1363* -0.1689* -0.1513* 1 Capital 0.0930* 0.1657* 0.1586* -0.031 0.1480* -0.027 -0.041 0.1180* -0.1083* -0.0827* HHIRev -0.1947* -0.1646* -0.1043* -0.1133* -0.1311* -0.0889* -0.0895* 0.1397* 0.2816* -0.1998* AssetGrowth 0.1104* 0.1192* 0.0607* 0.039 0.1286* -0.049 -0.038 -0.0919* 0.1235* 0.0669* AssetLev2 -0.048 -0.1006* -0.0825* -0.052 -0.0710* -0.0566* -0.051 0.0813* 0.1063* -0.1171* AssetLev3 -0.0942* -0.0888* -0.0596* -0.052 -0.0715* -0.026 -0.051 0.1510* 0.1250* -0.1177* AssetLev4 -0.051 0.018 0.033 -0.023 0.009 -0.0566* -0.051 -0.0718* -0.0748* -0.1163* AssetLev5 -0.0635* -0.0679* -0.021 -0.052 -0.0712* -0.0569* -0.051 -0.0565* 0.1343* -0.1099* AssetLev6 0.003 0.1058* 0.1103* -0.052 0.049 -0.0566* 0.1056* 0.0729* -0.020 -0.048 AssetLev7 0.1242* 0.046 0.038 0.006 0.026 0.004 -0.051 -0.025 -0.0920* 0.038 AssetLev8 0.2125* 0.1975* 0.0825* 0.2757* 0.2021* 0.2471* 0.2014* -0.1773* -0.2544* 0.5887*
(continued on next page)
Note: The table presents pairwise correlations for explanatory variables used in the regression of bank insolvency risk. * indicates statistical significance. For the definition and construction of the variables see Appendix A.

35
Appendix B Correlation Matrix for Securitisation and Bank Insolvency Risk (continued)
Capital HHIRev AssetGrowth AssetLev2 AssetLev3 AssetLev4 AssetLev5 AssetLev6 AssetLev7 AssetLev8
Sec
RetInt
CredEnh
LiqProv
SellerInterest
OthersCredEnh
OthersSecLiqProv
Liq
HHILoan
Trading
Capital 1 HHIRev 0.1407* 1 AssetGrowth -0.038 -0.003 1 AssetLev2 -0.042 0.2238* -0.029 1 AssetLev3 -0.048 0.0880* -0.0948* -0.1429* 1 AssetLev4 0.2029* 0.027 -0.014 -0.1421* -0.1429* 1 AssetLev5 -0.0601* -0.0664* 0.0591* -0.1429* -0.1436* -0.1429* 1 AssetLev6 0.041 -0.0665* 0.0613* -0.1421* -0.1429* -0.1421* -0.1429* 1 AssetLev7 -0.0636* -0.1035* 0.006 -0.1429* -0.1436* -0.1429* -0.1436* -0.1429* 1 AssetLev8 -0.0659* -0.3508* 0.047 -0.1421* -0.1429* -0.1421* -0.1429* -0.1421* -0.1429* 1
Note: The table presents pairwise correlations for explanatory variables used in the regression of bank insolvency risk. * indicates statistical significance. For the definition and construction of the variables see Appendix A.

36
Appendix C Exposition of Z-Score
Defining insolvency as a situation in which losses (negative profits) exceed equity capital, insolvency risk can be expressed as:
( ) ( ) ( )EA
P E P ROA EA F ROA dr
where is profits, E is equity capital, ( / )ROA A is return on assets, ( / )EA E A is
the equity capital to assets ratio, and ( )F ROA is return distribution with first and second
moments ROA and 2ROA , respectively.
As shown by Roy (1952), assuming profits are normally distributed:
2
22
1( )
( )ROAP ROA EA
ZROA EA
Therefore:
ROA
ROA EAZ

37
Appendix D Hausman Specification Test for Securitisation and Bank Insolvency Risk
Coefficients Difference S.E. FE RE (b) (B) (b-B) SqRt(diag(V_b-V_B))
Seci,t-1 1.1558 0.2855 0.8703 0.4633 RetInti,t-1 -9.3057 -12.6749 3.3692 3.4380 Liqi,t-1 1.1164 0.8676 0.2488 0.8019 HHILoani,t-1 0.2400 -0.4451 0.6851 0.7085 Tradingi,t-1 0.9914 -5.9511 6.9425 4.3639 Capitali,t-1 3.8240 -0.4070 4.2310 1.8568 HHIRevi,t-1 -0.2821 -0.1299 -0.1522 0.6660 AssetGrowthi,t-1 1.0289 0.8782 0.1507 0.5007 AssetLevel2i,t-1 -0.0357 0.2149 -0.2506 0.1921 AssetLevel3i,t-1 0.0318 0.3552 -0.3235 0.2511 AssetLevel4i,t-1 -0.0647 0.2938 -0.3585 0.3278 AssetLevel5i,t-1 0.2056 0.5185 -0.3128 0.4424 AssetLevel6i,t-1 -0.1566 0.3911 -0.5476 0.5011 AssetLevel7i,t-1 -0.3658 0.6266 -0.9923 0.5821 AssetLevel8i,t-1 -0.8306 0.5542 -1.3848 0.6948 Year2 -0.1225 -0.1014 -0.0211 0.0212 Year3 0.0354 0.0341 0.0013 0.0439 Year4 0.1776 0.1395 0.0381 0.0484 Year5 -0.0138 -0.0993 0.0855 0.0631 Year6 -0.6511 -0.7169 0.0659 0.0749
b = Consistent under Ho and Ha B = Inconsistent under Ha, efficient under Ho Test: Ho: Difference in coefficients not systematic
chi2(20) = (b-B)'[(V_b-V_B)^(-1)](b-B) chi2(20) = 26.70 Prob>chi2 = 0.1439
Note: The table report the results of the Hausman specification test for regression of bank insolvency risk (equation (5)). Hausman specification test compares fixed effects versus random effects estimates; under the null hypothesis, the individual effects are uncorrelated with the other regressors in the model and can be treated as random (see Hausman (1978)). The statistically insignificant difference (H0 is not rejected) is interpreted as evidence for applying the random effects model.

38
REFERENCES
Acharya, Viral V., Philipp Schnabl, and Gustavo Suarez, 2012, Securitization without Risk Transfer, CEPR Working Paper No. DP8769.
Aggarwal, Raj, and Kevin T. Jacques, 2001, The Impact of FDICIA and Prompt Corrective Action on Bank Capital and Risk: Estimates Using a Simultaneous Equations Model, Journal of Banking and Finance 25, 1139-1160.
Basel Committee on Banking Supervision (BCBS), 2002, Second Working Paper on the Treatment of Asset Securitisations, BCBS Working Paper No. 11.
Calomiris, Charles W., and Joseph R. Mason, 2004, Credit Card Securitisation and Regulatory Arbitrage, Journal of Financial Services Research 26, 5-27.
Cebenoyan, Sinan A., and Philip E. Strahan, 2004, Risk Management, Capital Structure and Lending at Banks, Journal of Banking and Finance 28, 19-43.
Čihák, Martin, Andrea Maechler, Klaus Schaeck, and Stéphanie Stolz, 2012, Who Disciplines Bank Managers?, Review of Finance 16, 197-243.
Chen, Weitzu, Chi-Chun Liu, and Stephen G. Ryan, 2008, Characteristics of Securitisations that Determine Issuers' Retention of the Risks of the Securitised Assets, Accounting Review 83, 1181-1215.
Dang, Tri., Gary Gorton, and Bengt Holmström, 2011, “Ignorance and the optimality of debt for liquidity provision”, Mimeo.
Dell'Ariccia, Giovanni, Deniz Igan, and Luc A. Laeven, 2009, Credit Booms and Lending Standards: Evidence from the Subprime Mortgage Market, European Banking Center Discussion Paper No. 2009-14S.
Demsetz, Rebecca S., 2000, Bank Loan Sales: A New Look at the Motivations, The Journal of Financial Research 23, 197-222.
ECB 2009, Financial Stability Review. Available at: http://www.ecb.int/pub/pdf/other/financialstabilityreview200912en.pdf?41cbb6d12fc270a0045b2827b235227f
FDIC 2007, Risk Management Credit Card Securitisation Manual. Available at: http://www.fdic.gov/regulations/examinations/credit_card_securitisation
FDIC 2010, Reports of Condition and Income Report Instructions. Available at: http://www.fdic.gov/regulations/resources/call/index.html
Fender, Ingo, and Janet Mitchell, 2009a, The Future of Securitisation: How to Align Incentives, Bank of International Settlements Quarterly Review September 2009, 27-42.

39
Fender, Ingo, and Janet Mitchell, 2009b, Incentive and Tranche Retention in Securitisation: A Screening Model, Bank of International Settlements Working Paper No. 289.
Gorton, Gary B., and George G. Pennacchi, 1995, Banks and Loan Sales: Marketing Nonmarketable Assets, Journal of Monetary Economics 35, 389-411.
Gorton, Gary B., and Nicholas S. Souleles, 2005, Special Purpose Vehicles and Securitisation, Federal Reserve Bank of Philadelphia Working Paper No. 05-21.
Hausman, Jerry, 1978, Specification Tests in Econometrics, Econometrica 46, 1251-1271.
Hesse, Heiko, and Martin Čihák, 2007, Cooperative Banks and Financial Stability, IMF Working Paper No. 07/02.
Hirtle, Beverly J., and Kevin J. Stiroh, 2007, The Return to Retail and the Performance of US Banks, Journal of Banking and Finance 31, 1101-1133.
Keys, Benjamin J., Tanmoy K. Mukherjee, Amit Seru, and Vikrant Vig, 2010, Did Securitization Lead to Lax Screening? Evidence from Subprime Loans, Quarterly Journal of Economics 125, 307-362.
Laeven, Luc, and Ross Levine, 2009, Bank Governance, Regulation and Risk Taking, Journal of Financial Economics 93, 259-275.
Landsman, Wayne R., Kenneth V. Peasnell, and Catherine Shakespeare, 2008, Are Asset Securitisations Sales or Loans?, The Accounting Review, 83, 1251-1272.
Mercieca, Steve, Klaus Schaeck, and Simon Wolfe, 2007, Small European Banks: Benefits from Diversification?, Journal of Banking and Finance 31, 1975-1998.
Mian, Atif R., and Amir Sufi, 2009, The Consequences of Mortgage Credit Expansion: Evidence from the 2007 Mortgage Default Crisis, NBER Working Paper No. W13936.
Niu, Flora F., and Gordon D. Richardson, 2006, Are Securitizations in Substance Sales or Secured Borrowings? Capital-Market Evidence, Contemporary Accounting Research 23, 1105-1133.
OCC 1997, Asset Securitization: The Comptroller's Handbook. Available at: http://www.occ.gov/static/publications/handbook/assetsec.pdf
OCC 2002, Guidance 2002-20: Interagency Guidance on Implicit Recourse in Asset Securitisations. Available at: http://www.occ.treas.gov/news-issuances/bulletins/2002/bulletin-2002-20a.pdf
Park Sun Y., 2011, The Design of Subprime Mortgage Backed Securities and Information Insensitivity, Mimeo.
Pennacchi, George G., 1988, Loan Sales and the Cost of Bank Capital, The Journal of Finance 43, 375-396.
Ryan, Stephen G., 2008, Accounting in and for the Subprime Crisis, The Accounting Review 83, 1605-1638.

40
Roy, Arthur D., 1952, Safety First and the Holding of Assets, Econometrica 20, 431-449.
Stiroh, Kevin J., and Adrienne Rumble, 2006, The Dark Side of Diversification: The Case of US Financial Holding Companies, Journal of Banking and Finance 30, 2131-2161.
Thomas, Hugh, and Zhiqiang Wang, 2004, Bank Securitisation and Risk Management, Mimeo.