Creative Alaska: creative capital and economic …...velopment and endogenous growth is hard to...
15
Polar Record http://journals.cambridge.org/POL Additional services for Polar Record: Email alerts: Click here Subscriptions: Click here Commercial reprints: Click here Terms of use : Click here Creative Alaska: creative capital and economic development opportunities in Alaska Andrey N. Petrov and Philip A. Cavin Polar Record / FirstView Article / January 2006, pp 1 14 DOI: 10.1017/S0032247412000289, Published online: 29 June 2012 Link to this article: http://journals.cambridge.org/abstract_S0032247412000289 How to cite this article: Andrey N. Petrov and Philip A. Cavin Creative Alaska: creative capital and economic development opportunities in Alaska. Polar Record, Available on CJO 2012 doi:10.1017/S0032247412000289 Request Permissions : Click here Downloaded from http://journals.cambridge.org/POL, IP address: 134.161.116.178 on 09 Oct 2012
Transcript of Creative Alaska: creative capital and economic …...velopment and endogenous growth is hard to...

Polar Recordhttp://journals.cambridge.org/POL
Additional services for Polar Record:
Email alerts: Click hereSubscriptions: Click hereCommercial reprints: Click hereTerms of use : Click here
Creative Alaska: creative capital and economic development opportunities in Alaska
Andrey N. Petrov and Philip A. Cavin
Polar Record / FirstView Article / January 2006, pp 1 14DOI: 10.1017/S0032247412000289, Published online: 29 June 2012
Link to this article: http://journals.cambridge.org/abstract_S0032247412000289
How to cite this article:Andrey N. Petrov and Philip A. Cavin Creative Alaska: creative capital and economic development opportunities in Alaska. Polar Record, Available on CJO 2012 doi:10.1017/S0032247412000289
Request Permissions : Click here
Downloaded from http://journals.cambridge.org/POL, IP address: 134.161.116.178 on 09 Oct 2012

Polar Record. Page 1 of 14. c© Cambridge University Press 2012. doi:10.1017/S0032247412000289 1
Creative Alaska: creative capital and economic developmentopportunities in AlaskaAndrey N. Petrov and Philip A. CavinArctic Social and Environmental Systems Laboratory, Department of Geography, University ofNorthern Iowa, Cedar Falls, IA 50614, USA ([email protected])
Received September 2011
ABSTRACT. The flaws of the 20th century–type development ‘mega–projects’ in the circumpolar North promptArctic regions actively to search for alternative strategies of regional development that break away from resource–dependency and reconcile local (traditional) societies with the realities of post–Fordism and globalisation. Thispaper presents a study that focuses on the notion of creative capital (CC) and assesses its ability to foster economicdevelopment in Alaska. The findings suggest that some characteristics of the CC observed in Alaskan communitiesare similar to those found in southern regions, whereas others are distinct (but similar to those in the Canadian North).In Alaska, the synergy between cultural economy, entrepreneurship and leadership appear to be more important incharacterising creative capacities than formal education. The geographical distribution of the CC is uneven and heavilyclustered in economically, geographically and politically privileged northern urban centres. However, some remoteregions also demonstrate considerable levels of creative potential, in particular associated with the aboriginal culturalcapital (artists, crafters, etc.). A number of Alaskan regions, creative ‘hot spots’, could become places that can benefitfrom alternative strategies of regional development based on CC, knowledge–based and cultural economies.
Introduction: creative capital and alternativestrategies of economic development in the Arctic
With rare exceptions, the Arctic regions have always beena showcase of economic marginalisation and the poly-gon for (largely unsuccessful) economic developmentpolicies and projects (Agranat 1992; Rea 1976; Hayterand others 1994; DiFrancesco 2000; Bone 2009). Eco-nomists have well documented that frontier economiesare marginal, vulnerable, structurally truncated and func-tionally dependent (Agranat 1992; Bone 2009; Bourne2000; Rea 1968; Petrov 2012).
The state of Alaska is an example of northern eco-nomy that is largely dependent upon the petroleum in-dustry and government sectors, which together directlyor indirectly are responsible for 66% of the state’s em-ployment and 69% of GDP (Goldsmith 2008). Althoughthe wealth of the resource sector gives the impression ofeconomic prosperity, it is the structure of the Alaskaneconomy and the weakness of its internal economic ca-pacities and institutions that indicate potential long–termeconomic difficulties (Huskey 2005; Goldsmith 2008).With the economic base solidly dominated by externally–dependent sectors, Alaska, as many other frontier eco-nomies, is under perpetual threat of cataclysm associatedwith resource bust or federal budget cuts. (See Petrov(2010) for an analysis of the consequences of the 1990smining ‘bust’ in Yukon.)
A lasting economic disadvantage of a northern re-source periphery has been captured by the Harold Innis’s‘staple theory’ (Innis 1956) and since then has been sim-ilarly interpreted by the variety of regional developmenttheories (see Huskey 2006; Petrov 2011).
Not surprisingly, over eighty years into economicdevelopment policymaking in the north, the circumpolarcountries are still searching for better ways to managetheir northern frontiers. In Canada, the two consecut-
ive governments (Liberals in 2004 and Conservativesin 2009) proposed comprehensive ‘northern strategies’,and the new ‘Concept of socio–economic developmentof the north’ was adopted by the Russian cabinet in2000 (Pravitel’stvo RF 2000), while a new concept spe-cifically targeting the Arctic is in progress at this time.Although the United States (in contrast to Canada andRussia) does not have a northern development strategy, inAlaska, a number of regional development organisations(ARDORs) have newly updated elaborate developmentstrategies (Alaska Division of Economic Development2012). Still, Arctic countries are actively looking fornew, alternative strategies of regional development notbounded by the staple economy.
A growing consensus among scholars is that thesestrategies should reconcile a postcolonial paradigm oflocally–oriented development and the realities of con-temporary capitalism (including pressures and compet-ition imposed by globalisation). ‘Constructive’ post–developmentalists argue (for example Gibson–Graham2005; Glassman 2011; Power 2003; Radcliffe 2005)that an alternative development regime must be sim-ultaneously based on emerging traditions of the post–industrial society, post–Fordist capitalism, and the post-colonial paradigm. In the Arctic regions, it also must besupplemented by the consensus between aboriginalism,environmentalism, industrialism and nationalism (Hayterand others 2003). This complex task, in terms of regionalpolicies, should result in ‘situatedness’, appreciation oflocal knowledge, promotion of local initiative, devolutionof control, development of knowledge–based economy,and so forth.
In this respect, the alternative strategy based on en-abling local human capacities, such as creative capital(CC), to advance economic development seems to beappealing. As it is described below, there is preliminary

2 PETROV AND CAVIN
evidence that such scenario can be seriously consideredin Alaska. However, any research into this matter facesthe lack of basic knowledge about the spatial distribution,characteristics and utilisation of CC, as well as thelack of conceptual and methodological foundations forconducting such a study.
It is important to point out that development basedon utilising the CC is not a mere substitution of naturalresource as a thrust of ‘modernisation’ with human cap-ital. The difference lies in the local embeddedness of theCC (especially in its formulation used in this paper), itsrelation to local and indigenous knowledge and institu-tions. Evidence from northern success stories suggeststhat CC’s economic returns tend to be less decoupled withlocal economies, can dwell on indigenous knowledgeand tradition and intertwine with institution–building andformation of civic society. This is partially determinedby the endogenous nature of knowledge–based economyin general, but also by a tight relation of CC with otherforms of the in situ societal capital in the periphery(Aarsæther 2004). For example, Petrov (2011) notes thatthe ‘best innovation environment [in Northern Ontario]is built though community synergies, where creative andsocial capital reinforce each other’ (p. 187). In somerespect, one may argue that CC based development isone of the ways to reconcile the realities of post–Fordistglobalising world economy and modernities of the north.
In other words, in peripheral areas ‘weakness ofstrong ties’ may become strength, if an innovative activitybuilds appropriate networks and involves the community.By the same token, an innovator in the periphery isnot an ‘atomized subject, apparently, with a preferencefor intense but shallow and noncommittal relationships’(Peck 2005: 746), but one who is ready to embrace andcooperate with the community.
The current paper addresses these important know-ledge gaps in respect to CC in Alaska. The first objectiveof this analysis is to apply the creative class metrics inAlaska and compare their behaviour to other regions asdescribed in the literature for US and Canada, especiallyin the Canadian north. This includes the analysis of therelationships between CC, ‘quality of place’ characterist-ics, and development in Alaska. The second objective ofthis paper is to utilise the metrics in order to describe thegeography of the CC in the state, identify its clusters andpossible flagship areas where alternative developmentpolicies may be most applicable.
CC and economic development in Alaska: the theory
In a staple–driven economy of the Arctic, the physicalnature of a resource, not the volume of knowledge inves-ted in its production, provides a necessary comparativeadvantage. Here, regional innovation systems depend onextremely thin streams of knowledge regulated by a fewmajor institutional agents, first of all the state and largecorporations (Bone 2009). In this context, there are fewcompeting technologies or other forms of innovation that
could weaken the rigidity of the current techno–economictrajectory (Clark and others 2001). Consequently, thecondition of path–dependency in the frontier remainsexceptionally strong, preventing it from being successfulin a modern economic competition.
It is typical for peripheral regions, which heavilyrely on resource or public sector, to develop a cultureof dependency that discourages entrepreneurship andinnovativeness (Polèse and others 2002; Suorsa 2009).Moreover, the disconnectedness of the local firms withcommunities and networks of practice (Gertler 2005; La-gendijk and Lorentzen 2007) prevents the acquisition ofthe tacit knowledge that is so crucial for the modern eco-nomic development. In addition, the peripheral regionstend to develop a ‘branchplant’ culture, in which local en-trepreneurship and innovativeness have minor roles beingdependent on externally located headquarters (O’Haganand Cecil 2007). This ‘intrafirm’ or vertical peripheralityweakens the region’s ability to create the path on its ownand encourages a cultural lock–in. Despite the fact that aresource sector could be quite innovative, in a resource–oriented economy regional innovation systems depend onvery narrow flows of knowledge through a few major in-stitutional agents, such as large corporations and the state.
A path–dependency approach appears to be a usefulway to interpret a disadvantage of northern peripheries.Path–dependency is the persistence of historically andsocially embedded organisational trajectories, that is spe-cific arrangements of means, oriented towards increasingproductivity and competitiveness (Bathelt and Glucker2003; Lundvall 1992) by dwelling on the existing techno-logical paradigm using the increasing returns logic. How-ever, the increasing accumulation of such returns doesnot continue infinitely, and the absence of change in thechosen trajectory results in a ‘lock–in’ (Grabher 1993).
The evidence from other lagging regions demon-strates that in the case of such ‘lock–in’, there aretwo possibilities for a region: a new ‘path creation’(or ‘regional reinvention,’ when a region develops newforms of competitiveness) or decline (Bathelt and Boggs2005). Among the most important arrangements thatcan lead to a ‘new path creation’ are the scientific,institutional, economic and social shifts that allow in-venting or adopting new knowledge (Bassanini and Dosi2001). Schienstock (2007) argued that a window of newopportunities is opened up by a combination of a newknowledge paradigm, economic pressures to adapt to thenew paradigm, change events that support transformationand available courses of action. Some of these ‘changeevents’ are in place in the Arctic: a pressure to fosterdevelopment, new technological opportunities, the effectsof globalisation, regional self–determination and the de-volution of power.
Human agency is a key transformative factor: agentsof transformation are another critical and necessary com-ponent of change. These agents can be political insti-tutions, firms or non–governmental organisations. How-ever, in the end, the agents of change are individuals and

CREATIVE CAPITAL AND ECONOMIC DEVELOPMENT OPPORTUNITIES IN ALASKA 3
their groups who ‘write’ the innovation history of theregion (Bassanini and Dosi 2001; Petrov 2007). CC, byan analogy to human capital, may be defined as a stockof creative abilities and knowledge(s) that have economicvalue and are embodied in a group of individuals whoeither possess high levels of education and/or are engagedin creative (scientific, artistic, entrepreneurial or techno-logical) types of activities (that is what Florida (2002)calls ‘the creative class’).
Recently, the literature on knowledge production,knowledge spillovers, regional institutional frameworksof knowledge transfer, and regional innovation systemsconverged to claim the pivotal role of human creativityin advancing regional and global economies (for ex-ample Desrochers 2001; Florida 2002, 2005; Polèse andTremblay 2005; Schienstock 2007). In other words, itbecame conventional to cite the human, and specificallycreative, capital among the major drivers of regionaldevelopment and to consider it as the key element ofregional competitiveness. The ability of regions to at-tract and accumulate creative capital is perceived asa condition, underpinning innovative development andknowledge–based economic growth (Desrochers 2001;Florida 2002).
A number of opponents criticised the so–called ‘cre-ative class thesis.’ The critics point out the difficulty indemonstrating clear causality between the creative classand economic growth (Glaeser 2004; Shearmur 2007).Others focus on popular (mis)interpretations of the cre-ative class as privileged urban techno–elite, on conceptssuch as metropolitan culturalism and cliché policy scripts(Markusen 2006; Peck 2005; Scott 2006). In this paper,we mostly leave this discussion aside, partially becauseit almost exclusively concerns metropolitan regions andsays little about peripheries. As we discuss below, theearlier studies and our research suggest that the role of thecreative class in non–metropolitan areas is quite differentfrom large city–regions, so that the main arguments of thecreative class debate should be reconsidered accordingly,when more evidence is collected and analysed.
Existing studies of innovation in peripheral areasalso point to an important role of creative capital that,however, must be embedded into social networks andembraced by community (Aarsæther 2004; Barnes andHayter 1992; Polèse and others 2002). For example,the study of local innovation in the Scandinavian northstresses ‘the importance of key local actors in innovativeprocesses that take place in remote regions’. The authorsconclude, ‘almost every innovation has had a clear coreagent to manage the process. Very often this agent, initi-ator and “engine” of the process has been a local person,who has committed him/herself to the development ofa new idea’ (Aarsæther 2004: 244). Similar evidencehas been cited in other marginal regions (for exampleHayter and others 1994; Stohr 2000), where local actors,particularly entrepreneurs and inventors, supported bycommunities, have been credited with revitalising eco-nomies in their communities.
Literature provides examples of various mechanisms,in which CC can induce endogenous economic devel-opment and growth (Boschma and Fritsch 2009; Batheltand others 2011; Florida 2002; McGranahan and Wojan2007). Most generally, CC is responsible for creating‘meaningful new forms’ that have economic value (Flor-ida 2002). These ‘meaningful new forms’ are innovationsthat deliver economic benefits. In the recent decades themajority of research was focused on technological innov-ations within regional innovation systems (for exampleFeldman 2000). This type of innovation often has a directconnection to economic growth through adoption of newtechnologies, and it is easily detectable. The impacts ofother forms of (local) innovation, such as civic, business,social, artistic innovations, are more difficult to trace.At the same time, as demonstrated in recent studies(Aarsæther 2004; Hall and Donald 2009; Petrov 2011)these innovations have special importance in peripheralareas where purely technological innovations may belimited. Local innovations in their variety of forms maydeliver a new path creation through scientific, institu-tional, economic and social shifts that allow for inventingor adopting new knowledge (Bassanini and Dosi 2001).The centrality of local innovation (broadly conceived) inregional reinvention in the periphery, in terms of breakingwith path–dependency has already been demonstratedin empirical studies (Aarsæther 2004; Jauhiainen andSuorsa 2008; Virkkala 2007).
Whereas the importance of the CC in regional de-velopment and endogenous growth is hard to dispute,the research into this subject largely ignores regionsoutside the core metropolitan areas. As argued by Petrov(2007, 2008, 2011), although the preoccupation withlarge urban regions reflects the concentration of the CCin metropolitan areas (Florida 2002; Gertler and others2002; Polèse and Tremblay 2005), it unjustly marginal-ises peripheries as study sites. Instead, it can be arguedthat the importance of the CC for economic developmentis also true in non–metropolitan contexts. Moreover, thereare indications (Copus and Skuras 2006; Petrov 2008;2011) that the CC is likely to play an important role inthe regional transformation of remote areas, including theArctic.
The importance of creative individuals in innovativeprocesses in remote areas was demonstrated in a num-ber of studies from different regions (Aarsæther 2004;Copus and Skuras 2006; Doloreux 2003; Jauhilinen andSuorsa 2008; Hayter and others 1994; Hall and Donald2009; Petrov 2008, 2011). Some of the above researchershave observed that less favorable business and socialenvironments amplify the importance of creativity andrequire individual innovators and firms to be more cre-ative than in the core. Looking at results of CC analysisin the Canadian north and other similar reports, Petrov(2008) argued that it is now sufficient evidence to suggestthat the availability of CC improves the prospects forfuture economic transformation and development in theperiphery.

4 PETROV AND CAVIN
Table 1. Description of the metrics
Measures Construct to be measured
CC metricsTalent Index (TI) is a location quotient (LQ) of the population over 16 years who
have a university degree.Level of formal education of the
labour force‘Bohemian’ Index (BI) is a location quotient of the employment in artistic and
creative occupations: ‘Art and Culture’ (Bureau of Labor Statistics, 27–0000arts, design, entertainment, sports, and media occupation).
CC: ‘Bohemia’
Leadership Index (LI) is a location quotient of people with leadership andmanagerial occupations (Bureau of Labor Statistics, 11–0000 managementoccupation).
CC: leadership
Entrepreneurship Index (EI) is a location quotient of people with businessoccupation (Bureau of Labor Statistics, 13–0000 business and financialoperations occupation).
CC: entrepreneurship
Applied Science Index (ASI) is a location quotient of people with appliedscience occupations (Bureau of Labor Statistics, 15–0000 and 17–0000).
CC: ‘applied scientists’
Measures of ‘quality of place’ (characteristics of attractiveness to the creative class)Mosaic Index (MI) is a location quotient of the total population that is
foreign–born.Society’s diversity
Visible Minority Ratio (VMR) is a location quotient of visible minorities in totalpopulation.
Society’s diversity
Women Leadership (feminist) Index (FI) is a location quotient of women inmanagerial (leadership) occupations: percent of female in 11–0000.
Society’s openness, ‘low barriersof entry’
Aboriginality Index (AI) is a LQ of people with aboriginal identity (by the censusdefinition) in total population.
Presence of aboriginal population
Resource–dependency Index (RDI) is a LQ of employment in the occupationsunique for the primary sector of natural resources (NAIC Sector 11 and 21).
A degree of resource–reliance
Measure of technology sector specialisationTech–Pole Index (TPI) is a LQ of the employment in the Bureau of Labor
Statistics in high technology sectors (NAICS, Sector 54–professional,scientific, and technical services)
Specialisation in technologysectors
Note: The formula for calculating a location quotient (LQ) is: LQi = λn
λC,
where LQi is a location quotient of phenomenon i (occupation, education, etc.), is the share of population havingthe measured characteristic i in region n and λC is the share of population having the same characteristic in thereference region (USA).
Petrov (2007, 2008) differentiates four types of cre-ative capital in the Arctic: technology workers (appliedscientists), ‘bohemia’ (artists, craftsmen, etc.), leaders(people with leadership and managerial occupations), andentrepreneurs (see all definitions in Table 1). All of thesegroups may contribute to transforming the region’s futureby participating in various types of civic, economic,political and cultural activities. From the positions ofeconomic development, each of these types of CC utilisesits creativity to produce innovations (in the widest read-ing of this term) that generate economic returns. Petrov(2011) provided examples of various innovations in theperiphery and their connections to CC and other kinds ofsocietal capital (social, civic, etc.) using case studies fromnorthern Ontario.
CC is only one ingredient of the regional economicand knowledge–production systems. Resources, insti-tutional settings and other structural factors within aregional economic system exert great influence on theprocesses of CC accumulation and utilisation. Previousresearch in metropolitan areas and initial findings inthe nonmetropolitan context (Aarsæther 2004; Petrov2011; Doloreux and Parto 2005; Jauhilinen and Suorsa2008) demonstrated the effects of institutional frame-
works, legal and organisational systems, as well as so-cial, civic and other forms of societal capital on CC’sstrength and dynamics. It is also important to considerthe interdependence between CC and the demographiccharacteristics of population, since CC is affected byoccupational, educational, employment, and consump-tion age and gender differentials and varying migrationpropensities. Lastly, given data availability, considerableattention should be paid to both internal and externallinks associated with CC and local innovation systemin general to account for spillovers, global ‘cables’ (or‘pipelines’) and other spatial forms of knowledge transferand exchange of ideas.
The idea of the CC as an alternative driving forceof economic development in the Arctic is also appeal-ing since it provides a way to reconcile the realitiesof capitalism (which Arctic is inevitably facing) andlocal modernities, which rely on arctic communities’endogenous capacities and often take their roots intraditional cultures. Due to the endogenous nature ofthe CC–based development and its lesser vulnerabilityto decoupling and marginalisation effects (typical forArctic economies) CC–driven development is an en-abling process that not only brings prosperity, but also

CREATIVE CAPITAL AND ECONOMIC DEVELOPMENT OPPORTUNITIES IN ALASKA 5
empowers communities to define their own economicdestiny.
Data and methods
Much of the CC literature is devoted to developing twosets of measures: one to quantify existing CC and anotherto measure its pull–factors (Florida 2002; Gertler andothers 2002). Accordingly, a set of indicators for thisstudy also consists of two groups (Table 1): measures ofthe CC and measures of the ‘quality of place’ (or of aplace’s attractiveness to the CC). We define traditionalindicators in both groups in the manner suggested byGertler and others (2002), with the exception that theindices are taken as location quotients (Petrov 2008,Table 1). We also use the Tech Pole Index (TPI) asa proxy of region’s specialisation in high technologysectors (Table 1). The TPI is calculated here as a locationquotient of the employment in North American industryclassification system high technology sectors.
Following Petrov (2007, 2008) we consider fourgroups of creative class: technology workers (appliedscientists), bohemia (artists, craftsmen, etc.), leaders andentrepreneurs. As argued elsewhere (Petrov 2007), thisfour sector representation of the creative class in the mostappropriate in the periphery since it accounts for differentmodes of creativity, which all are important for spurringeconomic development in remote regions. The four sectormodel is more inclusive of creative activities not boundedby formal education and involved in broadly definedcommunity innovations. Each group is characterised bya corresponding index (see Table 1): applied sciencesindex (ASI), ‘Bohemian’ index (BI), leadership index(LI), and entrepreneurship index (EI). As in other similarstudies, CC indices are primarily based on occupationalcharacteristics. The Alaskan data are collected by theAlaska Department of Labor using the unemploymentinsurance records. Although it is a very high qualitysource of information about occupational status of Alaskaresidents, it has some limitations, as it records onlyone occupation per person, defines occupations basedon a preset standard scheme, as well as omits thoseworkers who are not part of unemployment insurance(for example the self–employed). These limitations mustbe considered in the analysis as they may lead to theunderestimation of CC. When comparing with Canada(where we use 2006 census data), it may also mean thatthe Alaska indices may well be depressed.
In the following analysis, we first computed, testedand analysed the indices that characterise the creativeclass in Alaska’s 27 boroughs. The largest borough inAlaska is the municipality of Anchorage (260,000) fol-lowed by the Fairbanks North Star borough (93,000);the smallest borough is Yakutat (808). Most boroughsinclude more than one community and therefore couldbe further disaggregated. However, the quality and avail-ability of data at this spatial level declines (including thesmall numbers problem). As a result, we chose to keep
boroughs as the primary unit of analysis roughly compat-ible with Canadian census subdivision (for comparisonpurposes since similar studies in the Canadian northused subdivisions (Petrov 2008)). All data for the currentanalysis pertaining to population counts, occupations andemployment were obtained from the Alaska Departmentof Labor and Workforce Development databases.
All indices calculated for the Alaskan boroughs werecompared to those for the two control regions, the UnitedSates and three Canadian territorial centers (Whitehorse,Yellowknife and Iqaluit, which are also the leading cre-ative communities in the Canadian north (Petrov 2008)).Then we computed the indicators of attractiveness andstudied them in a similar manner. To analyse the relation-ships among indices, between and within the two groups,both correlation and principal components analyses wereperformed.
The first objective of this analysis was to comparethe behaviour of the creative capital metrics in Alaskato their expected behaviour as described in the literaturefor US and Canada (Florida 2005; Gertler and others2002), and, in addition, with the metrics behavior in theCanadian north (Petrov 2007, 2008). These comparis-ons are necessary to establish whether the relationshipsbetween CC, ‘quality of place’ characteristics, and devel-opment are present in Alaska. In other words we needto conclude whether CC metrics (which were originallydeveloped for other regions) provide valid and reliablemeasures in Alaska’s context. This analysis would alsoreveal any systematic differences between Alaska andnorthern Canada, and between Alaska and the rest of theUSA.
The next stage of the analysis was to utilise themetrics to describe the geography of the creative capitalin the state, identify its clusters (overall and for eachof the four components) as well as spatial variationof the region’s attractiveness. Alaska boroughs wereranked using both the creative capital and attractivenessmeasures. Two composite rankings were produced: oneby combining equally–weighted individual rankings ofthe creative class indices (TI, LI, EI, BI and ASI), andsecond by combining rankings of the ‘quality of place’indicators (MI, FI, VMR, RDI, and BI). We identifiedleading regions (‘creative hot spots’) and those laggingbehind. Finally, we conducted a cluster analysis (k–meansmethod) to detect the extent of typological heterogeneitywithin the dataset. At every stage we compared ourfindings with earlier observations published for northernCanadian territories (Petrov 2008) to compare and con-trast the two Arctic regions.
This study relied on the Alaska Department of Laborand Workforce Development database (Alaska Local andRegional Information – ALARI). All occupational andemployment data used in this study pertains to 2008. Weresorted to the most recent available census (2000) forother population statistics, including ethnic compositionand educational attainment, since the census of 2000provides the most exhaustive dataset. However, both
6 PETROV AND CAVIN
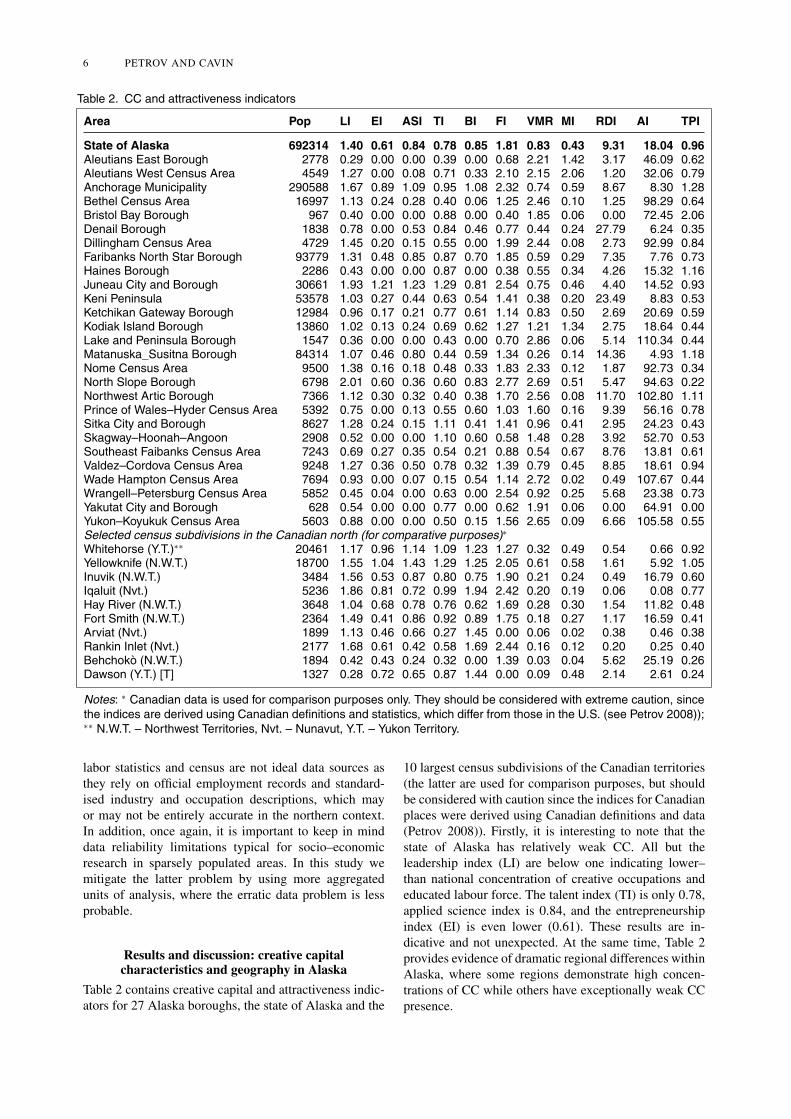
Table 2. CC and attractiveness indicators
Area Pop LI EI ASI TI BI FI VMR MI RDI AI TPI
State of Alaska 692314 1.40 0.61 0.84 0.78 0.85 1.81 0.83 0.43 9.31 18.04 0.96Aleutians East Borough 2778 0.29 0.00 0.00 0.39 0.00 0.68 2.21 1.42 3.17 46.09 0.62Aleutians West Census Area 4549 1.27 0.00 0.08 0.71 0.33 2.10 2.15 2.06 1.20 32.06 0.79Anchorage Municipality 290588 1.67 0.89 1.09 0.95 1.08 2.32 0.74 0.59 8.67 8.30 1.28Bethel Census Area 16997 1.13 0.24 0.28 0.40 0.06 1.25 2.46 0.10 1.25 98.29 0.64Bristol Bay Borough 967 0.40 0.00 0.00 0.88 0.00 0.40 1.85 0.06 0.00 72.45 2.06Denail Borough 1838 0.78 0.00 0.53 0.84 0.46 0.77 0.44 0.24 27.79 6.24 0.35Dillingham Census Area 4729 1.45 0.20 0.15 0.55 0.00 1.99 2.44 0.08 2.73 92.99 0.84Faribanks North Star Borough 93779 1.31 0.48 0.85 0.87 0.70 1.85 0.59 0.29 7.35 7.76 0.73Haines Borough 2286 0.43 0.00 0.00 0.87 0.00 0.38 0.55 0.34 4.26 15.32 1.16Juneau City and Borough 30661 1.93 1.21 1.23 1.29 0.81 2.54 0.75 0.46 4.40 14.52 0.93Keni Peninsula 53578 1.03 0.27 0.44 0.63 0.54 1.41 0.38 0.20 23.49 8.83 0.53Ketchikan Gateway Borough 12984 0.96 0.17 0.21 0.77 0.61 1.14 0.83 0.50 2.69 20.69 0.59Kodiak Island Borough 13860 1.02 0.13 0.24 0.69 0.62 1.27 1.21 1.34 2.75 18.64 0.44Lake and Peninsula Borough 1547 0.36 0.00 0.00 0.43 0.00 0.70 2.86 0.06 5.14 110.34 0.44Matanuska_Susitna Borough 84314 1.07 0.46 0.80 0.44 0.59 1.34 0.26 0.14 14.36 4.93 1.18Nome Census Area 9500 1.38 0.16 0.18 0.48 0.33 1.83 2.33 0.12 1.87 92.73 0.34North Slope Borough 6798 2.01 0.60 0.36 0.60 0.83 2.77 2.69 0.51 5.47 94.63 0.22Northwest Artic Borough 7366 1.12 0.30 0.32 0.40 0.38 1.70 2.56 0.08 11.70 102.80 1.11Prince of Wales–Hyder Census Area 5392 0.75 0.00 0.13 0.55 0.60 1.03 1.60 0.16 9.39 56.16 0.78Sitka City and Borough 8627 1.28 0.24 0.15 1.11 0.41 1.41 0.96 0.41 2.95 24.23 0.43Skagway–Hoonah–Angoon 2908 0.52 0.00 0.00 1.10 0.60 0.58 1.48 0.28 3.92 52.70 0.53Southeast Faibanks Census Area 7243 0.69 0.27 0.35 0.54 0.21 0.88 0.54 0.67 8.76 13.81 0.61Valdez–Cordova Census Area 9248 1.27 0.36 0.50 0.78 0.32 1.39 0.79 0.45 8.85 18.61 0.94Wade Hampton Census Area 7694 0.93 0.00 0.07 0.15 0.54 1.14 2.72 0.02 0.49 107.67 0.44Wrangell–Petersburg Census Area 5852 0.45 0.04 0.00 0.63 0.00 2.54 0.92 0.25 5.68 23.38 0.73Yakutat City and Borough 628 0.54 0.00 0.00 0.77 0.00 0.62 1.91 0.06 0.00 64.91 0.00Yukon–Koyukuk Census Area 5603 0.88 0.00 0.00 0.50 0.15 1.56 2.65 0.09 6.66 105.58 0.55Selected census subdivisions in the Canadian north (for comparative purposes)∗
Whitehorse (Y.T.)∗∗ 20461 1.17 0.96 1.14 1.09 1.23 1.27 0.32 0.49 0.54 0.66 0.92Yellowknife (N.W.T.) 18700 1.55 1.04 1.43 1.29 1.25 2.05 0.61 0.58 1.61 5.92 1.05Inuvik (N.W.T.) 3484 1.56 0.53 0.87 0.80 0.75 1.90 0.21 0.24 0.49 16.79 0.60Iqaluit (Nvt.) 5236 1.86 0.81 0.72 0.99 1.94 2.42 0.20 0.19 0.06 0.08 0.77Hay River (N.W.T.) 3648 1.04 0.68 0.78 0.76 0.62 1.69 0.28 0.30 1.54 11.82 0.48Fort Smith (N.W.T.) 2364 1.49 0.41 0.86 0.92 0.89 1.75 0.18 0.27 1.17 16.59 0.41Arviat (Nvt.) 1899 1.13 0.46 0.66 0.27 1.45 0.00 0.06 0.02 0.38 0.46 0.38Rankin Inlet (Nvt.) 2177 1.68 0.61 0.42 0.58 1.69 2.44 0.16 0.12 0.20 0.25 0.40Behchokò (N.W.T.) 1894 0.42 0.43 0.24 0.32 0.00 1.39 0.03 0.04 5.62 25.19 0.26Dawson (Y.T.) [T] 1327 0.28 0.72 0.65 0.87 1.44 0.00 0.09 0.48 2.14 2.61 0.24
Notes: ∗ Canadian data is used for comparison purposes only. They should be considered with extreme caution, sincethe indices are derived using Canadian definitions and statistics, which differ from those in the U.S. (see Petrov 2008));∗∗ N.W.T. – Northwest Territories, Nvt. – Nunavut, Y.T. – Yukon Territory.
labor statistics and census are not ideal data sources asthey rely on official employment records and standard-ised industry and occupation descriptions, which mayor may not be entirely accurate in the northern context.In addition, once again, it is important to keep in minddata reliability limitations typical for socio–economicresearch in sparsely populated areas. In this study wemitigate the latter problem by using more aggregatedunits of analysis, where the erratic data problem is lessprobable.
Results and discussion: creative capitalcharacteristics and geography in Alaska
Table 2 contains creative capital and attractiveness indic-ators for 27 Alaska boroughs, the state of Alaska and the
10 largest census subdivisions of the Canadian territories(the latter are used for comparison purposes, but shouldbe considered with caution since the indices for Canadianplaces were derived using Canadian definitions and data(Petrov 2008)). Firstly, it is interesting to note that thestate of Alaska has relatively weak CC. All but theleadership index (LI) are below one indicating lower–than national concentration of creative occupations andeducated labour force. The talent index (TI) is only 0.78,applied science index is 0.84, and the entrepreneurshipindex (EI) is even lower (0.61). These results are in-dicative and not unexpected. At the same time, Table 2provides evidence of dramatic regional differences withinAlaska, where some regions demonstrate high concen-trations of CC while others have exceptionally weak CCpresence.

CREATIVE CAPITAL AND ECONOMIC DEVELOPMENT OPPORTUNITIES IN ALASKA 7
Fig. 1. CC indices in Alaska’s regions
The talent index (TI) in Alaska exhibits a patterntypical for other northern jurisdictions (for example theCanadian territories). The TI approaches or exceeds 1.0(US average) in the capital (Juneau) and surroundingregions. Here, similarly to Whitehorse and Yellowknife inCanada (Table 2), we observe a concentration of residentswith high levels of formal education. Most, probably, arepublic employees. Fairbanks and Anchorage areas follow
the capital region with well educated populations. Incontrast, most rural regions in Alaska demonstrate a verylow talent index. In other words, very few people withbachelor degree or higher live in remote communities. In-terestingly, the North Slope Borough has a slightly higherTI than less northern boroughs in central Alaska, likelybecause of the influx of temporary migrants employed inextraction industries (Fig. 1).

8 PETROV AND CAVIN
Table 3. Correlation Matrix
TI TPI ASI BI LI EI MI VMR FI RDI AI
TI 1 .185 .375 .337 .215 .404∗ .107 –.550∗∗ .080 .006 –.565∗∗
TPI 1 .225 –.029 –.044 .203 –.048 –.206 –.040 –.030 –.165ASI 1 .701∗∗ .659∗∗ .897∗∗ –.012 –.528∗∗ .477∗ .394 –.502∗∗
BI 1 .647∗∗ .655∗∗ .107 –.345 .444∗ .274 –.359LI 1 .780∗∗ .083 –.016 .792∗∗ .026 –.043EI 1 –.003 –.321 .636∗∗ .110 –.306MI 1 –.059 .143 –.179 –.363VMR 1 .047 –.496∗∗ .945∗∗
FI 1 –.015 –.022RDI 1 –.405∗
AI 1
∗ Correlation is significant at the 0.05 level (2–tailed); ∗∗ Correlation is significant at the 0.01 level(2–tailed).See notations in text.
The Applied Science Index (ASI) reflects the relat-ive concentration of people with occupations in appliedscience and technology. The ASI is most closely relatedto the TI and the traditional understanding of the CCas associated with high–tech industries. Not surprisingly,the three boroughs with larger urban centres have highlevels of the ASI comparable to those in Yellowknife andWhitehorse. The outlying areas of Alaska demonstrateextremely low stock of people with science and techno-logy occupations.
The Bohemian Index (BI) has originally been con-sidered among the ‘quality of place’ indicators (Florida2005). However, in the context of the peripheries it isalso used to measure the ‘artistic capital’ as a separatecategory of CC, which has a special importance in north-ern regions given the prevalence of native arts and crafts(Petrov 2008). In Alaska high BI readings are registeredin two completely different types of regions: larger city–regions (Anchorage and Juneau) and the North Slope.This most likely reflects two distinct types of ‘bohemia’that co–exist in the state: the native American ‘bohemia’in the very north and urban ‘bohemia’ in the urbansouth (however, many northern/native American artistsand craftsmen also reside the south). This combinationcreates an intricate geography of Alaskan ‘bohemia’ andwarrants further in–depth analysis of this phenomenon.
The Leadership Index (LI) was developed to meas-ure the availability of leadership capital in northerncommunities (Petrov 2007, 2008). The role of politicaland civic leaders in economic development of Arcticcommunities can be considerable given their close in-volvement with local businesses and access to capital(for example in the form of government assistance pro-grammes). Typically, high LI is registered in capitaland central cities, but also in communities with strongself–governance. Alaska is not an exception: Juneau andAnchorage have the greatest LI. The LI is also veryhigh in the North Slope Borough, and 11 more regionshave LI higher than the USA average. At the same time,there are regions that clearly lack the leadership capital.
They include most boroughs in the Alaska panhandle, theAleutians, and the inland regions of Alaska.
The Entrepreneurship Index (EI) that measures rel-ative concentration of residents in entrepreneurial occu-pations, has distribution that closely follows larger citiesand the capital. Entrepreneurial capital is heavily presentin Anchorage and Juneau. This, as in the case with the TIand the ASI, reflects a pattern of CC overconcentration incentrally located hubs and lack of entrepreneurial capa-cities in the state’s periphery. There is a geographic dis-connection between the entrepreneurial and other formsof the CC (for example bohemian) associated with theseareas and its native population. This disconnection isobserved in other northern jurisdictions (Petrov 2008).
The Tech–Pole Index (TPI) demonstrates that veryfew Alaskan boroughs have a considerable concentra-tion of high–tech employment and specialisation intechnology–intensive industries. With the exception ofBristol Bay and northwest Alaska all of these regionsare concentrated in the southern and southeastern portionof the state around Anchorage and Juneau. Even there,the TPI values are not very high, but are comparablewith, or exceeding, those found in the Canadian territorialcapitals (Table 2). Similarly to northern Canada, thehigh–tech employment is a very limited, if not too narrow,indicator of knowledge production (although it is the onlyone available). It is certainly related to particular formsof creativity (that is applied science) and, therefore, isunable to characterise the value or volume of creativeactivities of a different nature (for example cultural). Inthis respect, the TPI should be considered in our analysiswith caution.
In accordance with the adopted methodology, cor-relation and concordance coefficients were used to as-sess the consistency (reliability and validity) of the CCmeasures and to analyse statistically the relationshipsamong them. Correlation coefficients illustrated closeassociations (Table 3) among different creative classindices that were a probably a sign of reliability ofthese measures. Reliability was also confirmed by the

CREATIVE CAPITAL AND ECONOMIC DEVELOPMENT OPPORTUNITIES IN ALASKA 9
high degree of concordance demonstrated by new indices(Kendall’s coefficient of concordance 0.66). In addition,theoretically expected correlation of the CC measureswith the well–established ones (used in previous studies,that is the BI and, to some extent, the TI) signaled thatnew indices possessed necessary validity (the lack ofsignificance in some of the correlations may be attributedto a rather small sample size (27), but even in thesecases correlations have expected signs). Both results arevery similar to those reported for the Canadian northerncommunities (Petrov 2008).
The evidence from the correlation matrix (Table 3)supports the notion introduced by Petrov (2008) that dif-ferent groups of the creative capital are clustered in space.ASI, BI, LI and EI are strongly correlated. Elsewhere wealready alluded to an idea of a synergy among four CCcomponents as key for deploying local creative capacitiesfor economic success. Four creative class groups attracteach other and reinforce a region’s innovative potential.Separated or disjoined, these components are much lesspowerful or even fruitless, because regional development(or a new path creation) may require simultaneous de-ployment of various modes of creativity and types ofinnovation (see Petrov 2011).
Overall, evidence suggests that the associationsamong indices closely resemble those in other northernregions and at the national level, thus indicating that thecreative capital ‘logic’ is applicable in the Alaska context.The coincidence of associations indicates that the majorrelationships are upheld, and the behaviour of the creativeclass metrics is very much alike those of the rest of thecountry.
A notable deviation from the national studies in theUSA and Canada and from the results in northern Canadais the absence of significant relationship between thespecialization in high technology industries (TPI) andany of the CC indices (including the TI). It is, indeed,surprising, since typically TPI is correlated with well–educated and abundant human capital. In Alaska high–tech activities appear to be unrelated to local educationalattainment or CC (although, as shown later, the TI andthe TPI still have considerable covariance). The concen-tration of high–tech employment is, perhaps, governedby other factors such as location of government agenciesand universities. It seems then that at the regional scalethe TPI as a measure of economic development maynot be useful in the Alaskan context. However, it maystill be useful at more disaggregated levels of analysis(something that should be tested in the future).
In terms of the ‘quality of place’ indicators (Table 3),Alaskan data reinforces observations from other northernregions (Petrov 2008) that traditional diversity indicators(the Mosaic Index and Visible Minority Ratio) fail tobe reliable predictors of CC in the Arctic. In additionto the fact that peripheries simply lack foreign–bornpopulations, most visible minority population here isrepresented by the native Americans and may not neces-sarily be an indicator of diversity in a way envisioned
Table 4. Creative capital metrics principalcomponents
Component
1 2
TI:LQ .370 .539EI:LQ .896 .295ASI:LQ .865 .322LI:LQ .883 –.066BI:LQ .855 .010TPI:LQ –.082 .910
Extraction method: principal componentanalysis.Rotation method: Varimax with Kaisernormalisation.
by the CC theory. In contrast, a robust performance ofthe FI (Women Leadership/Feminist Index) is expected:strong women leadership (which may be considereda good indicator of society’s openness and tolerance(Petrov 2007)) is associated with the strong CC (thisrelationship works all four types of CC). This is the samestrong connection reported in the Canadian north (Petrov2008).
Surprisingly, the Aboriginality Index specifically de-signed to consider the relationship between the concen-tration of native residence and CC did not prove tobe a viable indicator of a place’s attractiveness to thecreative class. In other words, in Alaska aboriginality isnot related to any particular type of creativity. This couldbe contrasted to northern Canada, where a link was foundbetween the ‘Bohemian’ index and aboriginality (Petrov2008). A possible explanation of this phenomenon isa relatively small share of native population in Alaskawhen compared to the Canadian territories and a moreaggregated scale of analysis (boroughs vs. census subdi-visions).
To understand better the interrelationships among CCindices and between them and the ‘quality of placeindicators’ we performed principal components analysis(PCA). PCA helps to identify covariance within thedataset and to find latent vectors. Whereas in this casethe number of variables is rather limited, PCA is stillan important tool for looking at variables’ covarianceand possible groupings. Table 4 reports PCA results forall CC indices and selected ‘quality of place indicators’,which demonstrated evidence of correlation with CCindices (Table 4).
From Table 4 it is clear that there are distinct prin-cipal components (with eigenvalues exceeding 1.0). Thefirst component is most closely associated with fouroccupation–based CC indices: LI, BI, EI and ASI allhave high factor loadings. This shows that CC indicesexhibit a considerable covariance, additional evidenceto the argument that CC tends to cluster and the syn-ergies among different groups of the CC are vital forits accumulation. However, some CC indices also haveconsiderable loadings on another component. Notably the

10 PETROV AND CAVIN
Table 5. CC/class ranking of Alaska regions
Rank Ranking 1: creative capital Ranking 2: creative class ‘pull–factors’
1 Juneau City and Borough North Slope Borough2 Anchorage Municipality Aleutians West Census Area3 Fairbanks North Star Borough Kodiak Island Borough4 North Slope Borough Juneau City and Borough5 Valdez–Cordova Census Area Anchorage Municipality6 Sitka City and Borough Ketchikan Gateway Borough7 Matanuska Susitna Borough Nome Census Area8 Kenai Peninsula Borough Sitka City and Borough9 Ketchikan Gateway Borough Wade Hampton Census Area10 Kodiak Island Borough Fairbanks North Star Borough11 Denial Borough Dillingham Census Area12 Northwest Arctic Borough Bethel Census Area13 Nome Census Area Aleutians East Borough14 Dillingham Census Area Skagway–Hoonah–Angoon Borough15 Southeast Fairbanks Census Area Yukon–Koyukuk Census Area16 Aleutians West Census Area Wrangell–Petersburg Census Area17 Bethel Census Area Northwest Arctic Borough18 Skagway–Hoonah–Angoon Borough Valdez–Cordova Census Area19 Prince of Wales–Hyder Census Area Prince of Wales–Hyder Census Area20 Wade Hampton Census Area Yakutat City and Borough21 Bristol Bay Borough Southeast Fairbanks Census Area22 Haines Borough Lake and Peninsula Borough23 Yakutat City and Borough Bristol Bay Borough24 Yukon–Koyukuk Census Area Kenai Peninsula Borough25 Wrangell–Petersburg Census Area Matanuska–Susitna Borough26 Lake and Peninsula Borough Haines Borough27 Aleutians East Borough Denial Borough
TI is not heavily loaded on component one, but ratherhas the highest factor loading on component two, whichalso has high loadings for the TPI and moderate loadingsfor ASI and EI. Component two, therefore, reflects the‘formally educated’ CC and demonstrates its connectionswith technology production (TPI) and two occupationalCC indices (that include occupations more dependent onformal education, such as applied science). Note that BIand LI have remarkably weak loadings on this compon-ent reflecting a disconnection between formal educationand these types of creativity (pointed out earlier in theCanadian north (Petrov 2008)).
Creative capital rankings and groupings of Alaskaregions
Since the CC metrics in Alaska exhibit expected relation-ships with traditional measures and correlations amongindicators appear to be consistent with the CC ‘logic,’it is possible to proceed with a preliminary analysis ofthe CC accumulation in the state. Table 5 contains tworankings of 27 boroughs. The cumulative ranking ofAlaska boroughs based on five equally weighted creativecapital indices (TI, ASI, BI, LI, and EI) is presented inTable 5 and Figure 2. Not surprisingly, the highest rankedregions in terms of the concentration of CC are mainlythe urban areas of Juneau, Anchorage and Fairbanks.This pattern strongly resembles the Canadian north wherethree territorial capitals and largest cities are also the top–ranked creative capital hubs. However, the fourth place
in Alaska is taken by the North Slope Borough, the mostnorthern of the state’s boroughs. A strong performanceof the North Slope points to the fact that remote areasmay have considerable concentrations of creativity. Herethe creative capital is not only related to the presenceof educated workers in extraction industries, but to localaboriginal creativity and leadership resulting in high BIand LI. It also reveals an intriguing pattern when physicalremoteness may be a positive factor for the creative class,because it stimulates local leadership and entrepreneur-ship and the rise of ‘domestic’ creative class, includingaboriginal (note that CC ranking for many central andnorthern Alaska rural boroughs is higher than in moresoutherly located rural regions (Figure 2)).
The second group of boroughs (5–10th place) in-cluded primarily southern Alaska around Anchorage(Valdez–Cordova, Matanuska–Susitna, and Kenai) andon the panhandle (Sitka and Ketchikan Gateway). Theseregions have limited CC, but still are in the top 10statewide. The rest of Alaskan boroughs have relativelylittle CC.
The ‘pull factor’ or attractiveness ranking (Table 5) iscomputed by combining individual pull–factor rankings(MI, FI, VMR, RDI, and BI which, again, were givenequal weights). Seven out of ten boroughs with thehighest CC ranks also earned high ranks in terms ofattractiveness (or ‘quality of place’). In other words, astrong CC coincides with top levels of attractiveness. Theonly surprise was the high ranking of Kodiak Island andAleutian West. These results reiterate the unevenness in

CREATIVE CAPITAL AND ECONOMIC DEVELOPMENT OPPORTUNITIES IN ALASKA 11
Table 6. CC characteristics of typological groups (clusters)
Creative core Native creative ‘hot spot’ Mid–tier regions Lagging regions
TI:LQ 1.12 .60 .63 .66EI:LQ 1.05 .60 .21 .031ASI:LQ 1.16 .36 .34 .048LI:LQ 1.80 2.00 1.14 .53BI:LQ .95 .83 .42 .16
the distribution of the pull–factors in Alaska. However,they also point to several regions, which could potentiallybe sustainable clusters of CC.
Both rankings (Table 5) illustrate an uneven geo-graphy of the CC in Alaska. Although supporting thegeneral finding, which pointed to higher–than–expectedlevels of the CC accumulation and availability of pull–factors in the state, the analysis shows that only fewboroughs are CC hubs. Many of the leading places (albeitnot all) are economically or politically privileged regions.These and other typological differences in the sample arealso intuitively evident. For example, both creativity andattractiveness indicators reveal the advantage of largercommunities. The state’s largest cities are more diverseand economically vibrant places, almost like miniatureversions of Richard Florida’s creative cities. They dwellon their thriving public sector that creates high–skilledwell–paid jobs and a dynamic social environment, bothbeing attractive to the creative class. Some regions with ahigh proportion of aboriginal population usually exhibitgood standing on the ‘Bohemian’ Index (that effectively
measures the cultural economy potential), but performrather poorly in terms of technical occupations and theformal educational level of population.
In order to further investigate the geography of theCC in Alaska, and, in particular, identify typologicaldifferences among Alaska regions, we performed clusteranalysis. A two step cluster analysis procedure included,firstly, agglomerative (hierarchical) clustering (to determ-ine the number of cluster centres), and, secondly, k–means clustering. Hierarchical clustering showed thatboroughs form four distinct groups, and, therefore, fourclusters were sought in the k–means analysis.
Table 6 presents the aggregate CC characteristicsof identified region–groupings. The first group includesboroughs that have exceptionally high CC accumulation:CC indices either at par or that exceed US baseline(1.0). Not surprisingly, the group consists of two regions:Juneau and Anchorage. They represent the creative coreof Alaska (note that this again illustrates an earlierobservation that different groups of the CC tend tocluster together). The second group incorporates only
Fig. 2. CC ranking of Alaska regions
12 PETROV AND CAVIN
one region, the North Slope Borough. Not very highlevels of formal educational attainment and occupationin science coincide here with very high leadership capitaland considerable bohemian and entrepreneurial capital.It appears that the North Slope Borough represents anunexpected combination of CC characteristics, and is a‘creative hot spot’ in Alaska. Partially, this can be attrib-uted to the creative potential of local native Americans.Similar high positioning of native communities in termsof creative capital has been previously observed in theCanadian north (Petrov 2008). The third cluster com-prises 14 regions with modest CC. These are boroughsthat still have considerable leadership capital, but lackentrepreneurial and other types of CC. The last grouprepresents ten regions lagging behind in virtually allcreative class indicators. These are the outsiders, wherethe potential for economic development based on internalcreative capacities is minimal.
Conclusions
A study of the CC in the Arctic is an important stepin identifying alternative economic development optionsin the circumpolar region. These new approaches util-ise endogenous resources and local capacities of Arcticcommunities in order to reconcile capitalism and localmodernities of the Arctic. Whereas a stylised notionis that human capital in the Arctic is underdeveloped,this representation no longer reflects the variability anddiversity of arctic regions, some of which, as shownby the recent research (for example Aarsæther 2004;Copus and Skuras 2006; Petrov 2007, 2008), demonstratesubstantial levels of CC accumulation. On the other hand,there is a strong theoretical argument that CC is criticalfor economic development and socio–economic trans-formation in the periphery as it often becomes the engineof economic reinvention and revitalisation of a region.Therefore the structure, characteristics and geography ofthe CC in the Arctic are becoming the subjects for athorough investigation. This paper presented an analysisof CC in Alaska.
The results of this analysis demonstrate both a con-siderable potential and substantial shortage of the CC inAlaska alongside with a strong regional differentiation.The results also are mostly similar to patterns of CCin other northern jurisdictions, for example in northernCanada. CC in Alaska exhibits the tendency to cluster,and coincident concentration of different CC types isclearly advantageous for Alaskan regions. At the sametime, the main problem in many areas is the discon-nection between creativity, education and entrepreneurialcapital, a pattern reported elsewhere in the north. Thelatter makes it more difficult for Alaskan communities to‘deploy’ their creative capacities and start realising theirCC (for example build a viable cultural economic base).
Overall, this study found the higher–than–expectedlevels of the CC accumulation and availability of pull–factors in Alaska (although still quite low compared to
the continental US creative hubs). However, the analysisshows that only few regions are CC hot spots. Many of theleading places (albeit not all) are economically or polit-ically privileged boroughs, which encompass the state’scapital and its largest cities (Anchorage and Fairbanks).These hot spots are, perhaps, nationally competitive interms of attracting the CC. They are places where thecreative potential is high, and where the community’sefforts to embrace new economic trajectory would be themost fruitful.
In addition, the analysis found that some CC groupsconcentrate in regions outside the state’s core. For ex-ample, the North Slope has considerable concentration ofthe aboriginal ‘bohemia’ – artists, craftsmen, performers,etc. As a result this very remote region ranks high onCC and attractiveness indicators. It appears that ignoringthis endogenous development potential (in contrast or inaddition to the massive resource–based development inthe region) is no longer acceptable.
Coming back to the conceptual discussion in theoutset of this paper, it is important to point out that ourfindings, while being in line with the overall ‘creativecapital theory’, counter some stylised representationsand illuminate peculiar role, structure and geography ofthe CC in remote, peripheral areas. Peripheral regionsdemonstrate the associations among CC indices closelyresembling national patterns (thus indicating that theCC ‘logic’ is applicable in the peripheral context). Thecoincidence of statistical associations indicates that themajor relationships are upheld, and the behaviour ofthe creative class metrics is very much alike that inthe rest of the country. At the same time, there areimportant differences, which emphasise the unique placeof peripheral areas in the CC theory. Below we alludeto major emerging theoretical themes in CC researchin rural and remote areas, to which this paper providesempirical substance.
Clustering and synergy of CC in the periphery: cor-relation coefficients illustrate close associations (Table 3)among different creative class indices that were a likelysign of reliability of these measures. Different groupsof the CC are clustered in space. ASI, BI, LI and EIare strongly correlated. Different types of CC attracteach other and reinforce region’s innovative potential.Separated or disjoined, these components are much lesspowerful. Although this study does not provide directevidence of that, it is likely that a local synergy betweenCC and social capital (contrary to the metropolitan no-tion of the ‘weakness of strong ties’) is an importantcomponent of economic success. In addition, a strongCC coincides with top levels of attractiveness. The ideahere is that ‘creative synergy’ is a critical condition forutilizing local creative capacities.
Peripheral disconnection: geographic disconnectionbetween the entrepreneurial and other forms of the cre-ative capital.
Uneven geography and differentiation: we reveal avery uneven geography of the CC in Alaska with strong

CREATIVE CAPITAL AND ECONOMIC DEVELOPMENT OPPORTUNITIES IN ALASKA 13
concentrations. Based on empirical evidence we alsodevelop regional typology of Alaska borough, generallysimilar to the Canadian north. It is characterised by thedominance of economically privileged, larger communit-ies. As in Canada we find native ‘creative hubs.’
Possible ‘positive impacts of remoteness’ on CC ac-cumulation (for example Copus and Skuras 2006; Petrov2008): remote areas (for example the North Slope Bor-ough) may have higher concentration of CC than lessnorthern boroughs. This phenomenon while primarilycaused by the influx of temporary migrants employedin extraction industries, may also indicate a higher levelof creative potential, independence and self–reliance ofremote areas compared to less remote peripheries. Re-mote settings may also be more attractive to creativeindividuals and provide better conditions for retaininglocal creativity (such as indigenous cultural economies).
Bifurcation of ‘Bohemia’: BI is high in larger city–regions (Anchorage and Juneau) and the North Slope,which reflects two distinct types of ‘Bohemia’ that co–exist in the state: the native and the urban. These twogroups have dissimilar characteristics and require differ-ent conceptual and analytical approaches to their study.
Irrelevance of traditional diversity indicators of qual-ity of place for CC accumulation in the Arctic has beenshown in earlier studies (Petrov 2007, 2008). Instead theWomen Leadership Index once again appears to be amore apt indicator of ‘openness’ and ‘low barriers ofentry’ in a northern society.
Lastly, we share the sentiment expressed by others(Aarsæther 2004) that innovation in the periphery mayrequire more creative effort, originality and ingenuity toovercome barriers and capacity shortages than in centralareas. We can also argue (although evidence is still moreanecdotal than systematic) that innovation (and evenindividual acts of innovation) in the periphery can havestronger impact on community’s/region’s economic path,and can be more pivotal for a ‘new path creation’ for agiven remote locale.
Analysis presented in this paper warrants a moreexhaustive study at a community (rather than regional)level and, if possible, using more detailed occupationaldata. There is more to learn regarding the role of distanceand proximity, regarding the importance of pull andpush–factors (such as harsh environment, housing prob-lems and isolation) for CC accumulation. Future researchshould also consider possible negative externalities ofcreative economies, such as economic inequality, housingaffordability, environmental impacts, over–consumption,and political infighting.
Acknowledgements
We are grateful to our colleagues at the Arctic Socialand Environmental Systems Research Laboratory and theanonymous reviewers for their valuable comments, whichhelped to improve this paper. This research is supportedby NSF grant ARC Number 0909403.
ReferencesAarsæther, N. (editor). 2004. Innovations in the Nordic Periphery.
Stockholm: Nordregio.Agranat, G. A. 1992. Vozmozhnisti i Real’nosti Osvoeniya Sev-
era: Global’nye uroki [Possibilities and realities of develop-ment of the north: global lessons]. Moscow: VNIITI.
Alaska Division of Economic Development. 2012. Regional eco-nomic development strategies. URL: http://www.commerce.state.ak.us/ded/dev/oedp/EDSReview.htm (accessed 3 May2012)
Barnes, T.J., and R. Hayter. 1992. The little town that could:flexible accumulation and community change in Chamainus,British Columbia. Regional Studies 26: 647–663.
Bassanini, A. P., and G. Dosi. 2001. When and how chanceand human can twist the arms of Clio. In: Garud, R., andP. Karnoe (editors). Path Creation and Path Dependency.Mahwah, NY: Lawrence Erlbaum: 41–68.
Bathelt, H., and J. Glückler. 2003. Toward a relational economicgeography. Journal of Economic Geography 3(2): 117–144.
Bathelt, H., and J. Boggs. 2005. Continuities, ruptures, and re–building of regional development path: Leipzig’s metamorph-osis. In: Fuchs, G., and P. Shapira (editors). Rethinkingregional innovation and change. Path dependency or regionalbreakthrough? New York: Springer.
Bathelt, H., M.P. Feldman, and D.F. Kogler. 2011. Beyond territ-ory: dynamic geographies of knowledge creation, diffusion,and innovation. New York: Routledge.
Bone, R.M. 2009. The geography of the Canadian north: issuesand challenges. 2nd ed. Toronto: Oxford University Press.
Boschma, R.A., and M. Fritsch. 2009. Creative class and regionalgrowth: empirical evidence from seven European countries.Economic Geography 85 (4): 391–423.
Clark, P., P. Tracey, and H. Lawton Smith. 2001. Agents, endow-ments, and path–dependence: a model of multi–jurisdictionalregional development. Geographische Zeitschrift 89: 166–181.
Copus, A., and D. Skuras. 2006. Accessibility, innovative milleuxand the innovative activity of businesses in the EU peripheraland lagging areas. In: Vaz, T.N., E.J. Morgan, and P. Nijkamp(editors). The new European rurality: strategies for smallfirms. Aldershot: Ashgate.
Desrochers, P. 2001. Local diversity, human creativity, and tech-nological innovation. Growth and Change 32: 369–394.
DiFrancesco, R.J. 2000. A diamond in the rough? An examinationof the issues surrounding the development of the NorthwestTerritories. The Canadian Geographer 44(2): 114–135.
Doloreux, D. 2003. Regional innovation systems in the periphery:the case of the Beauce in Quebec (Canada). InternationalJournal of Innovation Management 7(1): 67–94.
Doloreux, D., and S. Parto. 2005. Regional innovation systems:current discourse and unresolved issues. Technology in So-ciety 27(2): 133–153.
Feldman, M.P. 2000. Location and innovation: the new economicgeography of innovation, spillovers and agglomeration. In:Clark, G., M. Feldman, M. Gertler, and K. Williams. (editors).The Oxford handbook of economic geography. Oxford: Ox-ford University Press: 351–370.
Florida, R. 2002. The economic geography of talent. Annals ofthe Association of American Geographers 94(2): 743–755.
Florida, R. 2005. Cities and the creative class. New York: Rout-ledge.
Gertler, M.S. 2005. Tacit knowledge, path dependency andlocal trajectories of growth. In: Fuchs, G., and P. Shapira(editors). Rethinking regional innovation and change. Pathdependency or regional breakthrough? New York: Springer:22–41.

14 PETROV AND CAVIN
Gertler, M.S., R. Florida, G. Gates, and T. Vinodrai. 2002.Competing on creativity: placing Ontario’s cities in the NorthAmerican context. Toronto: Institute of Competitiveness andProsperity and the Ontario Ministry of Enterprise, Opportun-ity and Innovation.
Gibson–Graham, J.K. 2005. Surplus possibilities: postdevelop-ment and community economies. Singapore Journal of Trop-ical Geography 26(1): 4–26.
Glaeser, E. 2004. Review of Richard Florida’s The rise ofthe creative class. Regional Science and Urban Eco-nomics 53(5): 593–596 URL: http://www.creativeclass.com/rfcgdb/articles/GlaeserReview.pdf (accessed 3 May 2012).
Glassman, J. 2011. Critical geography iii: critical developmentgeography. Progress in Human Geography 35(5): 705–711.
Goldsmith, O.S. 2008. Structural analysis of the Alaska eco-nomy: what are the drivers? Anchorage, Alaska: Universityof Alaska Anchorage, Institute of Social and Economic Re-search.
Grabher, G. 1993. The weakness of strong ties: the lock–inof regional development in the Ruhr Area. In: Grabher, G.(editor). The embedded firm: on the socio–economics ofindustrial networks. London: Routledge: 255–277.
Hall, H., and B. Donald. 2009. Innovation and creativity on theperiphery: challenges and opportunities in northern Ontario.Toronto: Martin Prosperity Institute (Ontario in the CreativeAge Working Paper Series).
Hayter, R., T. Barnes, and E. Grass. 1994. Single industrytowns and local development: three coastal British Columbiaforest product communities. Thunder Bay, ON: LakeheadUniversity, Centre for Northern Studies (Research report 34).
Hayter, R., T.J. Barnes, and M.J. Bradshaw. 2003. Relocatingresource peripheries in the core of economic geography’stheorizing: rationale and agenda. Area 35(1): 15–23.
Huskey, L. 2005. Challenges to economic development: dimen-sions of ‘remoteness’ in the north. Polar Geography 29(2):119.
Huskey, L. 2006. Limits to growth: remote regions, remote insti-tutions. The Annals of Regional Science 40(1): 147–155.
Innis, H. 1956. The fur trade in Canada: an introduction toCanadian economic history. Toronto: University of TorontoPress.
Jauhiainen, J.S., and K. Suorsaa. 2008. Triple helix in the peri-phery: the case of Multipolis in northern Finland. CambridgeJournal of Regions, Economy and Society 1(2): 285–301.
Lagendijk, A., and A. Lorentzen. 2007. Proximity, knowledge andinnovation in peripheral regions. On the intersection betweengeographical and organizational proximity. European Plan-ning Studies 15(4): 457–466.
Lundvall, B.A. (editor). 1992. National systems of innovation:towards a theory of innovation and interactive learning. Lon-don: Pinter.
Markusen, A. 2006. Urban development and the politics of acreative class: evidence from a study of artists. Environmentand Planning 38(10): 1921–1940.
McGranahan, D., and T. Wojan. 2007. Recasting the creat-ive class to examine growth processes in rural and urbancounties. Regional Studies 41(2): 197–216.
O’Hagan, S., and B. Cecil. 2007. A macro level approach toexamine Canada’s primary industry towns in a knowledgeeconomy. Journal of Rural and Community Development 2:18–43.
Peck, J. 2005. Struggling with the creative class. InternationalJournal of Urban and Rural Research 29(4): 740–770.
Petrov, A. 2007. A look beyond metropolis: exploring creativeclass in the Canadian periphery. Canadian Journal of Re-gional Science 30(3): 359–386.
Petrov, A. 2008. A talent in the cold? Creative class and the futureof the Canadian north. Arctic 61(2): 162–176.
Petrov, A. 2010. Post-staple bust: modeling economic effects ofmine closures and post-mine demographic shifts in an arcticeconomy (Yukon). Polar Geography 33: 39–61.
Petrov, A. 2011. Beyond spillovers: interrogating innovation andcreativity in the peripheries. In: Bathelt, H., M. Feldman, andD.F. Kogler (editors). Beyond territory: dynamic geographiesof innovation and knowledge creation. New York: Routledge:168–190.
Petrov, A. 2012. Redrawing the margin: re–examining regionalmultichotomies and conditions of marginality in Canada,Russia and their northern frontiers. Regional Studies 46(2):59–81.
Polèse, M., and R. Tremblay. 2005. L’économie du savoir etla manie des `rankings`: une analyse intégrée des villescanadiennes et américaines. Le géographe canadien 49(2):198–213.
Polèse, M., R. Shearmur, P.M. Desjardins, and M. Johnson.2002. The periphery in the knowledge economy: the spatialdynamics of the Canadian economy and the future of non–metropolitan regions in Quebec and the Atlantic provinces.Montreal: INRS – Urbanisation, Culture et Societe.
Power, M. 2003. Rethinking development geographies. London:Routledge.
Pravitel’stvo, R.F., 2000. O kontseptsii gosudarstvennoi pod-derzhki ekonomicheskogo I sotsiali’nogo razvitiya raionovSevera [About the conception of government supply of eco-nomic and social development of northern regions]. Resolu-tion 197(7).
Radcliffe, S.A. 2005. Development and geography: towards apostcolonial development geography? Progress in HumanGeography 29(3): 291–298.
Rea, K.J. 1968. The political economy of the Canadian north.Toronto: University of Toronto Press.
Rea, K.J. 1976. The political economy of northern development.Ottawa: Science Council of Canada Background Study.
Schienstock, G. 2007. From path dependency to path creation:Finland on its way to the knowledge–based economy. CurrentSociology 55(1): 92–109.
Scott, A.J. 2006. Creative cities: conceptual issues and policyquestions. Journal of Urban Affairs 28(1): 1–17.
Shearmur, R. 2007. The new knowledge aristocracy: a fewthoughts on the creative class, mobility and urban growth.Work, Organization, Labour and Globalization 1(1): 31–47.
Stohr, W.B. 2000. Local initiatives in peripheral areas: an inter-cultural comparison between two case studies in Brazil andAustria. In: Lithwick, H., and Y. Gradus (editors). Developingfrontier cities. Global perspective – regional contexts. Boston,MA: Kulwer Academic Publishers: 233–254.
Suorsa, K. 2009. Innovation systems and innovation policy in aperiphery. Nordia Geographic Publications 38(4) PAGES?.
Virkkala, S. 2007. Innovation and networking in peripheralareas – a case study of emergence and change in ruralmanufacturing. European Planning Studies 15(4): 511–529.