CREATING VALUE BY MAKING THE
102
CREATING VALUE BY MAKING THE CIRCULAR ECONOMY A REALITY LASSILA & TIKANOJA PLC Financial review 2018
Transcript of CREATING VALUE BY MAKING THE

CREATING VALUE BY MAKING THE CIRCULAR ECONOMY A REALITYLASSILA & TIKANOJA PLC
Financial review 2018

CONTENTS
CORPORATE GOVERNANCE Corporate Governance Statement 2018 ........................................................................................... 3
Remuneration Statement ........................................................................................................................ 13
REPORT BY THE BOARD OF DIRECTORS
KEY FIGURES Consolidated key figures......................................................................................................................... 28
Calculation of the key figures ................................................................................................................31
FINANCIAL STATEMENTS Consolidated income statement ....................................................................................................... 32
Consolidated statement of comprehensive income .............................................................. 32
Consolidated statement of financial position ............................................................................ 32
Consolidated statement of cash flows .......................................................................................... 33
Consolidated statement of changes in equity ........................................................................... 35
Notes to the consolidated financial statements ...................................................................... 36
Income statement of the parent company................................................................................... 84
Balance sheet of the parent company ............................................................................................ 85
Cash flow statement of the parent company ..............................................................................87
Notes to the financial statements of the parent company ................................................ 88
Proposal for the distribution of assets ............................................................................................97
The Auditor’s Note ........................................................................................................................................97
Auditor’s report ............................................................................................................................................. 98
LASSILA & TIKANOJA / FINANCIAL REVIEW 2018
2

CORPORATE GOVERNANCE STATEMENT 2018
IntroductionLassila & Tikanoja plc (“L&T” or “the company”)
is a public limited liability company that is regis-
tered in Finland and listed on Nasdaq Helsinki
Ltd. In its decision-making and administration,
Lassila & Tikanoja complies with the Finnish
Companies Act, other regulations governing
listed companies, Articles of Association of
Lassila & Tikanoja plc, charters of L&T’s Board
of Directors and its committees and the rules
and guidelines of Nasdaq Helsinki Ltd.
Corporate Governance Statement 2018L&T complies with the Finnish Corporate
Governance Code approved by the Securities
Market Association valid at any given time. This
statement was prepared in accordance with
the Finnish Corporate Governance Code that
entered into force on 1 January 2016 (“Corpo-
rate Governance Code”). The company has also
published a separate Remuneration Statement
in accordance with the Corporate Governance
Code. The full Corporate Governance Code is
available at www.cgfinland.fi. L&T has not devi-
ated from the recommendations of the Code.
This separate statement has been published
in connection with the Report of the Board of
Directors. This statement has been reviewed by
the Audit Committee of L&T’s Board of Directors
and approved by the Board. The company’s
auditor has verified that the statement has
been issued and that the descriptions of the
main features of the internal control and risk
management systems relating to the financial
reporting process included in the statement
are consistent with the descriptions included in
the financial statements.
Descriptions concerning corporate governanceGeneral Meeting of Shareholders
The Annual General Meeting is the supreme
decision-making body of L&T. The Annual Gen-
eral Meeting decides on the matters stipulated
in the Companies Act, such as the acceptance
of the financial statements and proposed
dividend, the release from liability of members
of the Board of Directors and the President and
CEO, the election of the members of the Board
of Directors and the auditors, and the compen-
sation paid to them. The Annual General Meet-
ing is held by the end of April as determined by
the Board of Directors.
Each share of Lassila & Tikanoja plc entitles
the holder to one vote. According to the Articles
of Association, at a General Meeting no share-
holder may cast more than one fifth of the total
number of votes represented at the meeting.
The notice to the meeting and other Annual
General Meeting documents, including the
Board of Directors’ proposals to the Annual
General Meeting are disclosed to the share-
holders at the latest three weeks before the
meeting at the company’s head office and
website on https://www.lt.fi/en/investors/
corporate-governance/general-meeting. The
notice to the meeting is also disclosed in a
stock exchange release.
The members of the Board of Directors,
President and CEO, principal auditor and pro-
spective directors attend the General Meeting,
unless there are well-founded reasons for their
absence.
The minutes of the General Meeting will be
available on the company’s website within two
weeks of the General Meeting. The resolutions
by the General Meeting will be published in a
stock exchange release immediately after the
meeting.
Governance structure
General Meeting
President and CEO
Group Executive Board
Board of DirectorsPersonnel Committee
Audit Committee
Applicable legislation andother regulation
Group internal regulations and guidelines
Internal controlInternal audit
Risk managementAuditing
3
LASSILA & TIKANOJA / FINANCIAL REVIEW 2018
CORPORATE GOVERNANCE / REPORT BY THE BOARD OF DIRECTORS / KEY FIGURES / FINANCIAL STATEMENTS
Board of Directors Composition and election of the Board
of Directors
In accordance with the Articles of Association,
the Board of Directors of Lassila & Tikanoja plc
comprises a minimum of three members and a
maximum of seven. The members of the Board
of Directors are elected by the General Meeting.
The practice applied in the preparation of the
proposal concerning the composition of the
Board of Directors is to have major sharehold-
ers prepare proposals concerning the Board,
including a proposal for the number of Board
members, their remuneration and, if necessary,
Board members to the General Meeting. The
term of each member of the Board of Directors
expires at the end of the next Annual General
Meeting of Shareholders following his/her elec-
tion. A person who has attained the age of 70
cannot be elected to the Board of Directors. The
Board elects a Chairman and a Vice Chairman
from among its members.
Board members
The following six members were elected to
the Board of Directors by the Annual General
Meeting of 2018:
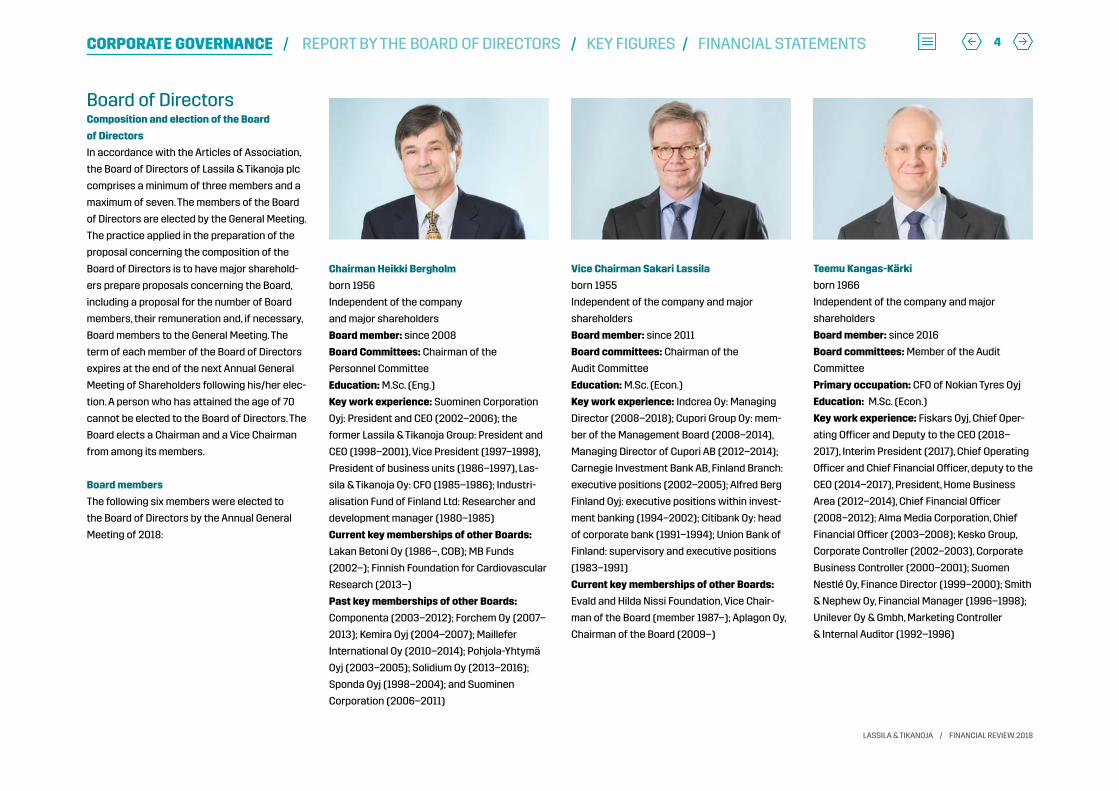
Chairman Heikki Bergholm
born 1956
Independent of the company
and major shareholders
Board member: since 2008
Board Committees: Chairman of the
Personnel Committee
Education: M.Sc. (Eng.)
Key work experience: Suominen Corporation
Oyj: President and CEO (2002–2006); the
former Lassila & Tikanoja Group: President and
CEO (1998–2001), Vice President (1997–1998),
President of business units (1986–1997), Las-
sila & Tikanoja Oy: CFO (1985–1986); Industri-
alisation Fund of Finland Ltd: Researcher and
development manager (1980–1985)
Current key memberships of other Boards:
Lakan Betoni Oy (1986–, COB); MB Funds
(2002–); Finnish Foundation for Cardiovascular
Research (2013–)
Past key memberships of other Boards:
Componenta (2003–2012); Forchem Oy (2007–
2013); Kemira Oyj (2004–2007); Maillefer
International Oy (2010–2014); Pohjola-Yhtymä
Oyj (2003–2005); Solidium Oy (2013–2016);
Sponda Oyj (1998–2004); and Suominen
Corporation (2006–2011)
Vice Chairman Sakari Lassila
born 1955
Independent of the company and major
shareholders
Board member: since 2011
Board committees: Chairman of the
Audit Committee
Education: M.Sc. (Econ.)
Key work experience: Indcrea Oy: Managing
Director (2008–2018); Cupori Group Oy: mem-
ber of the Management Board (2008–2014),
Managing Director of Cupori AB (2012–2014);
Carnegie Investment Bank AB, Finland Branch:
executive positions (2002–2005); Alfred Berg
Finland Oyj: executive positions within invest-
ment banking (1994–2002); Citibank Oy: head
of corporate bank (1991–1994); Union Bank of
Finland: supervisory and executive positions
(1983–1991)
Current key memberships of other Boards:
Evald and Hilda Nissi Foundation, Vice Chair-
man of the Board (member 1987–); Aplagon Oy,
Chairman of the Board (2009–)
Teemu Kangas-Kärki
born 1966
Independent of the company and major
shareholders
Board member: since 2016
Board committees: Member of the Audit
Committee
Primary occupation: CFO of Nokian Tyres Oyj
Education: M.Sc. (Econ.)
Key work experience: Fiskars Oyj, Chief Oper-
ating Officer and Deputy to the CEO (2018–
2017), Interim President (2017), Chief Operating
Officer and Chief Financial Officer, deputy to the
CEO (2014–2017), President, Home Business
Area (2012–2014), Chief Financial Officer
(2008–2012); Alma Media Corporation, Chief
Financial Officer (2003–2008); Kesko Group,
Corporate Controller (2002–2003), Corporate
Business Controller (2000–2001); Suomen
Nestlé Oy, Finance Director (1999–2000); Smith
& Nephew Oy, Financial Manager (1996–1998);
Unilever Oy & Gmbh, Marketing Controller
& Internal Auditor (1992–1996)
4
LASSILA & TIKANOJA / FINANCIAL REVIEW 2018
CORPORATE GOVERNANCE / REPORT BY THE BOARD OF DIRECTORS / KEY FIGURES / FINANCIAL STATEMENTS

Laura Lares
born 1966
Independent of the company and major
shareholders
Board member: since 2014
Board Committees: Member of the
Personnel Committee
Primary occupation: Managing Director
of Ablers Oy
Education: Ph.D. (Tech.)
Key work experience: Woimistamo Oy:
Managing Director (2012–2018); Kalevala
Koru Oy & Lapponia Jewelry Oy: Managing
Director (2007–2012); UPM Kymmene
Corporation: Director of Wood Products
Division, Director of Business Develop-
ment & Human Resources (2004–2006).
Current key memberships of other
Boards:
Ablers Oy (2018–)
Past key memberships of other Boards:
Lappeenranta University of Technology
(2009–2017); Woikoski Oy (2012–2016)
Miikka Maijala
born 1967
Independent of the company and major
shareholders
Board member: since 2010
Board Committees: Member of the
Personnel Committee
Primary occupation: CEO of Clinius Ltd
Education: M.Sc. (Eng.)
Key work experience: GE Healthcare
Finland Oy: Business Segment Manager
2004–2006); Instrumentarium Cor-
poration (now GE Healthcare Finland
Oy): Director, Business Development
(2000–2004); Instrumentarium Corpora-
tion: supervisory and executive positions
within sales, marketing and financial
management (1992–2000)
Current key memberships of other
Boards:
Healthtech Finland (2008–)
Laura Tarkka
born 1970, M.Sc. (Eng.), CEFA
Independent of the company and major
shareholders
Board member: since 2017
Board committees: Member of the Audit
Committee
Primary occupation: CEO of Kämp Group/
Kämp Collection Hotels
Education: M.Sc. (Eng.)
Key work experience: Diacor Terveys-
palvelut Oy: CFO and deputy CEO
(2013–2014); Fazer Group: Director
(2007–2012); Icecapital Securities Ltd:
investment banker (2001–2007); Manda-
tum Stockbrokers Ltd: investment banker
(1997–2001)
Current key memberships of other
Boards:
Docrates Oy (2016–)
Diversity of the Board of Directors
The company considers diversity essential to achieving the com-
pany’s strategic targets. Diversity is also viewed from several per-
spectives when planning the composition of the Board of Directors.
In the election of Board members, the aim is to ensure that the
Board of Directors as a whole supports the company’s business
and its development. It is important from the point of view of the
effective operation of the Board of Directors that the Board of
Directors is sufficiently diverse and comprised of an adequate
number of members, and that the members have diverse expertise
and their experience supplements one another’s.
In assessing the composition of the Board of Directors, it is, for
example, considered whether the professional and educational
background and gender and age distribution of the Board is ade-
quately diverse and whether it suitably represents decision-mak-
ing ability, skills and experience to be able to meet the require-
ments set by the company’s business operations and strategic
targets. The company’s aim is that both genders are represented in
the Board of Directors.
The principles regarding the diversity of the Board of Directors
are taken into consideration in the successor planning of Board
members. Both genders have been represented in the Board of
Directors for a long time. In 2018, two of the six Board members
were female, so the less represented gender accounted for 33% of
the Board of Directors.
Independence of the members of the highest governance body
None of the members of the Board of Directors are in an employ-
ment relationship with the company. The Board of Directors has
assessed that all of its members are independent of the company.
In the assessment, it was taken into consideration that Heikki
Bergholm has been a member of the Board of Directors for more
than 10 years consecutively. The Board of Directors has not iden-
tified any reasons why Heikki Bergholm should not be considered
independent of the company. All of the members of the Board of Di-
rectors are also independent of the company’s major shareholders.
5
LASSILA & TIKANOJA / FINANCIAL REVIEW 2018
CORPORATE GOVERNANCE / REPORT BY THE BOARD OF DIRECTORS / KEY FIGURES / FINANCIAL STATEMENTS

Board members’ shareholding 31 December 2018
Heikki Bergholm 829,506
Sakari Lassila 16,079
Teemu Kangas-Kärki 1,933
Laura Lares 3,256
Miikka Maijala 74,443
Laura Tarkka 1,284
Total 926,501
Shares in the company held by the Board mem-
bers and any corporations over which they
exercise control have been taken into account
in terms of shareholding. Board members do
not hold shares in any group companies other
than Lassila & Tikanoja plc.
Information about the Board members’
remuneration is disclosed in the Remuneration
Statement published in connection with the
Report of the Board of Directors and is availa-
ble at www.lt.fi/en/annual-report-2018.
Duties of the Board of Directors
The Board of Directors is responsible for the
management of the company, the proper
arrangement of the company’s operations, and
the proper arrangement and supervision of the
company’s accounting and financial manage-
ment. The Board of Directors decides upon
matters that are of major importance, in view
of the scope and size of the operations of the
company. The Board of Directors is also respon-
sible for the duties specified in the Companies
Act and the Articles of Association, and in other
regulations.
The Board of Directors has drawn up a
written charter for its work. The charter was
updated in 2018 and it governs the Board’s
work in addition to the company’s Articles of
Association and Finnish laws and regulations.
Duties of the Board of Directors:
• being responsible for the development of
shareholder value
• confirming the company’s goals
• deciding on the corporate strategy and
confirming divisional strategies
• deciding on the Group structure and
organisation
• ensuring the operation of the management
system
• handling and adopting interim reports,
consolidated financial statements and
Reports by the Board of Directors
• confirming the Group’s operating plan,
budget and investment plan
• deciding on strategically or financially
significant investments, corporate
acquisitions, disposals or other
arrangements as well as financing
arrangements and contingent liabilities
• drawing up the dividend policy
• confirming treasury, investment, disclosure,
risk management and insurance policies as
well as the principles of internal control
• approving the corporate responsibility
programme
• nominating and dismissing the President and
CEO and monitoring and evaluating his work
• deciding on the nomination, remuneration
and other financial benefits of the President
and CEO’s immediate subordinates
The evaluation of the performance and working
methods of the Board is conducted annually as
an internal self-evaluation.
Meetings of the Board of Directors
Board meetings are held at the company’s head
office in Helsinki, other locations of the group or
other places decided on by the Board of Direc-
tors. If necessary, the Board of Directors may
also hold meetings by telephone or electroni-
cally and make decisions without convening.
The Board of Directors convenes as often as
its tasks require. It confirms its annual, regular
meetings. Meetings held annually prior to the
publication of the financial statements and
each interim report as well as strategy, budget
and other meetings confirmed in the annual
programme of the Board are considered regular
meetings. In addition to regular meetings, the
Board can hold extraordinary meetings.
The company’s President and CEO and CFO
usually participate in Board meetings. Where
necessary, such as in conjunction with dis-
cussing the strategy or budget, the meetings
are also attended by other members of Lassila
& Tikanoja plc’s Group Executive Board. The
company’s General Counsel acts as the secre-
tary of the Board of Directors.
Minutes are prepared of Board meetings,
subject to the signature of members of the
Board of Directors participating in the meeting
as well as the President and CEO of the compa-
ny and secretary to the Board. These minutes
are kept at the company’s headquarters.
The President and CEO is responsible for en-
suring that the Board is provided with sufficient
information for assessing the operations and
financial situation of the company.
He also supervises and reports to the Board
on the implementation of the Board’s decisions.
Activities of the Board of Directors in 2018
The Board of Directors had 15 meetings in 2018,
three of which were held remotely. The average
attendance rate of the members at the meet-
ings was 100%.
Key themes in the Board’s work included
strategy and directing and supporting its
implementation, monitoring strategic projects,
developing the business portfolio, directing risk
management and appointing the President and
CEO.
6
LASSILA & TIKANOJA / FINANCIAL REVIEW 2018
CORPORATE GOVERNANCE / REPORT BY THE BOARD OF DIRECTORS / KEY FIGURES / FINANCIAL STATEMENTS

Meeting attendance of Board members in 2018Board of
DirectorsAudit
CommitteePersonnel
Committee
Heikki Bergholm 15/15 4/4
Sakari Lassila 15/15 6/6
Teemu Kangas-Kärki 15/15 6/6
Laura Lares 15/15 4/4
Miikka Maijala 15/15 4/4
Laura Tarkka 15/15 5/6
Committees of the Board of Directors
The Board has an Audit Committee and a
Personnel Committee, both of which consist of
three (3) Board members. After the end of the
Annual General Meeting, the Board of Directors
elects chairmen and members of the Commit-
tees from among its members for a term of
one year at a time. The committee members
must have the expertise and experience
required by the duties of the committee. The
Board of Directors confirms the charters of the
committees annually. The committees have no
independent decision-making authority; the
Board of Directors makes the decisions based
on the preparation work by the committees.
The chairman of the committee reports on the
work of the committee at the Board meeting
following the committee meeting. Minutes of
the committees’ meetings are provided to the
Board members for information.
Audit Committee
In its first meeting after the Annual Gener-
al Meeting of 15 March 2018, the Board of
Directors appointed Sakari Lassila (Chairman),
Teemu Kangas-Kärki and Laura Tarkka as mem-
bers of the Audit Committee. All of the members
of the Audit Committee are independent of the
company and its major shareholders.
The Audit Committee will convene at least
four times a year. The duties of the Audit Com-
mittee pursuant to the charter include:
• monitoring the financial position and
financing of the Group
• monitoring the reporting process of financial
statements
• supervising the financial reporting process
• monitoring the efficiency of the company’s
internal control, internal audit and risk
management systems
• reviewing the operating principles of the
company’s internal control
• reviewing the plans and reports of the
company’s internal audit
• reviewing the company’s corporate
governance statement
• reviewing the statement of non-financial
information
• monitoring related-party transactions
• reviewing the corporate responsibility
programme
• monitoring the statutory audit of the
financial statements and consolidated
financial statements
• evaluating the independence of the auditing
company
• evaluating the provision of non-audit
services to the company by the auditing firm
• preparing the proposal and/or
recommendation concerning the selection
of the auditor of the company
• maintaining contact with the company’s
auditor and reviewing the reports prepared
for the committee by the auditor
• assessment of compliance with laws and
provisions.
The Audit Committee met six times in 2018.
The attendance rate of the members at the
meetings was 94.4%.
Personnel Committee
In its first meeting after the Annual General
Meeting of 15 March 2018, the Board of Direc-
tors appointed Heikki Bergholm (Chairman),
Miikka Maijala and Laura Lares as members of
the Personnel Committee. All of the members
of the Personnel Committee are independent of
the company and its major shareholders.
The Personnel Committee convenes at least
twice a year. The duties of the Personnel Com-
mittee pursuant to the charter include:
• handling, evaluating and making statements
on the salary structure of the Group
management and personnel as well as
remuneration and incentive schemes
• monitoring the functionality of the
remuneration systems to ensure that the
management’s incentive schemes promote
the achievement of the company’s targets
and are based on personal performance
• handling and preparing other questions
related to management and personnel
remuneration and drafting proposals to the
Board regarding them
• handling and preparing executive
appointment issues for consideration by the
Board of Directors.
• reviewing and preparing the personnel-
related matters of the corporate
responsibility programme
• reviewing the Remuneration Statement.
The Personnel Committee met four times in
2018. The attendance rate of the members at
the meetings was 100%.
7
LASSILA & TIKANOJA / FINANCIAL REVIEW 2018
CORPORATE GOVERNANCE / REPORT BY THE BOARD OF DIRECTORS / KEY FIGURES / FINANCIAL STATEMENTS

Eero Hautaniemi
born 1965
President and CEO
Member of the Group Executive
Board since: 1 January 2019
Education: M.Sc. (Econ.)
Key work experience: Oriola Oyj:
President and CEO (2006–2017); GE
Healthcare Finland Oy: President
(2004–2005); GE Healthcare IT:
General Manager, Oximetry, Supplies
and Accessories business area
(2003–2004); Instrumentarium Cor-
poration: specialist and executive
positions (1990–2003)
Current key Board memberships:
Posti Group Corporation (2017–);
Finnish Commerce Federation
(2014–)
Past key Board memberships:
Lassila & Tikanoja Plc (2007–2017);
Nurminen Logistics Plc (2009–2012)
Tuomas Mäkipeska
born 1978
CFO
Member of the Group Executive
Board since: 14 February 2012
Education: M.Sc. (Econ.)
Key work experience: Lassila &
Tikanoja plc: Development Director
(2012–2017), Vice President, Renew-
able Energy Sources (2015–2017);
Deloitte: Management Consultant,
Strategy & Operations (2005–2012);
Fiskars Corporation: Project Manag-
er (2004–2005); Rieter Automotive
Management AG: Market Analyst
(2003)
Petri Salermo
born 1970
Vice President, Environmental
Services
Member of the Group Executive
Board since: 1 January 2013
Education: QBA
Key work experience: Lassila &
Tikanoja plc: Business Director, En-
vironmental Services (2009–2012),
Sales Director, Environmental Ser-
vices (2003–2009), Sales Manager,
Environmental Services (2001–
2003); Europress Oy: Sales Director
(1998–2001), managerial positions in
sales (1995–1998)
President and CEOLassila & Tikanoja plc’s President
and CEO is appointed by the Board of
Directors. The President and CEO is
responsible for day-to-day opera-
tions in keeping with the instructions
of the Board of Directors. He is also
responsible for the strategy process.
Eero Hautaniemi, M.Sc. (Econ.),
was appointed as the company’s
new President and CEO on 15
November 2018 and he took up his
post on 1 January 2019. CFO Tuomas
Mäkipeska served as interim Presi-
dent and CEO from 24 November to
31 December 2018. From 1 November
2011 to 23 November 2018, the com-
pany’s President and CEO was Pekka
Ojanpää, M.Sc. (Econ.). The more
detailed personal and shareholding
information of the President and CEO
is disclosed below in connection
with the personal and shareholding
information of the members of the
Group Executive Board.
Group Executive BoardThe Group Executive Board assists
the President and CEO in the man-
agement of the company. The Group
Executive Board has no authority
based on legislation or the Articles
of Association. The Group Executive
Board is comprised of the President
and CEO as the chairman and Group
executives confirmed by the Board
of Directors. The members of the
Group Executive Board report to
the President and CEO. The Group
Executive Board convenes at least
once a month.
On the date of this statement,
the Group Executive Board was
comprised of the following persons:
8
LASSILA & TIKANOJA / FINANCIAL REVIEW 2018
CORPORATE GOVERNANCE / REPORT BY THE BOARD OF DIRECTORS / KEY FIGURES / FINANCIAL STATEMENTS
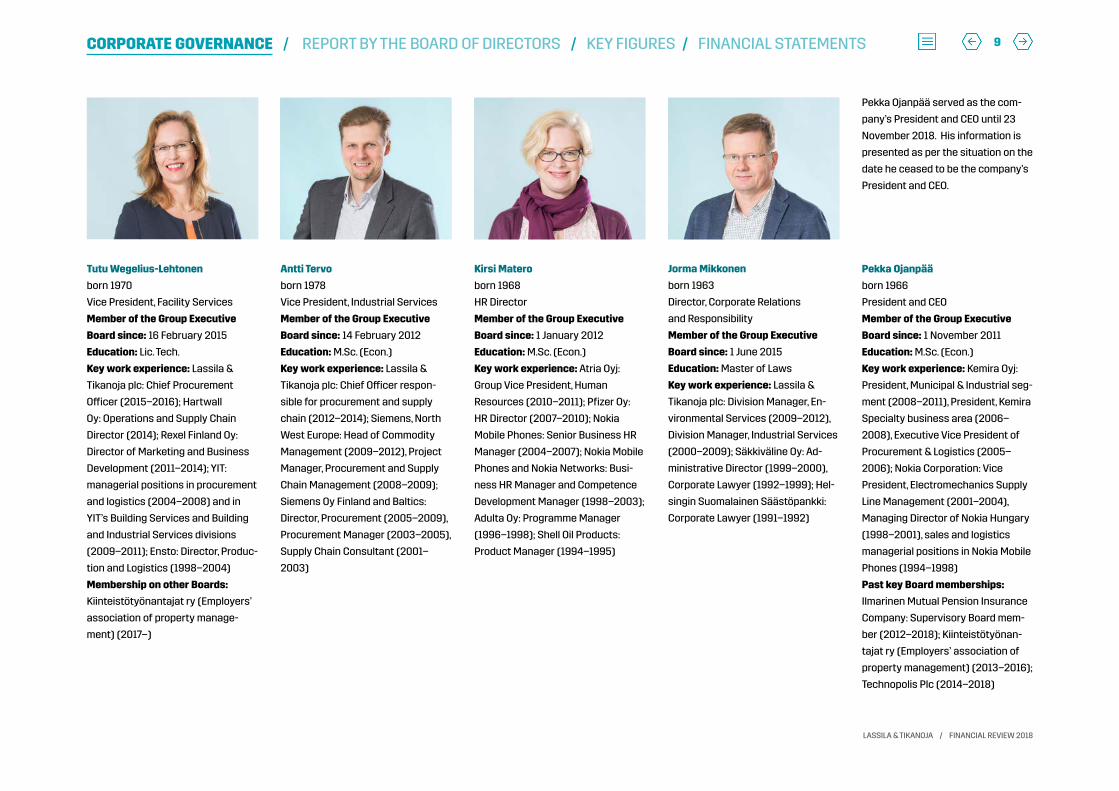
Kirsi Matero
born 1968
HR Director
Member of the Group Executive
Board since: 1 January 2012
Education: M.Sc. (Econ.)
Key work experience: Atria Oyj:
Group Vice President, Human
Resources (2010–2011); Pfizer Oy:
HR Director (2007–2010); Nokia
Mobile Phones: Senior Business HR
Manager (2004–2007); Nokia Mobile
Phones and Nokia Networks: Busi-
ness HR Manager and Competence
Development Manager (1998–2003);
Adulta Oy: Programme Manager
(1996–1998); Shell Oil Products:
Product Manager (1994–1995)
Jorma Mikkonen
born 1963
Director, Corporate Relations
and Responsibility
Member of the Group Executive
Board since: 1 June 2015
Education: Master of Laws
Key work experience: Lassila &
Tikanoja plc: Division Manager, En-
vironmental Services (2009–2012),
Division Manager, Industrial Services
(2000–2009); Säkkiväline Oy: Ad-
ministrative Director (1999–2000),
Corporate Lawyer (1992–1999); Hel-
singin Suomalainen Säästöpankki:
Corporate Lawyer (1991–1992)
Antti Tervo
born 1978
Vice President, Industrial Services
Member of the Group Executive
Board since: 14 February 2012
Education: M.Sc. (Econ.)
Key work experience: Lassila &
Tikanoja plc: Chief Officer respon-
sible for procurement and supply
chain (2012–2014); Siemens, North
West Europe: Head of Commodity
Management (2009–2012), Project
Manager, Procurement and Supply
Chain Management (2008–2009);
Siemens Oy Finland and Baltics:
Director, Procurement (2005–2009),
Procurement Manager (2003–2005),
Supply Chain Consultant (2001–
2003)
Tutu Wegelius-Lehtonen
born 1970
Vice President, Facility Services
Member of the Group Executive
Board since: 16 February 2015
Education: Lic. Tech.
Key work experience: Lassila &
Tikanoja plc: Chief Procurement
Officer (2015–2016); Hartwall
Oy: Operations and Supply Chain
Director (2014); Rexel Finland Oy:
Director of Marketing and Business
Development (2011–2014); YIT:
managerial positions in procurement
and logistics (2004–2008) and in
YIT’s Building Services and Building
and Industrial Services divisions
(2009–2011); Ensto: Director, Produc-
tion and Logistics (1998–2004)
Membership on other Boards:
Kiinteistötyönantajat ry (Employers’
association of property manage-
ment) (2017–)
Pekka Ojanpää
born 1966
President and CEO
Member of the Group Executive
Board since: 1 November 2011
Education: M.Sc. (Econ.)
Key work experience: Kemira Oyj:
President, Municipal & Industrial seg-
ment (2008–2011), President, Kemira
Specialty business area (2006–
2008), Executive Vice President of
Procurement & Logistics (2005–
2006); Nokia Corporation: Vice
President, Electromechanics Supply
Line Management (2001–2004),
Managing Director of Nokia Hungary
(1998–2001), sales and logistics
managerial positions in Nokia Mobile
Phones (1994–1998)
Past key Board memberships:
Ilmarinen Mutual Pension Insurance
Company: Supervisory Board mem-
ber (2012–2018); Kiinteistötyönan-
tajat ry (Employers’ association of
property management) (2013–2016);
Technopolis Plc (2014–2018)
Pekka Ojanpää served as the com-
pany’s President and CEO until 23
November 2018. His information is
presented as per the situation on the
date he ceased to be the company’s
President and CEO.
9
LASSILA & TIKANOJA / FINANCIAL REVIEW 2018
CORPORATE GOVERNANCE / REPORT BY THE BOARD OF DIRECTORS / KEY FIGURES / FINANCIAL STATEMENTS

Group Executive Board members’ shareholding 31 December 2018
31 Dec 2018
Eero Hautaniemi * 10,403
Petri Salermo 12,578
Antti Tervo 6,396
Kirsi Matero 6,078
Tuomas Mäkipeska 6,250
Tutu Wegelius-Lehtonen 2,185
Jorma Mikkonen 4,837
Pekka Ojanpää ** 42,471
Total 91,198
*Member of the Group Executive Board from 1 January 2019.
**Member of the Group Executive Board until 23 November 2018.
The Group’s financial reporting The financial reporting principles represent an
essential element of L&T’s Integrated Man-
agement System (IMS). The financial results
of the Group’s divisions are reported and
analysed internally within the Group monthly
and disclosed as interim reports, half-yearly
reports and financial statements release on a
quarterly basis. The Group’s and its divisions’
strategies and related long-term financial plans
are updated annually.
The Group’s financial reporting process in-
cludes both financial accounting and manage-
ment accounting. The internal control and risk
management processes and procedures per-
taining to the financial reporting process are
explained in more detail below. Their purpose is
to ensure that the information disclosed in the
financial reports published by the company is
essentially correct.
Audit Committee
The Board of Directors’ Audit Committee
supervises and monitors the efficiency of L&T’s
financial reporting process and internal control
systems. The Audit Committee has reviewed
L&T’s internal control policy and the Board of
Directors has approved it.
The Audit Committee meets at least four
times a year before the publication of interim
reports and the financial statements release.
In its meetings, the Audit Committee reviews
the financial information presented by the
Chief Financial Officer, as well as interim and
half-yearly reports and financial statements re-
leases. The auditor is also invited to attend the
meetings. The Audit Committee is presented in
more detail in the Committees section.
L&T’s financial reporting process
L&T conducts a significant proportion of its
business in Finland. Functions related to
accounting, accounts payable and receivable,
payments and financing in the financial report-
ing process in Finland are centralised. Organi-
sation of these functions into different teams
allows the separation of various finance-relat-
ed tasks. To support the consistent process in
Finland, L&T also runs a centralised accounting
system and common account framework.
L&T Korjausrakentaminen Oy and L&T’s
foreign subsidiaries each have independent fi-
nancial management departments operating in
compliance with the accounting principles and
reporting instructions issued by the Group’s
financial management. L&T Korjausrakentam-
inen Oy and the foreign subsidiaries submit
a monthly reporting package to the Group
according to the Group’s instructions. Financial
controllers supervise L&T Korjausrakentamin-
en Oy’s and the foreign subsidiaries’ financial
reports.
Descriptions of internal control procedures and main features of risk management system
Shares in the company held by the Group Ex-
ecutive Board members and any corporations
over which they exercise control have been
taken into account in terms of shareholding.
Group Executive Board members do not hold
shares in any group companies other than
Lassila & Tikanoja plc.
Information about the remuneration paid to
the President and CEO and the Group Executive
Board is disclosed in the Remuneration State-
ment published in connection with the Report
of the Board of Directors and is available at
www.lt.fi/en/investors/annual-report-2018.
10
LASSILA & TIKANOJA / FINANCIAL REVIEW 2018
CORPORATE GOVERNANCE / REPORT BY THE BOARD OF DIRECTORS / KEY FIGURES / FINANCIAL STATEMENTS

L&T’s Group financial management is respon-
sible for preparing and updating the Group
accounting policies and instructions, and for
preparing reporting schedules. The financial
management department consolidates subsid-
iaries’ financial statements into consolidated
financial statements, which include notes to
the financial statements, and prepares interim
and half-yearly reports and financial statement
releases and the annual financial statements.
Public financial reporting is realised with the
same principles and it is subject to the same
control methods as monthly internal financial
reporting. The Audit Committee reviews the
interim report, half-yearly report and financial
statements and proposes its recommendation
on their processing to the Board of Directors.
The Board of Directors approves the interim
report, half-yearly report, financial statements
release and financial statements prior to their
publication.
Internal controlInternal control is a material part of the Group’s
administration and management. The purpose
of internal control is to ensure the reliability
of the Group’s financial reporting, efficiency
and profitability of operations and compliance
with legislation and other regulations. Tools of
internal control include policies and principles,
guidelines, manual and IT system-based auto-
matic controls, follow-up reports and inspec-
tions or audits.
The company’s Board of Directors has
ratified L&T’s internal control policy. The Board
of Directors and the President and CEO are
responsible for the organisation of internal
control. The Audit Committee of the Board of
Directors monitors the efficiency and perfor-
mance of internal control and correctness of
financial reporting.
The financial development of the company is
monitored monthly by an operational reporting
system covering the whole Group. In addition
to actual data, the system provides budgets,
forecasts and investment reports. L&T’s oper-
ations and financial reports are monitored and
compared against budgets and forecasts at
different organisational levels. Group manage-
ment, divisional management and area man-
agement as well as business unit management
analyse the results and any nonconformities.
Those responsible for finances at the divisions
also analyse the financial reports and prepare
reports for management use. Their duties also
include supervision of the accuracy of financial
reports and analysis of results.
Risk management L&T has a defined risk management process
that includes a review of financial, strategic,
operational and damage-related risks.
Key Risk Management Principles
Risk management at L&T aims to identify
significant risk factors, prepare for them and
manage them in an optimal way so that the
company’s strategic and financial objectives
are achieved. Comprehensive risk management
endeavours to manage the Group’s risk as a
whole and not just individual risk factors.
Responsibilities
The principles of L&T’s risk management are
approved by the company’s Board of Directors.
The Board monitors the implementation of
risk management and assesses the efficiency
of the methods employed. The President and
CEO is responsible for the organisation and
implementation of risk management. Risk man-
agement at L&T Group is controlled by the risk
management and insurance policy confirmed
by L&T’s Board of Directors. The policy specifies
the objectives and principles, organisation and
responsibilities and procedures of the Group’s
risk management. The Group’s financing
policy confirmed by L&T’s Board of Directors is
followed in the management of financial risks.
The principles for insurance risk management
are specified in the risk management and
insurance policy.
Identification, assessment and reporting
of risks
Risks are surveyed regularly and systemati-
cally at both division and company level and in
central functions considered to be critical. The
significance of risks is assessed by a risk ma-
trix. Measures for managing and minimising the
identified risks are prepared and responsibility
for these measures is allocated to specified
individuals or units. The most significant risks
identified and the preparations for them are
regularly reported to the President and CEO and
the Board of Directors.
Other information disclo-sed in the CG statementInternal audit
Internal audit enhances the realisation of the
monitoring responsibility of L&T’s Board of
Directors. It is the task of L&T’s internal audit to
support the company and its senior man-
agement in the achievement of strategic and
financial goals by providing a systematic ap-
proach to assessing and developing the effec-
tiveness of the organisation’s internal control,
risk management and governance systems and
the performance, efficiency and appropriate-
ness of business processes. The internal audit
function provides recommendations for the
development of the above-mentioned systems
and processes.
The internal audit focuses primarily on pro-
active measures by participating in develop-
ment projects and supporting the businesses
in the identification of risks related to their
planned operating models and the specifi-
cation of risk management measures. The
internal audit has no operational responsibility
for projects and it does not participate in deci-
sion-making. In its operations, the internal audit
complies with generally accepted international
professional standards concerning internal au-
dit and ethical principles, as well as the internal
audit operating guidelines confirmed by L&T’s
Board of Directors.
The internal audit operates under the super-
vision of the Audit Committee of L&T’s Board
of Directors and the company’s President and
11
LASSILA & TIKANOJA / FINANCIAL REVIEW 2018
CORPORATE GOVERNANCE / REPORT BY THE BOARD OF DIRECTORS / KEY FIGURES / FINANCIAL STATEMENTS

CEO and reports its observations and recom-
mendations to the Audit Committee, President
and CEO, management of each audited division
and the auditor. Internal audit may purchase
external outsourced services for carrying out
audit tasks requiring additional resourcing or
special expertise as necessary.
The Board’s Audit Committee confirms the
annual plan of internal audit, in which items to
be audited are selected based on the Group’s
strategic objectives, estimated risks and focal
areas specified by the Board of Directors and
President and CEO. The audit plan is amended
based on risks as necessary.
Related-party transactions
In accordance with the Corporate Governance
Code, the company evaluates and monitors
transactions between the company and its
related parties and aims to ensure that any
conflicts of interest are taken into consider-
ation in decision-making. If the related-party
transactions are material to the company and
deviate from the company’s ordinary business
operations or are made in deviation from ordi-
nary market terms, the company must report
the decision-making procedure concerning
such related-party transactions.
L&T’s related-party transactions are de-
scribed in Note 32 to the financial statements.
L&T did not carry out any business transactions
with related parties that were material to the
company, deviated from its normal business
operations or were not made on market or
market equivalent terms in 2018.
Insider guidelines
The company complies with the Market Abuse
Regulation (596/2014, “MAR”) and the Secu-
rities Market Act and related regulations and
guidelines issued by the European Securi-
ties Markets Authority, the Finnish Financial
Supervisory Authority and Nasdaq Helsinki Ltd.
Moreover, the Board of L&T’s has also verified
insider guidelines to supplement the Guidelines
for Insiders issued by Nasdaq Helsinki Ltd. Cer-
tain key aspects of the insider guidelines are
described below. The insider guidelines clearly
specify certain practices and decision-making
for procedures for ensuring that the compa-
ny’s insider management has been arranged
in a consistent and reliable way. The General
Counsel is responsible for insider issues in the
company.
As a result of MAR, L&T has not had a public
insider list since 3 July 2016. L&T also no longer
maintains a permanent company-specif-
ic insider register. Instead, the company’s
employees and service providers with access
to certain insider information are recorded in
project-specific lists of insiders. Service provid-
ers may keep a list of insiders concerning their
own employees if so decided by the company
in an individual case.
If a person holds inside information, trading
in the company’s securities is always prohib-
ited. In addition, certain trading restrictions
apply to certain managers and employees of
the company also when said parties hold no
inside information. L&T has specified the Board
of Directors and the President and CEO as
executives as referred to in the Market Abuse
Regulation. Said persons may not trade in L&T’s
financial instruments on their own account or
for the account of a third party for a closed pe-
riod of 30 days preceding the publication of the
company’s interim reports, half-year report and
financial statements release, including the date
of publication. The closed period preceding
result announcements and the restriction of
trading during the closed period also apply to
the persons who participate in the preparation
of interim reports and the financial statements
release, or who otherwise have regular access
to L&T’s undisclosed financial information.
These managers, i.e. Board members and
the President and CEO, and the persons closely
associated with them are required to notify L&T
and the Finnish Financial Supervisory Authority
of all transactions involving financial instru-
ments issued by L&T or related to L&T. Trans-
actions by managers and the persons closely
associated with them are published as stock
exchange releases via the company website.
Auditor
L&T has one auditor that must be a firm of
auditors approved by the Finland Chamber of
Commerce. The auditor is elected by the Annual
General Meeting. KPMG Oy Ab, Authorised
Public Accountants, was elected by the Annual
General Meeting of 2018 as the company’s au-
ditor, with Lasse Holopainen, Authorised Public
Accountant, as the principal auditor.
The auditors and the Board agree on the
audit plan annually and discuss the audit’s
findings.
In 2018, the fees paid for the Group’s
statutory auditing to KPMG group totalled EUR
168,000 (209,000). The fees paid to the audit-
ing company and companies belonging to the
same group for non-audit services totalled EUR
30,000 (439,000). Such other services were
related to M&A projects and the assurance of
the sustainability report.
12
LASSILA & TIKANOJA / FINANCIAL REVIEW 2018
CORPORATE GOVERNANCE / REPORT BY THE BOARD OF DIRECTORS / KEY FIGURES / FINANCIAL STATEMENTS

Remuneration Statement 2018This remuneration statement was prepared in
accordance with the Securities Market Associ-
ation’s Finnish Corporate Governance Code for
Finnish listed companies that entered into force
on 1 January 2016. This remuneration statement
includes descriptions of the decision-making
concerning the remuneration of the company’s
Board of Directors, President and CEO and other
members of the Group Executive Board, key
remuneration principles and a remuneration
report. The Personnel Committee of the Board of
Directors has reviewed this statement. This and
other information disclosed in accordance with
the Corporate Governance Code are available
on the website of Lassila & Tikanoja plc (“L&T” or
“the company”) at www.lt.fi/en/investors/corpo-
rate-governance.
Board of DirectorsDecision-making on remuneration
The Annual General Meeting annually deter-
mines the emoluments payable to the members
of the Board of Directors for Board and commit-
tee work. The major shareholders prepare the
proposals concerning the remuneration of the
Board of Directors.
Key remuneration principles
In accordance with the resolution of the Annual
General Meeting on 15 March 2018, it was de-
cided to pay the Chairman EUR 60,000, the Vice
Chairman EUR 40,000 and each member EUR
30,000 per year as of the 2018 Annual General
Meeting. The fees are paid so that 40% of the
annual fee is in Lassila & Tikanoja’s shares held
by the company or, if this is not feasible, shares
acquired from the markets, and 60% in cash.
Shares are to be issued to Board members and,
where necessary, acquired directly from the
markets on behalf of Board members within
the next 14 trading days, free from restrictions
on trading, from the Annual General Meeting. In
addition, meeting fees are paid to the members
of the Board of Directors as follows: EUR 1,000
to the Chairman, EUR 700 to the Vice Chairman
and EUR 500 to each member for each meeting.
Meeting fees are also paid to the Chairmen and
members of committees established by the
Board of Directors: EUR 700 to the Chairman of
a committee and EUR 500 to each member for
each meeting.
None of the members of the Board of the Di-
rectors is employed by the company or compa-
ny belonging to the same group of companies
with the company or acts as the company’s
advisor, and thereby they receive no salary,
pension benefits, other financial benefits as-
sociated with employment or service, or other
emoluments or fees not associated with Board
work from the company. The members of the
Board are not included in the company’s share-
based incentive schemes and they do not have
any pension contracts with the company.
Remuneration-related authorisations
The Annual General Meeting decided on 15
March 2018 in accordance with the proposal of
the Board of Directors to authorise the Board
of Directors to decide on a share issue and
issuance of option rights or other special rights
conferring entitlement to shares, referred to
in Chapter 10, Section 1 of the Finnish Limited
Liability Companies Act, as follows:
The maximum number of shares issued
under the authorisation is 2,000,000 shares,
corresponding to approximately 5.2% of the
total number of shares. The Board of Directors
decides on all terms and conditions of the
share issue and issuance of special rights
conferring entitlement to shares, and it has the
right to waive the pre-emptive right of share-
holders (directed issue). The authorisation is
effective for 18 months.
In 2018, the company’s Board of Directors
decided to transfer a total of 2,584 company
shares under the authorisation as part of the
company’s share-based incentive programme
and 5,326 shares as part of the remuneration
of the members of the Board of Directors
(directed issue).
President and CEO and Group Executive BoardDecision-making on remuneration
The Board of Directors annually decides on the
emoluments and financial benefits payable
to the President and CEO and other members
of the Group Executive Board. Before deci-
sion-making by the Board of Directors, the
matter is prepared by the Personnel Committee
of the Board.
Key remuneration principles
The remuneration of the President and CEO
and the other members of the Group Execu-
tive Board consists of a fixed monthly salary
and benefits and a separate annually decided
short-term incentive. In addition, the President
and CEO and other members of the Group
Executive Board are covered by the share-
based incentive programme functioning as a
long-term incentive scheme.
Short-term incentive programme
The short-term incentives of the CEO and other
members of the Group Executive Board are
based on the performance of the Group and
division. The short-term incentives paid to the
division directors are based on the operating
profit of the Group and division. The short-term
incentives of the President and CEO and other
members of the Executive Board are based on
the operating profit of the Group. The bonus
equals a maximum of 3–6 months’ salary, at
maximum, depending on the responsibilities of
the recipient.
The objectives of the short-term incentives
are set and their realisation assessed annually.
Any incentives are usually paid in February of
the year following the earnings period typically
spanning a calendar year. The precondition for
payment is that the person is employed by the
company at the time.
Share-based incentive programmes
The share-based incentive programme is the
long-term incentive scheme for the President
and CEO and other members of the Group
Executive Board. The company’s Board of
Directors decides on the share-based incentive
13
LASSILA & TIKANOJA / FINANCIAL REVIEW 2018
CORPORATE GOVERNANCE / REPORT BY THE BOARD OF DIRECTORS / KEY FIGURES / FINANCIAL STATEMENTS

programme to form a part of the incentive and
commitment scheme for the company’s key
personnel. The earnings period of the pro-
gramme is the calendar year. The Board of Di-
rectors decides on the earnings criteria, target
group and maximum share-based incentives
on the proposal of the Personnel Committee.
The final numbers of shares issued based on
meeting the earnings criteria are decided by
the Board of Directors at the beginning of the
year following the earnings period. Rewards
will be paid in February of the calendar year
following the earnings period. The rewards will
be paid partly as shares and partly in cash. The
maximum share-based payment may equal
6–12 months’ salary depending on the respon-
sibilities of the member of the Group Executive
Board.
The precondition for payment is that the
person be employed by the company at the
time. Any shares earned through the incen-
tive programme must be held for a minimum
period of two years following the payment
(commitment period). After that, the members
of the Group Executive Board are still required
to hold company shares with a value equal to
their gross salary for six months and the other
programme participants with a value equal
to their gross salary for three months as long
as they are employed by the company. If a
programme participant resigns during the com-
mitment period at their own initiative, they are
obligated to return the received shares without
compensation.
The share-based incentive programmes with
years 2018 and 2017 as the earnings periods
are described below:
• The share-based incentive programme 2018
began in 2017. The rewards were based on the
Group’s EVA result and they were paid in 2018.
• The share-based incentive programme 2019
began in 2018. The rewards were based on
the Group’s EVA result and they will be paid in
2019.
Other key terms and conditions
A written service contract has been drawn up
for the President and CEO. According to the
contract, the period of notice is six months
should the company terminate the contract,
and six months should the President and
CEO terminate the contract. In the event that
the company terminates the contract, the
President and CEO will be paid compensation
amounting to twelve (12) months’ salary.
Separate emoluments are not paid to the
President and CEO and other members of the
Group Executive Board for the memberships of
Boards of Directors of the subsidiaries.
The President and CEO and other members
of the Group Executive Board are not covered
by any supplementary pension scheme.
Remuneration reportThis remuneration report is included in Lassila
& Tikanoja plc’s (“L&T” or “the Company”) re-
muneration statement published in connection
with the Report by the Board of Directors. The
remuneration report describes the emoluments
and other financial benefits paid to members
of the Board of Directors, CEO and other Group
Executive Board members during the financial
year 2018.
Board of Directors and its Committees
The Annual General Meeting held on 15 March
2018 resolved on the remuneration of the
Board of Directors as follows:
• Chairman of the Board EUR 60,000
• Vice Chairman of the Board EUR 40,000
• members EUR 30,000
In addition, meeting fees were paid to the
members of the Board of Directors as follows:
EUR 1,000 to the Chairman, EUR 700 to the
Vice Chairman and EUR 500 to each member
for each meeting. Meeting fees were also paid
to the Chairmen and members of committees
established by the Board of Directors: EUR 700
to the Chairman of a committee and EUR 500 to
each member for each meeting.
Information about remuneration paid to
those who were members of the Board of
Directors during the financial years 2018 and
2017 is presented in the table below.
2018 2017
Annual fee Meeting fees Total Annual fee Meeting fees Total
Heikki Bergholm 60,000 15,800 75,800 46,250 15,800 62,050
Sakari Lassila 40,000 13,300 53,300 30,500 12,000 42,500
Teemu Kangas-Kärki 30,000 9,500 39,500 25,750 9,000 34,750
Laura Lares 30,000 8,500 38,500 25,750 8,000 33,750
Miikka Maijala 30,000 8,500 38,500 25,750 8,500 34,250
Laura Tarkka 30,000 9,000 39,000 25,750 7,500 33,250
* 40% of the annual fee is paid in Lassila & Tikanoja’s shares held by the company or, if this is not feasible, shares acquired from the markets.
Remuneration paid to the members of the Board of Directors (EUR)*
14
LASSILA & TIKANOJA / FINANCIAL REVIEW 2018
CORPORATE GOVERNANCE / REPORT BY THE BOARD OF DIRECTORS / KEY FIGURES / FINANCIAL STATEMENTS

President and CEO
In 2018, the fixed annual salary of President
and CEO Pekka Ojanpää including benefits
was EUR 430,746 (in 2017: EUR 424,104). The
short-term incentive determined based on 2017
amounted to EUR 60,588 (2017: EUR 96,941).
In 2018, the President and CEO received 1,003
shares as rewards for 2017 (2017: 5,944
shares), the value of which at the time of
transfer was EUR 18,682 (2017: EUR 112,105)
and monetary compensation relating to the
taxes for the share rewards, amounting to EUR
18,682 (2017: EUR 112,105), or a total of EUR
37,364 (2017: EUR 224,210). The President and
CEO’s wages and fees for 2018 thus totalled
EUR 528,698 (2017: EUR 745,255).
Other Executive Board members
Other Group Executive Board members were
paid fixed annual salary and fringe benefits of
EUR 1,024,028 in 2018 (2017: EUR 1,300,359)
and short-term incentives based on perfor-
mance in 2017 totalling EUR 95,634 (2017: EUR
167,303). In 2018, the members of the Executive
Wages and fees paid to the CEO and other members of the Group Executive Board (EUR)
2018 2017
Fixed salary IncentivesShare-based
incentives Total Fixed salary IncentivesShare-based
incentives Total
President and CEO* 430,746 60,588 37,364 528,698 424,104 96,941 224,210 745,255
Other Group Executive Board members total 1,024,028 95,634 53,472 1,173,134 1,300,359 167,303 351,388 1,819,050
Board received a total of 1,581 shares as re-
wards for 2017 (2017: 9,317 shares), the value of
which was EUR 26,736 (2017: EUR 175,694) and
monetary compensation relating to the taxes
for the share rewards, amounting to EUR 26,736
(2017: EUR 175,694), or a total of EUR 53,472
(2017: EUR 351,388). The wages and fees paid
to other members of the Group Executive
Board thus totalled EUR 1,173,134 (2017: EUR
1,819,050).
In 2018, EUR 5,300 arising from the pension
agreement of Jari Sarjo, who served as the
President and CEO until 13 June 2011, was rec-
ognised in the income statement.
Information about remuneration paid to
the President and CEO and those who were
members of the Board of Directors during the
financial years 2018 and 2017 is presented in
the table below.
* Pekka Ojanpää served as the company’s President and CEO until 23 November 2018. CFO Tuomas Mäkipeska served as interim President and CEO from 24 November to 31 December 2018. He was not paid any additional compensation and his wages and fees are not included in the figures reflecting the wages and fees paid to the President and CEO.
15
LASSILA & TIKANOJA / FINANCIAL REVIEW 2018
CORPORATE GOVERNANCE / REPORT BY THE BOARD OF DIRECTORS / KEY FIGURES / FINANCIAL STATEMENTS

REPORT BY THE BOARD OF DIRECTORS
StrategyL&T is a practical doer in the circular economy
whose services are aimed at helping custom-
ers make efficient and sustainable use of their
resources. This enables the company to pursue
profitable growth – both for customers and
itself. By executing its strategy, the company
aims to become the most advanced and useful
service company in its industry.
L&T’s strategy emphasises the improvement
of productivity through new operating models
and systems as well as a strong focus on the
customer and employee experience. In all of
its businesses, L&T focuses on developing
new service solutions to ensure future growth.
Growth is also pursued through potential
acquisitions.
Progress made in the implementation of strategy in 2018
At the beginning of 2018, L&T implemented
major restructuring measures by taking a
significant proportion of the business support
services produced by the Group and shift-
ing them to the divisions. This change in the
management model is aimed at improving the
competitiveness and agility of businesses and
allocating more resources to the company’s
work with customers. In connection with the
restructuring, the Technical Services business
was separated into a division of its own.
In connection with updating the strategy in
2018, L&T assessed the market attractiveness
of each business as well as their performance
and potential in relation to the market. The
company also assessed the necessary meas-
ures to improve the availability and retention of
competent personnel and began the verifica-
tion of the effectiveness of its services and
value creation for key stakeholders.
The focus of strategic development was on
adding detail to business-level strategies and
ensuring effective execution. Measures to im-
prove the customer and employee experience
were also implemented in accordance with the
strategy of each business.
The Environmental Services division inves-
tigated new business opportunities in the
circular economy and expanded the geographi-
cal coverage of new circular economy services.
The division also evaluated future business
positioning alternatives in the environmental
services value chain. In the latter half of the
year, an investment decision was made to
increase the capacity of the division’s plastic
recycling plant and expand its services to
include the processing of dirty plastics.
The Industrial Services division evaluated its
market position and defined alternative paths
to growth. The division also focused on service
development and defining the operating model
that will be used as the foundation of the new
ERP system. The implementation of the system
began in the autumn and its deployment will
start gradually in 2019.
The Facility Services division explored the
improvement of productivity and alternative
future growth paths. A new operating model
and an ERP system (KIITO) that supports it
were deployed in the property maintenance
and cleaning businesses. The Facility Services
division will use KIITO to achieve leadership in
the management and transparency of service
production and to promote data-driven man-
agement.
In the Technical Services division, a competi-
tive strategy for the Swedish businesses was
created as part of the integration of the Swed-
ish operations acquired in September 2017.
The division’s Finnish businesses specified the
position they aim to achieve in the market and
deployed a new operating model along with an
ERP system (KIITO) to support it, with the aim
of improving production management and the
customer experience.
The Renewable Energy Sources division ana-
lysed the dramatically changing business en-
vironment and specified its market positioning.
The procurement organisation was developed
and strengthened in response to growing
demand. Efforts to increase supply chain effi-
ciency continued in line with strategy.
Progress in regulation that supports the circular economy
The EU continued the implementation of
its multi-year circular economy package in
2018. The package is a comprehensive set of
strategies and regulatory reforms aimed at
the sustainable and efficient use of existing
resources. The shift to a circular economy will
take place over the next 10–15 years and it will
provide all of L&T’s businesses a wealth of new
market opportunities.
In the area of energy and climate policy,
concerns about the adequacy of climate
change mitigation measures grew following a
new report by the IPCC. At the EU and national
level, this is reflected in a desire to eliminate
fossil fuels on an even faster schedule than
previously agreed. Achieving the targets calls
for radical reforms to increase the use of
renewable energy, improve energy efficiency,
promote the reuse of materials and introduce
lower-emission transport solutions. This pre-
sents opportunities for L&T, as the company’s
services are closely linked to helping custom-
ers realise their environmental responsibility
objectives.
16
LASSILA & TIKANOJA / FINANCIAL REVIEW 2018
CORPORATE GOVERNANCE / REPORT BY THE BOARD OF DIRECTORS / KEY FIGURES / FINANCIAL STATEMENTS

Group net sales and financial performanceNet sales for 2018 increased by 13.1% to
EUR 802.2 million (709.5). The rate of organic
growth was 3.2%. Operating profit totalled EUR
47.6 million (44.0), representing 5.9% (6.2) of
net sales. Earnings per share were EUR 0.89
(0.87).
Of the growth in net sales, 3.2% was organic
and the remainder was due to the L&T FM
acquisition. Full-year net sales grew in all
divisions except Facility Services. The Envi-
Target 2018 2017
Growth 5% 13.1% 7.2%
Return on invested capital 20% 12.7% 13.3%
Operating profit 9% 5.9% 6.2%
Gearing 0–70% 46.1% 54.2%
ronmental Services division’s market position
improved particularly in the retail and industrial
segments. In Industrial Services, both net sales
and operating profit showed year-on-year
growth thanks to new customer accounts. The
net sales and operating profit of Facility Ser-
vices decreased particularly due to intensified
price competition in the cleaning business and
the ERP system’s deployment phase. In the
Technical Services division, business devel-
oped favourably, particularly in Sweden, thanks
to strong demand and improved productivity.
Income statement by quarter
EUR million 10–12/2018 7–9/2018 4–6/2018 1–3/2018 10–12/2017
Net sales
Environmental Services 68.5 69.6 69.3 62.8 66.0
Industrial Services 25.2 25.9 26.3 19.2 23.9
Facility Services 62.1 63.2 66.0 65.8 70.2
Technical Services 41.6 34.8 35.6 36.4 38.4
Renewable Energy Sources 12.1 5.5 8.4 14.7 10.7
Interdivision net sales -3.1 -2.6 -2.7 -2.4 -3.2
Total 206.5 196.3 203.0 196.5 206.1
Operating profit
Environmental Services 8.3 10.6 8.4 4.4 6.9
Industrial Services 2.6 3.7 3.3 0.4 2.6
Facility Services 0.0 4.1 1.4 -0.5 1.4
Technical Services 1.6 1.6 0.6 0.7 1.2
Renewable Energy Sources 0.1 0.1 -0.3 0.1 0.2
Group administration and other -0.9 -0.6 -0.7 -1.3 -0.9
Total 11.7 19.6 12.6 3.7 11.4
Adjusted operating profit
Environmental Services 8.4 10.7 8.5 4.5 7.0
Industrial Services 2.6 3.8 3.3 0.4 2.6
Facility Services 0.0 4.1 1.4 -0.5 1.5
Technical Services 2.2 2.1 1.2 1.3 2.0
Renewable Energy Sources 0.1 0.1 -0.3 0.1 0.2
Group administration and other -0.9 -0.6 -0.7 -1.3 -0.9
Total 12.4 20.3 13.4 4.5 12.4
Operating margin
Environmental Services 12.0 15.2 12.1 7.0 10.4
Industrial Services 10.4 14.4 12.4 2.2 10.7
Facility Services 0.0 6.5 2.1 -0.8 2.0
Technical Services 3.8 4.5 1.7 1.9 3.1
Renewable Energy Sources 0.6 2.6 -3.3 0.5 2.1
Total 5.7 10.0 6.2 1.9 5.5
Financial income and expenses, net -1.0 -1.4 -1.1 -0.9 -1.3
Share of the result of associated companies 0.0 0.0 -0.3 -0.1 0.0
Profit before tax 10.6 18.2 11.1 2.8 10.0
Financial targets for the strategy periodThe progress made in the implementation of
strategy did not warrant any changes to L&T’s
strategic targets in 2018. The targets will be
reviewed in conjunction with the development
of strategy in 2019.
17
LASSILA & TIKANOJA / FINANCIAL REVIEW 2018
CORPORATE GOVERNANCE / REPORT BY THE BOARD OF DIRECTORS / KEY FIGURES / FINANCIAL STATEMENTS
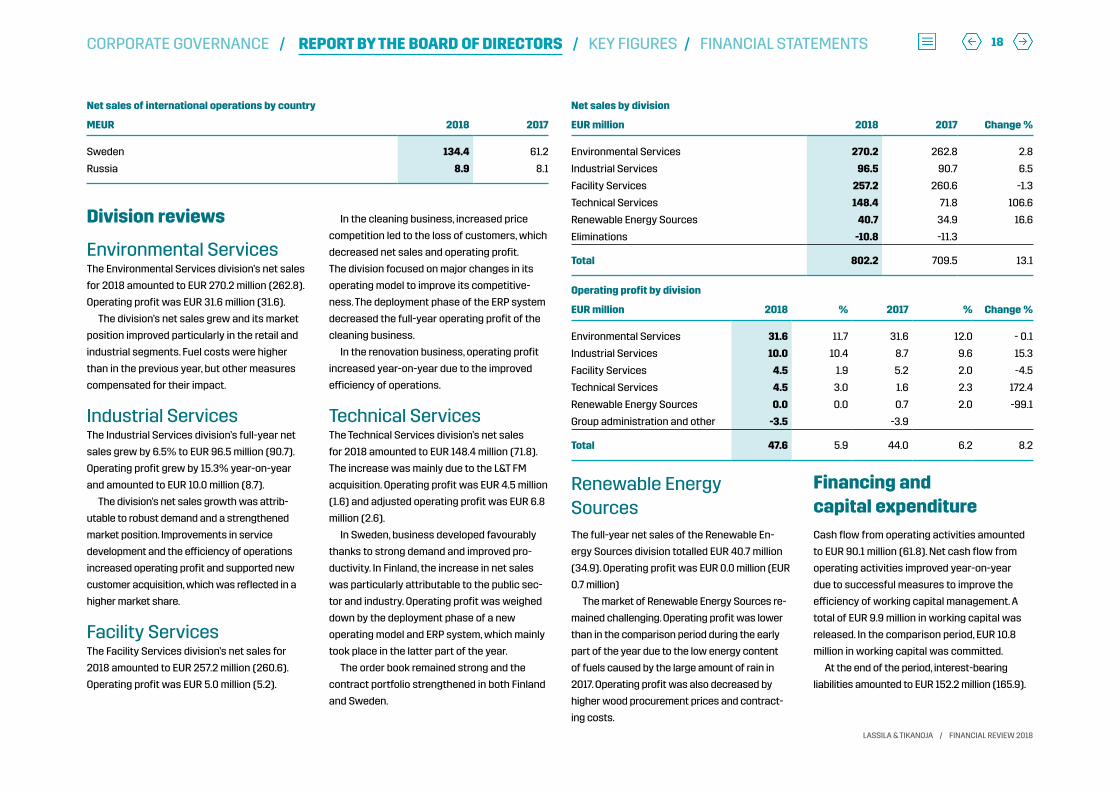
Net sales of international operations by country
MEUR 2018 2017
Sweden 134.4 61.2
Russia 8.9 8.1
Net sales by division
EUR million 2018 2017 Change %
Environmental Services 270.2 262.8 2.8
Industrial Services 96.5 90.7 6.5
Facility Services 257.2 260.6 -1.3
Technical Services 148.4 71.8 106.6
Renewable Energy Sources 40.7 34.9 16.6
Eliminations -10.8 -11.3
Total 802.2 709.5 13.1
Operating profit by division
EUR million 2018 % 2017 % Change %
Environmental Services 31.6 11.7 31.6 12.0 - 0.1
Industrial Services 10.0 10.4 8.7 9.6 15.3
Facility Services 4.5 1.9 5.2 2.0 -4.5
Technical Services 4.5 3.0 1.6 2.3 172.4
Renewable Energy Sources 0.0 0.0 0.7 2.0 -99.1
Group administration and other -3.5 -3.9
Total 47.6 5.9 44.0 6.2 8.2
Division reviews
Environmental ServicesThe Environmental Services division’s net sales
for 2018 amounted to EUR 270.2 million (262.8).
Operating profit was EUR 31.6 million (31.6).
The division’s net sales grew and its market
position improved particularly in the retail and
industrial segments. Fuel costs were higher
than in the previous year, but other measures
compensated for their impact.
Industrial ServicesThe Industrial Services division’s full-year net
sales grew by 6.5% to EUR 96.5 million (90.7).
Operating profit grew by 15.3% year-on-year
and amounted to EUR 10.0 million (8.7).
The division’s net sales growth was attrib-
utable to robust demand and a strengthened
market position. Improvements in service
development and the efficiency of operations
increased operating profit and supported new
customer acquisition, which was reflected in a
higher market share.
Facility ServicesThe Facility Services division’s net sales for
2018 amounted to EUR 257.2 million (260.6).
Operating profit was EUR 5.0 million (5.2).
In the cleaning business, increased price
competition led to the loss of customers, which
decreased net sales and operating profit.
The division focused on major changes in its
operating model to improve its competitive-
ness. The deployment phase of the ERP system
decreased the full-year operating profit of the
cleaning business.
In the renovation business, operating profit
increased year-on-year due to the improved
efficiency of operations.
Technical ServicesThe Technical Services division’s net sales
for 2018 amounted to EUR 148.4 million (71.8).
The increase was mainly due to the L&T FM
acquisition. Operating profit was EUR 4.5 million
(1.6) and adjusted operating profit was EUR 6.8
million (2.6).
In Sweden, business developed favourably
thanks to strong demand and improved pro-
ductivity. In Finland, the increase in net sales
was particularly attributable to the public sec-
tor and industry. Operating profit was weighed
down by the deployment phase of a new
operating model and ERP system, which mainly
took place in the latter part of the year.
The order book remained strong and the
contract portfolio strengthened in both Finland
and Sweden.
Renewable Energy SourcesThe full-year net sales of the Renewable En-
ergy Sources division totalled EUR 40.7 million
(34.9). Operating profit was EUR 0.0 million (EUR
0.7 million)
The market of Renewable Energy Sources re-
mained challenging. Operating profit was lower
than in the comparison period during the early
part of the year due to the low energy content
of fuels caused by the large amount of rain in
2017. Operating profit was also decreased by
higher wood procurement prices and contract-
ing costs.
Financing and capital expenditureCash flow from operating activities amounted
to EUR 90.1 million (61.8). Net cash flow from
operating activities improved year-on-year
due to successful measures to improve the
efficiency of working capital management. A
total of EUR 9.9 million in working capital was
released. In the comparison period, EUR 10.8
million in working capital was committed.
At the end of the period, interest-bearing
liabilities amounted to EUR 152.2 million (165.9).
18
LASSILA & TIKANOJA / FINANCIAL REVIEW 2018
CORPORATE GOVERNANCE / REPORT BY THE BOARD OF DIRECTORS / KEY FIGURES / FINANCIAL STATEMENTS

Key figures for financing
2018 2017
Interest-bearing liabilities, EUR million 152.2 165.9
Net interest-bearing liabilities, EUR million 97.8 117.9
Net finance costs, EUR million -4.5 -1.4
Net finance costs, % of net sales 0.6 0.2
Net finance costs, % of operating profit 9.4 3.2
Equity ratio, % 38.6 38.6
Gearing, % 46.1 54.2
Cash flow from operating activities, EUR million 90.1 61.8
Change in working capital in the cash flow statement, EUR million 9.9 -10.8
Capital expenditure by balance sheet item
EUR million 2018 2017
Real estate 1.2 2.8
Machinery, equipment and other property, plant and equipment 31.0 33.7
Goodwill and other intangible rights arising from business acquisitions 0.3 69.2
Other intangible assets 5.2 7.1
Other non-current assets 0.0 0.5
L&T total 37.8 113.2
Capital expenditure by division
EUR million 2018 2017
Environmental Services 20.6 24.8
Industrial Services 8.4 9.0
Facility Services 6.9 10.1
Technical Services 1.7 68.6
Renewable Energy Sources 0.2 0.2
Group administration and other 0.0 0.4
L&T total 37.8 113.2
Invested capital
EUR million 31.12.2018 31.12.2017
Non-current assets 356.0 367.2
Inventories and receivables 153.2 162.1
Liquid assets 54.3 48.1
Deferred tax liability -29.3 -29.2
Trade and other payables -162.4 -156.0
Provisions -5.3 -7.0
Other non-interest-bearing liabilities -1.9 -1.8
Invested capital 364.5 383.3
Net interest-bearing liabilities totalled EUR
97.8 million (117.9), a decrease of EUR 21.3 million
from July–September and EUR 20.1 million
year-on-year.
In September, the company issued senior
unsecured notes in the amount of EUR 50 mil-
lion, maturing in 2023. The funds from the issue
were used for partial redemption of Lassila &
Tikanoja’s outstanding EUR 30 million notes due
2019 and for the repayment of a EUR 20 million
loan provided by Danske Bank A/S.
Net financial expenses in 2018 amounted to
EUR 4.5 million (1.4). Net financial expenses were
0.6% (0.2) of net sales. Net financial expenses
in the comparison period were substantially
reduced by exchange rate gains realised from
currency hedging related to the L&T FM acqui-
sition.
The average interest rate on long-term loans
(with interest rate hedging) was 1.2% (1.1). Loans
totalling EUR 3.9 million will mature in 2019.
The equity ratio was 38.6% (38.6) and the
gearing rate was 46.1 (54.2). Liquid assets at the
end of the period amounted to EUR 54.3 million
(48.1).
The EUR 100 million commercial paper
programme was entirely unused at the end
of the period. EUR 20 million was in use in the
comparison period. A committed limit totalling
EUR 30.0 million was not in use, as was the case
in the comparison period.
Gross capital expenditure in 2018 totalled
EUR 37.8 million (113.2), consisting primarily
of machine and equipment purchases and
investments in information systems. The most
significant investment in the comparison period
was the acquisition of L&T FM AB.
19
LASSILA & TIKANOJA / FINANCIAL REVIEW 2018
CORPORATE GOVERNANCE / REPORT BY THE BOARD OF DIRECTORS / KEY FIGURES / FINANCIAL STATEMENTS

Loans, liabilities and contingent liabilities to related partiesRelated-party transactions are accounted for
in the consolidated financial statements, in
Note 32: Related-party transactions.
Changes in Group structureThe Group acquired the business operations
of Kymen Talopalvelu Oy.
Changes in L&T’s managementOn 3 August, L&T announced that Pekka Ojan-
pää was to leave his post as the company’s
President and CEO on 3 February 2019 at the
latest to become the President and CEO of
Suominen Corporation. On 15 November, the
company announced that Eero Hautaniemi,
M.Sc. (Econ.), had been appointed as L&T’s new
President and CEO starting from 1 January 2019.
On 24 November, the company announced that
President and CEO Pekka Ojanpää had died in
an aviation accident. CFO Tuomas Mäkipeska
was appointed as L&T’s interim President and
CEO.
PersonnelIn 2018, the average number of employees
converted into full-time equivalents was 7,566
(7,875). At the end of the period, L&T’s had
8,600 (8,663) full-time and part-time employ-
ees. Of these, 6,871 (7,041) worked in Finland
and 1,729 (1,622) in other countries.
Resolutions by the Annual General MeetingThe Annual General Meeting, which was held on
15 March 2018, adopted the financial state-
ments and consolidated financial statements
for 2017 and released the members of the
Board of Directors and the President and CEO
from liability.
The Annual General Meeting resolved that
a dividend of EUR 0.92 per share, totalling EUR
35.3 million, be paid on the basis of the balance
sheet adopted for the financial year 2017. It
was decided that the dividend be paid on 26
March 2018.
The Annual General Meeting confirmed the
number of members of the Board of Directors
as six. Heikki Bergholm, Teemu Kangas-Kärki,
Laura Lares, Sakari Lassila, Miikka Maijala and
Laura Tarkka were re-elected to the Board
until the end of the following Annual General
Meeting.
KPMG Oy Ab, Authorised Public Accountants,
was elected auditor. KPMG Oy Ab named Lasse
Holopainen, Authorised Public Accountant, as
its principal auditor.
The resolutions of the Annual General Meet-
ing were announced in more detail in a stock
exchange release on 15 March 2018.
Statement of non-financial information Responsibility is an integral aspect of L&T’s
strategy, business operations and day-to-day
work. The Group’s services play a key role in
ensuring the responsibility of its customers,
which drives the Group to strive for continu-
ously improving results in recovering materials,
reducing emissions and maintaining the work
ability of personnel. Through its services, L&T
is a prominent participant in the day-to-day
workings of society, which is why it must make
no compromises when it comes to regulatory
compliance in its operations. Suppliers are also
required to comply with regulations, agree-
ments and L&T’s responsibility principles.
In 2018, the company made a commitment to
support the UN Global Compact initiative and
its principles pertaining to human rights, labour,
the environment and anti-corruption.
Managing corporate responsibilityManaging corporate responsibility is part of
the daily management and development of
business operations at L&T, and it is controlled
via strategic and annual planning and the
company’s management system. The compa-
ny’s management system has been certified in
accordance with the following standards: ISO
Employees by country at year end
Full-time and part-time, total 2018 2017
Finland 6,871 7,041
Sweden 1,422 1,332
Russia 307 290
Total 8,600 8,663
9001 (quality), ISO 14001 (environment) and
OHSAS 18001 (occupational health and safety).
The Group Executive Board is responsible
for the strategic management of corporate
responsibility, and operational measures are
governed by the corporate responsibility pro-
gramme. The Group Executive Board regularly
monitors the progress of the programme
and the projects launched to support its
implementation. The Group Executive Board
also evaluates and, if necessary, updates
the targets of the programme. The corporate
responsibility programme is confirmed by the
Board of Directors.
In 2018, L&T revised its corporate responsi-
bility programme to link it even more closely to
the company’s strategic priorities and stake-
holder expectations. The company’s focus in
the development of responsibility was shifted
to the impact of operations and the value
that the company creates together with its
customers for its key stakeholders, society, the
environment and the climate. At the same time,
the responsibility programme was linked to the
UN Sustainable Development Goals (SDGs) and
the Global Compact.
20
LASSILA & TIKANOJA / FINANCIAL REVIEW 2018
CORPORATE GOVERNANCE / REPORT BY THE BOARD OF DIRECTORS / KEY FIGURES / FINANCIAL STATEMENTS

L&T’s corporate responsibility programme
and activities are described in more detail in
the 2018 corporate responsibility report, which
is published as part of the company’s Annual
Report 2018. The report has been prepared in
compliance with the Global Reporting Initiative
(GRI) reporting guidelines. Key environmental
responsibility and responsibility for personnel
indicators are assured by a third party.
Corporate responsibility principles and risk managementIn its decision-making and administration,
Lassila & Tikanoja complies with the Finnish
Companies Act, other regulations governing
listed companies, Articles of Association of
Lassila & Tikanoja plc, charters of L&T’s Board
of Directors and its committees and the rules
and guidelines of Nasdaq Helsinki Ltd. L&T’s
operations are also guided by the policies and
operating principles approved by the Board of
Directors or the Group Executive Board. The
guidelines on authorisation on the basis of
position specify the decision-making rules and
authorities applied at L&T.
To ensure the regulatory compliance of its
operations, L&T has documented its responsi-
ble business principles in its Code of Conduct,
which applies to all L&T employees as well
as contract suppliers. The management is
responsible for ensuring the personnel’s famil-
iarity with the Code of Conduct and monitoring
compliance with the guidelines. All L&T em-
ployees must follow the L&T Code of Conduct
as well as prevent actions that are contrary to
guidelines and instructions. Violations of the
Code of Conduct are primarily reported to the
immediate supervisor. Immediate supervisors
assist in the interpretation of guidelines in
ambiguous situations. Employees can also
use a confidential reporting channel by phone
or e-mail. The channel is available in all of the
Group’s operating countries. L&T responds to all
incidents of non-compliance without delay, in
accordance with a jointly agreed process.
All new L&T employees studied the Code
of Conduct as part of their induction training
programme in 2018. In autumn 2018, the Code
of Conduct and the online course that supports
its practical application were updated to cor-
respond to the GDPR requirements concerning
the processing of personal data. In addition,
certain other sections, such as the anti-dis-
crimination guidelines, were specified further
in the spirit of the UN Global Compact. 93.3%
of salaried employees in Finland completed the
updated online course by the end of the year.
In 2019, employees in Sweden and Finland will
familiarise themselves with the revised Code of
Conduct as applicable.
Managing responsibility-related risks
is part of the Group’s comprehensive risk
management. The risk management process is
described in the Corporate Governance State-
ment and the key risks are explained under
“Risks and risk management”.
Environmental responsibilityL&T puts environmental responsibility into
practice particularly through the services
it produces for customers. The primary goal
is always to direct materials collected from
customers to reuse or recycling, guided by
the order of priority stipulated by law and
the circular economy approach. L&T aims to
mitigate climate change not only by reducing
the transport emissions of its own operations,
but even more significantly, by replacing fossil
fuels with biofuels and solid recovered fuels
and replacing virgin natural resources with
secondary raw materials. A further objective is
that no environmental offences or serious inci-
dents of environmental damage should result
from the Group’s own operations.
L&T’s environmental policy specifies the
environmental aspects and principles that the
Group observes in both its own operations as
well as in the services it produces for custom-
ers. The Group’s operations are founded on an
uncompromising compliance with environ-
mental legislation and standards as well as
on the principle of continuous improvement in
accordance with the ISO 14001 certified envi-
ronmental management system.
Professional waste treatment operations are
subject to environmental permits and regula-
tory compliance. In 2018, L&T had 73 (70) en-
vironmental permits that determined how the
Group managed and monitored environmental
matters. Facilities subject to environmental
permits have contingency plans and rescue
plans that determine how they are prepared for
significant environmental incidents. Environ-
mental issues are also covered in regularly
conducted internal audits.
L&T requires responsible management
of environmental issues of its partners and
suppliers. This requirement is factored into
the procurement process e.g. in the form of
self-assessments. Waste is only handed over
to operators that are authorised to receive or
process it. Acquisitions are subject to detailed
due diligence processes.
The most significant environmental risks
involved in L&T’s operations are related to the
fleet, waste storage and processing as well as
chemical safety. These risks and their manage-
ment are described in more detail under “Risks
and risk management”.
Compliance with the operating principles, results and performance indicatorsTo reduce the environmental impact of the
materials collected from customers and to
promote the circular economy, L&T continu-
ously strives to find new solutions to recover
materials at the highest possible refining rate
and in accordance with the order of priority
in waste management. In 2018, the reuse and
21
LASSILA & TIKANOJA / FINANCIAL REVIEW 2018
CORPORATE GOVERNANCE / REPORT BY THE BOARD OF DIRECTORS / KEY FIGURES / FINANCIAL STATEMENTS

recycling rate of waste collected from the
company’s customers rose to 54.2% (53.8). At
L&T’s volume, this meant that the total amount
of materials reused and recycled was nearly
40,000 tonnes higher than in the previous year.
The report covers municipal waste collected
from corporate customers, hazardous waste,
industrial waste and construction waste both
in Finland and in Russia.
To mitigate climate change, L&T strives to
reduce its customers’ emissions as well as the
emissions arising from its own operations. The
company’s operations have a considerable
carbon handprint, meaning that it generates
significant emission reductions for custom-
ers by enabling them to replace virgin raw
materials with secondary raw materials, fossil
fuels with biofuels and solid recovered fuels,
or reduce waste. L&T’s carbon handprint, or the
emission reductions created by its operations,
totalled about 1.2 million (1.1) CO2 equivalent
tonnes in 2018.
The emissions generated by collection and
transport services are the most significant di-
rect environmental impact of L&T’s operations.
In 2018, L&T’s own operations generated 64.4
thousand CO2 equivalent tonnes of emissions
(59.6). Absolute emissions increased year-
on-year due to the L&T FM acquisition and
the higher volume of collection and transport
operations. However, the emission intensity, or
the ratio of emissions to net sales, fell to 59.5
CO2 equivalent tonnes (66.2) per million euros.
In the CDP Climate report, which evaluates
companies’ climate-related efforts, L&T again
achieved the Leadership level with a rating of
A-, the second-best rating in the system. The
company has also made a commitment to
set Science-Based Targets for its long-term
climate efforts.
No major environmental damage incidents
occurred in the company’s operations in 2018.
Social responsibility: employees and human rights As a major employer and service enterprise,
the focus of L&T’s social responsibility is on
the Group’s employees. The material aspects of
L&T’s responsibility for its employees include
maintaining the work ability of L&T personnel,
improving occupational safety, increasing job
satisfaction and promoting diversity in employ-
ment. The company does not tolerate the use
of child labour, any form of forced labour or any
other practices in violation with basic human
rights in its own operations or as part of its
supply chain.
L&T observes the UN Declaration of Human
Rights and workers’ rights as defined by the
International Labour Organisation (ILO). L&T is
committed to supporting the UN Global Com-
pact initiative and its principles pertaining to
human rights and labour.
National legislation, agreements and
other obligations are applied in employment
relationships. L&T respects the employees’
freedom to unionise. L&T monitors its person-
nel’s compliance with collective agreements,
environmental legislation, labour law, occu-
pational safety legislation and regulations
pertaining to financial management. The Group
is also compliant with the applicable legislation
governing contractors’ obligations and liability,
and requires the same of its suppliers.
The operations are guided by the Group’s
personnel policy, the OHSAS 18001 certified
management system and the principles gov-
erning occupational safety management and
responsible business (Code of Conduct).
The most significant personnel risks in
L&T’s operations are related to the availability
of competent and motivated employees, the
potential weakening of job satisfaction and the
potential increase of costs related to disabil-
ities and accidents. Risks related to human
rights have been assessed as part of the risk
management process. However, as L&T mainly
operates in Finland and Sweden with local
partners, no significant risks related to human
rights have been identified in the Group’s oper-
ations. These risks and their management are
described in more detail under “Risks and risk
management” in this document.
Compliance with the operating principles, results and performance indicatorsAs part of work ability management, L&T’s
objectives are to reduce sickness-related
absences and raise the average retirement
age. In 2018, the sickness-related absence rate
was 5.0% (4.8) in Finland, 5.1% (4.5) in Sweden
and 2.7% (2.5) in Russia. The development of
the rates of absence was not in line with the
company’s objectives. A detailed action plan
will be drafted in 2019 to reduce sickness-relat-
ed absences by investigating the root causes
of absences and ways to promote health.
However, the average retirement age (including
retirement on old-age pension and disability
pension) developed more favourably, rising
to 63.2 years (63.0) in Finland and 63.2 years
in the Group as a whole (63,0). The long-term
target is to increase the retirement age to 65.0
years.
In occupational safety, L&T pursues continu-
ous improvement with an ultimate goal of zero
accidents. The overall accident rate in Finland
developed favourably in 2018 and stood at
28 (30). The Group-level overall accident rate
remained on a par with the previous year at 25
(25). LTA, which measures accidents leading
to lost time, was also unchanged at 14 (14).
The number of proactive measures to promote
occupational safety reached another new
record. One of the development areas for 2019
is to make more effective use of proactive
measures by targeting activities where they
are needed the most.
One fatal accident occurred late in the year
when an experienced L&T employee died in
an accident while cleaning a production line
at a food production facility. The company
immediately conducted an in-depth investiga-
tion of the accident and its causes. Based on
the results of the investigation, we have taken
the necessary measures to prevent similar
incidents from occurring. The official investi-
gation of the incident had not been completed
22
LASSILA & TIKANOJA / FINANCIAL REVIEW 2018
CORPORATE GOVERNANCE / REPORT BY THE BOARD OF DIRECTORS / KEY FIGURES / FINANCIAL STATEMENTS

by the date of publication of this report. L&T
is co-operating with the authorities on the
investigation.
Employee satisfaction showed positive
development in 2018. According to an employee
satisfaction survey conducted in Finland and
Sweden, the employees’ confidence in the
company and its future has improved. L&T
employees feel their work is meaningful and
72% of them are prepared to recommend the
company as an employer. The company aims
to increase the employee promoter score
further by investing in improving the employee
experience.
In 2018, L&T joined Society’s Commitment to
Sustainable Development, a Finnish initiative,
under which the company committed to taking
goal-driven action to extend careers as well
as employ young people, immigrants and
people who struggle to find jobs. The company
also joined forces with the Kide Foundation,
which promotes human rights and participa-
tion, to launch Meaningful Work, a two-year
project that will provide new ways to prevent
the risk of disability retirement. The project
aims to create innovative methods to support
traditional rehabilitation and provide people at
risk of retirement with opportunities to work
in appropriate proportion to their abilities and
resources.
There were no grievances related to human
rights or reported incidents of discrimination at
L&T in 2018.
Anti-corruption and briberyL&T’s procurement processes are transpar-
ent and procurement decisions are based on
competitive supply contracts. Procurement is
guided by the Group’s procurement principles
and the more detailed procurement guidelines.
Mandates and the limits for decision-making
in terms of procurement are defined in the
company’s guidelines on authorisation on the
basis of position.
In case of potential conflicts of interests in
procurement processes, the persons concerned
are disqualified from the decision-making. Sup-
plier co-operation must not involve any bribery
or the kind of hospitality or exchange of gifts
that could influence procurement decisions.
L&T is committed to supporting the UN Global
Compact initiative and its anti-corruption
principles. The prevention of corruption and
bribery is based on national legislation and
agreements. Internally, operations are guided
by L&T’s responsible business principles
(Code of Conduct), which include anti-bribery
and corruption guidelines related to, among
other things, accepting and offering gifts and
hospitality as well as the avoidance of conflicts
of interest. The company also adheres to a
separately defined permit procedure to ensure
that all customer events are appropriate and
that all sponsorships and supporting marketing
operations are transparent.
L&T mainly operates with local partners in
Finland and Sweden, which improves transpar-
ency with respect to its partners’ responsibil-
ity. Operations with significant suppliers are
managed through regular supplier co-operation
and monitored according to category-specific
performance indicators. Contract suppliers are
required to comply with L&T’s Code of Conduct.
We ensure the responsibility of our suppliers’
operating methods through self-assessment
surveys, supplier audits, analyses of suppliers’
financial circumstances or other appropriate
means. Our primary assurance measures are
targeted at our most significant suppliers.
There were no incidents of bribery or corrup-
tion at L&T in 2018.
Research and development Research expenditure is recognised as an ex-
pense during the period in which it is incurred.
Development expenditure is capitalised when
the company can demonstrate the technical
feasibility and commercial potential of the
product under development and when the
acquisition cost can be reliably determined.
Other development expenditure is recognised
as an expense.
The company’s current capitalised develop-
ment expenditure is mainly related to software
and system projects. Development expenditure
of EUR 4.6 million (5.7) on software projects
was capitalised in the balance sheet. Costs of
software projects are capitalised starting from
the time when the projects move out of the
research phase into the development phase
and the outcome of the project is an itemisable
intangible asset.
For the most part, the goal of product
development recognised as an expense in
the income statement is to give L&T’s service
offering a competitive edge and thereby to help
the company achieve its growth targets.
Risk management L&T has a defined risk management process
that includes a review of financial, strategic,
operational and damage-related risks.
Key risk management principlesRisk management at L&T aims to identify
significant risk factors, prepare for them and
manage them in an optimal way so that the
company’s strategic and financial objectives
are achieved. Comprehensive risk management
endeavours to manage the Group’s risk as a
whole and not just individual risk factors. The
risk management process also aims to assess
the opportunities associated with risks.
ResponsibilitiesThe principles of L&T’s risk management are
approved by the company’s Board of Directors.
The Board monitors the implementation of
risk management and assesses the efficiency
of the methods employed. The President and
CEO is responsible for the organisation and
implementation of risk management. Risk man-
agement at L&T Group is controlled by the risk
management policy confirmed by L&T’s Board
of Directors. The policy specifies the objectives
and principles, organisation and responsibilities
and procedures of the Group’s risk manage-
ment. The Group’s financing policy confirmed
by L&T’s Board of Directors is followed in the
23
LASSILA & TIKANOJA / FINANCIAL REVIEW 2018
CORPORATE GOVERNANCE / REPORT BY THE BOARD OF DIRECTORS / KEY FIGURES / FINANCIAL STATEMENTS

management of financial risks. The principles
for insurance risk management are specified in
the insurance policy.
Identification, assessment and reporting of risksRisks are surveyed regularly and systemati-
cally at both division and company level and in
central functions considered to be critical. The
significance of risks is assessed by a risk ma-
trix. Measures for managing and minimising the
identified risks are prepared and responsibility
for these measures is allocated to specified
individuals or units. The most significant risks
identified and the preparations for them are
regularly reported to the President and CEO and
the Board of Directors.
Risk analysis
The section Strategic and operative risks
describes the most important strategic, opera-
tional and damage-related risks of L&T’s busi-
ness which, if realised, can endanger or prevent
the achievement of business objectives. Finan-
cial risks and their management are described
in Note 35 Financial Risk Management.
Strategic and operative risksResponsibility
As an environmental services company and
a major employer, operating responsibly is
essential for the company’s reputation and
stakeholder trust. The company continuously
monitors changes and trends affecting its busi-
ness environment in relation to, for example,
climate targets, human rights and supply chain
responsibility, with the aim of identifying the
related risks and opportunities.
In 2018, the potential human rights risks as-
sociated with L&T’s operations were reviewed
as part of the risk management process. To
manage climate risks, the company has made
a commitment to set Science-Based Targets
within the next two years. The company is also
active in taking practical measures to directly
reduce its environmental impacts. This includes
fleet replacements and monitoring the driving
style index. Risks related to personnel and re-
sponsibility for personnel are described in more
detail in the Personnel section.
ICT systems
If realised, risks associated with information
and communications systems can affect
L&T’s operations and customer service. The
risks are minimised by engaging in systematic
efforts to develop the systems environment
and ensure the reliability of the ICT environ-
ment. These efforts include identifying which
systems are critical to operations and defining
the allocation of responsibilities between the
system vendors and L&T. The risks related to
ICT systems are also managed by developing
the system architecture and making long-term
investments aimed at eliminating the repair
backlog and increasing competitiveness.
Markets and renewal
Changes in markets and the market environ-
ment, such as municipalisation and market
changes pertaining to recycled raw materials,
as well as the market price development of
emission rights, secondary raw materials
and oil products may have an unfavourable
effect on the Group’s business operations and
business growth and lead to lower profitability.
L&T is not dependent on single large customers,
which, together with L&T’s extensive service
offering, helps reduce market-related risks. As
a means of standing out from its competitors
and creating value-adding elements other
than price, L&T is continuously developing and
launching new service products. To prepare
for market risks, L&T pays special attention to
productivity improvement and customer care.
L&T’s strategies are systematically implement-
ed with a long-term perspective. They take into
account potential changes in the industry as
well as the need for renewal and the necessary
related measures to ensure profitability. At the
same time, L&T actively monitors the market
situation and legislative developments and
strives to proactively influence them.
Acquisitions
L&T seeks growth both organically and through
acquisitions. The success of acquisitions affects
the achievement of the company’s growth and
profitability targets. Failures in acquisitions may
impact the company’s competitiveness and
profitability and may change the company’s risk
profile. Risk related to acquisitions is managed
through contracts of sale, strategic and financial
analysis of acquisition targets, comprehensive
due diligence processes and particularly by
carrying out efficient integration programmes
after transactions are completed.
Personnel
The availability of competent and motivated
workers is a significant personnel-related risk
due to the labour-intensive nature of the indus-
try and the seasonality of the demand for labour.
The population age structure also intensifies the
competition for labour. The potential deteriora-
tion of employee satisfaction is also a strategic
risk for the company if the organisation fails
to respond to it in a timely manner. L&T aims to
be the most attractive employer in its sector.
Risks are managed by investing in employee
availability and retention through the develop-
ment of the employee experience and employer
image. These measures include facilitating
career paths and job rotation as well as the
development of induction training processes
and employee engagement as well as support-
ing effective managerial work. The company
is also active in recruiting people with immi-
grant backgrounds. In addition, L&T focuses on
fostering a good work community, management
and leadership, improving multicultural skills, job
rotation and occupational safety.
An increase in the personnel’s disability and
accident pension costs could materially affect
L&T’s competitiveness and profitability be-
cause, as a major employer, L&T is liable for the
full pension costs arising from employee dis-
ability. The company’s Sirius programme is de-
signed to promote the health of employees and
to manage occupational health care services.
It aims to minimise sickness-related absences
and disability pensions as well as manage their
related costs. L&T regularly conducts job-spe-
cific and site-specific risk assessments and
workplace surveys, and supports the work
24
LASSILA & TIKANOJA / FINANCIAL REVIEW 2018
CORPORATE GOVERNANCE / REPORT BY THE BOARD OF DIRECTORS / KEY FIGURES / FINANCIAL STATEMENTS

ability and well-being of employees through
activities that promote work ability. L&T has
its own workplace fund that supports L&T’s
work ability management and complements
occupational health care. The company also
uses the Suitable Work model that supports
the rehabilitation and employment of people at
risk of disability pension.
Damage-related risks
To cover for unexpected damage risks, L&T
has continuous insurance coverage in all of
the operating countries, including policies for
injuries, property damage, business interruption,
third-party liability, environmental damage and
transport damage.
Risk of fire
A fire at a recycling plant may result in a
momentary or extended interruption of the
plant’s operations. However, the significance
of the risk is reduced by the fact that individual
plants or production lines have no substantial
impact on L&T’s overall profitability. In addition
to taking out insurance, L&T strives to minimise
the risks of fire damage by using contingency
planning, developing first-hand fire extinguish-
ing preparedness and training personnel to
prepare for emergencies.
Risk of environmental damage
L&T’s business includes the collection and
transport of hazardous waste, as well as pro-
cessing at the company’s own plants. Incorrect
handling of hazardous waste or damage to
equipment may result in harmful substances
being released into the environment. L&T may
become liable for damages due to this. In addi-
tion to taking out insurance, L&T manages en-
vironmental damage risks through systematic
environmental surveys of its plants, preventive
equipment maintenance plans, audits and the
long-term training of personnel.
Corporate GovernanceThe Corporate Governance Statement for the
financial year 2018 is provided as a separate
report.
Shares and shareholders
Share capital and number of sharesThere were no changes in Lassila & Tikanoja’s
share capital and number of shares in 2018.
The registered share capital of the company
is EUR 19,399,437. The number of shares is
38,798,874. The average number of shares
excluding the shares held by the company was
38,404,842. Each share carries one vote. The
Articles of Association do not set an upper limit
on the share capital and number of shares. A
share has neither a nominal value nor a book
equivalent value.
The company’s shares are included in the
book-entry system of securities maintained by
Euroclear Finland Ltd. Euroclear Finland main-
tains the company’s official list of shareholders.
ShareholdersLassila & Tikanoja plc had 13,207 (12,208)
registered shareholders at the end of 2018.
Nominee-registered holdings accounted for
19.5% (19.5) of the total number of shares.
Holdings of the Board of Directors and President and CEOThe members of the Board, the President and
CEO, and organisations under their control held
a total of 932,751 shares in the company on 31
December 2018. They represent 2.4% of the
number of shares and votes.
Trading in shares in 2018The company’s shares are quoted on the mid-
cap list of Nasdaq Helsinki Ltd in the Industrials
sector. The trading code is LAT1V and the ISIN
code is FI0009010854.
The volume of trading on Nasdaq Helsinki Ltd
in 2018, excluding the shares held by the com-
pany in Lassila & Tikanoja plc, was 4,994,631
shares, which is 13% (14.3) of the average
number of outstanding shares. The value of
trading was EUR 83.8 million (101.6). The high-
est share price was EUR 20.0 and the lowest
EUR 14.34. The closing price was EUR 14.96.
At the end of the review period, the market
capitalisation excluding the shares held by the
company was EUR 574.6 million (693.5).
Own sharesAt the end of the period, the company held
392,952 of its own shares, representing 1.0% of
all shares and votes.
Authorisation for the Board of DirectorsThe Annual General Meeting held on 15 March
2018 authorised Lassila & Tikanoja plc’s Board
of Directors to make decisions on the repur-
chase of the company’s own shares using the
company’s unrestricted equity. In addition, the
Annual General Meeting authorised the Board
of Directors to decide on a share issue and the
issuance of special rights entitling their holders
to shares.
The Board of Directors is authorised to
purchase a maximum of 2,000,000 company
shares (5.2% of the total number of shares).
The repurchase authorisation is effective for
18 months.
The Board of Directors is authorised to de-
cide on the issuance of new shares or shares
possibly held by the company through a share
issue and/or issuance of option rights or other
special rights entitling to shares, referred to in
Chapter 10, Section 1 of the Finnish Companies
Act, so that under the authorisation a maximum
of 2,000,000 shares (5.2% of the total number
of shares) may be issued and/or conveyed. The
authorisation is effective for 18 months.
Restrictions in voting powerAccording to the Articles of Association, at a
General Meeting of Shareholders no share-
holder may cast more than one fifth of the total
number of votes represented at the meeting.
25
LASSILA & TIKANOJA / FINANCIAL REVIEW 2018
CORPORATE GOVERNANCE / REPORT BY THE BOARD OF DIRECTORS / KEY FIGURES / FINANCIAL STATEMENTS
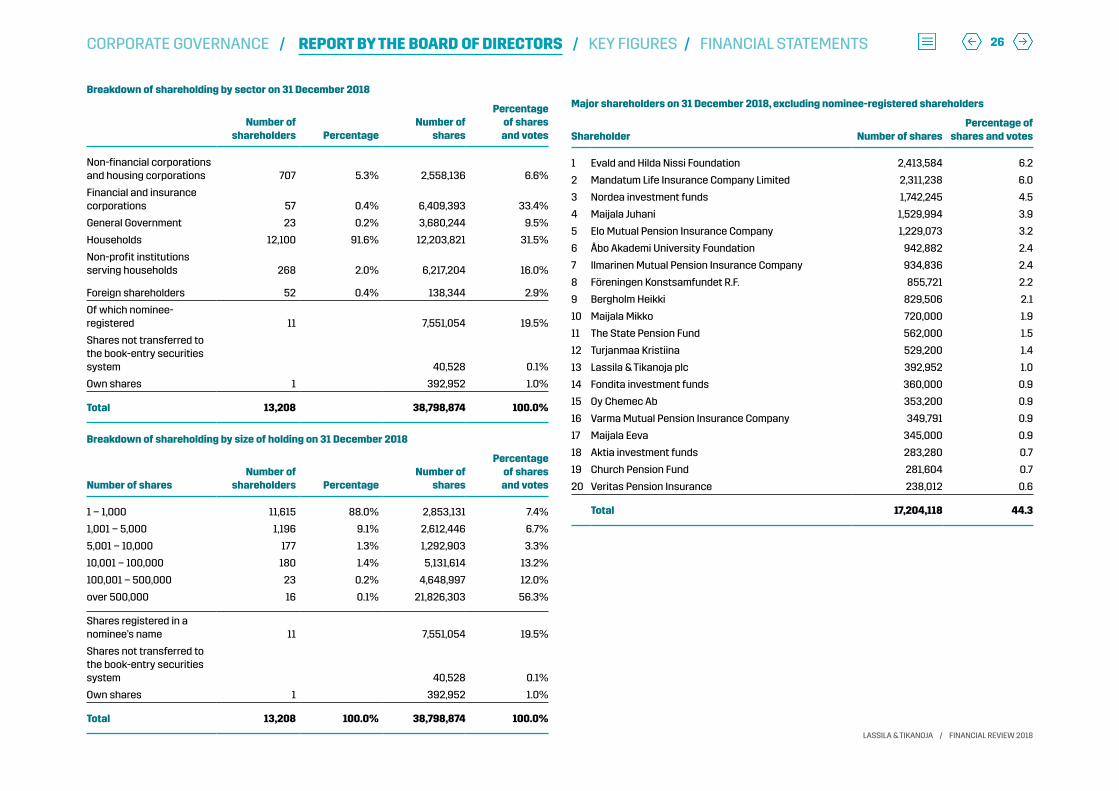
Breakdown of shareholding by size of holding on 31 December 2018
Number of sharesNumber of
shareholders PercentageNumber of
shares
Percentage of shares and votes
1 – 1,000 11,615 88.0% 2,853,131 7.4%
1,001 – 5,000 1,196 9.1% 2,612,446 6.7%
5,001 – 10,000 177 1.3% 1,292,903 3.3%
10,001 – 100,000 180 1.4% 5,131,614 13.2%
100,001 – 500,000 23 0.2% 4,648,997 12.0%
over 500,000 16 0.1% 21,826,303 56.3%
Shares registered in a nominee’s name 11 7,551,054 19.5%
Shares not transferred to the book-entry securities system 40,528 0.1%
Own shares 1 392,952 1.0%
Total 13,208 100.0% 38,798,874 100.0%
Breakdown of shareholding by sector on 31 December 2018
Number of shareholders Percentage
Number of shares
Percentage of shares and votes
Non-financial corporations and housing corporations 707 5.3% 2,558,136 6.6%
Financial and insurance corporations 57 0.4% 6,409,393 33.4%
General Government 23 0.2% 3,680,244 9.5%
Households 12,100 91.6% 12,203,821 31.5%
Non-profit institutions serving households 268 2.0% 6,217,204 16.0%
Foreign shareholders 52 0.4% 138,344 2.9%
Of which nominee-registered 11 7,551,054 19.5%
Shares not transferred to the book-entry securities system 40,528 0.1%
Own shares 1 392,952 1.0%
Total 13,208 38,798,874 100.0%
Major shareholders on 31 December 2018, excluding nominee-registered shareholders
Shareholder Number of sharesPercentage of
shares and votes
1 Evald and Hilda Nissi Foundation 2,413,584 6.2
2 Mandatum Life Insurance Company Limited 2,311,238 6.0
3 Nordea investment funds 1,742,245 4.5
4 Maijala Juhani 1,529,994 3.9
5 Elo Mutual Pension Insurance Company 1,229,073 3.2
6 Åbo Akademi University Foundation 942,882 2.4
7 Ilmarinen Mutual Pension Insurance Company 934,836 2.4
8 Föreningen Konstsamfundet R.F. 855,721 2.2
9 Bergholm Heikki 829,506 2.1
10 Maijala Mikko 720,000 1.9
11 The State Pension Fund 562,000 1.5
12 Turjanmaa Kristiina 529,200 1.4
13 Lassila & Tikanoja plc 392,952 1.0
14 Fondita investment funds 360,000 0.9
15 Oy Chemec Ab 353,200 0.9
16 Varma Mutual Pension Insurance Company 349,791 0.9
17 Maijala Eeva 345,000 0.9
18 Aktia investment funds 283,280 0.7
19 Church Pension Fund 281,604 0.7
20 Veritas Pension Insurance 238,012 0.6
Total 17,204,118 44.3
26
LASSILA & TIKANOJA / FINANCIAL REVIEW 2018
CORPORATE GOVERNANCE / REPORT BY THE BOARD OF DIRECTORS / KEY FIGURES / FINANCIAL STATEMENTS
Profit distribution
Dividend policyThe amount of dividend is tied to the results for
the financial year. Profits not considered nec-
essary for ensuring the healthy development of
the company are distributed to shareholders.
In 2018, the Group’s earnings per share were
EUR 0.89 (0.87) and cash flow from operating
activities per share amounted to EUR 2.35
(1.61). The Board of Directors proposed a
dividend of EUR 0.92 per share to the Annual
General Meeting to be held on 14 March 2019. A
dividend of EUR 0.92 per share was paid for the
financial year 2017.
Near-term uncertainties Challenges related to the availability of labour
may increase production costs and slow down
the growth of net sales.
A decline in the volume of the construction
industry and a slowing down of investment
growth may have an unfavourable effect on the
Group’s operations and business growth and
lead to lower profitability. In addition, market
price development for emission rights, second-
ary raw materials or oil products may have a
negative impact on the company’s business
environment.
Temporary additional costs arising from
establishing the operating model related to
the new ERP system may weigh down on the
company’s result.
Outlook for 2019All of Lassila & Tikanoja’s divisions except Fa-
cility Services have good outlook for 2019. Net
sales and operating profit of Facility Services
are expected to decrease compared to 2018
due to costs related to implementation of the
new operating model and decrease in the
division’s contract base.
Lassila & Tikanoja’s full-year net sales and
operating profit in 2019 are expected to be on
par with 2018.
Events after the balance sheet dateThe company management is not aware of
any events of material importance that might
have affected the preparation of the financial
statements.
27
LASSILA & TIKANOJA / FINANCIAL REVIEW 2018
CORPORATE GOVERNANCE / REPORT BY THE BOARD OF DIRECTORS / KEY FIGURES / FINANCIAL STATEMENTS

Key figures on shares2018 2017 2016** 2015** 2014**
1 Earnings per share (EPS), EUR 0.89 0.87 1.13 0.98 0.47
2 Earnings per share (EPS), diluted, EUR 0.89 0.87 1.13 0.98 0.47
3 Equity per share, EUR 5.53 5.66 5.81 5.51 5.34
4 Dividend per share, EUR * 0.92 0.92 0.92 0.85 0.75
5 Payout ratio, % 103.7 105.4 81.3 86.5 160.0
6 Effective dividend yield, % 6.1 5.1 4.8 4.7 5.0
7 P/E ratio, % 16.9 20.7 17.0 18.4 32.3
8 Cash flow from operating activities per share, EUR 2.35 1.61 1.99 2.33 2.06
Share price adjusted for issues:
9 lowest, EUR 14.34 17.22 14.37 14.54 12.75
10 highest, EUR 20.00 20.89 19.59 18.74 15.84
11 average, EUR 16.78 18.52 16.96 17.25 14.31
12 closing, EUR 14.96 18.06 19.20 18.12 15.14
13 Market capitalization 31 December, MEUR 580.4 700.7 744.9 703.0 584.7
Number of shares adjusted for issue:
14 average during the year 38,404,842 38,394,955 38,375,007 38,589,658 38,728,721
15 at year end 38,405,922 38,398,012 38,378,006 38,361,153 38,617,980
16 average during the year, diluted 38,418,963 38,409,829 38,389,881 38,604,906 38,739,668
17 Adjusted number of shares traded during the year 4,994,631 5,480,149 6,475,324 10,271,667 10,191,394
18 As a percentage of the average 13.0 14.3 16.9 26.6 26.3
19 Volume of shares traded, MEUR 83.8 101.6 110.1 177.2 147.2
* 2018 proposal by the Board of Directors ** IFRS 15 has not been adjusted to comparison years
KEY FIGURES
LASSILA & TIKANOJA / FINANCIAL REVIEW 2018
28CORPORATE GOVERNANCE / REPORT BY THE BOARD OF DIRECTORS / KEY FIGURES / FINANCIAL STATEMENTS
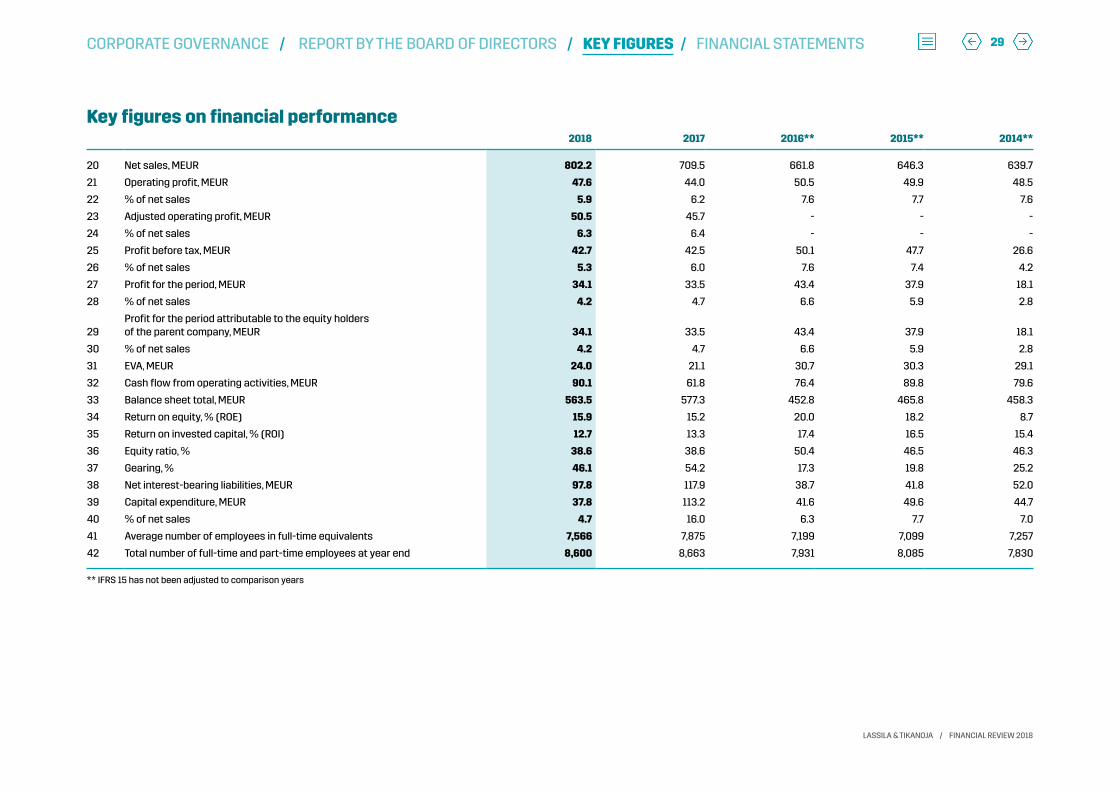
Key figures on financial performance2018 2017 2016** 2015** 2014**
20 Net sales, MEUR 802.2 709.5 661.8 646.3 639.7
21 Operating profit, MEUR 47.6 44.0 50.5 49.9 48.5
22 % of net sales 5.9 6.2 7.6 7.7 7.6
23 Adjusted operating profit, MEUR 50.5 45.7 - - -
24 % of net sales 6.3 6.4 - - -
25 Profit before tax, MEUR 42.7 42.5 50.1 47.7 26.6
26 % of net sales 5.3 6.0 7.6 7.4 4.2
27 Profit for the period, MEUR 34.1 33.5 43.4 37.9 18.1
28 % of net sales 4.2 4.7 6.6 5.9 2.8
29Profit for the period attributable to the equity holders of the parent company, MEUR 34.1 33.5 43.4 37.9 18.1
30 % of net sales 4.2 4.7 6.6 5.9 2.8
31 EVA, MEUR 24.0 21.1 30.7 30.3 29.1
32 Cash flow from operating activities, MEUR 90.1 61.8 76.4 89.8 79.6
33 Balance sheet total, MEUR 563.5 577.3 452.8 465.8 458.3
34 Return on equity, % (ROE) 15.9 15.2 20.0 18.2 8.7
35 Return on invested capital, % (ROI) 12.7 13.3 17.4 16.5 15.4
36 Equity ratio, % 38.6 38.6 50.4 46.5 46.3
37 Gearing, % 46.1 54.2 17.3 19.8 25.2
38 Net interest-bearing liabilities, MEUR 97.8 117.9 38.7 41.8 52.0
39 Capital expenditure, MEUR 37.8 113.2 41.6 49.6 44.7
40 % of net sales 4.7 16.0 6.3 7.7 7.0
41 Average number of employees in full-time equivalents 7,566 7,875 7,199 7,099 7,257
42 Total number of full-time and part-time employees at year end 8,600 8,663 7,931 8,085 7,830
** IFRS 15 has not been adjusted to comparison years
LASSILA & TIKANOJA / FINANCIAL REVIEW 2018
29CORPORATE GOVERNANCE / REPORT BY THE BOARD OF DIRECTORS / KEY FIGURES / FINANCIAL STATEMENTS

ALTERNATIVE PERFORMANCE MEASURES
1 January - 31 December MEUR 2018 2017
Operating profit 47.6 44.0
Invested capital (rolling 12-month quarterly average) 357.7 342.0
Cost calculated on invested capital -23.6 -22.9
EVA 24.0 21.1
1 January - 31 December MEUR 2018 2017
Operating profit 47.6 44.0
Purchase price allocation amortisation
Environmental Services 0.5 0.6
Industrial Services 0.1 0.1
Facility Services 0.1 0.1
Technical Services 2.3 0.9
Adjusted operating profit 50.5 45.7
Matching the EVA result to operating profit
Matching adjusted operating profit to operating profit
LASSILA & TIKANOJA / FINANCIAL REVIEW 2018
30CORPORATE GOVERNANCE / REPORT BY THE BOARD OF DIRECTORS / KEY FIGURES / FINANCIAL STATEMENTS

Key figures on shares
1 Earnings per share (EPS) =profit attributable to equity holders of the parent company
adjusted average basic number of shares
2 Earnings per share (EPS), diluted
=profit attributable to equity holders of the parent company
adjusted average diluted number of shares
3 Equity per share =equity attributable to equity holders of the parent company
adjusted basic number of shares at the balance sheet date
4 Dividend per share =dividend for the financial period
share issue adjustment factor for issues made after the financial period
5 Payout ratio, % * =dividend per share
x 100 earnings per share
6 Effective dividend yield, % * =dividend per share
x 100 closing price of the financial period
7 P/E ratio, % =closing price of the financial period
earnings per share
8 Cash flow from operating activities per share
=cash flows from operating activities as in the cash flow statement
adjusted average basic number of shares
13 Market capitalization =basic number of shares at the balance sheet date x closing price of the financial period
Key figures on financial performance
23 Adjusted operating profit, MEUR =operating profit + purchase price allocation amortisation
31 EVA=
operating profit - cost calculated on invested capital (average of four quarters) before taxes
The cost of capital invested is calculated using the Group’s weighted average cost of capital (WACC).
WACC 2018: 6.60%
WACC 2017: 6.69%
WACC 2016: 6.56%
WACC 2015: 6.51%
WACC 2014: 6.58%
34 Return on equity, % (ROE) =profit for the period
x 100equity (average)
35 Return on invested capital, % (ROI)
=profit before tax + finance costs
x 100Balance sheet total - non-interest-bearing liabilities (average)
36 Equity ratio, % =equity
x 100balance sheet total - advances received
37 Gearing, % =net interest-bearing liabilities
x 100equity
38 Net interest-bearing liabilities =Interest-bearing liabilities - cash and cash equivalents
* The calculations are also applied with capital repayment.
CALCULATION OF THE KEY FIGURES
LASSILA & TIKANOJA / FINANCIAL REVIEW 2018
31CORPORATE GOVERNANCE / REPORT BY THE BOARD OF DIRECTORS / KEY FIGURES / FINANCIAL STATEMENTS

CONSOLIDATED INCOME STATEMENT1 January – 31 December MEUR 2018 2017 Note
Net sales 802.2 709.5 2, 3
Other operating income 5.2 5.7 6
Change of inventory -2.4 -1.0
Materials and services -282.0 -231.9
Employee benefit expenses -324.2 -296.9
Other operating expenses -108.7 -100.3 6
Depreciation and impairment -42.5 -41.1
Operating profit 47.6 44.0
Financial income and expenses -4.5 -1.4 8
Share of the result of associated companies -0.4 -0.1
Profit before tax 42.7 42.5
Income taxes -8.7 -8.9 9
Profit for the period 34.1 33.5
Attributable to:
Equity holders of the company 34.1 33.5
Non-controlling interest 0.0 0.0
Earnings per share attributable to equity holders of the parent company:
Basic earnings per share, EUR 0.89 0.87 10
Diluted earnings per share, EUR 0.89 0.87
CONSOLIDATED STATEMENT OF COMPREHENSIVE INCOME1 January – 31 December MEUR 2018 2017 Note
Profit for the period 34.1 33.5
Items not to be recognised through profit or loss
Items arising from re-measurement of defined benefit plans 0.0 0.1 23
Items not to be recognised through profit or loss,total 0.0 0.1
Items potentially to be recognised through profit or loss
Hedging reserve, change in fair value -0.2 -0.1
Currency translation differences -3.4 -2.7
Currency translation differences, non-controlling interest 0.0 0.0
Items potentially to be recognised through profit or loss, total -3.6 -2.8
Total comprehensive income, after tax 30.4 30.7
Attributable to:
Equity holders of the company 30.4 30.7
Non-controlling interest 0.0 0.0
More information on taxes in consolidated statement of comprehensive income is presented in Note 9 Income taxes.
The notes are an integral part of these consolidated financial statements.
32
LASSILA & TIKANOJA / FINANCIAL REVIEW 2018
CORPORATE GOVERNANCE / REPORT BY THE BOARD OF DIRECTORS / KEY FIGURES / FINANCIAL STATEMENTS

CONSOLIDATED STATEMENT OF FINANCIAL POSITION31 December MEUR 2018 2017 Note
ASSETS
Non-current assetsIntangible assets 12
Goodwill 151.5 150.2 13Customer contracts arising from acquisitions 19.2 22.6Agreements on prohibition of competition 0.0 0.0Other intangible assets arising from acquisitions 0.5 0.5Other intangible assets 22.4 22.9
193.6 196.3Property, plant and equipment 14
Land 5.1 5.3Buildings and constructions 35.5 40.3Machinery and equipment 110.9 113.0Other tangible assets 0.1 0.1Prepayments and construction in progress 5.2 2.0
156.8 160.5Other non-current assets
Finance lease receivables 0.1 0.3 16, 28Deferred tax assets 3.6 6.8 17Other receivables 1.9 3.3 19
5.6 10.3
Total non-current assets 356.0 367.2
Current assetsInventories 21.0 23.9 18Trade receivables 88.1 96.0 19, 28Contract assets 31.9 30.9 2, 19, 28Other receivables 12.2 11.2 19, 28, 29Cash and cash equivalents 54.3 48.1 20, 28
Total current assets 207.5 210.2
Total assets 563.5 577.3
The notes are an integral part of these consolidated financial statements.
31 December MEUR 2018 2017 Note
EQUITY AND LIABILITIES
Equity
Equity attributable to equity holders of the parent company 21Share capital 19.4 19.4Other reserves -9.5 -5.9Invested unrestricted equity reserve 0.6 0.6Retained earnings 167.7 169.7Profit for the period 34.1 33.5
212.2 217.2Non-controlling interests 0.2 0.2
Total equity 212.4 217.4
Liabilities
Non-current liabilitiesDeferred tax liabilities 29.3 29.2 17Retirement benefit obligations 1.4 1.4 23Provisions 4.6 5.0 24Borrowings 144.8 140.9 25, 28Other liabilities 0.5 0.4 26, 28
180.6 177.0Current liabilities
Borrowings 7.4 25.0 25, 28
Trade and other payables 162.4 156.0 27, 28, 29Provisions 0.7 1.9 24
170.5 183.0
Total liabilities 351.1 359.9
Total equity and liabilities 563.5 577.3
33
LASSILA & TIKANOJA / FINANCIAL REVIEW 2018
CORPORATE GOVERNANCE / REPORT BY THE BOARD OF DIRECTORS / KEY FIGURES / FINANCIAL STATEMENTS

CONSOLIDATED STATEMENT OF CASH FLOWS1 January – 31 December MEUR 2018 2017 Note
Cash flows from operating activities
Profit for the period 34.1 33.5
Adjustments 55.6 51.8 31
Net cash generated from operating activities before change in working capital 89.6 85.3
Change in working capitalChange in trade and other receivables 1.5 -14.6Change in inventories 3.0 1.0Change in trade and other payables 5.4 2.8
Change in working capital 9.9 -10.8
Interest paid -3.4 -2.7Interest received 0.4 0.5Income tax paid -6.4 -10.5
Net cash generated from operating activities 90.1 61.8
Cash flows from investing activitiesAcquisitions of subsidiaries and businesses, net of cash acquired 1.2 -67.2 4Purchases of property, plant and equipment and intangible assets -29.0 -25.5Proceeds from sale of property, plant and equipment and intangible assets 2.2 1.7Investments in associated companies 0.0 -0.8
Change in other non-current receivables 0.8 -0.3
Net cash used in investing activities -24.7 -92.1
Cash flows from financing activitiesChanges in short-term borrowings -22.6 19.9Proceeds from long-term borrowings 49.6 69.9 25Repayments of long-term borrowings -47.7 -2.6Repayments of leasing liabilities -2.9 -1.6Dividends paid -35.3 -35.3
Net cash generated from financing activities -58.9 50.3
Net change in liquid assets 6.6 20.0Liquid assets at beginning of period 48.1 28.2Effect of changes in foreign exchange rates -0.3 -0.1
Liquid assets at end of period 54.3 48.1 20
Liquid assets in the Consolidated statement of cash flows are according to the Consolidated statement of financial position and are specified in Note 20. Cash and cash equivalents.The notes are an integral part of these consolidated financial statements.
34
LASSILA & TIKANOJA / FINANCIAL REVIEW 2018
CORPORATE GOVERNANCE / REPORT BY THE BOARD OF DIRECTORS / KEY FIGURES / FINANCIAL STATEMENTS

IFRS 9 adjustment to opening balance -0.4 -0.4 -0.4
Equity at 1 January 2018 19.4 -5.7 -0.2 0.6 202.8 216.9 0.2 217.1
Comprehensive income
Profit for the period 34.1 34.1 0.0 34.1
Other comprehensive income -3.4 -0.2 0.0 -3.6 0.0 -3.7
Total comprehensive income -3.4 -0.2 34.0 30.4 0.0 30.4
Transactions with equity holders of the company
Expense recognition of share-based benefits 0.0 0.2 0.2 0.2 22
Dividend payment -35.3 -35.3 -35.3
Returned dividens 0.0 0.0 0.0
Total transactions with equity holders of the company 0.0 -35.2 -35.1 -35.1
Other 0.0 0.0 0.0
Equity at 31 December 2018 19.4 -9.1 -0.4 0.6 201.7 212.2 0.2 212.4
More information on equity is shown in Note 21 Equity, and on taxes recognised in equity in Note 9 Income taxes.
The notes are an integral part of these consolidated financial statements.
CONSOLIDATED STATEMENT OF CHANGES IN EQUITY
MEUR Share capital
Currency translation differences
Hedging reserve
Invested unrestricted
equity reserveRetained earnings
Equity attributable to equity holders
of the parent company
Non- control ling
interest Total equity Note
Equity at 1 January 2017 19.4 -3.0 -0.1 0.4 206.1 222.8 0.2 223.0
IFRS 15 adjustment to opening balance -1.1 -1.1 -1.1
Adjusted equity at 1 January 2017 19.4 -3.0 -0.1 0.4 205.0 221.8 0.2 221.9
Comprehensive income
Profit for the period 33.5 33.5 0.0 33.5
Other comprehensive income -2.7 -0.1 0.0 0.1 -2.8 0.0 -2.8
Total comprehensive income -2.7 -0.1 33.6 30.7 0.0 30.7
Transactions with equity holders of the company
Expense recognition of share-based benefits 0.1 -0.2 0.0 0.0 22
Dividend payment -35.3 -35.3 -35.3
Total transactions with equity holders of the company 0.1 -35.5 -35.4 -35.4
Other 0.1 0.1 0.1
Equity at 31 December 2017 19.4 -5.7 -0.2 0.6 203.2 217.2 0.2 217.4
35
LASSILA & TIKANOJA / FINANCIAL REVIEW 2018
CORPORATE GOVERNANCE / REPORT BY THE BOARD OF DIRECTORS / KEY FIGURES / FINANCIAL STATEMENTS

NOTES TO THE CONSOLIDATED FINANCIAL STATEMENTS
General informationThe Lassila & Tikanoja Group specialises in
environmental management and property and
plant support services. The Group has business
operations in Finland, Sweden and Russia.
The Group’s parent company is Lassila &
Tikanoja plc. Lassila & Tikanoja plc is a Finnish
public limited liability company domiciled in Hel-
sinki. The registered address of the Company is
Valimotie 27, 00380 Helsinki.
Lassila & Tikanoja plc is listed on the Nasdaq
Helsinki Ltd.
The consolidated financial statements are
available on the company website at www.
lassila-tikanoja.com or from the parent compa-
ny’s head office, address Valimotie 27, 00380
Helsinki, Finland.
These consolidated financial statements
have been approved for issue by the Board
of Directors of Lassila & Tikanoja plc on 30
January 2018. Under the Finnish Limited Liability
Companies Act, the shareholders may accept
or reject the financial statements at the gen-
eral meeting of shareholders held after their
publication. The meeting also has the power
to make a decision to amend the financial
statements.
Basis of preparationThe consolidated financial statements have
been prepared in accordance with the Inter-
national Financial Reporting Standards (IFRS),
with application of the IFRS and IAS standards
as well as IFRIC and SIC interpretations in
effect on 31 December 2018. In the Finnish
Accounting Act and regulations enacted by
virtue of it, International Financial Reporting
Standards refer to standards and related
interpretations approved for adoption within
the EU according to the procedure described
in regulation (EC) 1606/2002. The notes to the
consolidated financial statements also comply
with the Finnish accounting and community
legislation supplementing the IFRS regulations.
The financial statements have been pre-
pared under the historical cost convention,
with the exception of available-for-sale invest-
ments for which a fair value can be determined
from market prices, and derivative contracts,
which have been measured at fair value. Share-
based payments have been recognised at fair
value on the grant date.
Figures in these financial statements are
presented in millions of euros. Individual figures
are rounded in a way that may lead to rounding
deviations in calculations.
The preparation of financial statements in
accordance with IFRS requires the manage-
ment to make certain estimates and deci-
sions based on its discretion. Information on
decisions based on management discretion
which the management has used in the appli-
cation of the Group’s accounting policies and
which have the most material impact on data
presented in the financial statements, as well
as the key assumptions regarding the future
and affecting management judgments is given
in section “Critical judgments in applying the
Group’s accounting policies”.
Application of new or amended IFRS standardsAs of 1 January 2018, the Group has applied the
following new and amended standards and
interpretations in preparing these consolidated
financial statements:
IFRS 9 Financial Instruments replaces the
previous guidance included in IAS 39. The new
standard includes revised guidance on the
classification and measurement of finan-
cial instruments, including a new expected
credit loss model for calculating impairment
on financial assets, and the new general
hedge accounting requirements. IFRS 9 carries
forward the guidance on recognition and
derecognition of financial instruments from IAS
39. The impacts of IFRS 9 are described in Note
1, Transition to IFRS 9 and IFRS 15. The company
has not applied the standard retrospectively.
IFRS 15 Revenue from Contracts with Cus-
tomers (effective for annual periods beginning
on or after 1 January 2018). L&T has adopted
the new IFRS 15 Revenue from Contracts
with Customers standard starting 1 January
2018. The new standard replaces the previous
standards IAS 11 Construction Contracts, IAS
18 Revenue and related interpretations. L&T
adopted the new standard using the full retro-
spective application method for each previous
reporting period presented in accordance with
IAS 8, taking into consideration the practical
expedients of IFRS 15. The adoption of the new
standard impacted the Group’s accounting
policies to a small extent. The impact of the ap-
plication of the standard has been presented in
Note 1, Transition to IFRS 9 and IFRS 15. The new
IFRS 15 standard has increased the amount of
revenue recognition related disclosures.
Amendments to IFRS 2 - Clarification and
Measurement of Share-based Payment
Transactions. The amendments clarify the
accounting for certain types of arrangements.
Three accounting areas are covered: measure-
ment of cash-settled share-based payments;
classification of share-based payments settled
net of tax withholdings; and accounting for a
modification of a share-based payment from
cash-settled to equity-settled. The amend-
ments have no impact on the consolidated
financial statements.
Amendments to IFRS 4 - Applying IFRS 9
Financial Instruments with IFRS 4 Insurance
Contracts. The amendments respond to indus-
try concerns about the impact of differing ef-
fective dates by allowing two optional solutions
to alleviate temporary accounting mismatches
and volatility. The amendments have no impact
on the consolidated financial statements.
Amendments to IAS 40 - Transfers of Invest-
ment Property. When making transfers of an
investment property, the amendments clarify
that a change in management’s intentions, in
isolation, provides no evidence of a change in
use. The examples of evidences of a change
in use are also amended so that they refer to
36
LASSILA & TIKANOJA / FINANCIAL REVIEW 2018
CORPORATE GOVERNANCE / REPORT BY THE BOARD OF DIRECTORS / KEY FIGURES / FINANCIAL STATEMENTS

property under construction or development
as well as to completed property. The amend-
ments have no impact on the consolidated
financial statements.
Annual Improvements to IFRSs (2014-2016
cycle) The annual improvements process pro-
vides a mechanism for minor and non-urgent
amendments to IFRSs to be grouped togeth-
er and issued in one package annually. The
amendments relate to IFRS 1 and IAS 28. The
amendments have no impact on the consoli-
dated financial statements.
IFRIC 22 Interpretation Foreign Currency
Transactions and Advance Consideration
When foreign currency consideration is paid or
received in advance of the item it relates to –
which may be an asset, an expense or income
– IAS 21 The Effects of Changes in Foreign
Exchange Rates -standard is not clear on how
to determine the transaction date for translat-
ing the related item. The interpretation clarifies
that the transaction date is the date on which
the company initially recognises the prepay-
ment or deferred income arising from the ad-
vance consideration. For transactions involving
multiple payments or receipts, each payment
or receipt gives rise to a separate transaction
date. The amendments have no impact on the
consolidated financial statements.
Accounting policiesSubsidiaries
The consolidated financial statements include
the parent company Lassila & Tikanoja plc and
all subsidiaries in which the Group exercises
control. The criteria for control are fulfilled
when the Group is exposed, or has rights, to
variable returns from its involvement with
an entity and has the ability to affect those
returns through its power over the entity.
Intra-Group shareholdings have been elimi-
nated using the acquisition method. Considera-
tion given and the identifiable assets and liabili-
ties of an acquired company are recognised
at fair value on the date of acquisition. Any
costs associated with the acquisition, with the
exception of costs arising from the issuance
of debt securities or equity instruments, have
been recorded as expenses. Any conditional
additional sale price has been measured at fair
value on the date of acquisition and classified
as a liability or as equity. Additional sale price
classified as a liability is measured at fair value
on the closing day of each reporting period, and
the resulting gains or losses are recognised
through profit or loss. Additional sale price
classified as equity will not be re-measured.
Any non-controlling interests in the acquired
entity are recognised either at fair value or at
the proportionate share of non-controlling in-
terests in the acquired entity’s net identifiable
assets. The principle applied in measurement
is specified separately for each acquisition.
The treatment of goodwill from acquisition of
subsidiaries is presented in ”Goodwill and other
intangible assets”.
The subsidiaries are fully consolidated from
the date on which control is transferred to the
Group until the date that control ceases.
The profit or loss for the period and the
comprehensive income are attributed to the
parent company’s shareholders and non-con-
trolling interests, even if this would result in
the non-controlling interest being negative.
Equity attributable to non-controlling inter-
ests is presented as a separate item in the
statement of financial position, as an equity
component. Changes in the parent company’s
holdings in the subsidiary and not resulting in
loss of controlling interest are presented as
equity transactionsThe Group has no material
non-controlling interests.
In an acquisition achieved in stages, the pre-
vious holdings are measured at fair value and
the resulting gains or losses are recognised
through profit or loss. If the Group loses its con-
trolling interest in the subsidiary, its remaining
holdings are measured at fair value on the date
when control ceases, and the difference is
recognised through profit or loss.
All intra-Group transactions, receivables,
liabilities and unrealised gains, as well as distri-
bution of profits within the Group, are eliminat-
ed in the consolidated financial statements.
Unrealised losses are not eliminated if the
losses are attributable to impairment. The dis-
tribution of profit or loss for the period between
equity holders of the parent company and the
non-controlling interest is presented in a sep-
arate income statement and the statement of
comprehensive income, and the share of equity
belonging to the non-controlling interest is pre-
sented as a separate item in the consolidated
statement of financial position under equity.
Associates
Associates are companies over which the
Group has significant influence. The Group
has significant influence when it holds more
than 20% of the voting rights or otherwise
has significant influence but a non-controlling
interest. The equity method has been used in
the consolidation of associates.
Foreign currency translationFigures indicating the performance and finan-
cial position of the Group entities are specified
in the currency of the economic operating
environment in which the entity primarily op-
erates (functional currency). The consolidated
financial statements are presented in euros,
which is the parent company’s functional and
presentation currency.
Any transactions in foreign currencies have
been recognised in the functional curren-
cy using the exchange rate in effect on the
transaction date. In practice, it is customary to
use a rate that is close enough to the transac-
tion day rate. Monetary assets denominated
in foreign currency are translated into euros
using the exchange rates in effect on the
balance sheet date. Non-monetary assets are
translated using the exchange rate in effect
on the transaction date. L&T has no non-mon-
etary assets denominated in foreign currency
that are measured at fair value. Exchange rate
37
LASSILA & TIKANOJA / FINANCIAL REVIEW 2018
CORPORATE GOVERNANCE / REPORT BY THE BOARD OF DIRECTORS / KEY FIGURES / FINANCIAL STATEMENTS

gains and losses arising from foreign-currency
transactions and the translation of monetary
items are recognised in the income state-
ment. Foreign exchange gains and losses on
business transactions are included in the re-
spective items above operating profit. Foreign
exchange gains and losses on financial assets
and liabilities are included in financial income
and costs.
The income statements of the Group entities
whose functional currency is not the euro are
translated into euros at average exchange
rates for the period, and the statements of fi-
nancial position at the exchange rates in effect
on the balance sheet date. The difference in
exchange rates applicable to the translation of
profit in the income statement and statement
of comprehensive income result in a transla-
tion difference recognised in the translation
reserve within equity. Translation differences
arising from the elimination of the acquisition
cost of foreign subsidiaries, as well as transla-
tion differences in equity items accumulating
after the acquisition, are recognised in the
translation difference reserve.
Goodwill and fair value adjustments to the
carrying amounts of the assets and liabilities
arising on the acquisition of a foreign entity are
treated as assets and liabilities of the foreign
entity and translated into euros at the closing
rate.
Goodwill and other intangible assetsGoodwill represents the portion of the ac-
quisition cost by which the aggregate of the
consideration given, the share of non-con-
trolling owners in the acquired entity and the
previously owned share exceed the fair value
of the acquired entities at the time of acqui-
sition. Goodwill is not amortised, but is tested
annually for impairment. Goodwill is presented
in the statement of financial position at original
cost less impairment losses, if any.
Intangible assets acquired in a business
combination are measured at fair value. The
useful lives of intangible assets are estimated
to be either finite or indefinite. In L&T, the intan-
gible assets recognised in business combina-
tions include items such as customer relations,
non-competition agreements and environmen-
tal permits. They have finite useful lives, varying
between three and thirteen years.
Other intangible assets consist primarily of
software and software licences.
The costs of software projects are recog-
nised in other intangible assets starting from
the time when the projects move out of the
research phase into the development phase
and the outcome of a project is an identifiable
intangible asset. Such an intangible asset
must provide L&T with future economic benefit
that exceeds the costs of its development.
The cost comprises all directly attributable
costs necessary for preparing the asset to be
capable of operating in the manner intended
by the management. The largest cost items are
consultancy fees paid to third parties, as well
as salaries and other expenses for the Group’s
personnel.
The depreciation period for computer soft-
ware and software licences is five years.
Depreciation will cease when an intangible
asset is classified as held for sale (or included
in a disposal group held for sale) in accordance
with IFRS 5 Non-current Assets Held for Sale
and Discontinued Operations.
Property, plant and equipmentProperty, plant and equipment are recognised
at acquisition cost less accumulated depre-
ciation and impairment losses. The historical
cost includes expenditure that is directly
attributable to the acquisition of property, plant
and equipment. Borrowing costs immediately
arising from the acquisition, construction or
manufacture of property, plant and equipment
that meet the conditions are capitalised as part
of the asset’s acquisition cost.
In business combinations, property, plant and
equipment are measured at fair value on the
acquisition date. In the statement of financial
position, property, plant and equipment are
shown less accumulated depreciation and
impairment, if any.
Property, plant and equipment are depreci-
ated using the straight-line method over their
expected useful lives, excluding new landfills.
The expected useful lives are reviewed on
each balance sheet date, and, if expectations
differ materially from previous estimates, the
depreciation periods are adjusted to reflect the
changes in expectations of future economic
benefits.
Depreciation in the financial statements is
based on the following expected useful lives:
Buildings and structures .........................5–30 years
Vehicles ..............................................................6–15 years
Machinery and equipment.......................4–15 years
For completed landfills the Group applies the
units of production method, which involves de-
preciation on the basis of the volume of waste
received. Land is not depreciated.
When an asset included in property, plant
and equipment consists of several components
with different estimated useful lives, each com-
ponent is treated as a separate asset. Ordinary
repair and maintenance costs are recognised
in the income statement during the period in
which they are incurred. Costs of significant
modification and improvement projects are
capitalised if it is probable that the projects will
result in future economic benefits to the Group.
When a tangible asset is classified as held for
sales in accordance with IFRS 5 Noncurrent As-
sets Held for Sale and Discontinued Operations,
depreciation will no longer be recorded. Gains
and losses on sales and disposal of property,
plant and equipment are recognised through
profit or loss and are presented in other operat-
ing income or expenses.
38
LASSILA & TIKANOJA / FINANCIAL REVIEW 2018
CORPORATE GOVERNANCE / REPORT BY THE BOARD OF DIRECTORS / KEY FIGURES / FINANCIAL STATEMENTS

Impairment of tangible and intangible assetsOn each closing day of a reporting period, the
Group assesses the balance sheet values of
its assets for any impairment. If any indication
exists, an estimate of the asset’s recoverable
amount is made. The need for recognition of
impairment is assessed at the level of cash
generating units – that is, the lowest level of
unit that is primarily independent of other units
and that generates cash flows that are sepa-
rately identifiable.
The recoverable amount is the higher of an
asset’s fair value less selling costs and its val-
ue in use. Value in use refers to the estimated
future net cash flows available from an asset
or cash-generating unit, discounted to the
present value. The discount rate used is the
pre-tax rate, which reflects the market view of
the time value of money and the risks associat-
ed with the asset.
An impairment loss is recognised in the
income statement when an asset’s carrying
amount exceeds its recoverable amount.
Impairment losses attributable to a cash-gen-
erating unit are used for deducting first the
goodwill allocated to the cash-generating unit
and, thereafter, the other assets of the unit on
an equal basis.
An impairment loss for an asset other
than goodwill recognised in prior periods is
reversed if there is a change in circumstances
and the recoverable amount has changed. An
impairment loss recognised for goodwill is not
reversed.
Goodwill is tested for impairment annually or
whenever there is any indication of impairment.
Recoverable amount calculations based both
on values in use and on the net sales price are
made for the cash-generating units to which
the goodwill has been allocated.
Intangible assets under construction are
software projects that cannot be tested
separately for impairment, as they do not gen-
erate separate cash flow. There is no need for
impairment if, at the end of the financial period,
it is clear that the projects will be completed
and the software will be introduced. Intangible
assets under construction are, however, tested
for impairment as part of the cash generating
unit to which they belong.
LeasesThe Group as a lessee
Assets leased under a finance lease are
recognised in property, plant and equipment at
amounts equal to the fair value of the leased
property or, if lower, the present value of the
minimum lease payments. They are depreciated
over the term of the lease or over their expect-
ed useful lives, if shorter. However, when there
is reasonable assurance that the ownership of
the leased asset will transfer to L&T by the end
of the lease term, the asset will be depreciated
using the method applied for a corresponding
asset owned by the company. Liabilities arising
from the leases are recorded under loans. Each
lease payment is apportioned between finan-
cial cost and loan repayment. Financial costs
are allocated to each period of the leasing term
so as to produce a constant periodic rate of in-
terest on the remaining balance of the liability.
The Group as a lessor
The Environmental Services division leases
out equipment, such as waste compactors, to
customers under long-term leases that transfer
the material risks and rewards associated
with ownership to the lessee. Such leases are
classified as finance leases, and net investment
in them is recognised as a lease receivables
upon commencement of the lease term. Each
lease payment is apportioned between financial
income and repayment of trade receivables.
Financial income is allocated over the lease term
on the basis of a pattern that reflects a constant
periodic rate of return on the net investment.
Leases of assets and premises that do not
transfer the material risks and rewards asso-
ciated with ownership to the lessee are clas-
sified as operating leases. The lease payments
are recognised on a straight-line basis over the
term of the lease as income or cost, depending
on whether L&T is the lessor or the lessee.
Assets leased out under operating leases are
recognised in property, plant and equipment
and are depreciated over their expected useful
lives using the method applied for correspond-
ing property, plant and equipment owned by the
company.
Non-current assets held for sale and
discontinued operations
Non-current assets (or disposal groups) and
assets and liabilities associated with discon-
tinued operations are classified as held for sale
if the amount corresponding to their carrying
amount will be principally recovered through
their sale instead of continued use. An asset
is considered to meet the conditions specified
for an asset to be classified as held for sale
when the asset (or disposal group) is immedi-
ately available for sale in its present condition
under standard and conventional terms, when
management is committed to a plan to sell,
and the sale is expected within one year of the
classification.
Immediately before the initial classification
of the asset or disposal group as held for sale,
the assets and liabilities will be measured in
accordance with applicable IFRSs. After classi-
fication as held for sale, non-current assets (or
disposal groups) are measured at the lower of
the carrying amount and fair value, less selling
costs. Depreciation of these assets will be
discontinued upon classification. If the asset
does not meet the classification conditions,
the classification is cancelled and the asset is
measured at pre-classification balance sheet
value less depreciation and impairment, or
the recoverable amount, whichever is lower.
Non-current assets, or the assets and liabilities
of a disposal group, classified as held for sale
must be presented separately in the statement
of financial position. Similarly, any liabilities of
disposal groups must be presented separate-
ly from other liabilities. The profit or loss of
discontinued operations must be presented in
a separate line in the income statement. Com-
parison data shown in the income statement is
adjusted for operations classified as discon-
tinued during the most recent financial period
presented. The profit or loss of discontinued
39
LASSILA & TIKANOJA / FINANCIAL REVIEW 2018
CORPORATE GOVERNANCE / REPORT BY THE BOARD OF DIRECTORS / KEY FIGURES / FINANCIAL STATEMENTS

operations must be shown in a separate line,
including comparison data. There were no
discontinued operations iin the current or
comparison financial years.
InventoriesInventories are measured at the lower of cost
and net realisable value. Net realisable value
is the estimated selling price in the ordinary
course of business, less the estimated costs of
completion and selling expenses. The invento-
ries of L&T Biowatti and Environmental Prod-
ucts are measured using the weighted average
cost method. The value of other inventories is
determined using the FIFO method.
At its recycling plants, L&T processes recy-
clable materials into secondary raw materials
for sale. The cost of the inventories of these
materials comprises raw materials, direct labour
costs, other direct costs of manufacturing and
a proportion of variable and fixed production
overheads based on normal operating capacity.
Financial assets and liabilitiesFinancial assets and liabilities are classified
as amortised costs and hedge accounting
items. The classification is based on their cash
flow properties and business models used to
manage them.
A financial asset is derecognised when the
rights to the cash flows from the asset expire,
or when all material risks and rewards of the
ownership of the asset have been transferred
outside L&T.
Borrowings and other receivables are
measured at amortised cost using the effective
interest method. Trade and other receivables
are included in this category and are recog-
nised in the statement of financial position
at historical cost less credit adjustments and
impairment losses.
Financial assets and liabilities at fair value
through profit or loss are derivative financial
instruments to which hedge accounting is not
applied. Accounting policies applied to them
are described below under Derivative financial
instruments and hedge accounting.
Borrowings are recognised in the statement
of financial position on the settlement date
at fair value, on the basis of the consideration
received, including transaction costs directly
attributable to the acquisition or issue. These
financial liabilities are subsequently measured
at amortised cost using the effective interest
rate method.
Trade and other current non-interest-bear-
ing payables are recognised in the statement
of financial position at cost.
Derivative instruments and hedge accounting As specified in its financial policy, L&T uses
derivative instruments to reduce the financ-
ing risks associated with interest rate and
commodity rate fluctuations. L&T’s derivative
instruments include interest rate swaps to
hedge the cash flow of variable-rate borrow-
ings against interest rate risk and commodity
swaps made to balance price fluctuations in
future diesel purchases.
Derivatives are recognised initially in the
statement of financial position at fair value. Af-
ter acquisition, they are measured at fair value
on each balance sheet date. The fair values are
based on market quotations on the balance
sheet date. Any gains and losses arising from
measurement at fair value are accounted for in
the manner determined by the purpose of the
derivative instrument.
All interest rate and commodity hedges
meet the criteria set for efficient hedging in the
Group’s risk management policy. The profits
and losses from derivatives covered by hedge
accounting are recorded consistently with the
underlying commodity. Derivative agreements
are defined as hedging instruments for future
cash flows and anticipated purchases (cash
flow hedging), or as derivative agreements to
which hedge accounting is not applied (finan-
cial hedging).
L&T applies cash-flow hedge accounting
to all interest rate swaps and commodity
derivatives. When hedge accounting is initiated,
L&T documents the relationship between the
hedged item and the hedging instrument, as
well as the Group’s risk management objec-
tives and hedging strategy. The Group does not
use derivatives to hedge net investments made
in independent foreign units.
When hedging begins and in connection
with each interim report, L&T documents and
estimates the effectiveness of the hedging
relationships by assessing the hedging instru-
ment’s ability to cancel any changes in the
cash flows of the hedged item.
To the extent that cash flow hedging is
efficient, changes in fair values of hedging
instruments are recognised in the hedging
reserve within equity. When a hedging instru-
ment expires or is sold, or when a hedge no
longer meets the criteria for Group’s manage-
ment policy, the gain or loss on the hedging
instrument remains in equity until the hedged
cash flow materialises. If the hedged cash flow
is no longer expected to materialise, the gain or
loss incurred on the hedging instrument is rec-
ognised in the income statement immediately.
The ineffective portion of hedging relationship
is also recognised immediately in the income
statement.
Foreign currency forward instruments and
changes in the fair values of these items
were recognised in the income statement as
financial income or costs. Derivatives to which
hedge accounting is not applied are catego-
rised as financial assets and liabilities held for
trading.
The positive fair values of all derivatives are
recorded in the statement of financial position
under derivative receivables. Similarly, the
negative fair values of derivatives are recorded
under derivative payables. All fair values of
derivatives are included in current assets or
liabilities.
Cash and cash equivalents Cash and cash equivalents consist of cash on
hand, bank deposits redeemable on demand
and other short-term liquid investments. Their
maturity is no longer than three months from
the acquisition date. They are recognised as of
40
LASSILA & TIKANOJA / FINANCIAL REVIEW 2018
CORPORATE GOVERNANCE / REPORT BY THE BOARD OF DIRECTORS / KEY FIGURES / FINANCIAL STATEMENTS

the settlement date and measured at histor-
ical cost. Foreign currency transactions are
translated into euros using the exchange rates
prevailing on the balance sheet date.
Impairment of financial assets
The Group assesses on each balance sheet
date whether there is objective evidence that
any financial asset item is impaired. If there is
evidence of impairment, the cumulative loss in
the fair value reserve is recognised in profit or
loss. Impairment losses on shares classified as
financial assets available for sale are not re-
versed through profit or loss, as is the case with
impairment losses recognised on fixed income
instruments that are subsequently reversed.
Doubtful debts are reviewed each month. If
there is objective evidence that the balance
sheet values of the receivables exceed their
recoverable amounts, the difference is recog-
nised as an impairment loss in other operating
expenses in the income statement. The criteria
for recognising an impairment loss on a receiv-
able include the debtor’s substantial financial
difficulties, corporate restructuring, a credit
loss recommendation issued by a collection
agency or extended default on payments. If the
difference between the balance sheet value
of receivables and the recoverable amounts
is reduced later, the impairment loss shall be
reversed through profit or loss.
Borrowing costsBorrowing costs are recognised as expenses in
the period in which they arise.
Borrowing costs that are directly attributable
to the acquisition, construction or production
of a qualifying asset shall be included in the
acquisition cost of that asset.
Transaction costs directly attributable to
borrowing have been included in the histori-
cal cost of the liability and recognised as an
interest expense during the expected life of the
liability applying the effective interest method.
EquityOrdinary shares are presented as share capital.
Any expenses arising from the issue or acqui-
sition of treasury shares are presented as a
valuation allowance within equity. If the Group
repurchases any equity instruments, the ac-
quisition cost of such instruments is deducted
from equity.
ProvisionsA provision is recognised when the Group has a
legal or factual obligation towards a third party
resulting from an earlier event, fulfilment of the
payment obligation is probable, and its amount
can be reliably estimated. Provisions are
measured at the current value of the expendi-
ture required to settle the obligation. Increase
in provisions due to the passage of time is
recognised as interest expense. Changes in
provisions are recognised in the income state-
ment in the same item in which the provision is
originally recognised. A provision is recognised
if the exact amount or timing of the event is not
known. Otherwise the item is recognised in ac-
crued liabilities. The amounts of provisions are
estimated on each closing date and adjusted
according to the best estimate at the time of
the assessment.
Environmental provisions are recognised
when the Group has an existing obligation that
is likely to result in a payment obligation, the
amount of which can be reliably estimated. Envi-
ronmental provisions related to the restoration
of sites are made at the commencement of each
project. The costs recognised as a provision, as
well as the original acquisition cost of assets,
are depreciated over the useful life of the asset,
and provisions are discounted to present value.
The most significant provisions recognised
in the statement of financial position are the
site restoration provisions for landfills and the
contaminated soil processing site.
Revenue recognition
Revenue from contracts with customersRevenue from contracts with customers is rec-
ognised when or as the performance obligation
is satisfied by transferring a promised good or
service to the customer. A good or a service is
transferred when the customer obtains control
of the good or service. Revenue is recognised
based on the transaction price to which L&T
expects to be entitled in exchange for transfer-
ring the good or service.
L&T acts as a principal in all of its contracts
with customers.
The amount and timing of revenue recogni-
tion involves significant management’s judge-
ment especially in the following areas:
• Identification of performance obligations
for services business
• Timing of revenue recognition in services
and project business
• Treatment of repurchase agreements
relating to compactors and balers in
Environmental Services business including
the assessment of the existen
of a significant financing component
• Measurement of a variable consideration
These judgments have been described in
more detail in the accounting policies relating
to revenue recognition.
Services business
Services business comprises of long-term
service agreements and separately ordered
services.
Long-term service agreements include for
example waste management and recycling ser-
vices which is part of Environmental Services
as well as cleaning and property maintenance
services included in Facility Services. Long-term
service agreements include one or more per-
formance obligations depending on the amount
of distinct services provided to the customer. A
typical characteristic of long-term services is
that services are delivered evenly throughout
the contract term. With one contract customer
can order for example inside cleaning services,
outside cleaning and upkeep services and prop-
erty maintenance services that are distinct per-
formance obligations. Each service is a distinct
41
LASSILA & TIKANOJA / FINANCIAL REVIEW 2018
CORPORATE GOVERNANCE / REPORT BY THE BOARD OF DIRECTORS / KEY FIGURES / FINANCIAL STATEMENTS

performance obligation as the customer can
benefit from the services on its own and could
order the services from different service provid-
ers. If a contract contains more than one distinct
performance obligation, the transaction price is
allocated to each performance obligation based
on the stand-alone selling prices.
In addition to the long-term service agree-
ments, L&T offers services which are separate-
ly ordered as part of Industrial Services, Facility
Services and Technical Services. Compared to
the long-term service agreements, services
that are ordered separately are typically short-
term in nature and they are provided either
occasionally or on a non-recurring basis.
Revenue from services business is recog-
nised over time, as the customer simultane-
ously receives and consumes the benefits
provided by L&T’s performance as L&T performs
the services. Revenue from services that are
invoiced with a fixed monthly fee is recognised
evenly over the contract term as also the work
is performed evenly over the term. Revenue
from services that are invoiced based on
hourly fees is recognised based on the work
performed. L&T’s management has identified
that there may be seasonal fluctuation espe-
cially in the long-term service agreements of
Facility Services as the work performed differs
between seasons during the year. Management
has estimated that the costs for these services
incur evenly throughout the period and, thus,
revenue is recognised evenly over the period.
L&T’s Industrial Services receives con-
taminated soil from customers, for which the
performance obligation is the receipt and
processing of soil. Measuring progress towards
complete satisfaction of the performance
obligation is based on the output method.
Revenue is recognised based on the amount of
processed soil. Customer is invoiced when soil
is received and the payment received from the
customer is treated as a contract liability.
Project business
L&T’s project business include for example
projects for industrial process cleaning and
closing of landfills which are part of Industrial
Services business, renovation and building
technology projects included in Facility Servic-
es as well as refrigeration and cooling service
projects for retailers and energy management
projects included in Technical Services busi-
ness. In project business the customer orders
the entire project at once and the project is
considered as a single performance obligation.
In some cases, a contract can also consist of
several different locations and each location
creates a distinct performance obligation. If
the contract contains more than one distinct
performance obligation, L&T allocates the
transaction price to each performance obliga-
tion based on the stand-alone selling prices.
Revenue from project business is recognised
over time as L&T’s projects mainly relate to
enhancing an asset that the customer controls.
In project business the input method based
on costs incurred is used for measuring the
progress towards complete satisfaction of the
performance obligation. L&T’s management
has estimated that the costs incurred for a
project can be determined reliably. Also, due to
L&T’s contract structure in project business the
management has determined that L&T has an
enforceable right to payment for performance
completed to date. In project business invoicing
is typically made based on a predetermined
payment schedule.
Sale of equipment and materials
Sale of equipment consists of sale of compac-
tors and balers to customers included in Envi-
ronmental Services business. Sale of materials
consists of sale of wood-based fuels, recycled
fuels and delivery of wood raw materials in
Renewable Energy Sources business and of
sale of recycled raw materials in Environmental
Services business. Each equipment or material
delivery creates a distinct performance obliga-
tion in the sale of equipment and materials. The
equipment delivered by L&T does not involve
any additional warranties that would be con-
sidered as a distinct performance obligation.
Control of the delivered product is trans-
ferred when the physical possession of the
product has been transferred to the customer,
which typically occurs at delivery.
Renewable Energy Sources business (L&T
Biowatti) delivers wood-based fuels, recycled
fuels and wood raw materials to customers.
The consideration received from a customer
is based on the amount of delivered fuel and
the energy level of the fuel or on the amount
of the delivered material. In some cases, the
final transaction price is determined after
the customer has measured the fuel’s energy
value or amount of fuel delivered, and, thus,
there is uncertainty relating to the amount
of final transaction price. L&T’s management
has estimated that the level of uncertainty
related to the transaction price is low and any
adjustments to be made to the transaction
price when the uncertainty is resolved are not
considered to be material.
Lease income
In addition to the sale of compactors and bal-
ers, customers can also lease the equipment
through an external financing company. The
agreement made between L&T and the financ-
ing company includes a repurchase obligation
at the end of the lease period with a predeter-
mined residual value. Due to the repurchase
obligation L&T’s management has determined
that L&T does not transfer substantially all
the risks and rewards incidental to ownership
of the assets to the customer and, thus, the
leased equipment is treated as tangible assets.
In the beginning of the lease term an amount
corresponding to the lease income and the
residual value of the asset received from the
financing company is presented as a liability.
Lease income is recognised monthly during the
lease term. L&T’s management has estimated
that the amount of payment received from the
financing company does not Include a signifi-
cant financing component.
Estimating variable considerationL&T’s contracts with customers may include
components of variable considerations, such
as bonuses and penalties for delay. L&T’s
42
LASSILA & TIKANOJA / FINANCIAL REVIEW 2018
CORPORATE GOVERNANCE / REPORT BY THE BOARD OF DIRECTORS / KEY FIGURES / FINANCIAL STATEMENTS
management has determined that the level of
uncertainty relating to the variable considera-
tion is typically low. The estimate of the amount
of variable considerations is reassessed at the
end of each reporting period.
Contract balancesContract assets and trade receivables
A contract asset is the right to consideration
in exchange for goods or services that are
transferred to a customer. If goods or servic-
es are transferred to a customer before the
customer pays a consideration, the amount is
presented as a contract asset. If L&T has an
unconditional right to the consideration a trade
receivable is presented in the statement of
financial position.
Contract assets and trade receivables are
assessed for impairment in accordance with
IFRS 9. L&T’s general payment term for custom-
ers is 14 days, but it can vary depending on the
specific case.
Contract liabilities
A contract liability is L&T’s obligation to transfer
goods or services to a customer for which L&T
has received consideration from the customer.
If a customer pays consideration before goods
or services are transferred to the customer, a
contract liability is presented in the statement
of financial position when the payment is made
by the customer.
Incremental costs of obtaining a contract L&T does not have material incremental costs
to obtain a contract. L&T applies the practical
expedient which allows the costs to obtain a
contract to be recognised when they occur
since amortisation period of these assets
would have been one year or less.
Research and developmentResearch expenditure is recognised as an ex-
pense during the period in which it is incurred.
The gains from new service concepts can
only be verified at such a late stage that the
revenue recognition criteria are not considered
fulfilled before the service delivery. Computer
software development costs recognised as
an asset in the statement of financial position
are described in more detail in the following
chapter.
Government grantsGovernment grants or other grants relating
to actual costs are recognised in the income
statement when the group complies with
the conditions attached to them and there is
reasonable assurance that the grants will be
received. They are presented in other operating
income. Government grants directly associated
with the recruitment of personnel, such as em-
ployment grants, apprenticeship grants and the
like, are recognised as reductions in personnel
expenses.
Grants for acquisition of property, plant
and equipment are recognised as deductions
of historical cost. The grant is recognised as
revenue over the economic life of a depreciable
asset, by way of a reduced depreciation charge.
Employee benefitsPension benefit obligations
Pension plans are categorised as defined
benefit and defined contribution plans. Under
defined contribution plans, the Group pays
fixed contributions for pensions, and it has no
legal or factual obligation to pay further contri-
butions. All pension arrangements that do not
fulfil these conditions are considered defined
benefit plans. Contributions to defined con-
tribution plans are recognised in the income
statement in the financial period to which they
relate. L&T operates pension schemes in ac-
cordance with local regulations and practices
in the countries in which it operates, and these
are mainly defined contribution plans.
L&T operates some minor defined bene-
fit plans originating mainly from business
acquisitions. The Group is responsible for some
of these defined benefit pension plans, while
others are covered by pension insurance. The
obligations have been calculated for each
plan separately, using the projected unit credit
method. Pension costs are recognised in the
income statement over employees’ periods of
service, in accordance with actuarial calcula-
tions. When calculating the present value of
pension obligations, the discount rate is based
on the market yield of the high-quality bonds
issued by the company, whose maturity mate-
rially corresponds to the estimated maturity
of the pension obligation. The risk premium
is based on bonds issued by companies with
an AA credit rating. The pension plan assets
measured at fair value on the balance sheet
date are deducted from the present value of
the pension obligation to be recognised in the
balance sheet. The net liabilities (or assets)
associated with a defined benefit pension plan
are recorded in the balance sheet.
Service cost (pension costs) and the net
interest of the net liabilities of the defined ben-
efit plan are recognised as expenses through
profit or loss and recognised under employee
benefit expenses. Items (such as actuarial
gains and losses and return on funded defined
benefit plan assets, except items related to
net interest) arising from the redefinition of
the net liabilities (or assets) associated with
a defined benefit plan are recognised in other
comprehensive income in the period in which
they arise.
Past service costs are recognised as ex-
penses through profit or loss at the earlier of
the following: when the plan is rearranged or
downsized, or a when the entity recognises the
related rearrangement expenses or benefits
related to the termination of employment.
Share-based payment The Group has several incentive arrangements
for which payments are made either as equity
instruments or cash. The benefits granted
under the arrangements are measured at fair
value on the granting date and recognised as
expense evenly over the vesting period. The
43
LASSILA & TIKANOJA / FINANCIAL REVIEW 2018
CORPORATE GOVERNANCE / REPORT BY THE BOARD OF DIRECTORS / KEY FIGURES / FINANCIAL STATEMENTS

effect of the arrangement on profit and loss is
recognised under employee benefit expenses.
Income taxesThe Group’s income taxes consist of cur-
rent tax and deferred tax. Tax expenses are
recognised in the income statement, with the
exception of items directly recognised in equity
or comprehensive result, in which case the
tax effect is recognised corresponding item.
Current tax is determined for the taxable profit
for the period according to prevailing tax rates
in each country. Taxes are adjusted by current
tax rates for previous periods, if any.
Deferred tax assets and liabilities are rec-
ognised for all temporary differences between
the tax bases of assets and liabilities and their
carrying amounts. Calculation of deferred taxes
is based on the tax rates in effect on the clos-
ing day. If the rates change, it is based on the
new tax rate. No deferred tax is recognised for
impairment of goodwill that is not tax-deduct-
ible. A deferred tax asset is recognised only to
the extent that it is probable that taxable profit
will be available against which the deferred tax
asset can be utilised.
The most significant temporary differences
arise e.g. from goodwill amortisation performed
under FAS and from depreciation on property,
plant and equipment.
Distribution of dividendThe dividend liability to the company’s share-
holders is recognised as a liability in the con-
solidated financial statements, after the Annual
General Meeting has decided on the dividend
distribution.
Critical judgements in applying the Group’s accounting policies and key uncertainties related to estimatesIn drawing up IFRS financial statements, the
Group management must make estimates and
assumptions concerning the future, the out-
come of which may differ from the estimates
and assumptions made. The management also
employs judgement when making decisions
on the selection and application of accounting
principles.
Considerations based on discretion apply, in
particular, to cases where the applicable IFRS
standards provide for alternative methods of
recognition, measurement or presentation. The
most significant area where management has
used the judgment described above relates
to the recognition of assets and liabilities for
acquired business operations and to fair value
measurement.
The preparation of financial statements
requires the management to make estimates
and assumptions that affect the carrying
amounts on the balance sheet date for assets
and liabilities and the amounts of revenues and
expenses. The estimates and assumptions re-
flect the management’s best understanding on
the closing date, based on previous experience
and assumptions about the future that are
considered to have the highest probability on
the closing date.
Key assumptions regarding the future and
key uncertainty factors related to estimates
on the closing date that involve a significant
risk of causing a material adjustment to the
carrying amounts of the Group’s assets and
liabilities within the next financial year are
described below:
Fair value measurement of assets and
liabilities acquired in business combinations
Assets and liabilities acquired in business
combinations are measured at fair value
according to IFRS 3. Whenever possible, the
management uses available market values
when determining the fair values. When this is
not possible, the measurement is based on the
historical revenues from the asset. In particular,
the measurement of intangible assets is based
on discounted cash flows and requires the
management to make estimates on future cash
flows. Although these estimates are based
on the management’s best knowledge, actual
results may differ from the estimates (Note 3
Business acquisitions). The carrying amounts
of assets are reviewed continuously for impair-
ment. More information on this is provided in
the section “Impairment of tangible and intan-
gible assets” under the accounting policies.
Goodwill impairment testing
In testing of goodwill for impairment, the recov-
erable amounts of the cash-generating units to
which the goodwill is allocated are determined
on the basis of value-in-use calculations. These
calculations require management judgements.
Though the assumptions used are appropriate
according to the management’s judgement, the
estimated cash flows may differ fundamentally
from those realised in the future. More informa-
tion on the sensitivity of recoverable amounts
is provided in the notes to the financial state-
ments (Note 13 Goodwill impairment tests).
New or amended IFRS standards and interpretations to be applied in future financial periodsThe Group has not yet applied the following
new or revised standards and interpretations
published by IASB. The Group will adopt them as
of their effective date or, if the effective date is
not the first day of the financial year, as of the
beginning of the financial period following the
effective date.
*= The provisions had not been approved for
application in the EU by 31 December 2018.
• IFRS 16 Leases (effective for annual periods
beginning on or after 1 January 2019). IFRS
16 defines the principles for the recognition,
measurement, presentation and disclosure
of leases. The new standard replaces IAS 17
Leases and the related interpretations. L&T
will adopt the new standard as of 1 January
2019 using the modified retrospective
approach. This means that the cumulative
effect resulting from implementation of IFRS
16 is presented in the opening balance as at
1 January 2019, and the comparative figures
will not be restated for the period ending
44
LASSILA & TIKANOJA / FINANCIAL REVIEW 2018
CORPORATE GOVERNANCE / REPORT BY THE BOARD OF DIRECTORS / KEY FIGURES / FINANCIAL STATEMENTS

31 December 2018. In transition to IFRS 16,
L&T will recognise a lease liability measured
at the present value of the remaining lease
payments for leases previously classified
as operating leases under IAS 17. L&T meas-
ures the right-of-use assets at an amount
equal to lease liability, which means that
the transition will not have any impact on
equity.
L&T leases production and office premises
including related land areas and vehicles.
Lassila & Tikanoja’s lease agreements are
mainly classified as operating leases, for
which a lease expense is recognised in
the income statement in accordance with
IAS 17. IFRS 16 will change the accounting
treatment of those lease agreements.
In addition, L&T has assets leased under
finance lease contracts. These assets
have been capitalised in the balance sheet
during previous periods and recognition and
presentation of these leases will not change
in the transition to IFRS 16.
FRS 16 requires that essentially all leasing
contracts shall be recognised in the balance
sheet. At the commencement date of the
contract, a lessee recognises a lease liability
and a corresponding right-of-use asset
in the balance sheet. The lease liability
is measured at the present value of the
remaining lease payments. In the income
statement, instead of lease expenses, L&T
recognises depreciation on right-of-use
assets and interest expense on the lease
liability.
The standard includes two practical
exemptions relating to short-term leases
for which the lease term is 12 months or
less and leases for which the underlying
asset is of low value. In addition, contracts
relating to certain intangible assets have
been excluded from the scope of IFRS
16, and application of IFRS 16 for lease
contracts relating to other intangible assets
is optional. L&T has decided to apply the
practical exemptions for short-term leases
and low-value assets and will thus not
recognise a right-of-use asset for these
leases. Furthermore, L&T will not apply IFRS
16 to intangible assets. For lessors, the lease
accounting requirements remain substantially
unchanged compared with IAS 17.
In accordance with IFRS 16, the lessee
shall determine the lease term as the non-
cancellable period of a lease adjusted with
any option to extend or terminate the lease,
if the use of such an option is reasonably
certain. L&T has made a contract-by-
contract analysis and assessed whether
it is reasonably certain that any options
to extend or terminate the lease will be
exercised. L&T has ongoing contracts
especially related to real estate and land
areas. Lease term for ongoing contracts will
be determined based on the management’s
estimate when the lease contract will be
terminated. Going forward, management
will assess the lease term of the assets
regularly.
Under IFRS 16, the lessee recognises
the lease liability at the inception of
the contract by discounting the future
minimum lease payments to the present
value. Since the interest rate implicit in
the lease is not readily available in most of
L&T’s lease contracts, the future minimum
lease payments are discounted using L&T’s
incremental borrowing rate. IFRS 16 defines
the incremental borrowing rate as the
interest rate that the lessee would have to
pay to borrow over a similar term, and with
a similar security, the funds necessary to
obtain an asset of a similar value to the right-
of-use asset in a similar economic situation.
L&T has determined the incremental
borrowing rate taking into consideration the
lease term and the financial environment of
the lease.
The impact of adoption of IFRS 16 on
L&T’s lease liabilities and right-of-use
assets as at 1 January 2019 is estimated
to be approximately 50–60 million euros.
The estimated amount to be recognised
as right-of-use assets in accordance
with IFRS 16 and the undiscounted lease
payments amounting to EUR 39.0 million
disclosed in note 30 differ from each other.
The difference is mainly derived from the
fact that according to IAS 17 the amount
of remaining lease payments for ongoing
lease contracts is determined based on a
lease term measured until the first possible
termination date. Under the new standard
the lease term for the ongoing lease
contracts will be determined based on the
management’s estimate when the lease
contract will be terminated. In addition, the
discount rate and the exemptions related to
short-term contracts and low value assets
result in differences compared with the
previous practice.
• IFRIC 23 Uncertainty over Income Tax
Treatments (effective for financial years
beginning on or after 1 January 2019). The
interpretation brings clarity to the account-
ing for income tax treatments that have yet
to be accepted by tax authorities. The key
test is whether the tax authority will accept
the company’s chosen tax treatment. When
considering this the assumption is that tax
authorities will have full knowledge of all
relevant information in assessing a proposed
tax treatment. The interpretation has no
impact on the consolidated financial state-
ments.
• Amendments to IFRS 9 Prepayment Features
with Negative Compensation (effective
for financial years beginning on or after
1 January 2019 The amendments enable
entities to measure at amortised cost some
prepayable financial assets with so-called
negative compensation. The amendments
have no impact on the consolidated financial
statements.
• Amendments to IAS 28: Long-term Interests
in Associates and Joint Ventures* (effective
for financial years beginning on or after 1
January 2019). The amendments clarify that
a company applies IFRS 9 Financial Instru-
ments to long-term interests in an associate
or joint venture that form part of the net
investment in the associate or joint venture.
The amendments have no impact on the
consolidated financial statements.
45
LASSILA & TIKANOJA / FINANCIAL REVIEW 2018
CORPORATE GOVERNANCE / REPORT BY THE BOARD OF DIRECTORS / KEY FIGURES / FINANCIAL STATEMENTS

• Amendments to IAS 19 Plan Amendment,
Curtailment or Settlement* (effective for
financial years beginning on or after 1
January 2019) The amendments clarify that
on amendment, curtailment or settlement
of a defined benefit plan, an entity uses
updated actuarial assumptions to determine
its current service cost and net interest for
the period and the effect of the asset ceiling
is disregarded when calculating the gain
or loss on any settlement of the plan and is
dealt with separately in other comprehen-
sive income (OCI). The amendments has
no significant impact on the consolidated
financial statements.
• Annual Improvements to IFRSs (2014-2017
cycle)* (effective for financial years begin-
ning on or after 1 January 2019). The annual
improvements process provides a mecha-
nism for minor and non-urgent amendments
to IFRSs to be grouped together and issued
in one package annually. The amendments
relate to IFRS 3, IFRS 11, IAS 12 and IAS 23. The
amendments have no impact on the consoli-
dated financial statements.
• Amendments to References to Conceptual
Framework in IFRS Standards* (effective for
financial years beginning on or after 1 Jan-
uary 2020) The revised Framework codifies
IASB’s thinking adopted in recent standards.
The Conceptual Framework primarily serves
as a tool for the IASB to develop stand-
ards and to assist the IFRS Interpretations
Committee in interpreting them. It does not
override the requirements of individual IFRSs.
The amendments has no significant impact
on the consolidated financial statements.
• Amendments to IFRS 3 Definition of a Busi-
ness* (effective for financial years beginning
on or after 1 January 2020) The amendments
narrowed and clarified the definition of
a business. They also permit a simplified
assessment of whether an acquired set of
activities and assets is a group of assets
rather than a business. The amendments has
no significant impact on the consolidated
financial statements.
• Amendments to IAS 1 and IAS 8 Definition
of Material* (effective for financial years
beginning on or after 1 January 2020) The
amendments clarify the definition of material
and include guidance for the definition. In
addition, the explanations accompanying the
definition have been improved. The amend-
ments aim also to ensure that the definition
of material is consistent across all IFRS
Standards. The amendments has no signif-
icant impact on the consolidated financial
statements.
• IFRS 17 Insurance Contracts* (effective
for financial years beginning on or after
1 January 2021). The new standard for
insurance contracts will help investors
and others better understand insurers’ risk
exposure, profitability and financial position.
This standard replaces IFRS 4-standard. The
standard has no impact on the consolidated
financial statements.
46
LASSILA & TIKANOJA / FINANCIAL REVIEW 2018
CORPORATE GOVERNANCE / REPORT BY THE BOARD OF DIRECTORS / KEY FIGURES / FINANCIAL STATEMENTS

1. Transition to IFRS 9 and IFRS 15The Group has applied the new IFRS 9 Financial Instruments and IFRS 15 Revenue from Contracts
with Customers standards from 1 January 2018 onwards. Other new and revised standards has not
had effect on previously reported periods.
IFRS 15 defines a five-step model for recog-
nising revenue from contracts with custom-
ers.The main objective of the standard is to
provide useful information to users of financial
statements about the nature, amount, timing
and uncertainty of revenue and cash flows
arising from a contract with a customers. The
core principle of IFRS 15 is that an entity shall
recognise revenue to depict the transfer of
promised goods or services to customers. The
amount of revenue to be recognised reflects
the consideration to which the Group expects
to be entitled in exchange for those goods or
services. The effect of application of the stand-
ard on Lassila & Tikanoja’s equity in the opening
balance sheet of 1 January 2018 was EUR -1.3
million (1 January 2017: EUR -1.1 million).
In addition to the sale of equipment, the
Group also leases compactors and balers to
customers through an external financing com-
pany. Previously the Group has recognised the
payment received from the financing company
as revenue at the beginning of contract period.
In the transition to IFRS 15, L&T’s management
has determined that due to the repurchase
obligation L&T does not transfer substan-
tially all of the risks and rewards incidental
to ownership of the assets to the customer
and, thus, the leased equipment is treated as
tangible assets. The payment received from
the financing company in the beginning of the
lease contract is presented as a liability. Lease
income is recognised as revenue on a monthly
basis over the lease term.
Consolidated income statement ReportedIFRS 15
adjustmentIFRS 9
adjustment Adjusted
MEUR 2017 2017
Net sales 712.1 -2.5 709.5
Operating profit 44.2 -0.2 44.0
Profit before tax 42.7 -0.2 42.5
Profit for the period 33.7 -0.2 33.5
Consolidated statement of financial position
MEUR31 December
20161 January
2017
Property, plant and equipment 156.1 4.1 160.3
Deferred tax assets 5.5 0.3 5.8
Total equity 223.0 -1.1 221.9
Trade and other payables 129.9 5.5 135.3
MEUR31 December
20171 January
2018
Property, plant and equipment 154.1 6.4 160.5
Deferred tax assets 6.5 0.3 0.1 6.9
Trade and other receivables 137.6 -0.4 137.1
Total equity 218.7 -1.3 -0.4 217.1
Trade and other payables 147.7 8.0 155.7
The objective of IFRS 9 is that the entity
presents in its financial statements information
that enables users of the financial statements
to assess the significant impact of financial
instruments on the financial position and per-
formance of the entity. It also allows the users
to assess the nature and extent of the risks to
which the entity is exposed during and at the
end of the reporting period and how the entity
manages those risks.
The hedge accounting model introduced by
IFRS 9 simplifies the application of hedge ac-
counting and brings hedge accounting closer to
the Group’s risk management strategy and objec-
tives. Effectiveness of hedging of future diesel oil
purchases - retrospective efficiency testing and
efficiency requirement of 80-125% in accordance
with IAS 39 will be eliminated by IFRS 9. Lassila &
Tikanoja will continue hedge accounting for com-
modity swap contracts for diesel oil purchases in
accordance with IFRS 9.
According to the new impairment model,
provisions for impaired receivables must be
recognized following an expected credit loss
model. For Lassila & Tikanoja, the new impair-
ment model is applied to trade receivables and
contract assets and past recognition of their
credit losses. The effect of the application of
the standard on Lassila & Tikanoja’s equity in
the opening balance sheet of 1 January 2018
was EUR -0.4 million.
47
LASSILA & TIKANOJA / FINANCIAL REVIEW 2018
CORPORATE GOVERNANCE / REPORT BY THE BOARD OF DIRECTORS / KEY FIGURES / FINANCIAL STATEMENTS

Reclassifications of financial instruments of the application of IFRS 9
Measurement category IAS 39
Measurement category IFRS 9
Carrying amount, IAS 39 31 December 2017
Carrying amount, IFRS 9 31 December 2018 Change
Non-current financial assets
Other receivables Loans and other receivables Amortised cost 3.3 3.3
Current financial assets
Trade and other receivables Loans and other receivables Amortised cost 137.6 137.1 -0.4
Derivative receivables Hedge accounting Hedge accounting 0.1 0.1
Cash and cash equivalents Loans and other receivables Amortised cost 48.1 48.1
Non-current financial liabilities
Borrowings Loans and other receivables Amortised cost 125.6 125.6
Current financial liabilities
Borrowings Loans and other receivables Amortised cost 22.6 22.6
Derivative liabilities Hedge accounting Hedge accounting 0.2 0.2
The following table describes the reclassification of financial intruments and changes in valuation
as a result of the application of IFRS 9.
48
LASSILA & TIKANOJA / FINANCIAL REVIEW 2018
CORPORATE GOVERNANCE / REPORT BY THE BOARD OF DIRECTORS / KEY FIGURES / FINANCIAL STATEMENTS

2. Revenue from contracts with customers
Disaggregation of revenue
Total net sales2018 MEUR
Revenue recognised over timeRevenue recognised
at a point in time Rent
Long-term service agreements
Separately ordered services Project business
Sales of equipment and materials Lease income
Environmental Services 210.5 57.8 2.0 270.2
Industrial Services 44.5 41.5 5.4 5.1 96.5
Facility Services 187.9 35.3 34.0 257.2
Technical Services 41.4 95.5 11.5 148.4
Renewable Energy Sources 40.7 40.7
Total 484.3 172.3 50.9 103.6 2.0 813.0
Interdivision -10.8
External net sales 802.2
2017 MEUR
Revenue recognised over timeRevenue recognised
at a point in time Rent
Total net salesLong-term
service agreementsSeparately
ordered services Project businessSales of equipment
and materials Lease income
Environmental Services 204.0 57.3 1.4 262.8
Industrial Services 43.5 39.8 3.1 4.2 90.7
Facility Services 194.7 30.9 35.1 260.6
Technical Services 15.9 47.7 8.2 71.8
Renewable Energy Sources 34.9 34.9
Total 458.1 118.5 46.3 96.4 1.4 720.8
Interdivision -11.3
External net sales 709.5
49
LASSILA & TIKANOJA / FINANCIAL REVIEW 2018
CORPORATE GOVERNANCE / REPORT BY THE BOARD OF DIRECTORS / KEY FIGURES / FINANCIAL STATEMENTS

Trade receivables and contract assets have
increased during 2017 due to the acquisition
of L&T FM AB.
As the contracts are generally short-term,
contract liabilities are recognised as revenue
entirely during the following period. Contract
liabilities are included in the balance sheet item
Trade and other payables.
The Group applies the practical expedient of
IFRS 15 and does not disclose the aggregate
amount of the transaction price allocated to
the performance obligations that are unsatis-
fied (or partially unsatisfied) at the end of the
Contract balances
MEUR 2018 2017 1 January 2017
Trade receivables 88.1 96.0 67.0
Contract assets 31.9 30.9 16.0
Contract assets 10.0 9.9 8.9
3. Segment reportingThe Group has five reportable segments, which
are the Group’s business divisions.
The Group changed the segment reporting
as of 1 January 2018. In the change, the Tech-
nical services was separated into an inde-
pendent reporting segment from the Facility
Services division. The reporting segments in
2017 were Environmental Services, Industrial
Services, Facility Services and Renewable
Energy Sources.
Transactions between segments are based
on market prices. Segment information is
reported to the highest operational decision-
maker, consistent with internal reporting. The
highest operational decision-maker is Lassila
& Tikanoja plc’s President and CEO. Group
Administration and Other segment includes
expenses associated with Group management,
as well as costs incurred from operating as a
public company, and the assets and liabilities
corresponding to this income and expenses.
Group administration assets also include avail-
able-for-sale investments.
Segment assets are those operating assets
that are employed by a segment in its operating
activities and that can be allocated to the seg-
ment on a reasonable basis. Segment liabilities
are those operating liabilities that result from
the operating activities of the segment and can
be allocated to the segment on a reasonable
basis. Segment assets consist of intangible
assets, property, plant and equipment, finance
lease receivables, inventories and trade and
other receivables excluding accrued receiv-
ables from interests and tax receivables.
Segment liabilities consist of provisions and
retirement benefit obligations and such non
current liabilities as prepayments, accrued
liabilities and acquisition price liabilities, and
such current liabilities as trade and other
payables excluding accrued liabilities related to
interests and tax liabilities.
Unallocated assets consist of liquid assets,
receivables of interest rate and foreign curren-
cy derivatives, accrued interest receivables
and other finance income and tax receivables.
Unallocated liabilities consist of borrowings,
liabilities of interest rate and foreign currency
derivatives, accrued interest and other financ-
ing liabilities and tax liabilities.
The Group’s operating segments during
the financial year:
Environmental Services division consists of the
waste management and recycling business,
selling of receptacles and their maintenance
business and new circular economy solutions.
Industrial Services division covers solutions
for industrial material flows and their utilisation,
industrial process cleaning solutions, collection
and disposal of hazardous waste and sewer
system maintenance and repair solutions.
The Facility Services division provides sup-
port services and services for cleaning, prop-
erty maintenance, real estate management as
well as repair and renovation services.
Technical Services -division provides build-
ing automation, refrigeration technology and
energy management.
Renewable Energy Sources (L&T Biowatti)
provides its customers with wood-based fuels,
recycled fuels and wood raw materials. It also
provides forest services to forest owners.
reporting period. This is because the contract
period in L&T’s customer contracts for project
deliveries, is typically short. However, in long-
term service agreements the contract period
can be several years. For these contracts the
Group applies the practical exedient according
to which the Group is entitled to a consider-
ation from the customer that corresponds
directly with the value to the customer from
Groups performance completed to date. In
these contracts the Group recognises revenue
for the amount that it is entitled to invoice.
50
LASSILA & TIKANOJA / FINANCIAL REVIEW 2018
CORPORATE GOVERNANCE / REPORT BY THE BOARD OF DIRECTORS / KEY FIGURES / FINANCIAL STATEMENTS

2018 MEUREnvironmental
ServicesIndustrial Services
Facility Services
Technical Services
Renewable Energy Sources
Group administration
and other Eliminations Group
Net sales
External net sales 267.0 93.7 254.4 146.6 40.5 802.2
Inter-division net sales 3.2 2.9 2.8 1.8 0.2 -10.8 0.0
Total net sales 270.2 96.5 257.2 148.4 40.7 -10.8 802.2
Operating profit 31.6 10.0 5.0 4.5 0.0 -3.5 47.6
Operating margin, % 11.7 10.4 1.9 3.0 0.0 5.9
Financial income and expenses -4.9
Profit before tax 42.7
Income taxes -8.7
Profit for the period 34.1
Assets
Segment assets 216.7 72.8 89.0 101.7 20.9 0.6 501.7
Unallocated assets 61.8
Total assets 563.5
Liabilities
Segment liabilities 59.2 29.9 46.7 19.4 8.5 4.7 168.3
Unallocated liabilities 182.8
Total liabilities 351.1
Capital expenditure 20.6 8.4 6.9 1.7 0.2 0.0 37.8
Depreciation and amortisation 20.2 7.5 10.7 3.9 0.3 0.0 42.5
51
LASSILA & TIKANOJA / FINANCIAL REVIEW 2018
CORPORATE GOVERNANCE / REPORT BY THE BOARD OF DIRECTORS / KEY FIGURES / FINANCIAL STATEMENTS

2017 MEUREnvironmental
ServicesIndustrial Services
Facility Services
Technical Services
Renewable Energy Sources
Group administration
and other Eliminations Group
Net sales
External net sales 259.2 87.4 258.0 70.2 34.7 709.5
Inter-division net sales 3.5 3.3 2.6 1.7 0.2 -11.3 0.0
Total net sales 262.8 90.7 260.6 71.8 34.9 -11.3 709.5
Operating profit 31.6 8.7 5.2 1.6 0.7 -3.9 44.0
Operating margin, % 12.0 9.6 2.0 2.3 2.0 6.2
Financial income and expenses -1.5
Profit before tax 42.5
Income taxes -9.0
Profit for the period 33.5
Assets
Segment assets 218.4 74.1 103.5 98.8 22.7 2.1 519.5
Unallocated assets 57.8
Total assets 577.3
Liabilities
Segment liabilities 55.3 27.4 52.2 15.9 7.6 5.3 163.7
Unallocated liabilities 196.2
Total liabilities 359.9
Capital expenditure 24.8 9.0 10.1 68.6 0.2 0.4 113.2
Depreciation and amortisation 19.9 7.3 11.3 2.3 0.3 41.1
52
LASSILA & TIKANOJA / FINANCIAL REVIEW 2018
CORPORATE GOVERNANCE / REPORT BY THE BOARD OF DIRECTORS / KEY FIGURES / FINANCIAL STATEMENTS

Reconciliation of reportable segments’ assets to total assets
MEUR 2018 2017
Segment assets for reportable segments 501.2 517.4
Other segments' assets 0.6 2.1
501.7 519.5
Unallocated assets
Liquid assets 54.3 48.1
Tax assets 6.0 7.7
Other unallocated assets 1.4 2.0
Total 61.8 57.8
Total assets 563.5 577.3
Reconciliation of reportable segments’ liabilities to total liabilities
MEUR 2018 2017
Segment liabilities for reportable segments 163.6 158.4
Other segments' liabilities 4.7 5.3
168.3 163.7
Unallocated liabilities
Liabilities of interest rate and foreign currency derivatives 149.8 166.2
Accrued interest and other financing liabilities 3.4 0.7
Tax liabilities 29.6 29.3
Total 182.8 196.2
Total liabilities 351.1 359.9
Geographical segments
Net sales of geographical areas are reported based on the geographical location of the customer,
and assets are reported by geographical location.
MEUR 2018 2017
Net sales
Finland 644.3 627.6
Other countries 157.9 81.9
Total 802.2 709.5
Assets
Finland 437.3 451.9
Other countries 64.5 67.9
Unallocated assets 61.8 57.5
Total 563.5 577.3
Capital expenditure
Finland 36.3 43.7
Other countries 1.5 69.5
Total 37.8 113.2
53
LASSILA & TIKANOJA / FINANCIAL REVIEW 2018
CORPORATE GOVERNANCE / REPORT BY THE BOARD OF DIRECTORS / KEY FIGURES / FINANCIAL STATEMENTS

4. Business acquisitionsIn business combinations, all property, plant
and equipment acquired is measured at fair
value on the basis of the market prices of
similar assets, taking into account the age of
the assets, wear and tear and similar factors.
Tangible assets will be depreciated over their
useful life according to the management’s
estimate, taking into account the depreciation
principles observed within the Group.
Intangible assets arising from business
combinations are recognised separately from
goodwill at fair value at the time of acqui-
sition if they are identifiable. In connection
with acquired business operations, the Group
mostly has acquired agreements on prohibition
of competition and customer relationships.
The fair value of customer agreements and
customer relationships associated with them
has been determined on the basis of estimat-
ed duration of customer relationships and
discounted net cash flows arising from current
customer relationships. The value of agree-
ments on prohibition of competition is calculat-
ed in a similar manner through cash flows over
the duration of the agreement. Other intangible
assets will be amortised over their useful life
according to agreement or the management’s
estimate.
In addition to the skills of the personnel of
the acquired businesses, goodwill arising from
business combinations comprises other intan-
gible items. These unidentified items include
the potential for gaining new customers in the
acquired businesses and the opportunities for
developing new products and services, as well
as the regionally strong position of an acquired
business. All business combinations also cre-
ate synergy benefits that consist primarily of
savings in fixed production costs.
Changes in acquisition costs may arise on
the basis of terms and conditions related to the
acquisition price in the deeds of sale. In many
acquisitions a small portion of the acquisition
price is contingent on future events (less
than 12 months).These conditional acquisition
prices are recognised at fair value at the time
of acquisition, and any changes are recorded
without profit impact through the acquisition
cost calculation.
Lassila & Tikanoja acquired the business
operations of Kymen Talopalvelu Oy on 1 De-
cember 2018. The aquisistion includes property
maintenance and the cleaning business in
Kouvola area.
On 3 January 2017, Lassila & Tikanoja plc ac-
quired the business operations of Pieksämäki-
based firm Pieksämäen Keräys Oy. The
acquisition includes the waste management
and recycling operations. On 1 February 2017,
Lassila & Tikanoja plc acquired Oulun Viermäri-
huolto Oy, which specialises in sewer mainte-
nance and industrial cleaning. On 2 May 2017,
Lassila & Tikanoja plc acquired the environ-
mental businesses of Pihtiputaan Jätehuolto
Oy and Viitasaari-based Hyötykolmio Oy. On 31
August 2017, Lassila & Tikanoja plc completed
the acquisition of the entire share capital of
Veolia FM AB (L&T FM AB) from Veolia Nordic
AB. With this acquisition, Lassila & Tikanoja plc
strengthened its presence in the Swedish fa-
cility services market by broadening its service
offering in Sweden to include the maintenance
of technical systems.
The figures regarding the acquisition of
L&T FM AB is shown separately. The figures
for other acquired businesses are stated in
aggregate, because none of them is of material
importance when considered separately. Fair
values have been determined as of the time
the acquisition was realised. No business
operations have been divested as a conse-
quence of any acquisition. All acquisitions have
been paid for in cash. With share acquisitions,
L&T was able to gain 100% of the voting rights.
The acquisition of L&T FM AB was completed
on 31 August 2017 and the acquired entity has
been included in the consolidated financial
statements as of 1 September 2017 based on
the preliminary acquisition price calculation.
The IFRS calculation of the acquisition price on
31 December 2018 is final.
In the first quarter of 2018, a transaction
price refund of EUR 2.2 million was received,
which affects cash flow from investing ac-
tivities by EUR 1.6 million. In the Consolidated
Statement of Cash Flows this is shown on a
row Acquisitions of subsidiaries and business-
es, net of cash acquired netted with the ac-
quisition of the 2018 business. In addition, the
value of the acquired balance sheet items was
adjusted by SEK 34.5 million in the third quarter.
The adjustments are presented as an increase
in property, plant and equipment.
Business acquisitions made during 2018 had
no effect on the company’s net sales (compari-
son period EUR 39.9 million) and EUR 0.0 million
(1.0) on operating profit.
54
LASSILA & TIKANOJA / FINANCIAL REVIEW 2018
CORPORATE GOVERNANCE / REPORT BY THE BOARD OF DIRECTORS / KEY FIGURES / FINANCIAL STATEMENTS

OTHER BUSINESS ACQUISITIONS, COMBINED
MEUR 2018 2017
Intangible assets 0.2 0.6
Property, plant and equipment 0.1 1.0
Non-current available-for-sale financial assets - 0.0
Trade and other receivables - 0.3
Cash and cash equivalents - 1.0
Total assets 0.2 2.9
Trade and other payables - 0.3
Deferred tax liabilities - 0.0
Total liabilities - 0.3
Total identifiable net assets 0.2 2.6
Total consideration 0.4 4.1
Goodwill 0.2 1.5
Impact on cash flow
Paid in cash -0.4 -4.1
Cash acquired - 1.0
Outstanding payments 0.1 0.2
Cash flows from investing activities -0.3 -3.0
L&T FM AB
MEUR 2018 2017
Intangible assets 19.0 19.0
Property, plant and equipment 0.1 0.1
Non-current available-for-sale financial assets 0.0 -
Trade and other receivables 27.5 32.2
Cash and cash equivalents 0.8 0.8
Total assets 47.5 52.1
Trade and other payables 16.8 16.8
Deferred tax liabilities 3.9 4.2
Total liabilities 20.7 21.0
Total identifiable net assets 26.8 31.2
Total consideration 63.4 64.9
Goodwill 36.6 33.7
Impact on cash flow
Paid in cash -63.4 -64.9
Cash acquired 0.8 0.8
Cash flows from investing activities -62.6 -64.1
55
LASSILA & TIKANOJA / FINANCIAL REVIEW 2018
CORPORATE GOVERNANCE / REPORT BY THE BOARD OF DIRECTORS / KEY FIGURES / FINANCIAL STATEMENTS

5. Employee benefit expensesMEUR 2018 2017
Wages and salaries 259.3 237.0
Pension costs
Defined contribution plans 56.4 49.4
Defined benefit plans 0.0 0.0
Share-based payment 0.2 0.2
Other personnel expenses 8.3 10.4
Total 324.2 296.9
Average number of employees in full-time equivalents
2018 2017
White collar 1,279 1,326
Blue collar 6,287 6,549
Total 7,566 7,875
Finland 6,199 6,288
Other countries 1,367 1,587
Total 7,566 7,875
6. Other operating income and expensesMEUR 2018 2017
Other operating income
Gains on sales of property, plant and equipment 1.3 1.5
Annual discounts 1.5 1.7
Reversals of impairment losses on trade receivables 0.5 0.3
Reimbursements and government grants 0.6 0.4
Change in commodity derivatives 0.4 0.2
Other 0.8 1.6
Total 5.2 5.7
Other operating expenses
ICT costs 13.9 12.1
Travel costs 11.6 10.7
Vehicles and machinery 40.5 36.3
Rents and real estate costs 16.7 14.5
Expert fees 6.4 7.4
Voluntary social security costs 6.1 6.3
Other 13.6 12.8
Total 108.7 100.3
Details on share-based payment are presented in Note 22 Share-based payment.
The employee benefits of the top management are presented in Note 32 Related-party transactions.
Details on the items of defined benefit pension plans in the consolidated statement of financial
position are presented in Note 23 Retirement benefit obligations.
7. Research and development expensesEUR 1.8 million (2.0) research and development expenses arising from centralised development
projects are included in the income statement.
56
LASSILA & TIKANOJA / FINANCIAL REVIEW 2018
CORPORATE GOVERNANCE / REPORT BY THE BOARD OF DIRECTORS / KEY FIGURES / FINANCIAL STATEMENTS

8. Financial income and expenses
MEUR 2018 2017
Financial income
Interest income on loans and other receivables 0.4 0.2
Foreign exchange gains - 0.8
Total financial income 0.4 1.0
Financial expenses
Interest expenses on borrowings measured at amortised cost 2.4 2.0
Other financial expenses 1.4 0.4
Losses on foreign exchange 1.1 -
Total financial expenses 4.9 2.4
Financial income and expenses -4.5 -1.4
9. Income taxes
Income tax in the income statement
MEUR 2018 2017
Income tax for the period -5.1 -10.0
Income tax for previous periods 0.0 0.0
Change in deferred tax -3.6 1.1
Total -8.7 -8.9
The differences between income tax expense recognised in the income statement and income tax calculated at the statutory tax rate, are as follows:
MEUR 2018 2017
Profit before tax 42.7 42.5
Income tax at Finnish tax rate 20 % -8.5 -8.5
Difference between tax rate in Finland and in other countries 0.0 0.0
Expenses not deductible for tax purposes -0.2 -0.4
Tax exempt income 0.0 0.0
Income tax for previous periods 0.0 0.0
Unrecognised deferred tax on loss for the period -0.1 -0.1
Use of previous years losses 0.1 0.1
Other items 0.1 -0.1
Total -8.7 -8.9
57
LASSILA & TIKANOJA / FINANCIAL REVIEW 2018
CORPORATE GOVERNANCE / REPORT BY THE BOARD OF DIRECTORS / KEY FIGURES / FINANCIAL STATEMENTS
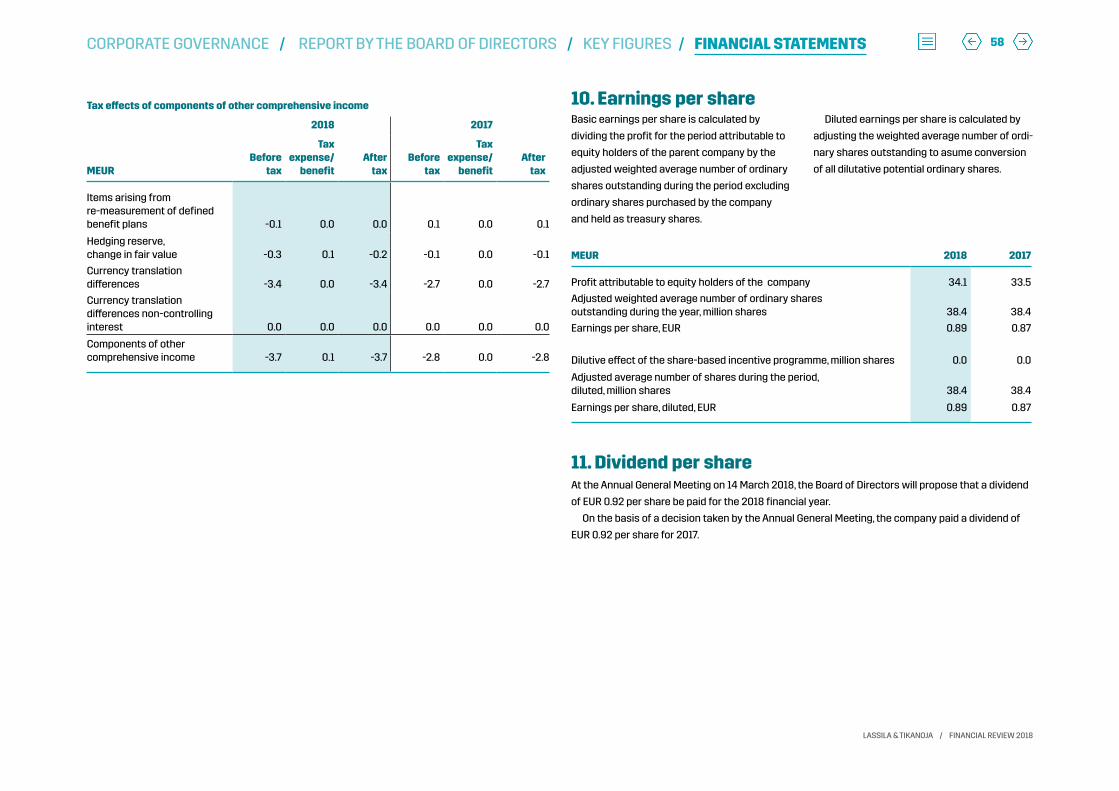
MEUR 2018 2017
Profit attributable to equity holders of the company 34.1 33.5
Adjusted weighted average number of ordinary shares outstanding during the year, million shares 38.4 38.4
Earnings per share, EUR 0.89 0.87
Dilutive effect of the share-based incentive programme, million shares 0.0 0.0
Adjusted average number of shares during the period, diluted, million shares 38.4 38.4
Earnings per share, diluted, EUR 0.89 0.87
Tax effects of components of other comprehensive income
2018 2017
MEURBefore
tax
Tax expense/
benefitAfter
taxBefore
tax
Tax expense/
benefitAfter
tax
Items arising from re-measurement of defined benefit plans -0.1 0.0 0.0 0.1 0.0 0.1
Hedging reserve, change in fair value -0.3 0.1 -0.2 -0.1 0.0 -0.1
Currency translation differences -3.4 0.0 -3.4 -2.7 0.0 -2.7
Currency translation differences non-controlling interest 0.0 0.0 0.0 0.0 0.0 0.0
Components of other comprehensive income -3.7 0.1 -3.7 -2.8 0.0 -2.8
10. Earnings per shareBasic earnings per share is calculated by
dividing the profit for the period attributable to
equity holders of the parent company by the
adjusted weighted average number of ordinary
shares outstanding during the period excluding
ordinary shares purchased by the company
and held as treasury shares.
Diluted earnings per share is calculated by
adjusting the weighted average number of ordi-
nary shares outstanding to asume conversion
of all dilutative potential ordinary shares.
11. Dividend per shareAt the Annual General Meeting on 14 March 2018, the Board of Directors will propose that a dividend
of EUR 0.92 per share be paid for the 2018 financial year.
On the basis of a decision taken by the Annual General Meeting, the company paid a dividend of
EUR 0.92 per share for 2017.
58
LASSILA & TIKANOJA / FINANCIAL REVIEW 2018
CORPORATE GOVERNANCE / REPORT BY THE BOARD OF DIRECTORS / KEY FIGURES / FINANCIAL STATEMENTS

MEUR Goodwill
Customer contracts arising from acquisitions
Agreements on prohibition
of competition
Other intangible as sets arising
from acquisitions Intangible rightsOther
intangible assets Prepayments Total
Acquisition cost, 1 Jan 2018 164.9 48.1 24.0 10.1 14.8 45.3 3.6 310.8
Additions 0.1 0.9 1.2 3.1 5.3
Business acquisitions 2.9 0.2 0.0 3.1
Disposals -0.4 -1.6 -1.9
Transfers between items 0.0 6.2 -6.1 0.1
Exchange differences -1.9 -0.9 0.0 0.0 -0.1 0.0 -2.9
Acquisition cost, 31 Dec 2018 166.0 47.4 23.9 10.1 15.3 51.1 0.6 314.4
Accumulated amortisation and impairment at 1 Jan 2018 -14.7 -25.5 -23.9 -9.6 -12.3 -28.5 -114.5
Accumulated amortisation on disposals and transfers 0.0 0.0 0.0 0.0 0.4 1.6 0.0 1.9
Amortisation charge 0.0 -2.9 0.0 -0.1 -0.6 -5.1 0.0 -8.6
Exchange differences 0.1 0.2 0.0 0.0 0.0 0.0 0.0 0.4
Accumulated amortisation and impairment at 31 Dec 2018 -14.5 -28.2 -23.9 -9.6 -12.5 -32.0 -120.8
Book value, 31 Dec 2018 151.5 19.2 0.0 0.5 2.8 19.1 0.6 193.6
Acquisition cost, 1 Jan 2017 131.2 29.3 23.9 10.1 13.7 42.6 0.7 251.6
Additions 0.7 1.0 5.3 7.1
Business acquisitions 34.0 18.9 0.0 0.0 53.0
Disposals 0.0 -0.3 0.0 -0.4
Transfers between items 0.8 1.7 -2.4 0.0
Exchange differences -0.4 -0.1 0.0 0.0 0.0 0.0 -0.6
Acquisition cost, 31 Dec 2017 164.9 48.1 24.0 10.1 14.8 45.3 3.6 310.8
Accumulated amortisation and impairment at 1 Jan 2017 -14.8 -24.1 -23.9 -9.5 -12.3 -24.0 -108.5
Accumulated amortisation on disposals and transfers 0.3 0.0 0.4
Amortisation charge -1.5 -0.1 -0.1 -0.4 -4.6 -6.6
Exchange differences 0.1 0.1 0.0 0.0 0.0 0.0 0.3
Accumulated amortisation and impairment at 31 Dec 2017 -14.7 -25.5 -23.9 -9.6 -12.3 -28.5 -114.5
Book value, 31 Dec 2017 150.2 22.6 0.0 0.5 2.5 16.8 3.6 196.3
Other intangible assets arising from acquisitions include mainly patents and permits.
Contractual commitments related to intangible assets totalled EUR 0.2 million (0.2).
12. Intangible assets
59
LASSILA & TIKANOJA / FINANCIAL REVIEW 2018
CORPORATE GOVERNANCE / REPORT BY THE BOARD OF DIRECTORS / KEY FIGURES / FINANCIAL STATEMENTS

13. Goodwill impairment testsGoodwill allocation
The carrying amounts of goodwill are allocated to cash-generating units in accordance with the table below:
MEUR 2018 2017
Environmental Services, Finland 73.7 73.7
Industrial Services 19.4 19.4
Facility Services, Finland 19.0 22.4
Technical Services, Finland 3.6 -
L&T Service AB 1.8 2.2
L&T FM AB 34.0 32.6
Total 151.5 150.2
Impairment tests
In impairment tests, recoverable amounts are
estimated on the basis of an asset’s value in
use. Future cash flows are based on annual
estimates of income statements and upkeep
investments made by the management in
connection with the budgeting process for a
four-year period. The management bases its
estimates on actual development and views
on the growth outlook for the industry (general
market development and unit profitability,
pricing, municipalisation decisions, personnel
costs and raw material costs). Approved
investment decisions are taken into account in
the growth estimates.
Cash flows extending beyond the four-
year forecast period are calculated using the
so-called terminal value method. The growth
rates used in the calculations are based on the
management’s estimates of long-term growth
in cash flow.
The discount rates used in calculations are
based on the Group’s weighted average cost
of capital before tax (WACC). Factors in WACC
are risk-free income, market risk premium, divi-
sion-specific beta cost of capital as well as the
ratio between equity and liabilities. A discount
Long-term growth rates used in the value-in-use calculations of cash-generating units:
% 2018 2017
Environmental Services, Finland 1.3 1.5
Industrial Services 1.5 1.5
Facility Services, Finland 1.5 1.5
Technical Services, Finland 2.0 -
L&T Service AB 1.5 1.5
L&T FM AB 2.0 2.0
rate has been defined for each cash-generat-
ing unit. The differences in the discount rates
are due to, for instance, the different risks the
units face in their business operations and the
geographical location of the units.
Discount rates used in the calculations:
% 2018 2017
Environmental Services, Finland 8.8 8.5
Industrial Services 8.9 8.5
Facility Services, Finland 10.3 9.8
Technical Services, Finland 10.1 -
L&T Service AB 10.7 10.0
L&T FM AB 10.3 10.3
No instances of impairment were identified during impairment testing.
60
LASSILA & TIKANOJA / FINANCIAL REVIEW 2018
CORPORATE GOVERNANCE / REPORT BY THE BOARD OF DIRECTORS / KEY FIGURES / FINANCIAL STATEMENTS

Sensitivity analyses of impairment testing
Values in use exceeding book values are classi-
fied as follows: 0%, 1-10%, 11-25%, 25-50% and
over 50%. The company has estimated that no
somewhat probable change in the key assump-
tions could cause the book value of a cash-gen-
erating unit to exceed its value in use in any unit
in which the book value has been exceeded by
over 50%.
Value in use in relation to book value:
2018 2017
Environmental Services, Finland Over 50% Over 50%
Industrial Services Over 50% Over 50%
Facility Services, Finland Over 50% Over 50%
Technical Services, Finland Over 50% -
L&T Service AB Over 50% Over 50%
L&T FM AB 10–25% 10-25%
Future EBITDA percentages have been set con-
servatively. Their values are based on actual
development. The EBITDA percentages used in
the calculation of terminal values are a signifi-
cant factor in the calculation of value in use.
EBITDA percentages used in the calculation
of terminal values for those cash generating
units that had a value in use relation to book
value less than 50 % at closing date for current
year and comparison year.
% 2018 2017
L&T FM AB 6.0 6.0
A sensitivity analysis of each cash-generating
unit was performed, during which the key cal-
culation assumptions were tested. In the sen-
sitivity analysis, a key assumption was tested
by changing the threshold values at which the
value in use would equal the book value.
Key assumptions tested in the sensitivity
analyses and their threshold values for those
cash generating units that had a value in use
relation to book value less than 50% at closing
date for current year and comparison year.
Key assumptions tested in the sensitivity analysis and their limit values:
2018 2017
% Discount rate
EBITDA percentage used in the calculation of terminal value Discount rate
EBITDA percentage used in the calculation of terminal value
L&T FM AB 11.8 4.9 11.9 4.5
61
LASSILA & TIKANOJA / FINANCIAL REVIEW 2018
CORPORATE GOVERNANCE / REPORT BY THE BOARD OF DIRECTORS / KEY FIGURES / FINANCIAL STATEMENTS

MEUR LandBuildings and
constructionsMachinery
and equipment* Other
Prepayments and construction in
progress Total
Acquisition cost, 1 Jan 2018 5.8 125.2 436.7 0.2 2.0 569.7
Additions 0.5 25.4 6.3 32.2
Business acquisitions 0.1 0.1
Disposals -0.1 -0.3 -24.4 0.0 -24.8
Transfers between items 1.1 1.8 -3.0 -0.1
Exchange differences -0.1 -0.3 -0.9 0.0 0.0 -1.2
Acquisition cost, 31 Dec 2018 5.6 126.3 438.7 0.2 5.2 575.9
Accumulated depreciation at 1 Jan 2018 -0.5 -84.9 -323.7 -0.1 -409.2
Accumulated depreciation on disposals and transfers 0.2 23.1 23.3
Depreciation for the period -6.2 -27.7 -33.9
Exchange differences 0.1 0.5 0.0 0.6
Accumulated depreciation at 31 Dec 2018 -0.5 -90.8 -327.8 -0.1 -419.2
Net book value at 31 Dec 2018 5.1 35.5 110.9 0.1 5.2 156.8
14. Property, plant and equipment
The book value of machinery and equipment includes EUR 23.6 million (17.6) in assets leased under a finance lease contract and EUR 8.6 million (6,4) of compactors and balers sold through an external
financing company. Due to the repurchase obligation the leased equipment is treated as tangible assets. The Group has changed its booking principle due to the implementation of IFRS 15 standard.
The impact of the application of the standard has been presented in Note 1 Transition to IFRS 9 and IFRS 15.
Contractual commitments related to property, plant and equipment totalled EUR 8.9 million (1.9).
Acquisition cost, 1 Jan 2017 5.8 120.4 420.6 0.2 5.3 552.4
Additions 1.9 30.0 3.4 35.4
Business acquisitions 1.1 1.1
Disposals -1.9 -16.5 0.0 -18.4
Transfers between items 4.9 1.9 -6.8 0.0
Exchange differences 0.0 -0.2 -0.5 0.0 0.0 -0.7
Acquisition cost, 31 Dec 2017 5.8 125.2 436.7 0.2 2.0 569.7
Accumulated depreciation at 1 Jan 2017 -0.5 -79.8 -311.7 -0.1 -392.1
Accumulated depreciation on disposals and transfers 1.1 16.0 17.1
Depreciation for the period -6.3 -28.2 -34.5
Exchange differences 0.1 0.3 0.0 0.4
Accumulated depreciation at 31 Dec 2017 -0.5 -84.9 -323.7 -0.1 -409.2
Net book value at 31 Dec 2017 5.3 40.3 113.0 0.1 2.0 160.5
*Acquisition cost and accumulated depreciation of 1 January 2017 has been adjusted due to implementation of IFRS 15 -standard.
62
LASSILA & TIKANOJA / FINANCIAL REVIEW 2018
CORPORATE GOVERNANCE / REPORT BY THE BOARD OF DIRECTORS / KEY FIGURES / FINANCIAL STATEMENTS

15. Group companiesGroup’s parent company
Lassila & Tikanoja Plc
Finnish subsidiariesGroup holding of
shares and votes, %
L&T Relations Oy, Helsinki 100.0
L&T Toimi Oy, Helsinki 100.0
L&T Biowatti Oy, Helsinki 100.0
Kiinteistö Oy Vantaan Valimotie 33, Helsinki 100.0
L&T Hankinta Ky, Helsinki 100.0
L&T Korjausrakentaminen Oy, Helsinki 100.0
L&T Työllistämispalvelu Oy, Helsinki 100.0
Huurinainen Oy, in voluntary liquidation, Helsinki 100.0
Kuljetus J Hirvonen Oy, liquidated, Kitee 100.0
Oulun Viemärihuolto Oy, liquidated, Oulu 100.0
Foreign subsidiariesGroup holding of
shares and votes, %
Lassila & Tikanoja Service AB, Stockholm, Sweden 100.0
Lassila & Tikanoja FM AB, Stockholm, Sweden 100.0
Lassila & Tikanoja Services OÜ, Tallinn, Estonia 100.0
L&T Ecoinvest LLC, Dubna, Russia 100.0
L&T LLC, Dubna, Russia 100.0
The Russian-Finnish Company Ecosystem LLC, Dubna, Russia 90.0
Associated companiesGroup holding of
shares and votes, %
Suomen Keräystuote Oy, Helsinki 40.0
Moppicom Oy, in voluntary liquidation, Helsinki 43.7
16. Finance lease receivablesMEUR 2018 2017
Maturity of minimum lease payments
Not later than one year 0.2 0.6
Later than one year and not later than five years 0.1 0.3
Later than five years 0.0 0.0
Gross investment in finance lease agreements 0.3 0.9
Maturity of present value of minimum lease payments
Not later than one year 0.2 0.6
Later than one year and not later than five years 0.1 0.3
Later than five years 0.0 0.0
Total present value of minimum lease payments 0.3 0.8
Unearned finance income 0.0 0.0
Gross investment in finance lease agreements 0.3 0.9
Finance lease receivables result from leases of compactors, balers and other assets to customers. The minimum payments include the payment of the transfer of the title to the asset at the end of lease term if the option to purchase is such that it is reasonably certain at the commencement of the lease term that the option will be exercised or if a binding contract has been made on the purchase.
63
LASSILA & TIKANOJA / FINANCIAL REVIEW 2018
CORPORATE GOVERNANCE / REPORT BY THE BOARD OF DIRECTORS / KEY FIGURES / FINANCIAL STATEMENTS

17. Change in deferred income tax assets and liabilities during the period
MEUR At 1 Jan 2018
Recognised in income
statementRecognised
in equity Other changesBusiness
acquisitions At 31 Dec 2018
Deferred tax assets
Pension benefits 0.2 0.0 0.0 0.2
Provisions 1.0 -0.1 0.8
Fair value adjustments 0.0 0.0 0.1 0.1
Deferred depreciation 1.0 0.2 1.2
Other tax deductible temporary differences 6.5 -3.3 0.0 -0.1 0.0 3.2
Total 8.7 -3.3 0.1 -0.1 0.0 5.4
Deferred tax liabilities
Depreciation differences and dissolution losses -31.0 0.6 0.0 -0.8 0.0 -31.2
Finance leasing agreements -0.1 0.0 0.0
Share-based benefits 0.1 0.0 0.0 0.1
Other tax deductible temporary differences 0.0 0.0 0.0 0.0 0.0 0.0
Total -31.0 0.7 0.0 -0.8 0.0 -31.2
Net deferred tax liability -22.3 -2.6 0.1 -0.9 0.0 -25.7
64
LASSILA & TIKANOJA / FINANCIAL REVIEW 2018
CORPORATE GOVERNANCE / REPORT BY THE BOARD OF DIRECTORS / KEY FIGURES / FINANCIAL STATEMENTS

MEUR At 1 Jan 2017
Recognised in income
statementRecognised
in equity Other changesBusiness
acquisitions At 31 Dec 2017
Deferred tax assets
Pension benefits 0.2 0.0 0.0 0.2
Provisions 0.9 0.0 1.0
Fair value adjustments 0.0 0.0 0.0 0.0
Deferred depreciation 0.9 0.1 1.0
Other tax deductible temporary differences 5.7 -0.1 0.0 0.7 6.4
Total 7.7 0.1 0.1 0.0 0.7 8.6
Deferred tax liabilities
Depreciation differences and dissolution losses -26.6 0.9 0.0 0.0 -5.2 -31.0
Finance leasing agreements -0.2 0.1 -0.1
Share-based benefits 0.0 0.0 0.0 0.1
Other tax deductible temporary differences 0.0 -0.1 0.0 0.0 0.0 0.0
Total -26.7 0.9 0.0 0.0 -5.2 -31.0
Net deferred tax liability -19.0 1.1 0.1 0.0 -4.5 -22.4
Deferred taxes in the statement of financial position
MEUR 2018 2017
Deferred tax assets 3.6 6.8
Deferred tax liabilities -29.3 -29.2
Net deferred tax liabilities -25.7 -22.4
Deferred tax is recognised in the statement of financial position as tax assets and tax liabilities. Deferred tax assets and deferred tax liabilities are set off if both the assets and the liabilities relate to the same taxable entity and if the amount is not significant.
Other tax deductible temporary differences include a deferred tax asset related to revenue recognition of amortisation on dissolution losses, which amounts to EUR 2.0 million (2.0).
65
LASSILA & TIKANOJA / FINANCIAL REVIEW 2018
CORPORATE GOVERNANCE / REPORT BY THE BOARD OF DIRECTORS / KEY FIGURES / FINANCIAL STATEMENTS

19. Trade and other receivablesMEUR 2018 2017
Trade receivables 88.1 96.0
Contract assets 31.9 30.9
Current finance lease receivables 0.2 0.6
Loan receivables 0.3 0.3
Accruals 8.1 7.4
Prepayments 0.6 0.5
Tax receivables 2.4 1.0
Other receivables 0.5 1.5
Total 132.2 138.2
Accruals include the following:
Employees' health care compensation 1.4 1.3
Statutory pension insurances 2.2 1.8
Licences 0.7 0.7
Other 3.8 3.6
Total 8.1 7.4
The receivables are not collaterised. Impairment losses and their reversals recognised in trade receivables are shown in Note 6 Other operating income and expenses.
20. Cash and cash equivalentsMEUR 2018 2017
Cash on hand and in banks 54.3 48.1
Total 54.3 48.1
Cash and cash equivalents are presented in nominal values, which equal to their fair values.
18. InventoriesMEUR 2018 2017
Raw materials and consumables 14.6 16.9
Finished goods 2.8 3.1
Other inventories 3.6 3.9
Total 21.0 23.9
The acquisition cost recognised as cost of inventories was EUR 32.3 million (29.9), which includes a change in inventories of EUR -2.4 million (-1.0).
EUR 1.6 million (0.9) of the value of inventories was recognised as an expense, and a write-down of the carrying value to the net realisable value was made respectively. The expense is included in Materials and services in the income statement.
66
LASSILA & TIKANOJA / FINANCIAL REVIEW 2018
CORPORATE GOVERNANCE / REPORT BY THE BOARD OF DIRECTORS / KEY FIGURES / FINANCIAL STATEMENTS

21. EquityShare capital and share premium fund
MEUR Number of outstanding shares, 1,000 shares Share capital
Invested non-restricted equity reserve Own shares Total
At 1 Jan 2018 38,398 19.4 0.6 -6.6 13.4
23 February 2018 Transfer of own shares 3 0.1 0.1
21 March 2018 Transfer of own shares 5 0.0 0.0
Recognition of share-based benefits as expenses 0.0 0.0
At 31 Dec 2018 38,406 19.4 0.6 -6.5 13.5
MEUR Number of outstanding shares, 1,000 shares Share capital
Invested non-restricted equity reserve Own shares Total
At 1 Jan 2017 38,378 19.4 0.4 -6.8 13.0
24 February 2017 Transfer of own shares 16 0.2 0.2
31 March 2017 Transfer of own shares 4 0.1 0.1
Recognition of share-based benefits as expenses 0.1 0.1
At 31 Dec 2017 38,398 19.4 0.6 -6.6 13.4
Lassila & Tikanoja plc has one share series. There is no maximum to the number of the shares and the share capital in the Articles of Association. A share has neither a nominal value nor a book equivalent value. All issued shares have been paid for in full.
At 31 December 2018 the company held 392,952 of its own shares (400,862).
Invested non-restricted equity reserve includes other equity type investments and share subscription prices to the extent that they are not expressly designated to be included in share capital.
67
LASSILA & TIKANOJA / FINANCIAL REVIEW 2018
CORPORATE GOVERNANCE / REPORT BY THE BOARD OF DIRECTORS / KEY FIGURES / FINANCIAL STATEMENTS

Other reservesTranslation reserve
Translation differences arise from the transla-
tion of the equity and earnings of subsidiaries
into euros.
Hedging reserves
Hedging reserve includes effective changes in
the fair values of derivative instruments used
for hedging of cash flow.
Capital management
The objective of the Group’s capital manage-
ment is to secure the continuity of operations
and maintain an optimal capital structure to
MEUR 2018 2017
Equity in the consolidated statement of financial position 212.4 217.4
Statement of financial position total 563.5 577.3
Current advances received -13.2 -13.5
Non-current advances received -0.3 -0.3
Total 550.0 563.6
Equity ratio, % 38.6% 38.6%
MEUR 2018 2017
Equity in the consolidated statement of financial position 212.4 217.4
Non-current borrowings 144.8 140.9
Current borrowings 7.4 25.0
Cash and cash equivalents -54.3 -48.1
Net interest-bearing liabilities 97.8 117.9
Gearing, % 46.1% 54.2%
enable investments, taking the cost of capital
into account. The capital includes equity and
liabilities less advances received.
The amount of annual dividend is linked to
earnings. Profits not considered necessary
for ensuring the healthy development of the
company are distributed to shareholders. The
share capital shall be increased if extraordi-
narily rapid growth or large investments call for
more capital.
The development of the capital structure is
monitored quarterly using the equity ratio and
gearing. The calculation of these key figures is
shown in the tables below.
68
LASSILA & TIKANOJA / FINANCIAL REVIEW 2018
CORPORATE GOVERNANCE / REPORT BY THE BOARD OF DIRECTORS / KEY FIGURES / FINANCIAL STATEMENTS

Share-based incentive programmes 2015, 2016, 2017 and 2018
Instrument
Share-based incentive programme 2015 2016 2017 2018
Grant date 17.12.2014 11.1.2016 13.12.2016 13.12.2017
Start of earnings period 1.1.2015 1.1.2016 1.1.2017 1.1.2018
End of earnings period 31.12.2015 31.12.2016 31.12.2017 31.12.2018
Average share price at grant date 14.69 17.79 18.92 17.72
Realisation on closing date, shares* 12,324 16,110 2,584 11,233
Obligation to hold shares, years 2 2 2 2
Release date of shares 31.3.2018 31.3.2019 31.3.2020 31.3.2021
Number of persons included 10 10 10 8
Expenses arising from share-based incentive programme, MEUR 2018 2017
Share component 0.1 0.2
Cash component 0.1 0.0
Total 0.2 0.2
* The realisation of 2018 is an estimation.
22. Share-based payment
The Group has several incentive arrangements
for which payments are made either as equity
instruments or cash. The benefits granted
under the arrangements are measured at fair
value on the granting date and recognised as
expense evenly over the vesting period. The
effect of the arrangement on profit and loss is
recognised under employee benefit expens-
es.
Share-based incentive programme 2015
Lassila & Tikanoja plc’s Board of Directors
decided at a meeting held on 17 December 2014
on a new share-based incentive programme.
Potential rewards was based on the EVA result
of Lassila & Tikanoja group.
Based on the programme a maximum of
37,560 shares of the company could be grant-
ed. The shares paid out as rewards were trans-
ferred from the shares held by the company.
Under the programme, a total of 12,324
Lassila&Tikanoja Plc’s shares were granted in
2016. The programme covered 10 persons.
Share-based incentive programme 2016
Lassila & Tikanoja plc’s Board of Directors
decided at a meeting held on 11 January 2016
on a new share-based incentive programme.
Potential rewards was based on the EVA result
of Lassila & Tikanoja group.
Based on the programme a maximum of
34,200 shares of the company could be grant-
ed. The shares paid out as rewards were trans-
ferred from the shares held by the company.
Under the programme, a total of 16,110
Lassila & Tikanoja Plc’s shares were granted in
2017. The programme covered 10 persons.
Share-based incentive programme 2017
Lassila & Tikanoja plc’s Board of Directors de-
cided at a meeting held on 13 December 2016
on a new share-based incentive programme.
Potential rewards will be based on the EVA
result of Lassila & Tikanoja group.
Based on the programme a maximum of
31,900 shares of the company can be granted.
The shares to be paid out as potential rewards
will be transferred from the shares held by the
company.
Under the programme, a total of 2,584
Lassila&Tikanoja Plc’s shares were granted in
2018. The programme covered 10 persons.
Share-based incentive programme 2018
Lassila & Tikanoja plc’s Board of Directors
decided at a meeting held on 13 December 2017
on a new share-based incentive programme.
Potential rewards will be based on the EVA
result of Lassila & Tikanoja group.
Based on the programme a maximum of
28,600 shares of the company can be granted.
The shares to be paid out as potential rewards
will be transferred from the shares held by the
company.
Under the programme, an estimated total
of 11,233 Lassila&Tikanoja Plc’s shares will be
granted in 2019. The programme covered 8
persons.
69
LASSILA & TIKANOJA / FINANCIAL REVIEW 2018
CORPORATE GOVERNANCE / REPORT BY THE BOARD OF DIRECTORS / KEY FIGURES / FINANCIAL STATEMENTS

23. Retirement benefit obligationsL&T operates some minor defined benefit plans concerning a few persons in Finland. Most of them
originate from company acquisitions. These plans are administered either by insurance companies
or by the company.
MEUR 2018 2017
Amounts recognised in the statement of financial position:
Present value of funded obligations 0.6 0.6
Fair value of plan assets -0.5 -0.5
0.1 0.1
Present value of unfunded obligations 1.3 1.3
Closing net liability 1.4 1.4
Changes in present value of obligation
Opening defined benefit obligation 1.9 1.3
Current service cost 0.0 0.0
Interest cost 0.0 0.0
Actuarial gain (-) and loss (+) on obligation 0.1 0.1
Increases from acquisitions - 0.5
Benefits paid -0.1 -0.1
Closing value of obligation 1.9 1.9
Changes in fair value of plan assets
Opening fair value of plan assets 0.5 0.4
Interest income 0.0 0.0
Employers' contributions 0.0 0.0
Actuarial gain (+) and loss (-) 0.0 0.2
Benefits paid 0.0 0.0
Closing fair value of plan assets 0.5 0.5
MEUR 2018 2017
Amounts recognised in the income statement:
Current service cost 0.0 0.0
Interest cost 0.0 0.0
Interest income 0.0 0.0
Actuarial gain (-) and loss (+) 0.0 0.1
Total 0.1 0.1
The Group estimates that it will contribute EUR 72 thousand to defined benefit plans in 2019.
MEUR 2018 2017
Movements in the liability recognised in the statement of financial position
Opening liability 1.4 1.0
Expense recognised in the income statement 0.0 0.0
Employers' contributions 0.0 0.0
Actuarial gain (-) and loss (+) 0.0 -0.1
Increases from acquisitions - 0.5
Contributions paid -0.1 -0.1
Closing liability 1.4 1.4
MEUR 2018 2017
Present value of obligation 1.9 1.9
Fair value of plan assets -0.5 -0.5
Deficit 1.4 1.4
Principal actuarial assumptions used
Discount rate 1.2% 1.5%
Expected rate of return on plan assets 1.9% 1.8%
Expected rate of salary increase 4.1% 4.0%
Expected rate of inflation 1.6% 1.5%
Defined contribution maturity of the obligation
MEUR 2018 2017
Maturity of less than one year 0.1 0.1
1–5 years 0.3 0.3
5–10 years 0.3 0.3
10–15 years 0.3 0.3
15–20 years 0.2 0.2
20–25 years 0.1 0.2
25–30 years 0.1 0.1
over 30 years 0.1 0.1
Total 1.5 1.6
70
LASSILA & TIKANOJA / FINANCIAL REVIEW 2018
CORPORATE GOVERNANCE / REPORT BY THE BOARD OF DIRECTORS / KEY FIGURES / FINANCIAL STATEMENTS

24. Provisions
MEUREnvironmental
provisionsOther
provisions Total
Provisions at 1 Jan 2018 6.1 0.8 7.0
Additional provisions 0.0 0.6 0.6
Used during the year -1.2 -0.9 -2.0
Write-down of unused provisions -0.4 0.0 -0.4
Effect of discounting 0.1 0.0 0.1
Provisions at 31 Dec 2018 4.7 0.6 5.3
MEUREnvironmental
provisionsOther
provisions Total
Provisions at 1 Jan 2017 5.9 0.9 6.8
Additional provisions 1.7 1.0 2.7
Used during the year -1.7 -1.0 -2.7
Effect of discounting 0.2 0.0 0.2
Provisions at 31 Dec 2017 6.1 0.8 7.0
MEUR 2018 2017
Non-current provisions 4.6 5.0
Current provisions 0.7 1.9
Total 5.3 7.0
The environmental provisions cover
the following obligations:
L&T owns the Munaistenmetsä landfill in Uusikau-
punki and the land area associated with it. The land-
fill site serves as a final dis posal area for municipal
waste, contaminated soil and industrial by-products.
The Group has leased site that it uses as landfill
from the city of Kotka. In Varkaus the Group uses a
site for intermediate storing, processing and final
disposal of contaminated soil. At the expiry of the
leases or at the discontinuation of operations, the
Group is responsible for site restoration compris-
ing landscaping and post-closure environmental
monitoring called for in the terms and conditions of
environmental permits.
The site restoration provision for the Kerava
landfill is divided into three parts. For one part, future
expenditure has been measured at the price level of
the time of calculation adjusted by a change in cost
index of civil engineering and by an annual inflation
rate of 2% because the cost level will be higher at
the moment when the provision will be used than
during the construction of the landfill. The expend-
iture adjusted by inflation has been discounted to
the date of construction of the landfill. The interest
rate used is the yield expectation of a risk-free five-
year government bond at the time of construction
plus L&T’s loan margin at the time in question. This
part arising from the construction of the landfill is
recognised at present value in the balance sheet as
a part of the cost of the site and it is depreciated us-
ing the straightline method. A corresponding amount
has been recognised as a provision in liabilities. This
amount is increased annually by a discount interest
recognised in finance costs. The second part of the
provision is calculated on the basis of the tonnage
taken to the landfill. The third portion of the provision
is a part for post-closure environmental monitoring.
The site restoration provision for the Kotka landfill
consists of two parts. For one part, the construction
expenditure is recognized at present value in the
balance sheet as a part of the cost of the site as the
provision for the Kerava landfill. The accrual method,
however, is applied to the depreciations on the Kotka
landfill, and it will be depreciated on the basis of the
volume of the waste taken to the site. The other part
consists of a provision for post-closure environ-
mental monitoring, which is based on depreciation
where the straight-line method is used. Future
expenditure is measured at the price level of the
time of calculation adjusted by an annual inflation
rate of 2%.
The principle applied for the Kerava site has been
applied to the restoration provision of the process-
ing and final disposal site of contaminated soil in
Varkaus.
The same principle has been applied to the
treatment of the site restoration provision for the
Munaistenmetsä final disposal site as for the Kotka
site. In connection with the business transaction con-
cluded with the City of Uusikaupunki, the post-clo-
sure environmental monitoring obligation of the old,
closed-down landfill was also transferred to L&T.
This old provision has been written down during the
reporting period as the measurements are done from
same points for the whole area. The obligation only
covers sampling and analysis, not the remediation of
any contaminated soil. Future expenditure has been
measured at the price level of the time of calculation
adjusted by an annual inflation rate of 2 %.
The Group also has provisions on its balance
sheet for the potential costs of cleaning land areas
that have been disposed of.
Other provisions consists mainly of provision for
restructuring.
71
LASSILA & TIKANOJA / FINANCIAL REVIEW 2018
CORPORATE GOVERNANCE / REPORT BY THE BOARD OF DIRECTORS / KEY FIGURES / FINANCIAL STATEMENTS

Non-cash flow adjustments
MEUR 1.1.2018 Cash flowTransfer from non-
current to currentOther non-cash
flow adjustments 31 Dec 2018
Non-current
Bank borrowings 95.7 -20.0 -0.9 0.1 74.9
Bonds 29.9 22.0 -2.9 0.7 49.6
Finance lease liabilities 15.3 -4.0 9.0 20.3
Loans from pension institutions 0.0 0.0
Total 140.9 2.0 -7.8 9.7 144.8
Current
Repayments of long-term borrowings 2.6 -2.6 0.9 0.9
Bonds - 2.9 2.9
Finance lease liabilities 2.4 -2.9 4.0 3.5
Current bank borrowings 20.0 -20.0 0.0
Total 25.0 -25.5 7.8 0.0 7.4
Non-cash flow adjustments
MEUR 1.1.2017 Cash flowTransfer from non-
current to currentOther non-cash
flow adjustments 31 Dec 2017
Non-current
Bank borrowings 27.7 69.9 -1.8 -0.1 95.7
Bonds 29.8 0.1 29.9
Finance lease liabilities 5.2 -3.2 13.4 15.3
Loans from pension institutions 0.8 -0.8 0.0
Total 63.5 69.9 -5.8 13.4 140.9
Current
Repayments of long-term borrowings 2.6 -2.6 2.6 2.6
Finance lease liabilities 0.8 -1.6 3.2 2.4
Current bank borrowings 0.0 19.9 0.1 20.0
Total 3.4 15.7 5.8 0.1 25.0
Fair values of financial liabilities are presented in Note 28 Financial assets and liabilities by category.
Maturity of long-term bank borrowings and financial lease liabilities is presented in Note 35 Financial risk management.
25. Borrowings
72
LASSILA & TIKANOJA / FINANCIAL REVIEW 2018
CORPORATE GOVERNANCE / REPORT BY THE BOARD OF DIRECTORS / KEY FIGURES / FINANCIAL STATEMENTS

26. Other non-current liabilities
MEUR 2018 2017
Advances received 0.3 0.3
Other liabilities 0.2 0.2
Total 0.5 0.4
27. Trade and other current payables
MEUR 2018 2017
Advances received 13.2 13.5
Trade payables 62.8 56.4
Derivative liabilities 0.5 0.2
Current tax liabilities 0.3 0.1
Other liabilities 23.0 23.7
Accrued expenses and deferred income 62.7 62.1
Total 162.4 156.0
Accrued expenses and deferred income
Liabilities related to personnel expenses 48.6 47.8
Other accrued expenses 14.1 14.3
Total 62.7 62.1
The fair values of trade payables and other current payables equal their book values.
73
LASSILA & TIKANOJA / FINANCIAL REVIEW 2018
CORPORATE GOVERNANCE / REPORT BY THE BOARD OF DIRECTORS / KEY FIGURES / FINANCIAL STATEMENTS
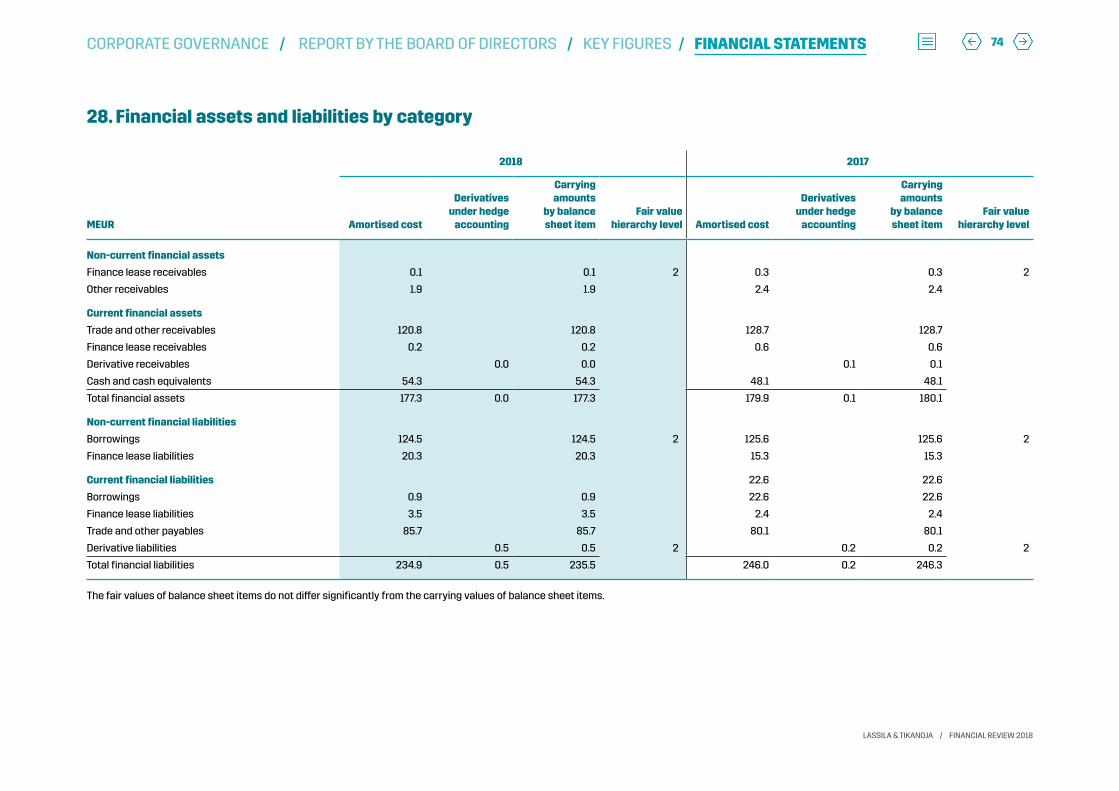
2018 2017
MEUR Amortised cost
Derivatives under hedge
accounting
Carrying amounts
by balance sheet item
Fair value hierarchy level Amortised cost
Derivatives under hedge
accounting
Carrying amounts
by balance sheet item
Fair value hierarchy level
Non-current financial assets
Finance lease receivables 0.1 0.1 2 0.3 0.3 2
Other receivables 1.9 1.9 2.4 2.4
Current financial assets
Trade and other receivables 120.8 120.8 128.7 128.7
Finance lease receivables 0.2 0.2 0.6 0.6
Derivative receivables 0.0 0.0 0.1 0.1
Cash and cash equivalents 54.3 54.3 48.1 48.1
Total financial assets 177.3 0.0 177.3 179.9 0.1 180.1
Non-current financial liabilities
Borrowings 124.5 124.5 2 125.6 125.6 2
Finance lease liabilities 20.3 20.3 15.3 15.3
Current financial liabilities 22.6 22.6
Borrowings 0.9 0.9 22.6 22.6
Finance lease liabilities 3.5 3.5 2.4 2.4
Trade and other payables 85.7 85.7 80.1 80.1
Derivative liabilities 0.5 0.5 2 0.2 0.2 2
Total financial liabilities 234.9 0.5 235.5 246.0 0.2 246.3
The fair values of balance sheet items do not differ significantly from the carrying values of balance sheet items.
28. Financial assets and liabilities by category
74
LASSILA & TIKANOJA / FINANCIAL REVIEW 2018
CORPORATE GOVERNANCE / REPORT BY THE BOARD OF DIRECTORS / KEY FIGURES / FINANCIAL STATEMENTS

In the tables on the previous page, Non-current other liabilities do not include advances received,
Trade and other receivables do not include tax receivables and accruals, and Trade and other pay-
ables do not include statutory liabilities (e.g. tax liabilities), as such classifications are required of
financial instruments only.
Principles for determining fair values of financial assets and liabilitiesDerivatives
Fair values of interest rate swaps are valued using a technique based on present value of future
cash flows, which is supported by market interest rates at the balance sheet date. Fair values
describe the prices that the Group would gain or should pay, if the derivative financial instruments
were cancelled at the balance sheet date.
Bank and other borrowings
Fair values of borrowings are based on discounted cash flows measured at effective interest meth-
od. The discount rate is defined to be the interest rate the Group would pay for an equivalent loan
at the balance sheet date. The overall interest is composed of a risk-free market interest rate and a
company-based risk premium.
Finance lease liabilities
Fair value of finance lease liabilities is calculated by discounting future cash flows. The discount
rate is defined to be the interest rate with which the Group could enter into an equivalent lease
contract at the balance sheet date.
Trade and other receivables
Trade and other receivables, which are non-derivative financial assets, are recognised in the bal-
ance sheet at historical cost less credit adjustments and impairment losses. This corresponds with
their fair value as the periods for payment are short and thus the discounting effect is not essential.
Trade and other payables
Trade and other current non-interest-bearing payables are recognised in the balance sheet at
historical cost which corresponds with their fair value, as the discounted effect is not essential
considering the maturity of the payables.
Fair value hierarchy of financial assets and liabilities measured at fair value
Financial assets and liabilities recognised at fair value must be categorised by using a three-level
fair value hierarchy that reflects the significance of the input data used in fair value measurement.
At L&T, derivatives are recognised at fair value. Derivatives, which comprise interest rate swaps,
currency derivatives and commodity derivatives, are categorised in Level 2. The fair values of finan-
cial instruments are based on prices derived from prices quoted in an active market or generally
accepted valuation models that are, to a significant degree, based on verifiable market data.
75
LASSILA & TIKANOJA / FINANCIAL REVIEW 2018
CORPORATE GOVERNANCE / REPORT BY THE BOARD OF DIRECTORS / KEY FIGURES / FINANCIAL STATEMENTS

29. Derivative financial instrumentsInterest rate swaps
MEUR2018
Nominal value Fair value2017
Nominal value Fair value
Maturity of interest rate swaps under hedge accounting
Not later than one year 0.9 1.8
Later than one year and not later than five years - 0.9
Later than five years 30.0 30.0
Total 30.9 -0.6 32.7 -0.3
The interest rate swaps are used to hedge cash flow related to a floating rate loan, and hedge accounting under IFRS 9 (IAS 39 for comparatives) has been applied to it. The hedges have been effective, and the changes in the fair values are shown in the consolidated statement of comprehensive income for the period.
The fixed interest rates of the interest rate swaps at 31 December 2018 were 0.8% (0.8). The floating interest rate was 6-month Euribor.
30. Operating leasesMEUR 2018 2017
Maturity of minimum lease payments of non-cancellable operating leases
Not later than one year 13.6 10.5
Later than one year and not later than five years 16.2 15.1
Later than five years 9.2 10.5
Total minimum lease payments 39.0 36.1
The Group has leased a part of the production and office premises, office equipment and vehicles. Most of the leases are index-linked and in conformity with local market practice.
31. Notes to the consolidated statement of cash flowsMEUR 2018 2017
Adjustments to cash flows from operating activities
Taxes 8.7 8.9
Depreciation, amortisation and impairment 42.5 41.1
Finance income and costs 4.5 1.4
Provisions -1.7 0.1
Other 1.6 0.2
Total 55.6 51.8
Commodity derivatives
MEUR2018
Nominal value Fair value2017
Nominal value Fair value
Maturity of diesel swaps under hedge accounting
Not later than one year 1.6 1.2
Later than one year and not later than five years - 0.0
Total 1.6 0.0 1.2 0.1
Commodity derivative contracts were concluded, for hedging of future diesel oil purchases. IFRS 9 - complient (IAS 39 for comparatives)-compliant hedge accounting will be applied to these contracts, and the effective change in fair value will be recognised in the hedging reserve within equity. The fair values of commodity derivatives are based on market prices at the balance sheet date. Prices have fluctuated between EUR 463.5 - 617.5.
76
LASSILA & TIKANOJA / FINANCIAL REVIEW 2018
CORPORATE GOVERNANCE / REPORT BY THE BOARD OF DIRECTORS / KEY FIGURES / FINANCIAL STATEMENTS

32. Related-party transactionsThe related parties of the Lassila & Tikanoja
Group are the senior management, Suomen
Keräystuote Oy (an associated company), Mop-
picom Oy (an associated company) and the L&T
sickness fund.
Lists of the Group’s parent and subsidiary
relationships, associated companies and
In 2018, the remuneration paid to the Pres-
ident and CEO totalled EUR 492 thousand
(521), consisting of salaries and benefits of
EUR 431 thousand (424) and a bonus of EUR
61 thousand (97). In addition, the President
and CEO was paid rewards amounting to EUR
37 thousand on the basis of the achievement
of the targets of the share-based incentive
programme in 2017 (224). The shares paid
to the President and CEO on the basis of the
achievement of the targets of the share-based
incentive programme in 2016 and 2017 will be
returned to the company by virtue of the terms
of the share-based incentive programme. The
shares are booked as receivables.
The remuneration paid to the other members
of the Group Executive Board totalled EUR 1,120
thousand (1,468), which includes salaries and
benefits of EUR 1,024 thousand (1,300) and
bonuses of EUR 96 thousand (167). In addition,
the other members of the Group Executive
Employee benefits of top management
MEUR 2018 2017
Salaries and other short-term employee benefits 2.0 2.2
Post-employment benefits - 0.3
Share-based payment 0.3 0.2
Total 2.3 2.7
Top management consists of the members of the Board of Directors, President and CEO and the Group Executive Board. An expense of EUR 0.2 million (0.2) was recognised in the income statement as the top managements’ share of the share-based payment.
Salaries and remunerations paid to members of the Board of Directors
TEUR 2018 2017
Heikki Bergholm, Chairman of the Board 76 62
Sakari Lassila, Vice Chairman of the Board 53 43
Eero Hautaniemi - 2
Teemu Kangas-Kärki 40 35
Laura Lares 39 34
Miikka Maijala 39 34
Laura Tarkka 39 33
On 21 March 2018, 5,326 shares were transferred to the members of the Board of Directors as part of the remuneration of the Board (31 March 2017: 3,896).
Board were paid rewards amounting to EUR 53
thousand on the basis of the achievement of
the targets of the share-based incentive pro-
gramme in 2017 (351). The figures include sala-
ries for the period during which the persons in
question were on the Group Executive Board.
The members of the Board of Directors
have no pension contracts with the company.
In 2018, EUR 5 thousand (6) arising from the
pension agreement of the President and CEO,
Jari Sarjo (President and CEO until 13 June 2011)
was recognised in the income statement.
In 2018, the company sold services included
in normal business operations at market price
to parties related to the key personnel for a
total amount of EUR 70 thousand (35).
The members of the Board are not included
in the share-based incentive programmes.
No loans were granted and no guarantees
nor other securities given to persons belonging
to the related parties.
joint ventures are presented in Note 15. Group
companies.
The contributions paid by the parent compa-
ny to the L&T sickness fund during the financial
year amounted to EUR 0.7 million (0.7). The
parent company has granted a EUR 0.1 million
loan to Moppicom Oy. In the comparison period
the parent company has granted a EUR 0.3
million convertible bond loan to Moppicom Oy.
The loans has been fully written down during
the reporting period.
77
LASSILA & TIKANOJA / FINANCIAL REVIEW 2018
CORPORATE GOVERNANCE / REPORT BY THE BOARD OF DIRECTORS / KEY FIGURES / FINANCIAL STATEMENTS

33. Auditing costsMEUR 2018 2017
Auditing 0.2 0.2
Other assignments in accordance with the auditing act - 0.0
Tax consulting services - 0.0
Other services 0.0 0.4
Total 0.2 0.7
Non-audit services performed by the statutory auditor KPMG Oy Ab in the financial year 2018 totalled EUR 0.0 million (0.4).
34. Contingent liabilitiesMEUR 2018 2017
Collaterals for own commitments
Mortgages on rights of tenancy 0.1 0.1
Other securities 0.1 0.1
Bank guarantees required for environmental permits 10.2 10.6
Other securities are guarantee deposits
35. Financial risk managementThe principles for L&T’s financial risk manage-
ment are defined in the treasury policy ap-
proved by the Board of Directors. The purpose
of financial risk management is to mitigate
significant financial risks and strive to reduce
the unfavourable effects of fluctuations in the
financial market and other risk factors on the
Group’s result.
The Group’s financing and liquidity man-
agement are handled centrally by the Group’s
financial management, which is managed by
the CFO. Transactions related to financial risk
management are carried out by the Group’s
financial management.
Foreign exchange risk
L&T consists of a parent company operating in
Finland and subsidiaries operating in Finland,
Sweden and Russia. The parent company’s
and the Finnish subsidiaries’ functional and
reporting currency is the euro. The foreign
subsidiaries’ functional and reporting currency
is the currency of their country of location. For
this reason, changes in foreign exchange rates
affect the Group’s result and equity, but not
very significantly.
Transaction risk
The business operations of L&T’s foreign
subsidiaries are carried out almost completely
in their functional currency and and thus does
not cause any transaction risk. Financing for
subsidiaries is provided through intra-Group
loans that are denominated in the functional
currency of each subsidiary. Group companies
operating in Finland use the euro as the invoic-
ing currency for sales almost exclusively, while
minor amounts of purchases are also invoiced
in Swedish kronas.
Translation risk
L&T’s exposure to translation risk consists of
net investments in foreign subsidiaries, which
include equity and comparable loans. The posi-
tion of net investments in foreign subsidiaries
is not hedged, as these holdings are considered
long-term strategic investments.
The Group’s most significant transaction risk
arises from the SEK-denominated loan capital
of subsidiary loans and accrued interest. The
net position on the balance sheet date was as
follows:
MEUR 2018 2017
SEK loans and accrued interests 5.3 9.5
RUB loans and accrued interests 0.1 -
Net 5.4 9.5
Changes in exchange rates in 2018 resulted in translation differences of EUR -3.4 million in equity (-2.7). Net investments by currency are presented in the table below.
Translation exposure of net investments
MEUR 2018 2017
SEK 28.3 26.7
RUB 1.0 1.3
Total 29.3 28.0
78
LASSILA & TIKANOJA / FINANCIAL REVIEW 2018
CORPORATE GOVERNANCE / REPORT BY THE BOARD OF DIRECTORS / KEY FIGURES / FINANCIAL STATEMENTS

Price risk of investments
L&T has not invested in listed securities, the
value of which changes as the market prices
change, and L&T is thus not exposed to secu-
rities price risk. L&T has only a minor holding
in unlisted shares, and there is no substantial
price risk related to these shares.
Commodity price risk
The fluctuations of the world market price
of crude oil are reflected in the price of fuel
used in production equipment as well as in the
purchase prices of environmental products
through oil-based raw materials. In waste man-
agement, some customer contracts specify
such invoicing periods and contract terms that
the sales prices cannot be raised monthly. This
means that the rise in fuel prices is passed on
to service prices with a delay. The diesel price
risk has been partly hedged with commodity
derivatives. Hedge accounting under IFRS 9
(IAS 39 for comparatives) has been applied to
these derivatives.
L&T manages the raw material price risk for
environmental products through fixing sales
prices for a period not exceeding the period for
which the suppliers’ purchase prices are valid.
Interest rate risk
L&T’s interest rate risk is primarily related to
borrowings, which are tied to variable interest
rates and create cash flows that vary with
the interest rate level. As the demand for L&T’s
services or their prices are not significantly
dependent on fluctuations in economic trends,
L&T tries to keep interest costs steady. On
account of this, over 50% of the cash flow
associated with variable-rate borrowings is
hedged against interest rate risk with interest
rate swaps.
At 31 December 2018, 65,0% (56,2) of the
company’s borrowings were either fixed inter-
est rate borrowings or hedged with interest
rate swaps. Variable-rate borrowings account-
ed for 35,0% (43,8). Therefore changes in the
interest rate level will not impact interest costs
in full.
All interest rate swaps made to hedge the
cash flow are hedges in accordance with the
Group’s risk management policy and hedge
accounting in accordance with IFRS 9 (IAS 39
for comparatives) is applied to all contracts.
Most of L&T’s net sales are generated by
long-term service agreements. Due to good
cash flow predictability, L&T’s treasury policy
specifies that the company shall seek to mini-
mise the amount of interest-bearing assets in
proportion to the current short-term financing
requirements, and to invest in relatively short-
term instruments.
Credit and counterparty risk
Financial instruments involve the risk of the
counterparty being unable to fulfil its con-
tractual commitments. Counterparty risk is
managed by making financial and derivative
contracts with major Nordic banks only and
by making investments related to liquidity
management only in certificates of deposit
and commercial papers of issuers with a
good credit standing in accordance with the
counterparty list approved by the Board. No
impairment is expected on any outstanding
investments at the balance sheet date.
L&T has a wide customer base consisting of
companies, industrial plants, office and busi-
ness properties, institutional property owners,
housing corporations, public sector organisa-
tions and households. Its accounts receivable
consist mostly of a high number of relatively
small receivables and there are no significant
concentrations of credit risk. L&T has credit
control guidelines to ensure that services and
products are sold only to customers with an
appropriate credit standing or, if a customer’s
creditworthiness is inadequate, prepayment
is required. Most customer relationships are
based on long-term service contracts, and
customers are not generally required to provide
collateral.
According to the requirements of the new
expected credit loss model, loss allowance
must be recognized based on expected credit
losses. For Lassila & Tikanoja the new model is
applied to trade receivables and contract as-
sets including recognition of past credit losses.
A simplified model is used for trade receiva-
bles and contract assets and the amount of
expected credit losses is based on the lifetime
expected credit losses of receivables. The
model is based on historical observed default
amounts over the expected life of the trade
receivables and is adjusted for forward-looking
estimates depending on the overdue of the
receivables. From receivables not yet due up to
receivables which are overdue maximum 365
days, an expected credit loss of 0,4% - 53,2% is
recognized is recognized depending on the age
breakdown of the receivables.
With regard to Finnish trade receivables,
collection operations are managed centrally by
the financial management function. The foreign
subsidiaries manage the collection of their
trade receivables locally. 80 % (88) of net sales
originated from Finland in 2018.
79
LASSILA & TIKANOJA / FINANCIAL REVIEW 2018
CORPORATE GOVERNANCE / REPORT BY THE BOARD OF DIRECTORS / KEY FIGURES / FINANCIAL STATEMENTS

Analysis of trade receivables by age
MEUR 2018 2017
Trade receivables andcontract assets 104.2 108.5
Past due 1-90 days 15.3 13.1
Past due 91-180 days 0.5 0.7
Past due 181-365 days 0.0 1.2
Past due over 365 days 0.0 3.4
Total 120.0 127.0
Expected credit loss
Trade receivables and contract assets by age
Trade receivables MEUR
Credit loss expected rate %
Expected credit loss, MEUR
Not past due 104.2 0.2 0.3
Past due below 90 days 15.3 1.9 0.3
Past due over 90 days 0.5 53.2 0.2
120.0 0.8
Impaired trade receivables have been recognised as expenses in the income statement.
Impairment losses and reversals of impairment losses recognised in previous periods are shown in Note 6 Other operating income and expenses.
Financial assets are not collateralised. The criteria for recognising an impairment loss on a receivable include, based on the management’s judgement, the debtor’s substantial financial difficulties, corporate restructuring, a credit loss recommendation issued by a collection agency or extended default on payments. No impairment was recognised on other financial assets.
Credit risk related to financial assets
MEUR 2018 2017
Non-current finance lease receivables 0.1 0.3
Other non-current receivables 1.9 2.6
Trade receivables 88.1 96.0
Contract assets 31.9 30.9
Other current receivables 12.2 11.2
Prepayments 0.6 0.5
Derivative receivables 0.0 0.1
Cash and cash equivalents 54.3 48.1
Liquidity and refinancing risk
Liquidity risk management ensures that L&T
continuously will be able to answer for its
financial obligations associated with opera-
tions at the lowest possible cost. L&T seeks to
maintain good liquidity through efficient cash
management and by investing in money market
instruments that can be realised quickly. The
liquidity situation is monitored in real time and
predicted using cash flow forecasts. The net-
ting of the Finnish Group companies’ liquidity
is done using Group bank accounts, and the
Group’s financial management is responsible
for investing any excess liquidity. To ascertain
the availability of funding, L&T uses several
banks in its financial operations. Refinancing
risk is managed by a broad-based maturity
profile of loans and by maintaining the level of
the average duration of the loan portfolio at
two years.
L&T seeks to keep its cash assets fairly
small, while ensuring sufficient credit limits for
liquidity management purposes. To meet any
temporary need for cash arising from cash
flow fluctuations, L&T has committed credit
limits (totalling EUR 30 million) and a commer-
cial paper programme (EUR 100 million). At 31
December 2018, the Group’s liquid assets and
investments amounted to EUR 54.3 million
(48.1). The commercial paper programme was
in all unused (used 20.0).
The following table shows the Group’s finan-
cial liabilities classified according to contractual
maturity dates at the balance sheet date. The
figures shown are undiscounted contractual
cash flows. The long-term borrowings include
equity ratio and interest cover covenants and
other normal terms which restrict giving of
collaterals to other financiers and discontinu-
ance or disposal of present business. Breaching
of these terms would entitle the borrowers to
call in the loans immediately, which would lead
to earlier realisation of the cash flows related to
the borrowings.
80
LASSILA & TIKANOJA / FINANCIAL REVIEW 2018
CORPORATE GOVERNANCE / REPORT BY THE BOARD OF DIRECTORS / KEY FIGURES / FINANCIAL STATEMENTS

Maturity of financial liabilities
31 December 2018 MEUR Carrying amountContractual
cash flows 2019 2020 2021 2022 2023 2024 and later
Bank borrowings and loans from pension institutions 75.8 78.6 1.5 25.5 0.4 0.4 0.4 50.4
Bonds 52.6 56.2 3.7 0.6 0.6 0.6 50.6 -
Financial lease liabilities 23.8 25.2 3.8 4.0 4.0 4.0 4.0 5.5
Derivative liabilities 0.5 0.5 0.1 0.1 0.1 0.1 0.1 0.1
Trade and other payables 85.7 85.7 85.7
Total 238.4 246.2 94.8 30.2 5.1 5.1 55.1 56.0
31 December 2017 MEUR Carrying amountContractual
cash flows 2018 2019 2020 2021 2022 2023 and later
Bank borrowings and loans from pension institutions 98.3 101.5 3.3 21.5 25.5 0.4 0.4 50.4
Bonds 29.9 31.3 0.6 30.6
Commercial paper liabilities 20.0 20.1 20.1
Financial lease liabilities 17.7 18.7 2.6 2.6 2.6 2.6 2.6 5.7
Derivative liabilities 0.2 0.2 0.0 0.0 0.0 0.0 0.0 0.0
Trade and other payables 80.1 80.1 80.1
Total 246.3 251.9 106.7 54.8 28.1 3.1 3.1 56.1
81
LASSILA & TIKANOJA / FINANCIAL REVIEW 2018
CORPORATE GOVERNANCE / REPORT BY THE BOARD OF DIRECTORS / KEY FIGURES / FINANCIAL STATEMENTS

Maturity of financial lease liabilities
MEUR 2018 2017
Finance lease liabilities
– minimum lease payments by maturity
Not later than one year 3.8 2.6
Later than one year and not later than five years 15.9 10.5
Later than five years 5.5 5.7
Total minimum lease payments 25.2 18.7
Future finance charges -1.4 -1.0
Present value of finance lease liabilities 23.8 17.7
Maturity of present value of finance lease liabilities
Not later than one year 3.5 2.4
Later than one year and not later than five years 14.9 9.7
Later than five years 5.5 5.6
Total 23.8 17.7
The only asset meeting the characteristics of a finance lease, are heavy machinery equipment and it is handled as a finance lease liability in the financial statements.
Breakdown of borrowings
MEUR
31.12.2018 31.12.2017
In use Undrawn Total In use Undrawn Total
Bank borrowings and loans from pension institutions 75.8 75.8 98.3 98.3
Bonds 52.6 52.6 29.9 29.9
Committed credit facility maturing in 2020 - 30.0 30.0 - 30.0 30.0
Commercial paper programme - 100.0 100.0 20.0 80.0 100.0
Financial lease liabilities 23.8 23.8 17.7 17.7
Total 152.2 130.0 282.2 165.9 110.0 275.9
82
LASSILA & TIKANOJA / FINANCIAL REVIEW 2018
CORPORATE GOVERNANCE / REPORT BY THE BOARD OF DIRECTORS / KEY FIGURES / FINANCIAL STATEMENTS

Sensitivity analysis in accordance with IFRS 7 of market risk arising from financial instruments
MEUR
2018 2017
Profit after tax Equity Profit after tax Equity
+ 0.5% change in market interest rates -0.2 0.5 -0.3 0.6
- 0.2% change in market interest rates 0.0 -0.1 0.0 -0.2
+ 10% change in diesel oil CIF CARGO NWE price*) 0.1 0.2
- 10% change in diesel oil CIF CARGO NWE price*) -0.1 -0.2
*) price level in euros
+10% change in SEK exchange rate 0.6 1.1
-10% change in SEK exchange rate -0.5 -0.9
+10% change in RUB exchange rate 0.0 -
-10% change in RUB exchange rate 0.0 -
36. Disputes and litigationLassila & Tikanoja plc is party to a few minor disputes related to the Group’s ordinary business
operations. The outcome of these disputes will not have a material effect on the Group’s financial
position.
37. Events after the balance sheet dateThe company’s management is not aware of any events of material importance after the balance
sheet date that might have affected the preparation of the financial statements.
Sensitivity to market risks arising from
financial instruments
The following sensitivity analysis required by
IFRS 7 illustrates the sensitivity of the Group’s
profit for the period and equity to changes in
the interest rate level and diesel oil price level
with regard to financial instruments in the
statement of financial position at 31 December
2018 (31 December 2017), including financial
assets and liabilities as well as derivative con-
tracts. Changes in the fair value of derivative
contracts under hedge accounting are as-
sumed to be allocated entirely to equity, while
changes in the fair value of other derivative
contracts are assumed to be allocated entirely
to the income statement.
The following assumptions have been used
in calculating sensitivity to changes in the
interest rate level:
• The change in the interest rate level is
assumed to be a rise of +0.5 percentage
point and a decrease of -0.2 percentage
point.
• The change in the price level of Diesel is
assumed to be a rise of +10 percentage point
and a decrease of -10 percentage point.
• The exposure underlying the calculation
includes interest-bearing financial liabilities
Net investments in foreign subsidiaries are not
included in the sensitivity analysis.
83
LASSILA & TIKANOJA / FINANCIAL REVIEW 2018
CORPORATE GOVERNANCE / REPORT BY THE BOARD OF DIRECTORS / KEY FIGURES / FINANCIAL STATEMENTS

INCOME STATEMENT OF THE PARENT COMPANYMEUR 2018 2017 Note
Net sales 556.3 540.9 1
Other operating income 6.3 7.0 4
Change of inventory 0.3 -0.5
Materials and services -161.6 -152.4
Employee benefit expenses -238.0 -236.6 2
Other operating expenses -87.7 -83.1 3,4
Depreciation and impairment -35.9 -36.1
Operating profit before goodwill amortisation 39.8 39.3
Goodwill amortisation -1.6 -1.5
Operating profit 38.2 37.7
Financial income and expenses -2.9 -0.1 5
Profit before appropriations and taxes 35.3 37.7
Appropriations
Increase/decrease in accumulated depreciation 2.4 3.2
Group contribution 1.2 2.1 6
Income tax -4.6 -8.8 7
Profit for the period 34.3 34.2
84
LASSILA & TIKANOJA / FINANCIAL REVIEW 2018
CORPORATE GOVERNANCE / REPORT BY THE BOARD OF DIRECTORS / KEY FIGURES / FINANCIAL STATEMENTS

MEUR 2018 2017 Note
ASSETS
Fixed assets
Intangible assets 8
Intangible rights 1.4 1.3
Goodwill 2.6 3.9
Other intangible assets 18.5 16.2
Advance payments and construction in progress 0.6 3.6
23.0 25.0
Tangible assets 9
Land 4.5 4.6
Buildings and constructions 31.6 35.3
Machinery and equipment 97.6 101.2
Other tangible assets 0.0 0.0
Advance payments and construction in progress 5.2 1.9
138.9 143.1
Financial assets 10
Shares in Group companies 30.2 30.2
Receivables from Group companies 12.5 -
Shares in joint ventures 0.0 0.5
Other shares and holdings 0.5 0.5
43.2 43.7
Total fixed assets 205.1 211.8
MEUR 2018 2017 Note
Current assets
Inventories
Raw materials and consumables 2.3 1.8
Finished products/goods 1.3 1.2
Other inventories 3.6 3.9
7.3 6.9
Non-current receivables
Loan receivables from Group companies 105.7 -
Loan receivables from Associated companies 0.0 -
Loan receivables 0.4 0.7
Prepayments 0.3 0.3
106.4 107.1
Current receivables 11
Receivables from Group companies 4.0 9.0
Trade receivables from Associated companies 0.0 0.1
Trade receivables 68.2 68.7
Other receivables 0.7 0.7
Prepaid expenses and accrued income 6.9 5.3
79.7 83.8
Cash and cash equivalents 44.6 40.1
Total current assets 238.1 237.9
Total assets 443.2 449.7
BALANCE SHEET OF THE PARENT COMPANY
85
LASSILA & TIKANOJA / FINANCIAL REVIEW 2018
CORPORATE GOVERNANCE / REPORT BY THE BOARD OF DIRECTORS / KEY FIGURES / FINANCIAL STATEMENTS

MEUR 2018 2017 Note
SHAREHOLDERS’ EQUITY AND LIABILITIES
Shareholders' equity 12
Share capital 19.4 19.4
Fair value reserve 0.0 0.0
Invested non-restricted equity reserve 0.7 0.7
Retained earnings 67.1 68.0
Profit for the period 34.3 34.2
Total shareholders' equity 121.5 122.3
Accumulated appropriations
Depreciation difference 24.2 26.7
Obligatory provisions 13
Non-current 5.0 5.3
Current 0.2 1.1
5.3 6.5
MEUR 2018 2017 Note
Liabilities 14
Non-current
Bank borrowings 75.0 95.9
Pension institution loans 0.0 0.0
Bonds 49.6 30.0
Finance lease liabilities 20.3 15.3
Accrued income 0.3 0.3
145.2 141.5
Current
Bank borrowings 0.9 22.6
Bonds 2.9 0.0
Finance lease liabilities 3.5 2.4
Advances received 10.0 9.9
Trade payables 47.8 41.3
Trade payables to Associated companies 0.0 0.1
Liabilities to Group companies 24.6 18.7
Other liabilities 16.9 17.6
Accruals and deferred expenses 40.3 40.2
Accruals and deferred expenses on commodity derivatives 0.1 0.0
147.1 152.7
Total liabilities 292.3 294.3
Total shareholders’ equity and liabilities 443.2 449.7
BALANCE SHEET OF THE PARENT COMPANY
86
LASSILA & TIKANOJA / FINANCIAL REVIEW 2018
CORPORATE GOVERNANCE / REPORT BY THE BOARD OF DIRECTORS / KEY FIGURES / FINANCIAL STATEMENTS

MEUR 2018 2017
Operations
Operating profit 38.2 37.7
Adjustments:
Depreciation and amortisation 37.5 37.6
Gains and losses on sales 0.0 -1.3
Provisions -1.7 0.2
Other adjustments 0.2 0.1
Cash flow before change in working capital 74.1 74.5
Change in working capital
Increase/decrease in current non-interest-bearing receivables 4.2 26.4
Increase/decrease in inventories -0.4 0.5
Increase/decrease in current non-interest-bearing liabilities 6.0 0.3
Cash flow from operations before financial income/expenses and tax 83.9 101.7
Interest expenses and other financial expenses -1.1 -0.3
Interest income from operations 0.1 0.1
Direct taxes paid -6.4 -9.0
Cash flow from operating activities 76.4 92.5
Investments
Investments in subsidiaries and associated companies and acquired businesses minus cash at the time of acquisition 0.2 -1.8
Investments in tangible and intangible assets -24.6 -22.6
Proceeds from sale of tangible and intangible assets 2.2 1.7
Proceeds from/repayments of current liabilities to Group companies 0.6 0.0
Dividends received from investments 6.2 -109.0
Cash flow from investing activities -15.3 -131.7
MEUR 2018 2017
Financing
Paid Group contributions -0.3 -0.3
Received Group contributions 2.4 5.3
Proceeds from short-term loans 10.0 40.0
Repayments of short-term borrowings -32.6 -20.0
Proceeds from long-term loans 49.6 69.9
Repayments of long-term loans -47.6 -2.6
Repayments of leasing liabilities -2.9 -1.6
Capital repayment and other distribution of profit paid -35.1 -35.1
Cash flow from financing activities -56.5 55.6
Changes in cash and cash equivalents 4.6 16.4
Cash and cash equivalents at 1 January 40.0 23.7
Cash and cash equivalents at 31 December 44.6 40.1
Cash and cash equivalents at 31 December
Cash and cash equivalents 44.6 40.1
Overdraft facilities - -
44.6 40.1
The items in the statement of changes in the financial position cannot be derived directly from the balance sheet owing, among other things, to mergers and dissolutions of subsidiaries.
CASH FLOW STATEMENT OF THE PARENT COMPANY
87
LASSILA & TIKANOJA / FINANCIAL REVIEW 2018
CORPORATE GOVERNANCE / REPORT BY THE BOARD OF DIRECTORS / KEY FIGURES / FINANCIAL STATEMENTS

NOTES TO THE FINANCIAL STATEMENTS OF THE PARENT COMPANY
SUMMARY OF SIGNIFICANT ACCOUNTING POLICIES
The financial statements of Lassila & Tikanoja
plc have been prepared in accordance with the
Finnish Accounting Standards (FAS). Items in
the financial statements are stated at cost.
Fixed assets
Tangible and intangible assets are stated in the
balance sheet at direct acquisition cost less
planned depreciation. Planned straight-line
depreciation is calculated from the historical
cost on the basis of probable economic life
except for new landfills. The depreciation and
amortisation periods are as follows:
Buildings and structures 5–30 years
Vehicles 6–15 years
Machinery and equipment 4–10 years
Goodwill 5–10 years
Intangible rights and
other capitalised expenditure 5–10 years
In 2008 the Group started to apply the units of
production method to new landfills. Landfills
are depreciated on the basis of the volume
of waste received. This method reflects more
closely than the straight-line method the
expected future benefits to be derived from
the landfills. As the Kerava landfill is about to
be filled up, it will be fully depreciated using the
straight-line method.
Depreciation on fixed assets acquired during
the financial year is calculated from the day on
which they become operational.
Lease payments are recognised as expenses
in the income statement. The assets are not
stated in the balance sheet.
Investments are measured at cost.
Finance lease agreement
Assets leased under a finance lease are
recognised in property, plant and equipment at
amounts equal to the fair value of the leased
property or, if lower, the present value of the
minimum lease payments. They are depreciated
over the term of the lease or over their expect-
ed useful lives, if shorter. However, when there
is reasonable assurance that the ownership of
the leased asset will transfer to L&T by the end
of the lease term, the asset will be depreciated
using the method applied for a corresponding
asset owned by the company. Liabilities arising
from the leases are recorded under loans. Each
lease payment is apportioned between finan-
cial cost and loan repayment. Financial costs
are allocated to each period of the leasing term
so as to produce a constant periodic rate of in-
terest on the remaining balance of the liability.
Inventories
Inventories are measured at the variable
cost of production or the probable lower
replacement or sales price. The inventories of
Environmental Products are measured using
the weighted average cost method. The value
of other inventories is determined using the
FIFO method. The cost of inventories produced
by the company comprises, in addition to direct
costs, a share of production overheads.
Items denominated in foreign currencies
Foreign currency transactions are recorded
using the exchange rates for the dates of
the transactions. Receivables and liabilities
denominated in foreign currencies are trans-
lated into euros at the reference rate of the
European Central Bank for the balance sheet
date. Exchange rate differences are recognised
in the income statement.
Derivatives
Swaps are used for hedging against the
interest rate risk associated with variable-rate
borrowings. Interest income and expenses
arising from the swaps are allocated over the
contract period and recognised as adjustments
to the interest on the hedged item.
Commodity swap agreements are used for
hedging against the commodity risk associat-
ed with cash flows from diesel purchases. As
far as the ineffective portion of the hedging
is concerned, changes in the fair values of
these agreements are recorded in the income
statement, and similarly when the agreements
mature or the hedged risk materialises.
Currency forward agreements are used to
hedge against foreign exchange risk. Changes
in fair values are recorded in the income state-
ment as financial income or expenses.
Net sales
Sales are stated net of indirect sales taxes,
discounts and exchange rate differences. Sales
freights and other costs incurred in sales and
deliveries are recognised as either costs of
goods sold or sales expenses. Bad debt is rec-
ognised under other operating expenses.
Research and development expenditure
Research and development expenditure is
recognised as an expense.
Other operating income and expenses
Other operating income and expenses consist
of items not included in regular service and
product sales, such as gains and losses on the
sale or disposal of fixed assets, recognition
and recovery of bad debt as well as the annual
discounts on purchases.
Income taxes
Current income tax is determined for the taxa-
ble profit for the period according to prevailing
tax rates. Taxes are adjusted by current tax
rates for previous periods, if any. Deferred tax
liabilities are stated in the notes to the financial
statements.
88
LASSILA & TIKANOJA / FINANCIAL REVIEW 2018
CORPORATE GOVERNANCE / REPORT BY THE BOARD OF DIRECTORS / KEY FIGURES / FINANCIAL STATEMENTS

1. Net salesMEUR 2018 % 2017 %
Net sales by division
Environmental Services 245.8 44.2 237.4 43.9
Industrial Services 90.4 16.2 81.6 15.1
Facility Services 182.6 32.8 192.0 35.5
Technical Services 37.5 6.7 29.9 5.5
Total 556.3 100.0 540.9 100.0
Net sales by market
Finland 545.2 98.0 531.2 98.2
Other countries 11.1 2.0 9.7 1.8
Total 556.3 100.0 540.9 100.0
2018 2017
Average personnel
Salaried employees 1,054 1,084
Non-salaried employees 4,644 4,675
Total 5,698 5,759
3. Auditor’s feesMEUR 2018 2017
KPMG
Auditing 0.1 0.1
Other assignments in accordance with the auditing act - 0.0
Tax consulting services - 0.0
Other services 0.0 0.4
Total 0.1 0.5
4. Other operating income and expensesMEUR 2018 2017
Other operating income
From Group companies
Compensation for administration costs 2.0 1.9
From others
Profit on sale of other fixed assets 0.9 1.3
Government grants 0.3 0.3
Recovery of bad debt 0.5 0.3
Annual discounts 1.5 1.7
Change in value of commodity derivatives 0.4 0.2
Other operating income 0.6 1.4
Total 6.3 7.0
Other operating expenses
To others
ICT costs 11.4 11.0
Travel costs 6.7 6.2
Vehicles and machinery 34.9 32.8
Rents and real estate costs 15.8 15.7
Expert fees 4.3 3.8
Voluntary social security costs 5.1 5.6
Other 9.5 7.9
Total 87.7 83.1
MEUR 2018 2017
Personnel expenses
Salaries and bonuses 195.5 192.0
Pension expenditure 34.9 35.1
Other salary-related expenses 7.6 9.6
Total 238.0 236.7
Personnel services invoiced from the Group 0.0 -0.2
238.0 236.6
Salaries, bonuses and pension benefits of the management are described in the Note 32 Related-party transactions of the consolidated financial statements. No loans were granted to the related parties of the Group companies.
2. Personnel and administrative bodies
89
LASSILA & TIKANOJA / FINANCIAL REVIEW 2018
CORPORATE GOVERNANCE / REPORT BY THE BOARD OF DIRECTORS / KEY FIGURES / FINANCIAL STATEMENTS

5. Financial income and expensesMEUR 2018 2017
Dividend income - 0.0
Other interest and financial income 0.5 1.9
Other interest and financial costs -3.4 -1.9
Total financial income and costs -2.9 -0.1
Financial income and costs include:
Dividend income
from Group companies - 0.0
Interest income
from Group companies 0.1 -
from others 0.4 0.2
Foreign exchange gains
from others 0.0 1.7
Interest costs
to others -1.8 -1.6
Other financial expenses
to others -1.5 -0.4
-2.9 -0.1
6. AppropriationsMEUR 2018 2017
Increase/decrease in accumulated depreciation
Intangible assets
Tangible assets -1.1 -0.8
Total extraordinary income and expenses 3.5 4.0
2.4 3.2
Group contribution
Group contribution received 1.6 2.4
Group contribution paid -0.4 -0.3
Total extraordinary income and expenses 1.2 2.1
Total appropriations 3.6 5.3
7. Income taxesMEUR 2018 2017
Income taxes on operations for the financial year 4.6 8.6
Total 4.6 8.6
Deferred tax assets / liabilities
From depreciation differences -4.8 -5.3
Tax deduction from guarantee commitment (L&T Recoil Oy) - 3.3
From other matching differences 1.8 1.9
Total -3.0 -0.1
90
LASSILA & TIKANOJA / FINANCIAL REVIEW 2018
CORPORATE GOVERNANCE / REPORT BY THE BOARD OF DIRECTORS / KEY FIGURES / FINANCIAL STATEMENTS
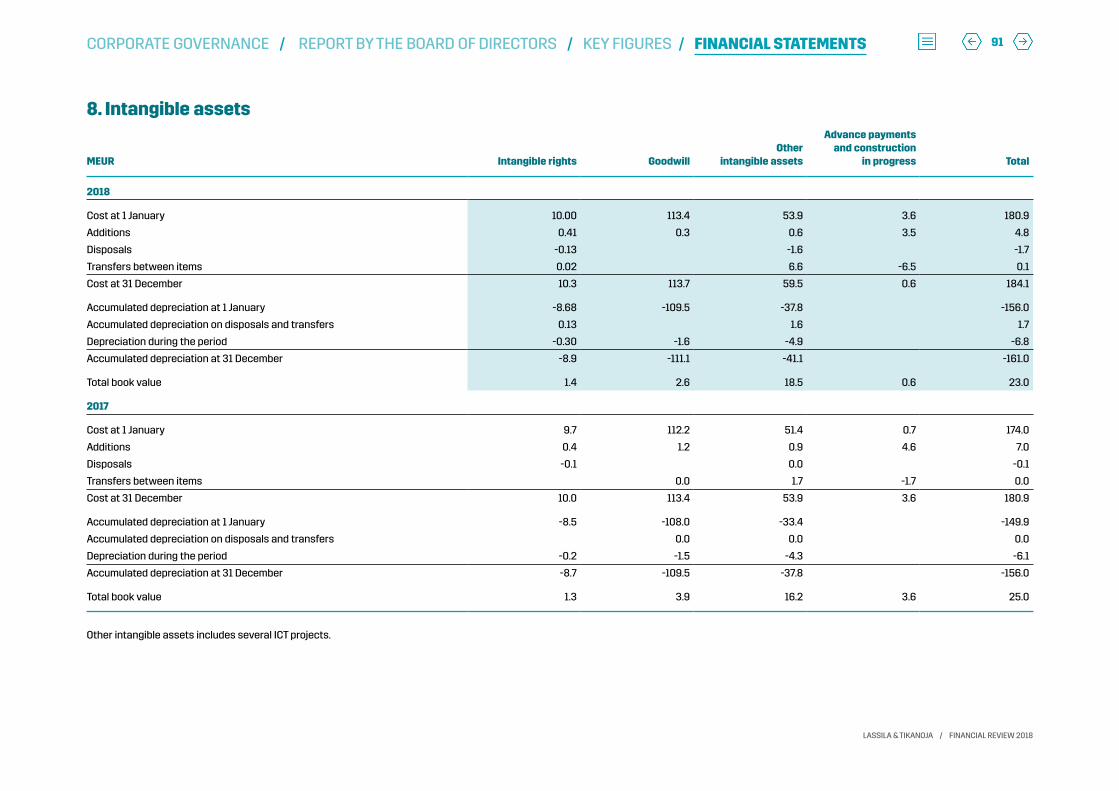
8. Intangible assets
MEUR Intangible rights GoodwillOther
intangible assets
Advance payments and construction
in progress Total
2018
Cost at 1 January 10.00 113.4 53.9 3.6 180.9
Additions 0.41 0.3 0.6 3.5 4.8
Disposals -0.13 -1.6 -1.7
Transfers between items 0.02 6.6 -6.5 0.1
Cost at 31 December 10.3 113.7 59.5 0.6 184.1
Accumulated depreciation at 1 January -8.68 -109.5 -37.8 -156.0
Accumulated depreciation on disposals and transfers 0.13 1.6 1.7
Depreciation during the period -0.30 -1.6 -4.9 -6.8
Accumulated depreciation at 31 December -8.9 -111.1 -41.1 -161.0
Total book value 1.4 2.6 18.5 0.6 23.0
2017
Cost at 1 January 9.7 112.2 51.4 0.7 174.0
Additions 0.4 1.2 0.9 4.6 7.0
Disposals -0.1 0.0 -0.1
Transfers between items 0.0 1.7 -1.7 0.0
Cost at 31 December 10.0 113.4 53.9 3.6 180.9
Accumulated depreciation at 1 January -8.5 -108.0 -33.4 -149.9
Accumulated depreciation on disposals and transfers 0.0 0.0 0.0
Depreciation during the period -0.2 -1.5 -4.3 -6.1
Accumulated depreciation at 31 December -8.7 -109.5 -37.8 -156.0
Total book value 1.3 3.9 16.2 3.6 25.0
Other intangible assets includes several ICT projects.
91
LASSILA & TIKANOJA / FINANCIAL REVIEW 2018
CORPORATE GOVERNANCE / REPORT BY THE BOARD OF DIRECTORS / KEY FIGURES / FINANCIAL STATEMENTS

9. Tangible assets
MEUR Land BuildingsMachinery
and equipment
Advance payments and construction
in progress Total
2018
Cost at 1 January 4.6 95.5 358.5 1.9 460.5
Additions 0.46 21.65 5.89 28.0
Disposals -0.10 -0.18 -24.14 -0.03 -24.4
Transfers between items 1.06 1.45 -2.57 -0.1
Cost at 31 December 4.5 96.8 357.5 5.2 464.0
Accumulated depreciation at 1 January -60.2 -257.3 -317.4
Accumulated depreciation on disposals and transfers 0.10 22.90 23.01
Depreciation during the period -5.21 -25.48 -30.69
Accumulated depreciation at 31 December -65.3 -259.8 -325.1
Total book value 4.5 31.6 97.7 5.2 138.9
2017
Cost at 1 January 4.6 91.6 345.3 5.3 446.8
Additions 0.9 27.7 2.6 31.2
Disposals -1.9 -15.3 -17.2
Transfers between items 4.8 0.8 -5.9
Cost at 31 December 4.6 95.5 358.5 1.9 460.5
Accumulated depreciation at 1 January -56.0 -245.9 -301.9
Accumulated depreciation on disposals and transfers 1.1 14.9 16.0
Depreciation during the period -5.2 -26.2 -31.5
Accumulated depreciation at 31 December -60.2 -257.3 -317.4
Total book value 4.6 35.3 101.3 1.9 143.1
The additions of machinery and equipment includes EUR 8.9 million in assets leased under a finance lease contract (13.4).
92
LASSILA & TIKANOJA / FINANCIAL REVIEW 2018
CORPORATE GOVERNANCE / REPORT BY THE BOARD OF DIRECTORS / KEY FIGURES / FINANCIAL STATEMENTS

10. Investments
MEURShares in
Group companiesOther shares and holdings
Capital loan receivable Total
2018
Cost at 1 January 30.2 1.0 12.5 43.7
Additions
Transfers between items -0.6 -0.6
Cost at 31 December 30.2 0.5 12.5 43.2
Total book value 30.2 0.5 12.5 43.2
2017
Cost at 1 January 30.2 0.4 30.6
Additions 0.1 0.6 12.5 13.1
Transfers between items 0.0 0.0
Cost at 31 December 30.2 1.0 12.5 43.7
Total book value 30.2 1.0 12.5 43.7
Holding of shares and votes, %
Holdings in Group companies
Kiinteistö Oy Vantaan Valimotie 33, Helsinki 100.0
L&T Biowatti Oy, Helsinki 100.0
L&T Relations Oy, Helsinki 100.0
L&T Toimi Oy, Helsinki 100.0
L&T Korjausrakentaminen Oy, Helsinki 100.0
L&T Työllistämispalvelu Oy, Helsinki 100.0
Associated companies
Suomen Keräystuote Oy, Helsinki 40.0
Moppicom Oy, Helsinki 43.7
93
LASSILA & TIKANOJA / FINANCIAL REVIEW 2018
CORPORATE GOVERNANCE / REPORT BY THE BOARD OF DIRECTORS / KEY FIGURES / FINANCIAL STATEMENTS

11. ReceivablesMEUR 2018 2017
From Group companies
Loan receivables 3.2 7.0
Trade receivables 0.8 2.0
Total 4.0 9.0
Prepaid expenses and accrued income
Employees' health care compensation 1.4 1.2
Statutory personnel insurance 2.0 1.7
Annual discounts 0.5 0.5
Licences 0.7 0.7
Other 2.2 1.2
Total 6.9 5.3
13. Obligatory provisionsMEUR 2018 2017
Environmental provision 4.4 5.8
Pension liabilities 0.5 0.6
Other provision 0.3 0.1
Total 5.3 6.5
Environmental provisions concern the site restoration costs of landfills.
12. Shareholders’ equityMEUR 2018 2017
Share capital at 1 January / 31 December 19.4 19.4
Fair value reserve 1 January 0.0 0.0
Valuation of commodity derivatives 0.0 0.0
Fair value reserve 31 December 0.0 0.0
Invested non-restricted equity reserve 1 January 0.7 0.5
Expense recognition of share-based benefits 0.0 0.1
Invested non-restricted equity reserve 31 December 0.7 0.7
Retained earnings at 1 January 102.2 103.1
Dividend -35.3 -35.3
Expense recognition of share-based benefits 0.1 0.2
Retained earnings at 31 December 67.1 68.0
Profit for the period 34.3 34.2
Shareholders' equity at 31 December 121.5 122.3
Distributable assets
Retained earnings 67.1 68.0
Profit for the period 34.3 34.2
Invested non-restricted equity reserve 0.7 0.7
Total distributable assets 102.1 102.9
94
LASSILA & TIKANOJA / FINANCIAL REVIEW 2018
CORPORATE GOVERNANCE / REPORT BY THE BOARD OF DIRECTORS / KEY FIGURES / FINANCIAL STATEMENTS
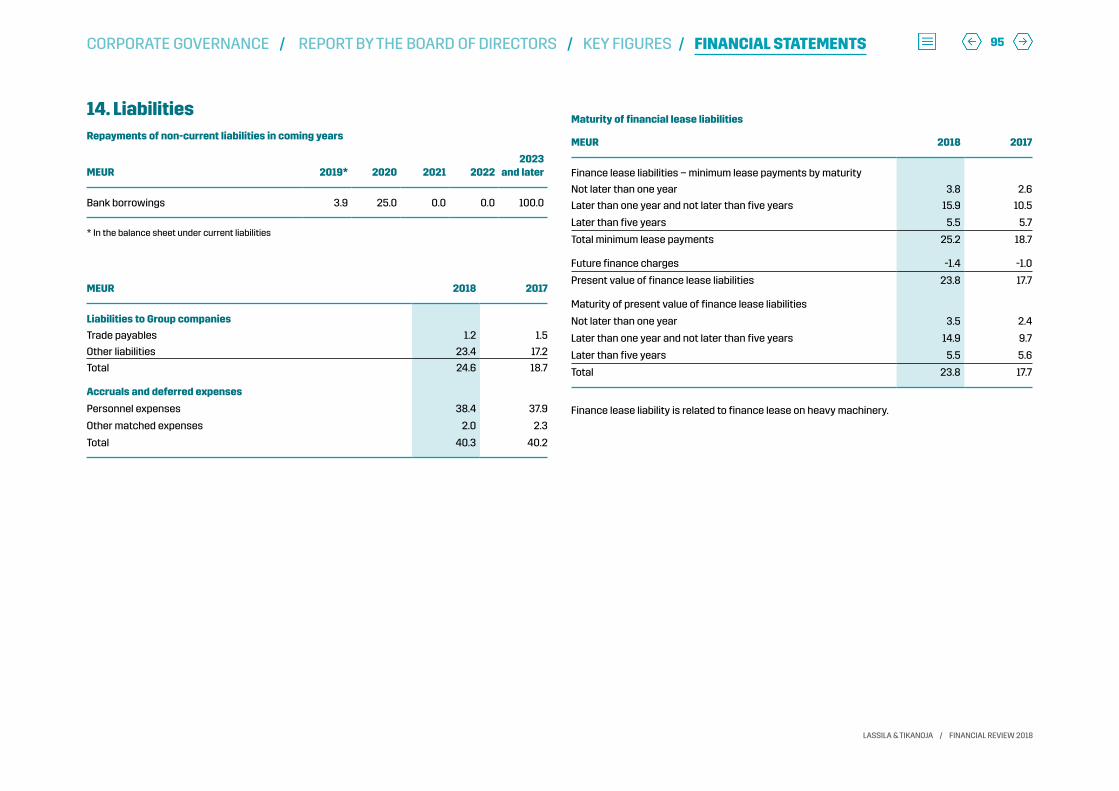
14. LiabilitiesRepayments of non-current liabilities in coming years
MEUR 2019* 2020 2021 20222023
and later
Bank borrowings 3.9 25.0 0.0 0.0 100.0
* In the balance sheet under current liabilities
MEUR 2018 2017
Liabilities to Group companies
Trade payables 1.2 1.5
Other liabilities 23.4 17.2
Total 24.6 18.7
Accruals and deferred expenses
Personnel expenses 38.4 37.9
Other matched expenses 2.0 2.3
Total 40.3 40.2
Maturity of financial lease liabilities
MEUR 2018 2017
Finance lease liabilities – minimum lease payments by maturity
Not later than one year 3.8 2.6
Later than one year and not later than five years 15.9 10.5
Later than five years 5.5 5.7
Total minimum lease payments 25.2 18.7
Future finance charges -1.4 -1.0
Present value of finance lease liabilities 23.8 17.7
Maturity of present value of finance lease liabilities
Not later than one year 3.5 2.4
Later than one year and not later than five years 14.9 9.7
Later than five years 5.5 5.6
Total 23.8 17.7
Finance lease liability is related to finance lease on heavy machinery.
95
LASSILA & TIKANOJA / FINANCIAL REVIEW 2018
CORPORATE GOVERNANCE / REPORT BY THE BOARD OF DIRECTORS / KEY FIGURES / FINANCIAL STATEMENTS
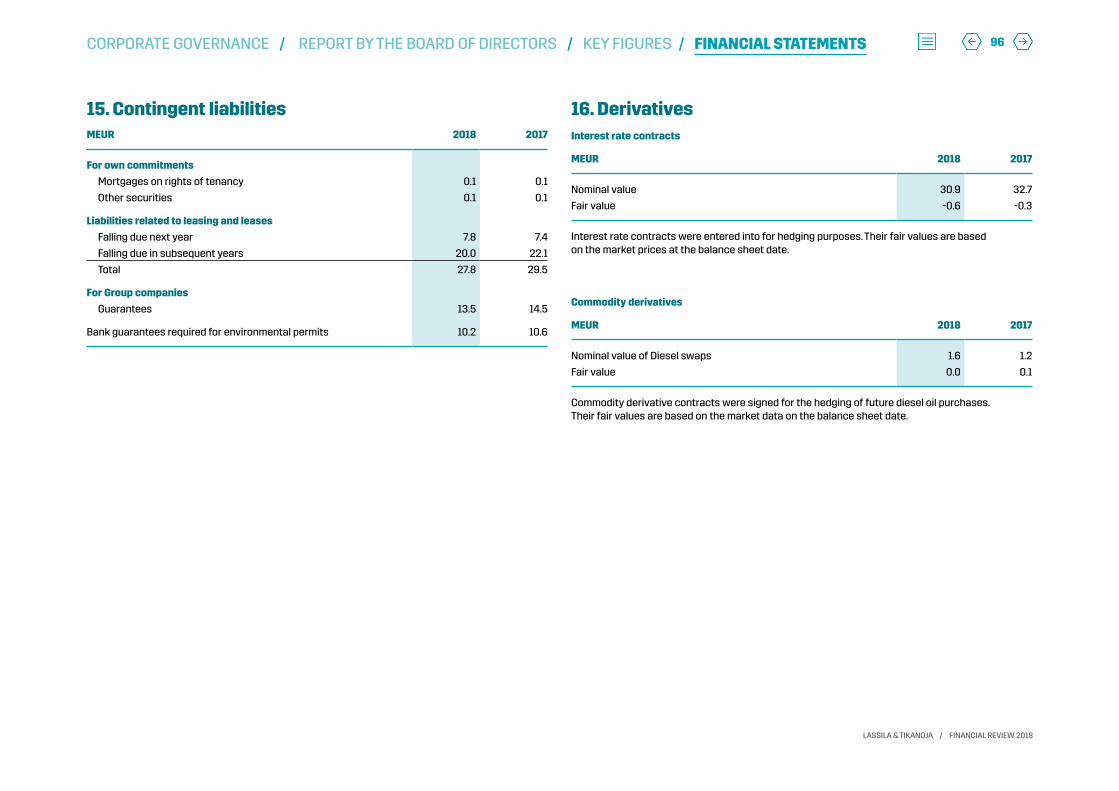
15. Contingent liabilities MEUR 2018 2017
For own commitments
Mortgages on rights of tenancy 0.1 0.1
Other securities 0.1 0.1
Liabilities related to leasing and leases
Falling due next year 7.8 7.4
Falling due in subsequent years 20.0 22.1
Total 27.8 29.5
For Group companies
Guarantees 13.5 14.5
Bank guarantees required for environmental permits 10.2 10.6
16. DerivativesInterest rate contracts
MEUR 2018 2017
Nominal value 30.9 32.7
Fair value -0.6 -0.3
Interest rate contracts were entered into for hedging purposes. Their fair values are based on the market prices at the balance sheet date.
Commodity derivatives
MEUR 2018 2017
Nominal value of Diesel swaps 1.6 1.2
Fair value 0.0 0.1
Commodity derivative contracts were signed for the hedging of future diesel oil purchases. Their fair values are based on the market data on the balance sheet date.
96
LASSILA & TIKANOJA / FINANCIAL REVIEW 2018
CORPORATE GOVERNANCE / REPORT BY THE BOARD OF DIRECTORS / KEY FIGURES / FINANCIAL STATEMENTS

PROPOSAL FOR THE DISTRIBUTION OF ASSETS THE AUDITOR’S NOTE
According to the financial statements, Lassila & Tikanoja plc’s unrestricted equity amount to
EUR 102,070,534.52 with the profit for the period representing EUR 34,330,916.99. There were no
substantial changes in the financial standing of the company after the end of the period, and the
solvency test referred to in Chapter 13, section 2 of the Companies Act does not affect the amount
of distributable assets.
The Board of Directors proposes to the Annual General Meeting that a dividend of EUR 0.92 per
share be paid on the basis of the balance sheet to be adopted for the financial year 2018.
The dividend will be paid to a shareholder who is registered in the Company’s shareholders’ register
maintained by Euroclear Finland Ltd on the record date for dividend payment, 18 March 2019. The Board
of Directors proposes to the Annual General Meeting that the dividend be paid on 25 March 2019.
No dividend shall be paid on share held by the company on the record date of dividend payment, 18
March 2019.
On the day the proposal for the distribution of assets was made, the number of shares entitling to
dividend was 38,405,922, which means
the total amount of the dividend would be .........................................................................................EUR 35,333,448.24
To be retained and carried forward ...................................................................................................................EUR 67,531,011.65
Total .................................................................................................................................................................................. EUR 102,070,534.52
Signatures to the Report of the Board of Directors and the Financial Statements for the year 2018:
Helsinki on 29 January 2019
Heikki Bergholm Sakari Lassila
Teemu Kangas-Kärki Laura Lares
Miikka Maijala Laura Tarkka
Eero Hautaniemi
President and CEO
We have today submitted our report on the audit conducted by us.
Helsinki, 6 February 2019
KPMG Oy Ab
Authorised Public Accountants
Lasse Holopainen
APA
97
LASSILA & TIKANOJA / FINANCIAL REVIEW 2018
CORPORATE GOVERNANCE / REPORT BY THE BOARD OF DIRECTORS / KEY FIGURES / FINANCIAL STATEMENTS

To the Annual General Meeting of Lassila & Tikanoja Plc
Report on the Audit of the Financial StatementsOpinion
We have audited the financial statements of
Lassila & Tikanoja Plc (business identity code
1680140-0) for the year ended 31 December,
2018. The financial statements comprise the
consolidated balance sheet, income statement,
statement of comprehensive income, state-
ment of changes in equity, state-ment of cash
flows and notes, including a summary of signif-
icant accounting policies, as well as the parent
company’s balance sheet, income statement,
statement of cash flows and notes.
In our opinion
• the consolidated financial statements give
a true and fair view of the group’s financial
position, fi-nancial performance and cash
flows in accordance with International
Financial Reporting Standards (IFRS) as
adopted by the EU
• the financial statements give a true and
fair view of the parent company’s financial
performance and financial position in
accordance with the laws and regulations
governing the preparation of financial
statements in Finland and comply with
statutory requirements.
Our opinion is consistent with the additional
report submitted to the Audit Committee.
Basis for Opinion
We conducted our audit in accordance with
good auditing practice in Finland. Our responsi-
bilities under good auditing practice are further
described in the Auditor’s Responsibilities for
the Audit of the Finan-cial Statements section
of our report.
We are independent of the parent company
and of the group companies in accordance
with the ethical requirements that are applica-
ble in Finland and are relevant to our audit, and
we have fulfilled our other ethical responsibili-
ties in accordance with these requirements.
In our best knowledge and understanding,
the non-audit services that we have provided
to the parent company and group companies
are in compliance with laws and regulations
applicable in Finland re-garding these services,
and we have not provided any prohibited
non-audit services referred to in Arti-cle 5(1) of
regulation (EU) 537/2014. The non-audit servic-
es that we have provided are disclosed in note
33 to the consolidated financial statements.
We believe that the audit evidence we have
obtained is sufficient and appropriate to pro-
vide a basis for our opinion.
Materiality
The scope of our audit was influenced by our
application of materiality. The materiality is de-
termined based on our professional judgement
and is used to determine the nature, timing and
extent of our audit procedures and to evaluate
the effect of identified misstatements on the
financial statements as a whole. The level of
materiality we set is based on our assess-
ment of the magnitude of misstatements that,
individually or in aggregate, could reasonably
be expected to have influence on the eco-
nomic de-cisions of the users of the financial
statements. We have also taken into account
misstatements and/or possible misstatements
that in our opinion are material for qualitative
reasons for the users of the finan-cial state-
ments.
Key Audit Matters
Key audit matters are those matters that, in our
professional judgment, were of most signifi-
cance in our audit of the financial statements
of the current period. These matters were
addressed in the context of our audit of the
financial statements as a whole, and in forming
our opinion thereon, and we do not provide a
separate opinion on these matters. The signif-
icant risks of material misstatement referred
to in the EU Regulation No 537/2014 point (c) of
Article 10(2) are included in the description of
key audit matters below.
AUDITOR’S REPORT This document is an English translation of the Finnish auditor’s report. Only the Finnish version of the report is legally binding.
We have also addressed the risk of manage-
ment override of internal controls. This includes
considera-tion of whether there was evidence
of management bias that represented a risk of
material misstate-ment due to fraud.
98
LASSILA & TIKANOJA / FINANCIAL REVIEW 2018
CORPORATE GOVERNANCE / REPORT BY THE BOARD OF DIRECTORS / KEY FIGURES / FINANCIAL STATEMENTS

THE KEY AUDIT MATTER
HOW THE MATTER WAS ADDRESSED IN THE AUDIT
Acquisitions and impairment of goodwill and other intangible assets(Accounting policies and Notes 4, 12 and 13 to the consolidated financial statements)
Revenue recognition (Accounting policies and Notes 2 and 3 to the consolidated financial statements)
The Group expands its activities through
ac-quisitions. As a result, the Group’s assets
in-clude a significant amount of goodwill and
other acquisition-related intangible assets. At
the year-end 31.12.2018 the Group had €151.5
million in goodwill and €19.7 million in other
acquisition-related intangible assets.
In 2017 Lassila & Tikanoja acquired Swedish
company LT FM and disclosed the provisional
amounts for the business combination. In
2018, as a final result of the negotiations for
the agreement, €2.2 million of the purchase
price was returned. Additionally, the value of
acquired net assets was adjusted by €4.4
mil-lion. The final consideration transferred
totalled €63.4 million. Goodwill arising from ac-
quisition amounted to €36.6 million and €19.0
million was allocated to separately identifiable
intangi-ble assets. In 2018 the Group made no
signifi-cant acquisitions.
Acquisition accounting requires the fair
value of the acquired assets and liabilities at
the acqui-sition date to be determined. This
involved complex valuation considerations.
There is a risk of inappropriate judgment in
de-termining the fair value of assets acquired
and use of inaccurate forecasted financial and
op-erational data in the valuations.
We have performed audit procedures on the
adjustments to consideration transferred
and acquired opening balances, as well as
evalu-ated assumptions made by management
in preparing the final purchase price allocation
of LT FM.
Our audit procedures regarding goodwill
im-pairment testing included, among others:
• We evaluated the key assumptions used in
respect of profitability levels, discount rate
and long-term growth rate.
• We involved KPMG valuation specialists
when considering the appropriateness of
the assumptions used by comparing to ex-
ternal market and industry data, and to test
the technical accuracy of the calcula-tions.
In addition, we considered the appropri-
ate-ness of the related notes to the consolidat-
ed financial statements.
Revenue recognition is one of our focus areas
for example due to following:
• Revenue consists of numerous individual
service transactions generated in multiple
business locations.
• Volumes of sales transactions processed in
several IT systems are substantial. The Group
also uses a number of service pricing models
and client contract templates.
• The collection of basic data for invoicing
purposes is based on various processes and
IT systems, too.
• Partly due to the nature of business the user
rights in the sales-related IT systems are
relatively extensive.
Our audit procedures covered assessment of
the sales-related internal control environment,
as well as testing of the operating effec-
tive-ness of the associated key controls. We
also carried out both analytical audit proce-
dures and test of details.
Audit procedures included key person
inter-views in order to obtain an understand-
ing of the whole process and to assess the
appro-priateness of the revenue recognition
princi-ples and practices applied.
We tested the functionality of the sales-re-
lated recording, recognition, invoicing and
pricing processes and went through pricing
and contract models. We also assessed the
accuracy of the recognition of revenues on
accrual basis.
In addition, we considered the appropri-
ate-ness of the Group’s disclosures in respect
of revenues.
Goodwill is tested for impairment annually.
Estimating future cash flows in impair-
ment tests involves a significant amount of
man-agement judgment in respect of profita-
bility, long-term growth rate and discount rates,
among others.
Overall, due to the high level of judgment
in-volved, and the significant carrying amounts
involved, valuation of goodwill is considered
one of the key areas of our audit.
99
LASSILA & TIKANOJA / FINANCIAL REVIEW 2018
CORPORATE GOVERNANCE / REPORT BY THE BOARD OF DIRECTORS / KEY FIGURES / FINANCIAL STATEMENTS
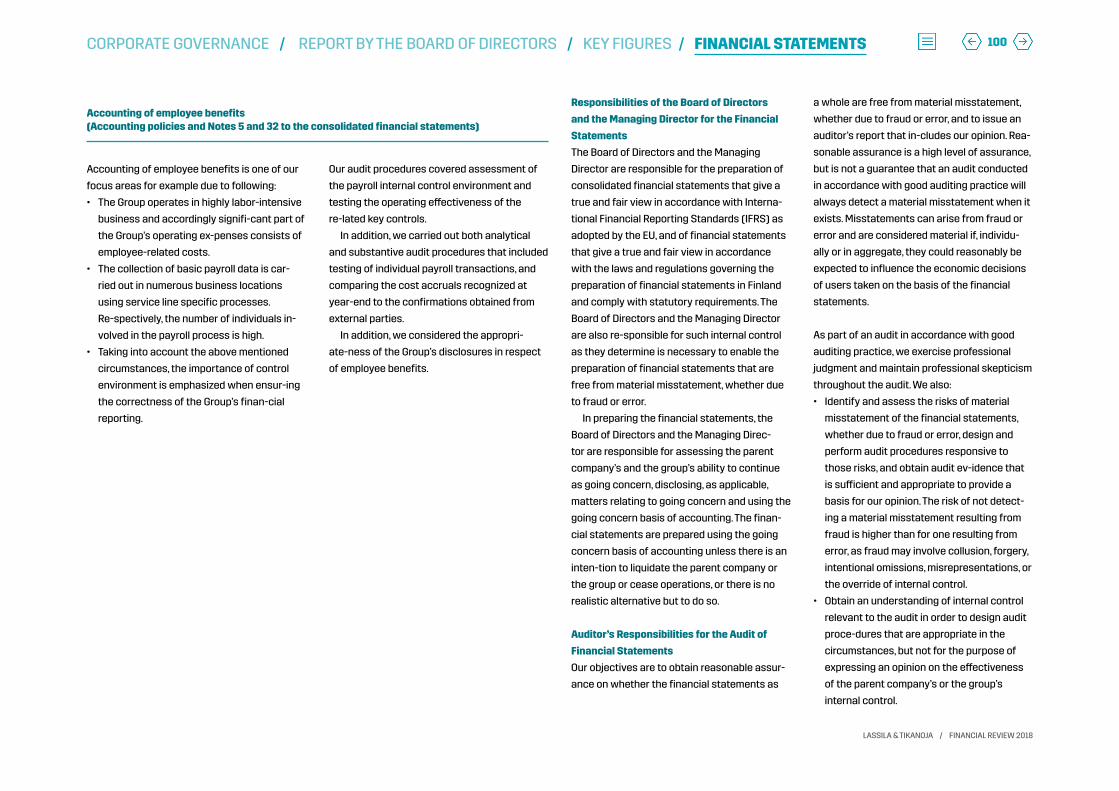
Accounting of employee benefits (Accounting policies and Notes 5 and 32 to the consolidated financial statements)
Accounting of employee benefits is one of our
focus areas for example due to following:
• The Group operates in highly labor-intensive
business and accordingly signifi-cant part of
the Group’s operating ex-penses consists of
employee-related costs.
• The collection of basic payroll data is car-
ried out in numerous business locations
using service line specific processes.
Re-spectively, the number of individuals in-
volved in the payroll process is high.
• Taking into account the above mentioned
circumstances, the importance of control
environment is emphasized when ensur-ing
the correctness of the Group’s finan-cial
reporting.
Our audit procedures covered assessment of
the payroll internal control environment and
testing the operating effectiveness of the
re-lated key controls.
In addition, we carried out both analytical
and substantive audit procedures that included
testing of individual payroll transactions, and
comparing the cost accruals recognized at
year-end to the confirmations obtained from
external parties.
In addition, we considered the appropri-
ate-ness of the Group’s disclosures in respect
of employee benefits.
Responsibilities of the Board of Directors
and the Managing Director for the Financial
Statements
The Board of Directors and the Managing
Director are responsible for the preparation of
consolidated financial statements that give a
true and fair view in accordance with Interna-
tional Financial Reporting Standards (IFRS) as
adopted by the EU, and of financial statements
that give a true and fair view in accordance
with the laws and regulations governing the
preparation of financial statements in Finland
and comply with statutory requirements. The
Board of Directors and the Managing Director
are also re-sponsible for such internal control
as they determine is necessary to enable the
preparation of financial statements that are
free from material misstatement, whether due
to fraud or error.
In preparing the financial statements, the
Board of Directors and the Managing Direc-
tor are responsible for assessing the parent
company’s and the group’s ability to continue
as going concern, disclosing, as applicable,
matters relating to going concern and using the
going concern basis of accounting. The finan-
cial statements are prepared using the going
concern basis of accounting unless there is an
inten-tion to liquidate the parent company or
the group or cease operations, or there is no
realistic alternative but to do so.
Auditor’s Responsibilities for the Audit of
Financial Statements
Our objectives are to obtain reasonable assur-
ance on whether the financial statements as
a whole are free from material misstatement,
whether due to fraud or error, and to issue an
auditor’s report that in-cludes our opinion. Rea-
sonable assurance is a high level of assurance,
but is not a guarantee that an audit conducted
in accordance with good auditing practice will
always detect a material misstatement when it
exists. Misstatements can arise from fraud or
error and are considered material if, individu-
ally or in aggregate, they could reasonably be
expected to influence the economic decisions
of users taken on the basis of the financial
statements.
As part of an audit in accordance with good
auditing practice, we exercise professional
judgment and maintain professional skepticism
throughout the audit. We also:
• Identify and assess the risks of material
misstatement of the financial statements,
whether due to fraud or error, design and
perform audit procedures responsive to
those risks, and obtain audit ev-idence that
is sufficient and appropriate to provide a
basis for our opinion. The risk of not detect-
ing a material misstatement resulting from
fraud is higher than for one resulting from
error, as fraud may involve collusion, forgery,
intentional omissions, misrepresentations, or
the override of internal control.
• Obtain an understanding of internal control
relevant to the audit in order to design audit
proce-dures that are appropriate in the
circumstances, but not for the purpose of
expressing an opinion on the effectiveness
of the parent company’s or the group’s
internal control.
100
LASSILA & TIKANOJA / FINANCIAL REVIEW 2018
CORPORATE GOVERNANCE / REPORT BY THE BOARD OF DIRECTORS / KEY FIGURES / FINANCIAL STATEMENTS

• Evaluate the appropriateness of accounting
policies used and the reasonableness
of accounting estimates and related
disclosures made by management.
• Conclude on the appropriateness of the
Board of Directors’ and the Managing
Director’s use of the going concern basis of
accounting and based on the audit evidence
obtained, whether a ma-terial uncertainty
exists related to events or conditions that
may cast significant doubt on the par-
ent company’s or the group’s ability to
continue as a going concern. If we conclude
that a material uncertainty exists, we are
required to draw attention in our auditor’s
report to the related disclo-sures in the
financial statements or, if such disclosures
are inadequate, to modify our opinion. Our
conclusions are based on the audit evidence
obtained up to the date of our auditor’s
report. However, future events or conditions
may cause the parent company or the group
to cease to continue as a going concern.
• Evaluate the overall presentation, structure
and content of the financial statements,
including the disclosures, and whether
the financial statements represent the
underlying transactions and events so that
the financial statements give a true and fair
view.
• Obtain sufficient appropriate audit evidence
regarding the financial information of
the entities or business activities within
the group to express an opinion on the
consolidated financial state-ments. We are
responsible for the direction, supervision and
performance of the group audit. We remain
solely responsible for our audit opinion.
We communicate with those charged with
governance regarding, among other matters,
the planned scope and timing of the audit and
significant audit findings, including any signif-
icant deficiencies in in-ternal control that we
identify during our audit.
We also provide those charged with govern-
ance with a statement that we have complied
with relevant ethical requirements regarding
independence, and communicate with them all
relationships and other matters that may rea-
sonably be thought to bear on our independ-
ence, and where applicable, related safeguards.
From the matters communicated with those
charged with governance, we determine those
matters that were of most significance in the
audit of the financial statements of the current
period and are therefore the key audit matters.
We describe these matters in our auditor’s
report unless law or regulation pre-cludes
public disclosure about the matter or when, in
extremely rare circumstances, we determine
that a matter should not be communicated in
our report because the adverse consequences
of doing so would reasonably be expected to
outweigh the public interest benefits of such
communication.
Other Reporting RequirementsInformation on our audit engagement
We were first appointed as auditors by the
Annual General Meeting on 15 March 2012, and
our ap-pointment represents a total period of
uninterrupted engagement of 7 years.
Other Information
The Board of Directors and the Managing
Director are responsible for the other infor-
mation. The other information comprises
the report of the Board of Directors and the
information included in the Annual Report, but
does not include the financial statements and
our auditor’s report thereon. We have ob-tained
the report of the Board of Directors prior to the
date of this auditor’s report, and the Annual
Re-port is expected to be made available to
us after that date. Our opinion on the financial
statements does not cover the other informa-
tion.
In connection with our audit of the financial
statements, our responsibility is to read the
other infor-mation identified above and, in do-
ing so, consider whether the other information
is materially incon-sistent with the financial
statements or our knowledge obtained in the
audit, or otherwise appears to be materially
misstated. With respect to the report of the
Board of Directors, our responsibility also
includes considering whether the report of
the Board of Directors has been prepared in
accordance with the ap-plicable laws and
regulations.
In our opinion, the information in the report
of the Board of Directors is consistent with the
information in the financial statements and
the report of the Board of Directors has been
prepared in accordance with the applicable
laws and regulations.
If, based on the work we have performed on
the other information that we obtained prior to
the date of this auditor’s report, we conclude
that there is a material misstatement of this
other information, we are required to report
that fact. We have nothing to report in this
regard.
Other opinions
We support that the financial statements
should be adopted. The proposal by the Board
of Directors regarding the use of the profit
shown in the balance sheet is in compliance
with the Limited Liability Companies Act. We
support that the members of the Board of
Directors of the parent company and the
President and CEO should be discharged from
liability for the financial period audited by us.
Helsinki 6 February 2019
KPMG OY AB
LASSE HOLOPAINEN
Authorised Public Accountant, KHT
101
LASSILA & TIKANOJA / FINANCIAL REVIEW 2018
CORPORATE GOVERNANCE / REPORT BY THE BOARD OF DIRECTORS / KEY FIGURES / FINANCIAL STATEMENTS

Lassila & Tikanoja plcValimotie 27, 00380 Helsinki, Finland
tel. +358 10 636 111
www.lt.fi/en
CREATING VALUE BY MAKING THE CIRCULAR ECONOMY A REALITY