Cooperative Extension Program Design, Implementation & Evaluation
Upload
norman-cameronCategory
view
220download
3
Creating Uniform Standards for Research and Development Evaluation
Panel: Cooperative Efforts in International Science and Technology Evaluation
American Evaluation Association/ Canadian Evaluation Association joint meeting
October 28, 2005
Cheryl J. Oros Director, Planning and Accountability
Cooperative State Research, Education, and Extension Service
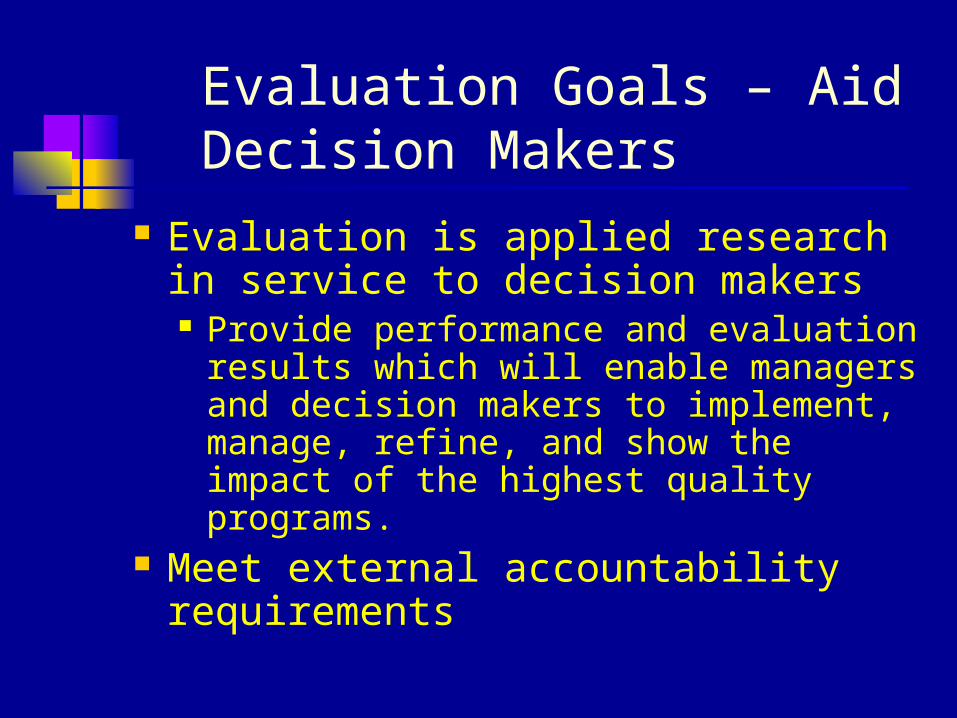
Evaluation Goals – Aid Decision Makers
Evaluation is applied research in service to decision makers Provide performance and evaluation
results which will enable managers and decision makers to implement, manage, refine, and show the impact of the highest quality programs.
Meet external accountability requirements

Planning/Decision Making
• Identify needs, problems, solutions, refinements
•Conceptualization of Program
•Formulation of Evaluation Questions and Design
Implementation
• Actualize the Program Plan
•Collection of Evaluation Data
• Analysis of Data
Evaluation Feedback
•Feedback of Evaluation Findings to Managers
•Refinement of Program
•Continued Funding
Evaluation/Management Cycle
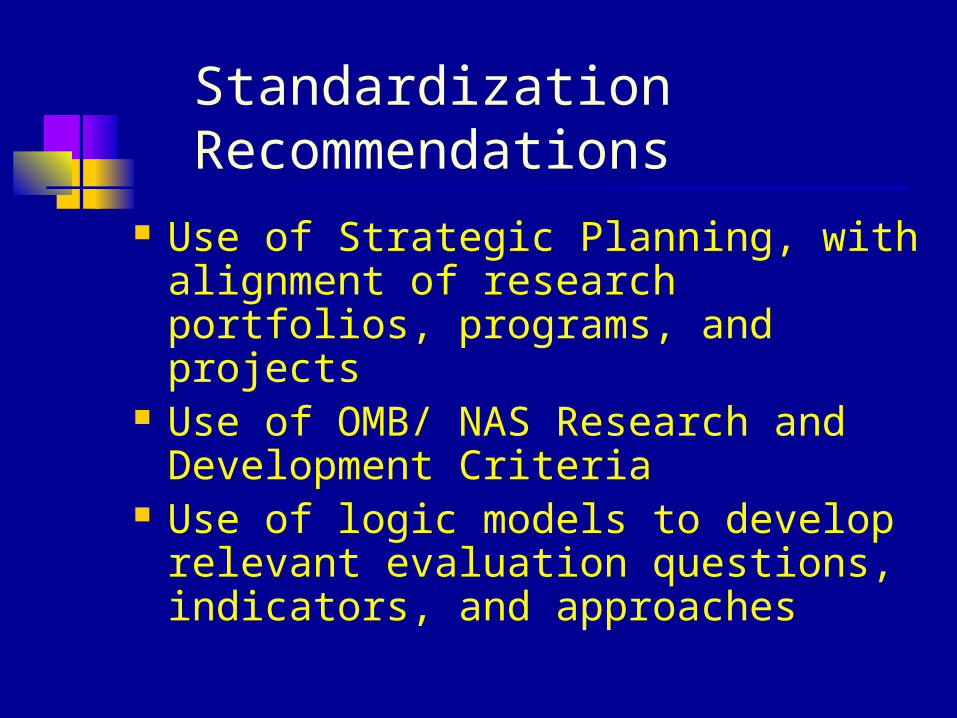
Standardization Recommendations
Use of Strategic Planning, with alignment of research portfolios, programs, and projects
Use of OMB/ NAS Research and Development Criteria
Use of logic models to develop relevant evaluation questions, indicators, and approaches

Typical designs used to assess program effectiveness
Design features that help control for alternative explanations
Best suited for (typical examples)
Process and outcome monitoring or evaluation
Compares performance to pre-existing goal or standard. For example:
OMB R&D criteria of relevance, quality and performance.
Productivity, cost effectiveness and efficiency standards
Research, enforcement, information and statistical programs, and business-like enterprises with
few, if any, alternative explanations for observed outcomes.
ongoing programs producing goods and services
complete national coverage
Quasi-experiments – Single Group
Compare outcomes for program participants or entities before and after the intervention.
Multiple data points over time are necessary. Control for alternative explanations by statistical
adjustments and analyses such as modeling.
Regulatory and other programs with clearly defined interventions with distinct
starting times complete national coverage random assignment of participants or entities
to groups is NOT feasible, practical, or ethical.
Quasi-experiments- Comparison Groups
Compares outcomes for program participants or entities with outcomes for a comparison group selected to closely match the “treatment” group on key characteristics.
Key characteristics are plausible alternative explanations for the outcome.
Measure outcomes before and after intervention (pretest, posttest).
Service and other programs with clearly defined interventions that can be
standardized and controlled limited national coverage random assignment of participants or entities
to groups is NOT feasible, practical, or ethical.
Randomized experiments
Compares outcomes for randomly assigned program (treatment) participants or entities with outcomes for a randomly assigned “control” group prior to intervention.
Measure outcomes before and after intervention (pretest, posttest).
Service and other programs with clearly defined interventions that can be
standardized and controlled limited national coverage random assignment of participants or entities
to groups is feasible and ethical.
Table 2: Common Evaluation Approaches For Assessing Program Effectiveness
New U.S. federal encouragements to standardize evaluation approaches
PART BPI Budget Justifications
OMB PART OMB’s Program Assessment
Rating Tool Program Purpose & Design Strategic Planning Program Management Program Results
Federal Budget & Performance Integration
Budget submissions need alignment with goals & objectives, with funds distributed accordingly, along with quantifiable performance measures

Explanatory Notes/ Budget Justifications
Introduction: national problem, why important & how CSREES plans to solve problem
How CSREES plans to spend funds
What would happen if funding not received

Budget justifications (cont.)
Draw on past accomplishments Identify performance
measurements and evaluation plans
Acknowledge and deal with environmental complexities

Example of fully aligned Strategic Goals:
1. Enhance economic opportunities for agricultural producers
2. Support increased economic opportunities and improved quality of life in rural America
3. Enhance protection and safety of the nation’s agriculture and food supply
4. Improve the nation’s nutrition and health5. Protect and enhance the nation’s natural
resource base and environment

Cascading Alignment.
Goal
Strategic Objective
Portfolio
Topic areas
Programs/projects
Mission
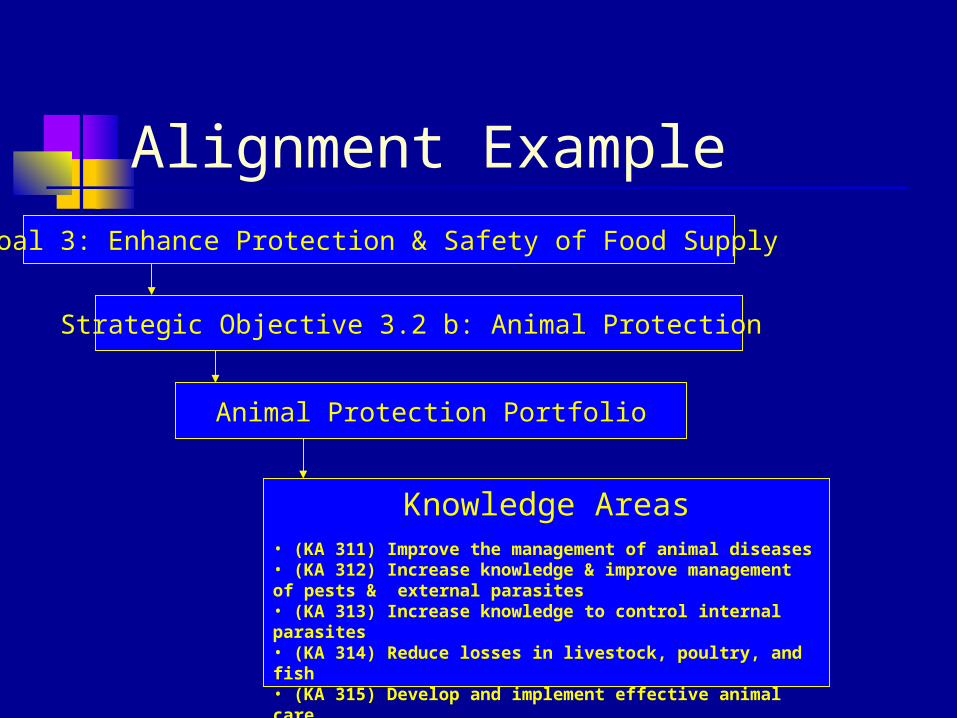
Alignment ExampleGoal 3: Enhance Protection & Safety of Food Supply
Strategic Objective 3.2 b: Animal Protection
Animal Protection Portfolio
Knowledge Areas• (KA 311) Improve the management of animal diseases• (KA 312) Increase knowledge & improve management of pests & external parasites• (KA 313) Increase knowledge to control internal parasites• (KA 314) Reduce losses in livestock, poultry, and fish• (KA 315) Develop and implement effective animal care
Evaluating Research & Education Efforts: Portfolio Approach
OMB PART/BPI led to development of new portfolio assessment tool and measures
Portfolio analysis (meta-analysis) used to assess progress toward goals; guide future research plans
Uses OMB (NAS) R&D criteria (relevance, quality, performance)
“Portfolio” concept Allows numerous complex
interrelated programs, funding lines, and research projects to be described as they address strategic objectives and goals
Portfolio Review Expert Panel (PREP) Process
Focus on outcomes rather than processes
Level of analysis is a portfolio identified via research topic areas in databases
Scores portfolio progress & provides recommendations for Agency

Evidentiary materials Tracks papers, citations, patents,
products, educational efforts, adoption of products/ practices
Entire evaluation studies and special analyses
Budget tables to show portfolio priorities and emphases
5 Dimensions of Relevance
Scope Focus on critical needs Identification of emerging
issues Integration of CSREES
programs Interdisciplinary integration

4 Dimensions of Quality
Significance of findings & outputs
Stakeholder assessment Alignment of portfolio with
current science Methodological rigor

5 Dimensions of Performance Portfolio productivity Portfolio completeness Portfolio timeliness Agency guidance relevant
to portfolio Portfolio accountability
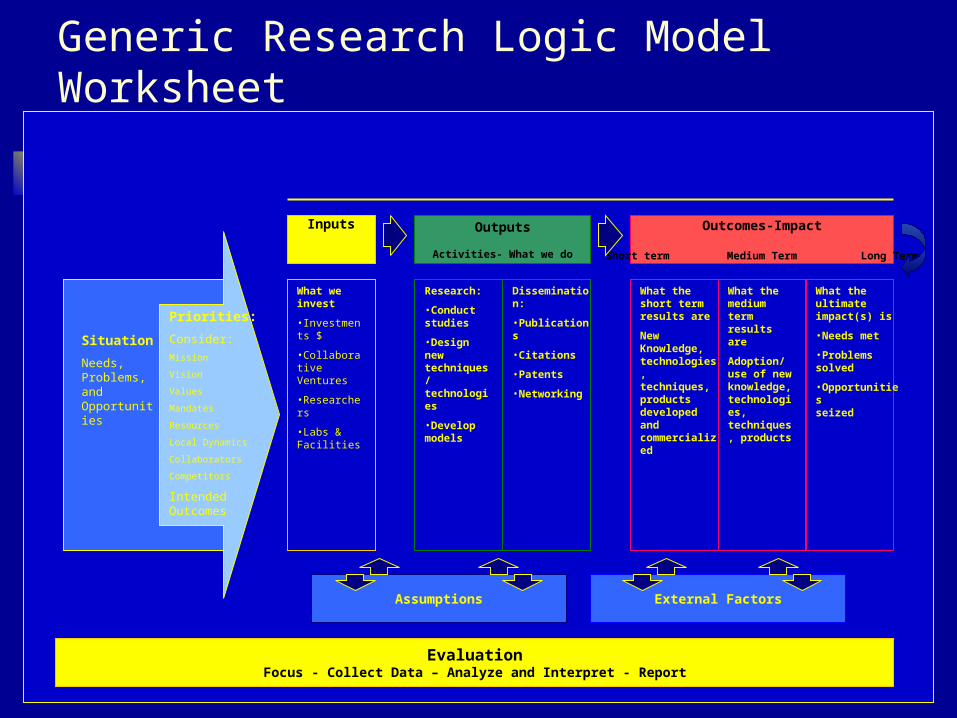
Inputs Outputs
Activities- What we do
Outcomes-Impact
Short term Medium Term Long Term
Assumptions External Factors
EvaluationFocus - Collect Data – Analyze and Interpret - Report
What we invest
•Investments $
•Collaborative Ventures
•Researchers
•Labs & Facilities
Research:
•Conduct studies
•Design new techniques/ technologies
•Develop models
Dissemination:
•Publications
•Citations
•Patents
•Networking
What the short term results are
New Knowledge, technologies, techniques, products developed and commercialized
What the medium term results are
Adoption/ use of new knowledge, technologies, techniques, products
What the ultimate impact(s) is
•Needs met
•Problems solved
•Opportunitiesseized
Situation
Needs, Problems, and Opportunities
Priorities:
Consider:
Mission
Vision
Values
Mandates
Resources
Local Dynamics
Collaborators
Competitors
Intended Outcomes
Generic Research Logic Model Worksheet

CSREES Marine Shrimp Virus Research Logic Model
Situation Inputs Activities Outputs Outcomes
•Legislation: Marine Shrimp Farming Program goal is to reduce American multi-billion dollar trade deficit by developing U.S. shrimp farming industry
•Problem: New and virulent viral diseases threaten the US & world shrimp farming industry
•Research needed to mitigate viral threats
•Research needed on high-priority opportunities to develop a sustainable U.S. commercial shrimp farming industry.
US Marine Shrimp Farming Program (USMSP) funds$4 million per year$20 million over 5 year-period
• Human Capital:FacultyResearchersIndustry• Labs
Basic Research
Genetic research for:
•Identification of shrimp diseases
•Disease prevention
•Disease resistance
Applied research
Production:• New pedigree lines for disease resistance• New products
Marketing•Developed Marketing Strategies for shrimp
ExpandedKnowledge basere Marine Shrimp Viruses
Developed biosecurity protocol methods & diagnostic tests
•Marker-assistedSelection for genetic shrimp stock
•Developdiagnostic field kits for viruses
•Disseminate informationvia website
•Breeding strategies for SPF stocks and TSV resistance
•Use biosecurityand bestmanagementpractices
•Reducewater usageratesshrimpproduced
•Reduce Levels of contaminants (TSS, NH3 and CBDO) to lbs of shrimpsproduced
•New lines Created due toresearch
•Reduction of disease transfer
•Produce andDistribute Selected stocks
•Improved economic opportunityfor producers& communities
Short Medium Long
Assumptions- Joint efforts are likely to find better solutions;without the federal lead, research in this areas will not move forward; basic research in genetics is needed and will pay off in applications for combating disease; marketing research needed to complete commercialization
External Factors – Shrimp prices, global trade in shrimp broodstock, new shrimp virus outbreak, intensive vs. Extensive management/production facilities, environmental activists’ reactions, transportation issues
Dissemination:•Publications, citations, patents, Networking; industry briefs
Extension
Train producers in best management practices
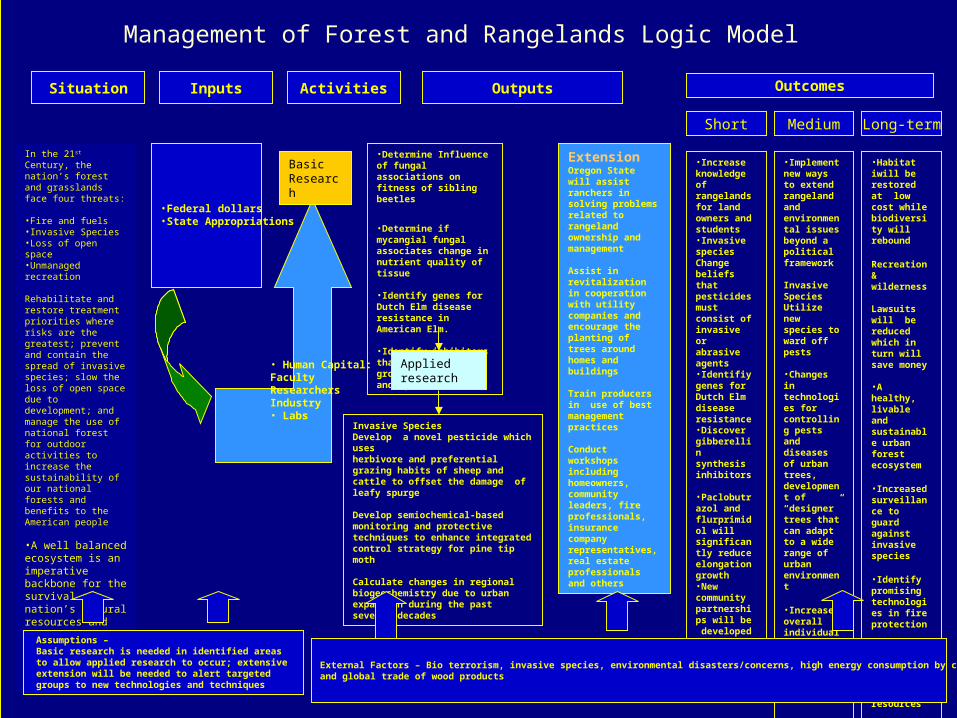
Management of Forest and Rangelands Logic Model
Situation Inputs Activities Outputs Outcomes
In the 21st Century, the nation’s forest and grasslands face four threats:
•Fire and fuels•Invasive Species•Loss of open space•Unmanaged recreation
Rehabilitate and restore treatment priorities where risks are the greatest; prevent and contain the spread of invasive species; slow the loss of open space due to development; and manage the use of national forest for outdoor activities to increase the sustainability of our national forests and benefits to the American people
•A well balanced ecosystem is an imperative backbone for the survival of nation’s natural resources and environmental base.
•Federal dollars•State Appropriations
• Human Capital:FacultyResearchersIndustry• Labs
Basic Research
•Determine Influence of fungal associations on fitness of sibling beetles
•Determine if mycangial fungal associates change in nutrient quality of tissue
•Identify genes for Dutch Elm disease resistance in American Elm.
•Identify inhibitors that will reduce growth of branches and apical shoots.
Applied research
Invasive SpeciesDevelop a novel pesticide which usesherbivore and preferential grazing habits of sheep and cattle to offset the damage of leafy spurge
Develop semiochemical-based monitoring and protective techniques to enhance integrated control strategy for pine tip moth
Calculate changes in regional biogeochemistry due to urban expansion during the past several decades
ExtensionOregon State will assist ranchers in solving problems related to rangeland ownership and management
Assist in revitalization in cooperation with utility companies and encourage the planting of trees around homes and buildings
Train producers in use of best management practices
Conduct workshops including homeowners, community leaders, fire professionals, insurance company representatives, real estate professionals and others
Short Medium Long-term
•Increase knowledge of rangelands for land owners and students•Invasive speciesChange beliefs that pesticides must consist of invasive or abrasive agents•Identifiy genes for Dutch Elm disease resistance•Discovergibberellin synthesis inhibitors
•Paclobutrazol and flurprimidol will significantly reduce elongation growth•New community partnerships will be developed to increase fire awareness
•Implement new ways to extend rangeland and environmental issues beyond a political framework
Invasive SpeciesUtilize new species to ward off pests
•Changes in technologies for controlling pests and diseases of urban trees, development of “designer” trees that can adapt to a wide range of urban environment
•Increaseoverall individual and community fire awareness and action
•Habitat iwill be restored at low cost while biodiversity will rebound
Recreation & wilderness
Lawsuits will be reduced which in turn will save money
•A healthy, livable and sustainable urban forest ecosystem
•Increased surveillance to guard against invasive species
•Identifypromising technologies in fire protection
•Increase economic opportunities for natural resources
External Factors – Bio terrorism, invasive species, environmental disasters/concerns, high energy consumption by competitorsand global trade of wood products
Assumptions –Basic research is needed in identified areas to allow applied research to occur; extensive extension will be needed to alert targeted groups to new technologies and techniques

Logic model benefits 1. Improves management
Requires that everyone articulate and agree on achievable outcomes
Helps provide roadmap for implementation
Allows everyone to recognize specific data needed for performance assessment and proof of accomplishments
Logic model benefits (cont.) 2. Facilitates evaluation
Facilitates the creation of evaluation designs
Facilitates the identification and selection of appropriate data elements
Facilitates appropriate data collection Helps in the provision of measurable
impacts
Logic model benefits (cont.) 3. Facilitates accountability
reporting and funding decisions Establishes links between problems
areas and strategic plan Extremely useful in justifying additional
funds Takes fuzziness out of the program Helps in demonstrating attributional
links in a chain of activities
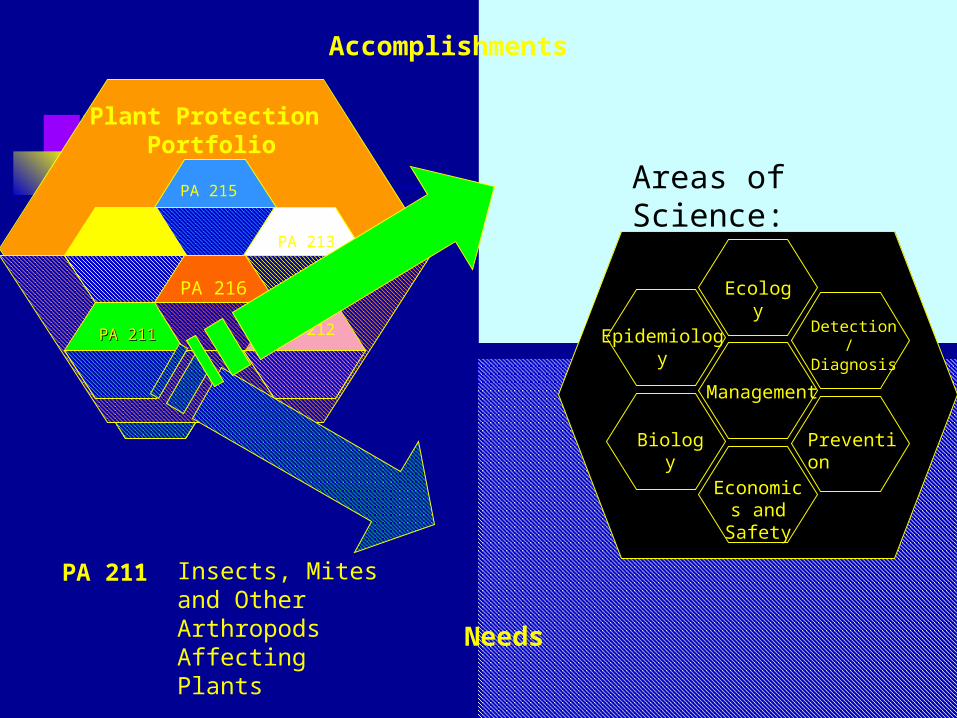
Use of Honeycomb Graphics Key players; roles and coordination Address questions of overlap and
duplication across agencies/depts. Show topic area (Portfolio and PAs)
in context of world, U.S. partnersips, federal entities, USDA, and within CSREES
PA 215
PA 213
PA 212
PA 214
PA 211
PA 211 Insects, Mites and Other Arthropods Affecting Plants
Accomplishments
Needs
Detection/ Diagnosis
Prevention
Ecology
Biology
Management
Economics and Safety
Epidemiology
PA 215
PA 213
PA 212
PA 214
PA 211PA 211
PA 216
Plant Protection Portfolio
Areas of Science:

Acc
om
plis
hm
ents
Nee
ds
PA 212 Pathogens and Nematodes Affecting Plants
Detection and
Diagnosis
Prevention
Ecology
Biology
Management
Economics and Safety
Epidemiology
Prevention
Biology and Ecology
Detection & Diagnosis
Epidemiology
Management
Economic Sustainability and Safety
•Disease free seed and stock for some diseases
•Breeding resistant plants
•Novel types of resistance genes
•Marker assisted selection
•Ability to identify some unculturable organisms
•Characterizing take-all suppressive soils
•Ecology of vectors
•Genomic sequencing
•Molecular communication between plants and microbes
•Programmed cell death
•Pathogen’s genetic fingerprint used for rapid diagnosis
•Pathogenicity sequences identified
•Digital diagnosis / NPDN
•Seed propagation certification programs
•Quarantine programs
•Traditional detection methods
•Understanding dynamics of spread
•Understanding mechanisms of spread
•Forecasting of disease based on knowledge of environmental parameters
•Biological control –e.g., A. radiobacter, Trichoderma, nematodes
•Chemical control (pathogen and/or vector)
•Cultural practices, IPM
•Disease loss estimates
•Trade embargoes – international and interstate
•Safer pesticides, reduced use through IPM
Prevention
Biology and Ecology
Detection & Diagnosis
Epidemiology
Management
Economic Sustainability and Safety
•Isolate resistance genes, create resistance genes
•Interfere with mechanisms of signaling, pathogen’s virulence systems
•Durable resistance (understanding)
•Functional genomics, proteomics, bioinformatics
•Non-host resistance
•Publicly accessible databases for genome-enabled biology
•Ability to detect individuals within a microbial population
•Rapid / high-throughput methods of detection (user friendly/economical)
•Genomic reclassification of microbial taxonomy
•Culture collection and characterization, and specific DNA probes for identification
•Other pathogens genetic fingerprint for rapid diagnosis
•Other pathogenicity sequences
•Influence of global change on pathogen spread and disease establishment
•Accurate determination of disease origin
•BC agents – establishment, mechanisms, compatibility
•Alternatives to methyl bromide
•Post-harvest disease
•Chemical induction of resistance
•Chemical resistance management
•Better understanding of impacts of diseases
•Development of sustainable production practices
•Development of trace-back
PA 215
PA 213
PA 212
PA 214
PA 211PA 211
PA 216
Plant Protection Portfolio
Use of Research Evaluation as Leadership Tool
The PART and BPI have raised consciousness and focused attention on post-project management and use of evaluation results for planning
Summary
Use of Logic Models and Portfolio graphics provide clear and concise maps of work
Meaningful outcome indicators for OMB PART and BPI provided via scores from panel
Panelists provided useful recommendations
Managers have used PREP recommendations in planning, writing RFAs, budget, etc.

Summary (Cont.) PREP process provided panelists
with new insights in planning and accountability to spread around US
PREP improved panelists’ understanding and willingness to integrate their activities into the overall federal goals identified
Contact Information Telephone: 202/ 720-5623 Fax: 202/ 720-7714 CSREES Web site:
www.csrees.usda.gov Email: [email protected]