Creating Stability & Consistency Created by funding from WIRED NW.
45
Creating Stability & Consistency Created by funding from WIRED NW
-
Upload
jonah-brown -
Category
Documents
-
view
224 -
download
0
Transcript of Creating Stability & Consistency Created by funding from WIRED NW.

Creating Stability & Consistency
Created by funding from WIRED NW

By the end of today:You should be able to determine a
Transactional Value Stream and map itBe able to indentify improvement
opportunities and develop kaizen plans to address
Understand specific lean tools for TPI
Created by funding from WIRED NW

Lean OverviewHow are transactional processes different than
factory floor processes?Difference between “product” and “information”Difference between “create” and “translate”80/20 split between people vs. machines
People are more variable than machines Where are the metrics on information flow?
Pass/Fail results, not quantitative Subjective qualitative data (good info is in the eye of
the beholder, and he keeps changing his mind!)Does the information have direct value to the
customer?Created by funding from WIRED NW
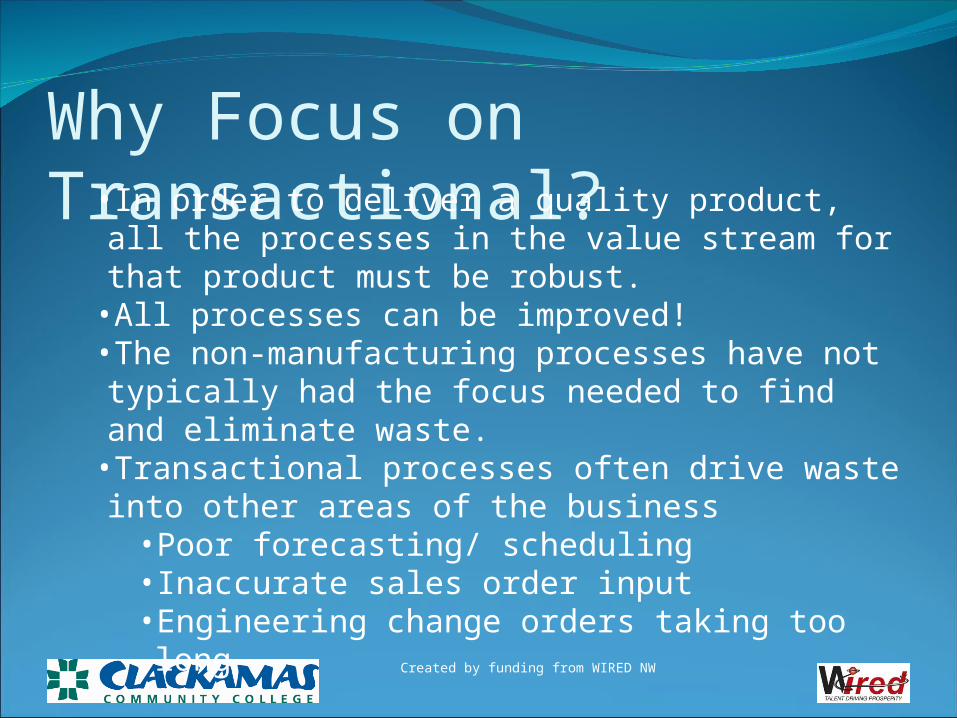
Why Focus on Transactional?•In order to deliver a quality product, all the processes in the value stream for that product must be robust.
•All processes can be improved!•The non-manufacturing processes have not typically had the focus needed to find and eliminate waste.
•Transactional processes often drive waste into other areas of the business
• Poor forecasting/ scheduling• Inaccurate sales order input• Engineering change orders taking too long
Created by funding from WIRED NW

Quote generation process Contact/Lead generation process Accounts Payable process Accounts Receivable process Service and Warranty support process Sales process Order Entry process Purchasing process Credit process Human Resource process Shipping/Receiving process Product Development process Engineering Change process Improvement Processes
What are Transactional areas?
Created by funding from WIRED NW
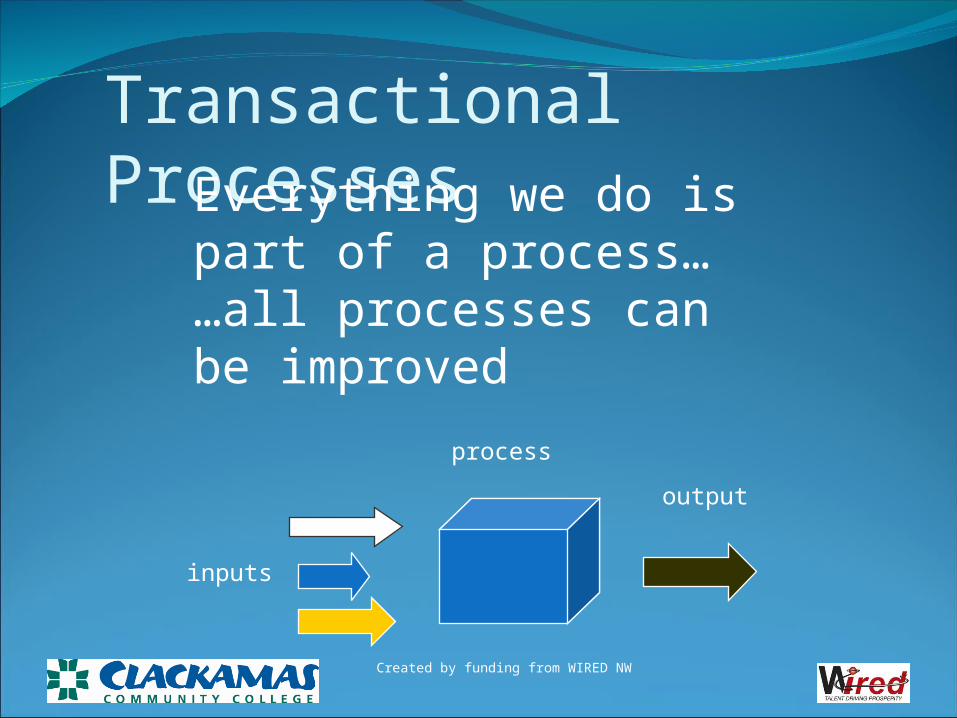
Transactional ProcessesEverything we do is part of a process……all processes can be improved
inputs
process
output
Created by funding from WIRED NW

Rework
Scrap
Ship
Traditional Method
A B CInspectionA B C
A B C Ship
Quality Built in…
Build in Qualityat Each Process Do Not Pass Along Defects!
Created by funding from WIRED NW
Marketing R&DProduct Design
Production Preparation Purch. Manuf. Distribution Service
Mkt. R&DProduct Design
Production Preparation Purch. Manuf. ServiceDist.
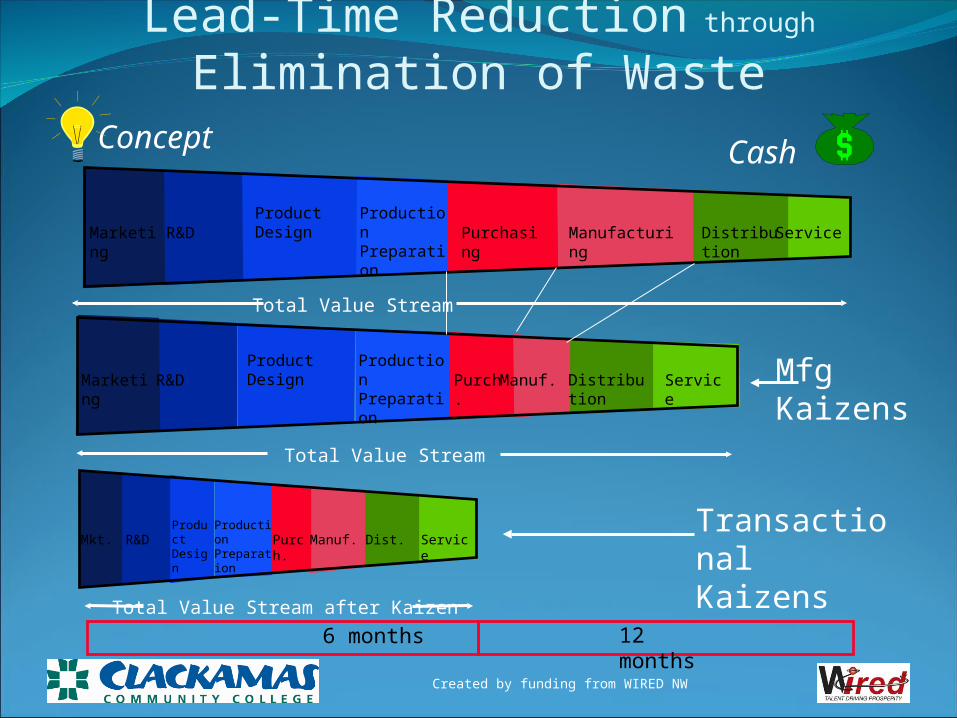
6 months 12 months
Marketing R&DProduct Design
Production Preparation Purchasing Manufacturing DistributionService
Lead-Time Reduction through Elimination of WasteConcept Cash
Total Value Stream
Total Value Stream
Total Value Stream after Kaizen
Mfg Kaizens
Transactional Kaizens
Created by funding from WIRED NW

Traditional “Over the Wall” Batch Processing
Incoming Loan Sorting Loan Calculations Final Approval/Customer Contact
Created by funding from WIRED NW
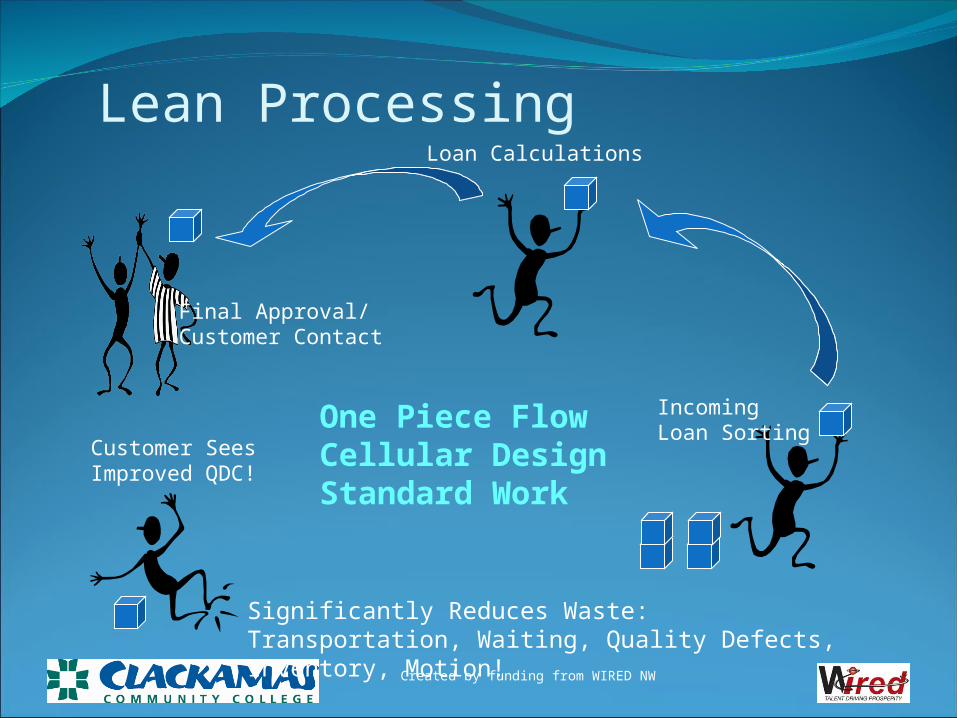
Lean Processing
Significantly Reduces Waste: Transportation, Waiting, Quality Defects, Inventory, Motion!
Customer SeesImproved QDC!
One Piece FlowCellular DesignStandard Work
Incoming Loan Sorting
Loan Calculations
Final Approval/Customer Contact
Created by funding from WIRED NW
TIME
IMPR
OV
EM
EN
T
KK
K
K
K
K
K
K
K
S
S
S
S
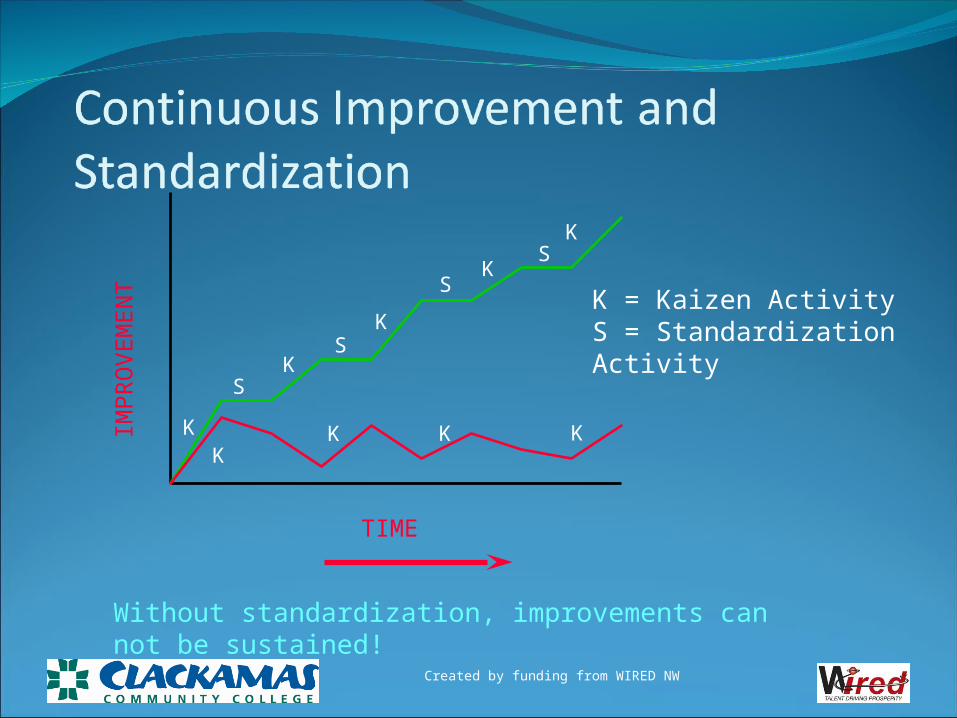
Without standardization, improvements can not be sustained!
K = Kaizen ActivityS = Standardization Activity
Created by funding from WIRED NW
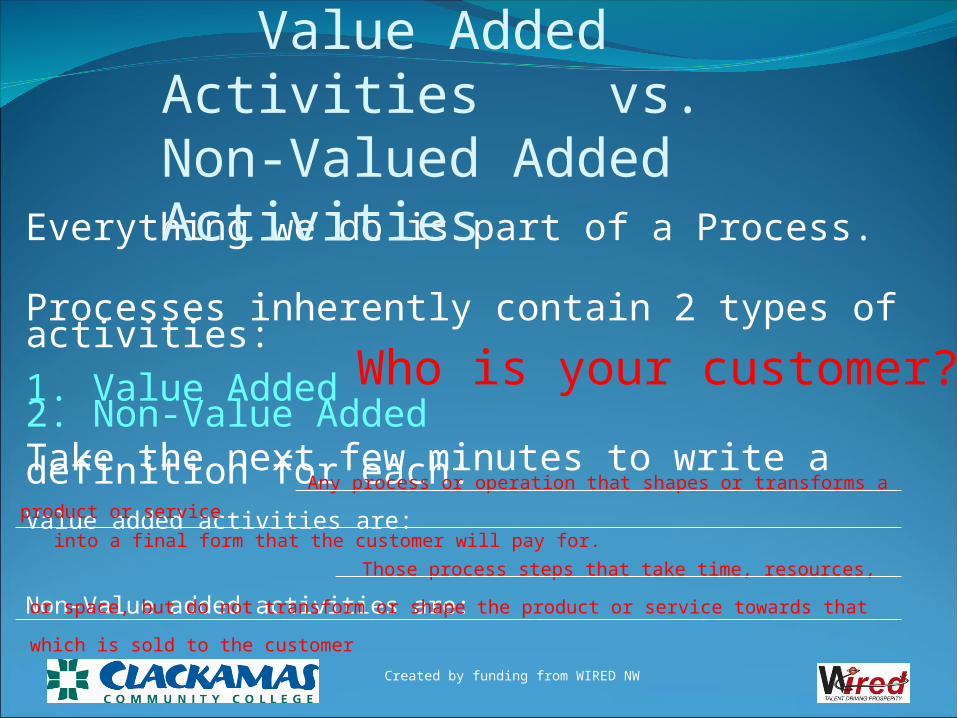
Everything we do is part of a Process.
Processes inherently contain 2 types of activities:
1. Value Added2. Non-Value AddedTake the next few minutes to write a definition for each:Value added activities are:
Non-Value added activities are:
Value Added Activities vs. Non-Valued Added Activities
Any process or operation that shapes or transforms a product or service
into a final form that the customer will pay for.
Those process steps that take time, resources, or space, but do not
transform or shape the product or service towards that which is sold to the customer
Who is your customer?
Created by funding from WIRED NW

Non-Value Adding __%
Value Adding____%
95What Are The Percentages?
Value Added Activities vs.
Non-Valued Added Activities
5The Value Add Is Usually Much Less Then 5%!
Created by funding from WIRED NW
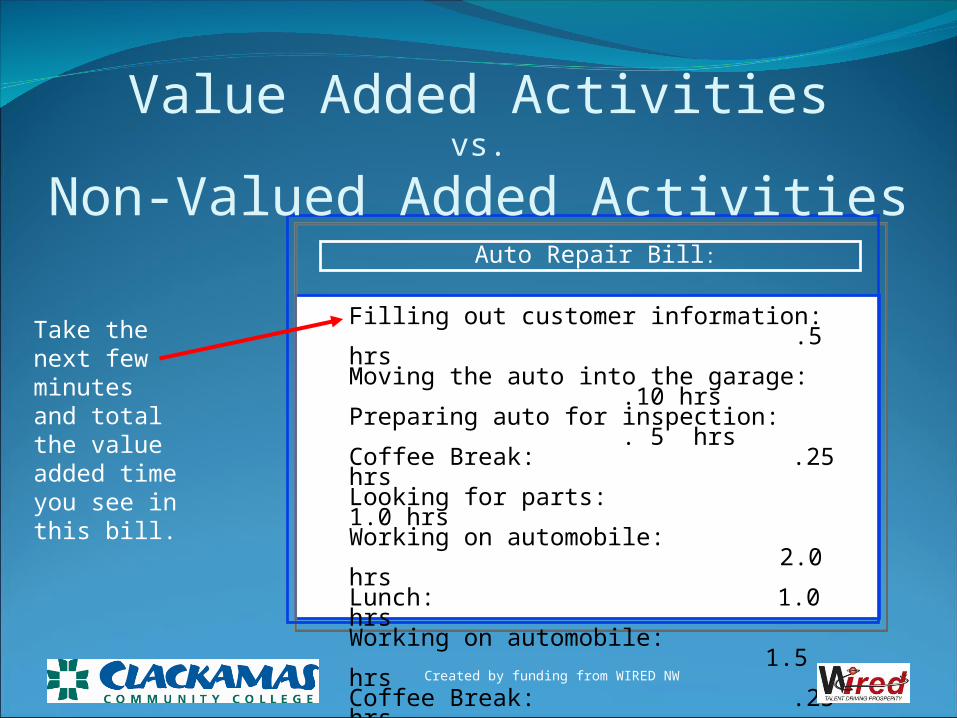
Auto Repair Bill:
Filling out customer information: .5 hrsMoving the auto into the garage: .10 hrsPreparing auto for inspection: . 5 hrsCoffee Break: .25 hrsLooking for parts: 1.0 hrsWorking on automobile: 2.0 hrsLunch: 1.0 hrsWorking on automobile: 1.5 hrsCoffee Break: .25 hrsMoving the auto out of the garage: .10 hrsExplanation of bill w/customer: .5 hrs
Total Hours Spent 7.7 hrs
Take the next few minutes and total the value added time you see in this bill.
Value Added Activities vs.
Non-Valued Added Activities
Created by funding from WIRED NW

Non Value Added vs. NecessaryWhere are we going to focus?
Value Added&Necessary
Non-VA&Necessary
Non-VA&Non-Necessary
Reduce
Eliminate
Identify
Value Added&Non-Necessary
Challenge& Eliminate
Value Added Activities vs.
Non-Valued Added Activities
Created by funding from WIRED NW

What are The Eight Wastes?
Waiting
zzzzz
Over-Processing
Sign-offs
Transportation
12 1 10 9 86 4 13 2 3 11 5 7 Unused
Creativity
Noway!
Motion InventoryQuality Defects
Wrong infoInfo missingKeypunch error
Over-Production
Created by funding from WIRED NW
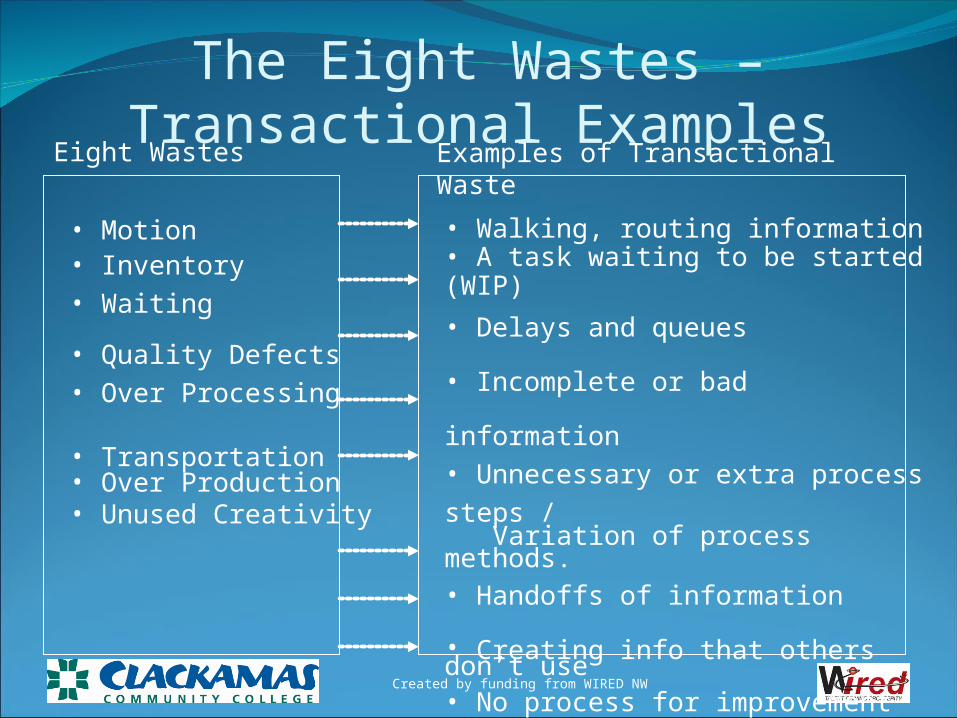
• Motion• Inventory• Waiting
• Quality Defects• Over Processing
• Transportation• Over Production• Unused Creativity
• Walking, routing information• A task waiting to be started (WIP)
• Delays and queues
• Incomplete or bad information• Unnecessary or extra process steps / Variation of process methods.• Handoffs of information
• Creating info that others don’t use • No process for improvement
Examples of Transactional WasteEight Wastes
The Eight Wastes – Transactional Examples
Created by funding from WIRED NW

• Functional organization• IS technology gaps• Excessive controls• Outdated process design• No back-up/cross training• Unbalanced workload• System batching• Outdated policies
• Changing priorities• Responsibilities not defined• Poor visual control• Disorganized workplace• Lack of training• Obsolete forms• No SOP’s• Authorization levels
The Eight Wastes – Causes of Transactional Waste
Created by funding from WIRED NW
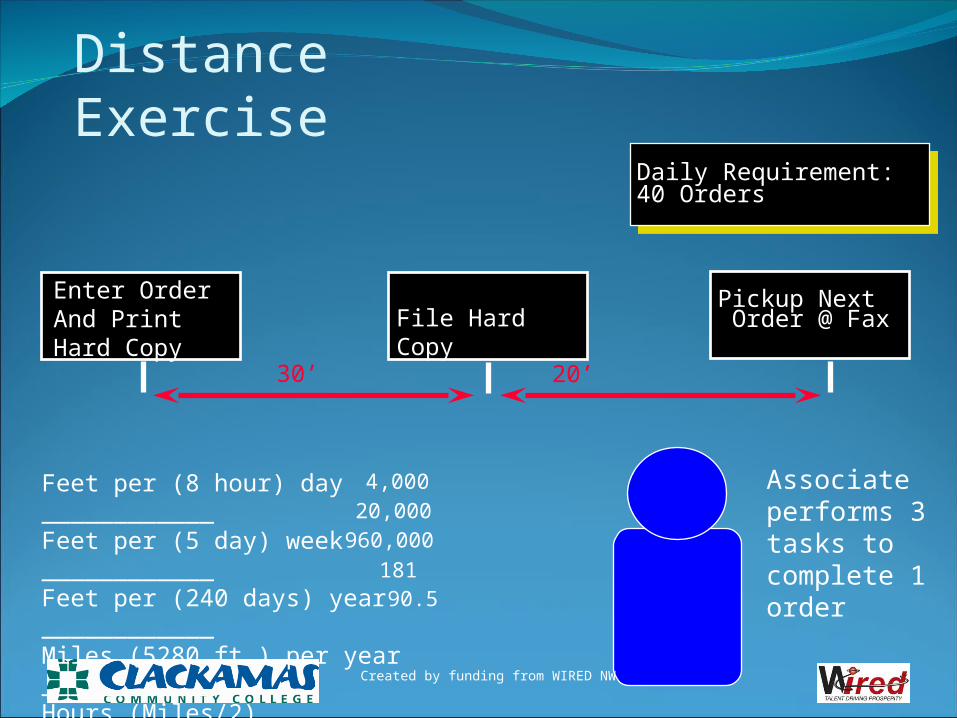
Distance Exercise
30’ 20’
File Hard CopyPickup Next Order @ Fax
Enter Order And Print Hard Copy
Daily Requirement:40 Orders
Associate performs 3 tasks to complete 1 order
Feet per (8 hour) day ____________Feet per (5 day) week ____________Feet per (240 days) year ____________Miles (5280 ft.) per year ____________Hours (Miles/2)
4,00020,000
960,000
18190.5
Created by funding from WIRED NW

Capturing The Current-State Transactional Value Stream
Transactional Value Stream Mapping (VSM) training
Walk the Value Stream starting from the customer’s perspective, walk from end to start
Map the Current-State Transactional Value Stream
Understand what a lean value stream is
Develop Kaizen Bursts from Current-State Map
Created by funding from WIRED NW

VALUE STREAM = All steps, both VA and NVA, required to bring the product from raw material to customer
Value Stream
Receive Order
Build Product
Get Paid
PROCESS PROCESS PROCESS
Concept Cash
Customer
Created by funding from WIRED NW
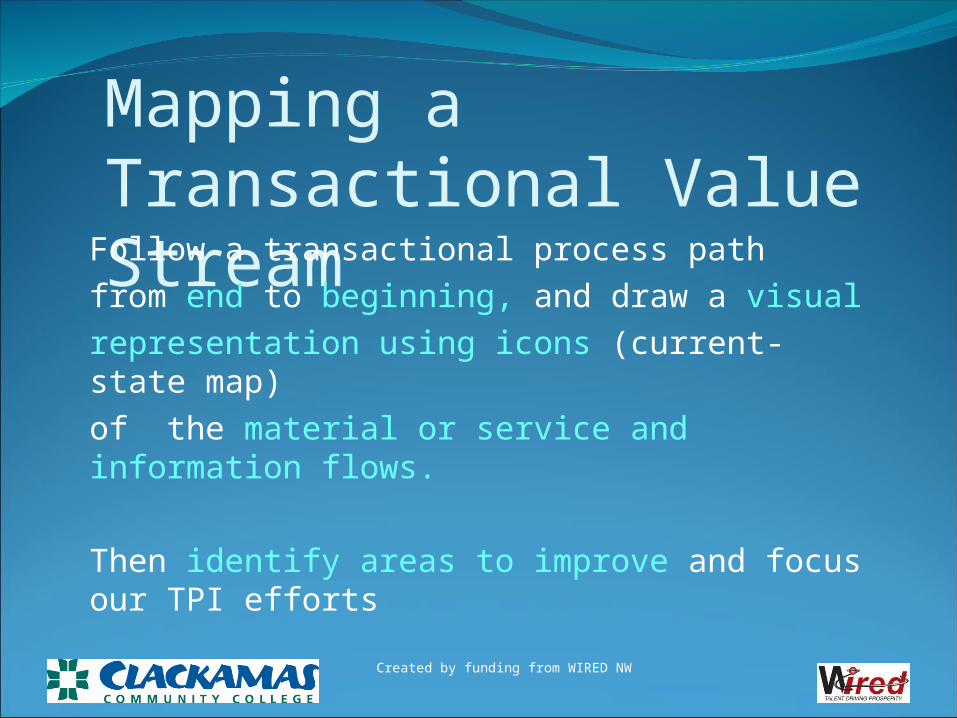
Mapping a Transactional Value Stream
Follow a transactional process pathfrom end to beginning, and draw a visual representation using icons (current-state map)of the material or service and information flows.
Then identify areas to improve and focus our TPI efforts
Created by funding from WIRED NW

Transactional VSM helps point out waste in a value stream, and then identifies the activities that can eliminate the waste.
Created by funding from WIRED NW
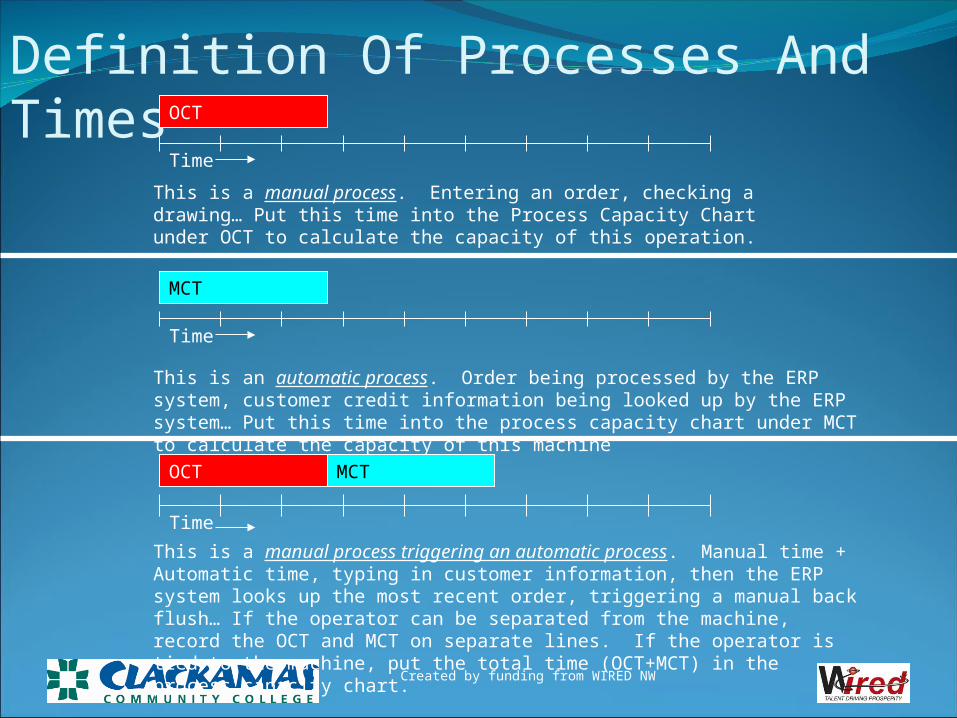
Definition Of Processes And Times
This is a manual process. Entering an order, checking a drawing… Put this time into the Process Capacity Chart under OCT to calculate the capacity of this operation.
OCT
Time
MCT
This is an automatic process. Order being processed by the ERP system, customer credit information being looked up by the ERP system… Put this time into the process capacity chart under MCT to calculate the capacity of this machine
Time
OCT MCT
This is a manual process triggering an automatic process. Manual time + Automatic time, typing in customer information, then the ERP system looks up the most recent order, triggering a manual back flush… If the operator can be separated from the machine, record the OCT and MCT on separate lines. If the operator is tied to the machine, put the total time (OCT+MCT) in the process capacity chart.
Time
Created by funding from WIRED NW
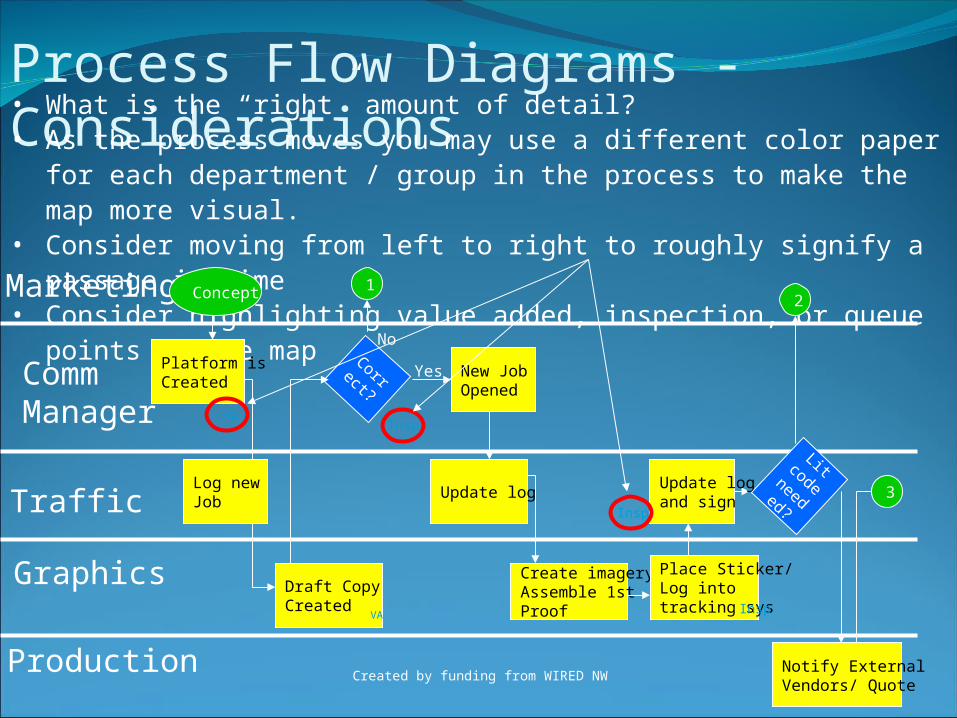
Process Flow Diagrams - Considerations• What is the “right” amount of detail?• As the process moves you may use a different color paper for each department /
group in the process to make the map more visual.• Consider moving from left to right to roughly signify a passage in time• Consider highlighting value added, inspection, or queue points on the map
Marketing
CommManager
Traffic
Concept
Platform is Created
Correct?
Draft Copy Created
Create imageryAssemble 1st Proof
Update log
Notify ExternalVendors/ Quote
1
VAInsp
Yes
No
Graphics
Production
New JobOpened
Place Sticker/Log into tracking sys
VA
Update logand sign
Lit code needed?
2
Insp
Insp
3Log new Job
Created by funding from WIRED NW

Customer Service Call Volume By Day
0
5
10
15
20
25
30
35
40
45
50
Time 1/ 2 Hour PeriodsMon T ue Wed T hur s Fr i
With this kind of variation within a day, can you calculate TAKT time the way we learned in a previous slide? Manufacturing has a due DATE, this example has requirements by the MINUTE!
Created by funding from WIRED NW

Number of operators required at 9:00 AM:
Our TAKT Time = 1800 Seconds / 47 Calls = 38 Seconds At 9:00 AM we would round
up to 10 people taking calls
Number of operators required at 5:00 PM:
Our TAKT Time = 1800 Seconds / 5 Calls = 360At 5:00 PM we only need 1 person taking calls
360 Seconds Per Call ------------------------------- = 360 TAKT Time
1 Operator
360 Seconds Per Call ------------------------------- = 38 TAKT Time
9.47 Operators
Looking at the example on the prior slide, we had 47 calls in a ½ hour period at 9:00 AM and 5 calls in a ½ hour period at 5:00 PM. For this exercise we will assume that each call averages 6 minutes or 360 seconds. There are 1800 seconds available in ½ hour.
A Playbook should do the following:• Show the number of operators required versus time (this example is ½ hour increments)• Should show what work each operator is to perform. Sometimes an operation will be split between operators.
In this case, you will need to spell out what steps each operator starts and stops at.• Be visual – high visibility charts work best.
Sum Of Process Cycle Times ------------------------------- =TAKT Time
# Of Operators
Created by funding from WIRED NW

It’s Time to make the ImprovementsBegin by asking from the customers’ perspective“What would the ideal process look like?” and create a high level Ideal Process Flow.
-Where is the non-value added?
-What is driving the non-value added?-Lack of Visual Systems?-Lack of Standard Work?-Batch processing and bottlenecks (lack of flow)? -Excessive handoffs?-Process Complexity?
-What steps can be eliminated? -Do we need to re-design? -Try-storming!!
STOP
JUST DO IT!!
Created by funding from WIRED NW
Determining Where To Focus TPI Activities
•Complete Current-State map of the Transactional Value Stream.
•Identify where TPI activities should be focused. •Use the symbol (Kaizen Burst) on the Current-State map to highlight where we will focus within the Value Stream.
•Prioritize Kaizen activities and scope what can get done this week.
•The team may tackle a portion of the Value Stream or choose to make improvements within the entire value stream.
Created by funding from WIRED NW
Sustain the ImprovementsComplete The Should Be Process Flow MapComplete The Should Be Process Standard
Work SheetPut Metrics In PlaceLearn About Countermeasures And How To
Apply ThemLearn About Future State Mapping“Should Be” Process TrainingDocumenting The “Should Be” ProcessKaizen Report Out Format
Created by funding from WIRED NW

A “Should Be Process” Flow
GenerateECR
GroupAnalyzes
ECR
ValidECR?
AssignDraftingResource
GenerateChanges
Approved?
Bring ECOto Meeting
ImplementECO
ProblemCorrected
Problem IsNoticed
No
Yes
Yes
Customer
Cross Functional
ECO/ECR Meeting
Manufacturing
Engineering
Drafting
ECO Coordinator
No
Note:This map is formatted horizontally. While this is very visual, it is not a mandatory format
Created by funding from WIRED NW
“Should Be” Process Training For Associates• Who are you going to train?• When are you going to train them?• What are you going to train them on?
These questions must be answered before you can begin to train.Remember, the “Should Be” process is the process that will be running at the end of the event so the training needs to happen before the end of the event.
Created by funding from WIRED NW
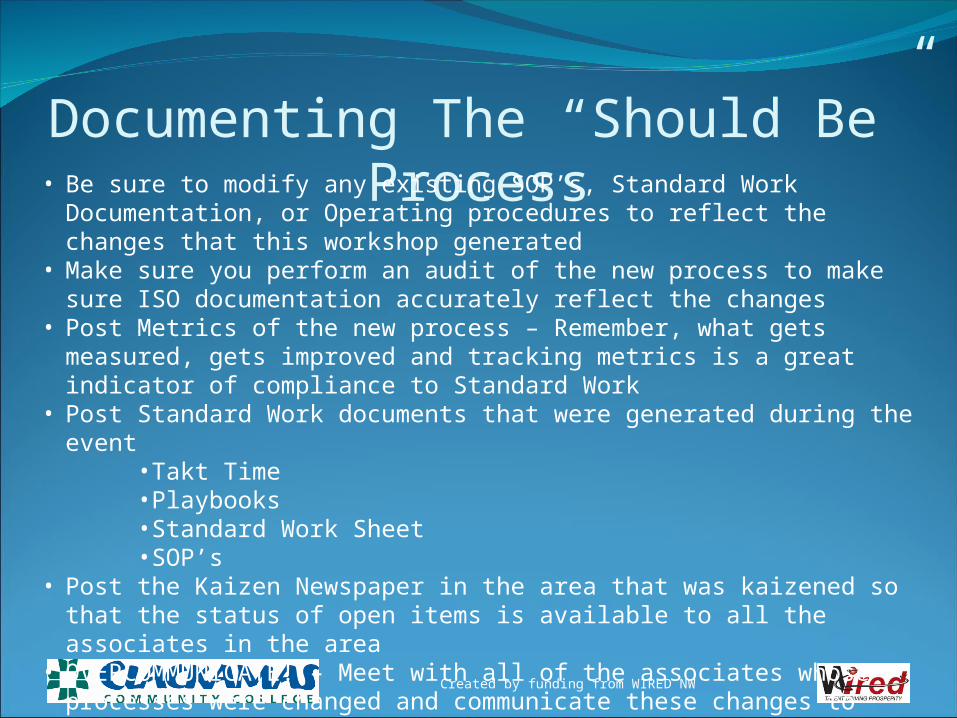
Documenting The “Should Be” Process• Be sure to modify any existing SOP’s, Standard Work Documentation, or Operating
procedures to reflect the changes that this workshop generated• Make sure you perform an audit of the new process to make sure ISO documentation
accurately reflect the changes• Post Metrics of the new process – Remember, what gets measured, gets improved and
tracking metrics is a great indicator of compliance to Standard Work• Post Standard Work documents that were generated during the event
•Takt Time•Playbooks•Standard Work Sheet•SOP’s
• Post the Kaizen Newspaper in the area that was kaizened so that the status of open items is available to all the associates in the area
• OVERCOMMUNICATE! – Meet with all of the associates whose processes were changed and communicate these changes to them immediately!
Created by funding from WIRED NW
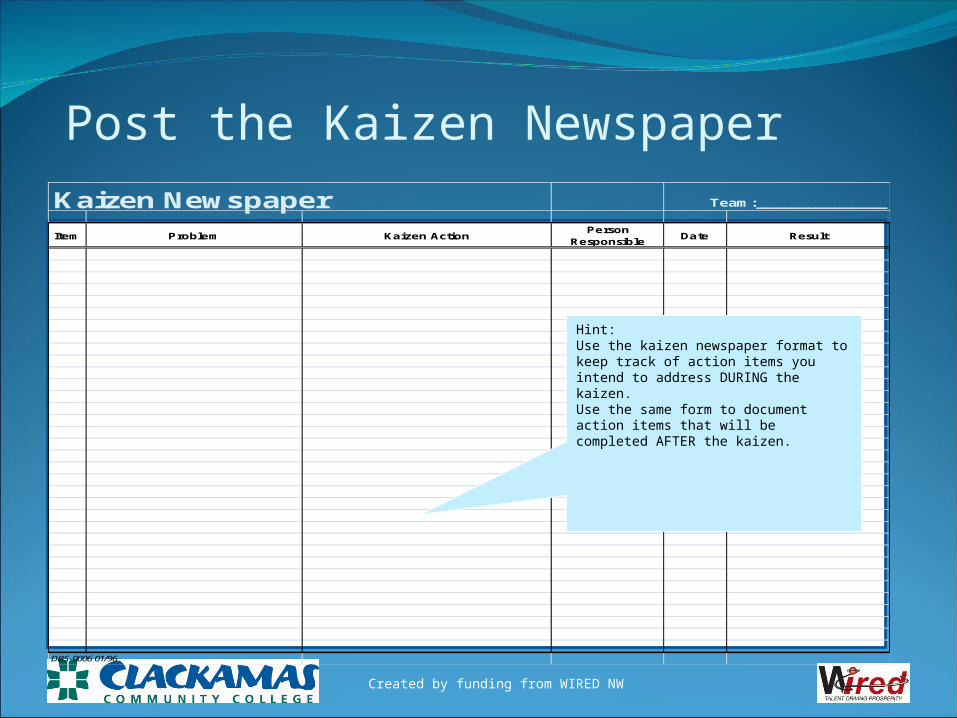
Kaizen Newspaper Team:_______________
Item Problem Kaizen ActionPerson
ResponsibleDate Result
DBS-0006 01/96
Post the Kaizen Newspaper
Hint:Use the kaizen newspaper format to keep track of action items you intend to address DURING the kaizen.Use the same form to document action items that will be completed AFTER the kaizen.
Created by funding from WIRED NW
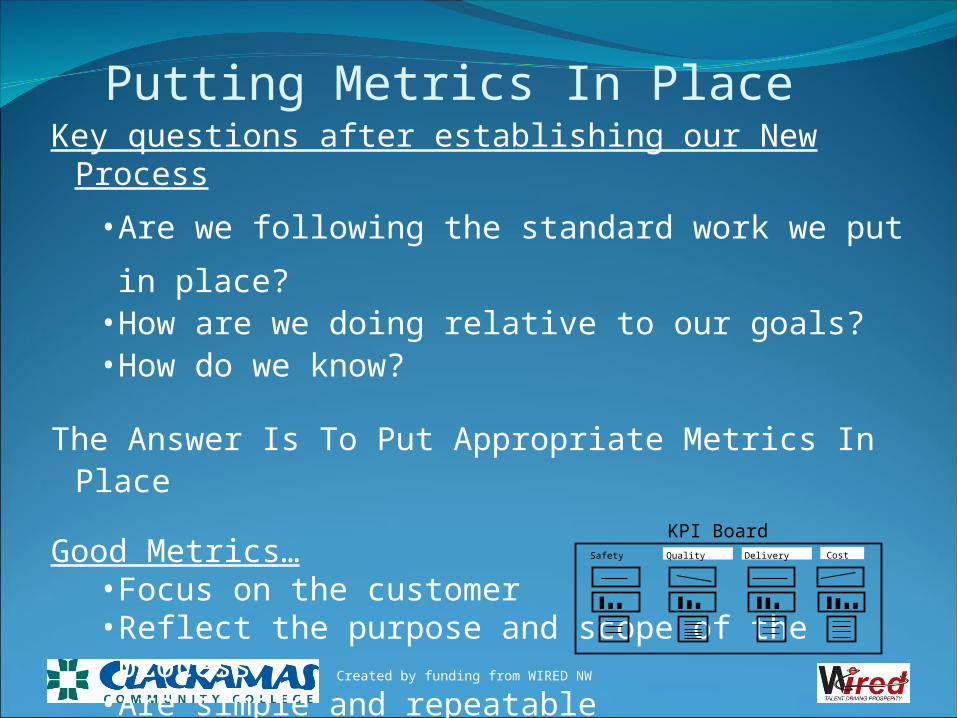
Putting Metrics In PlaceKey questions after establishing our New Process
• Are we following the standard work we put in place?• How are we doing relative to our goals?• How do we know?
The Answer Is To Put Appropriate Metrics In Place
Good Metrics…• Focus on the customer• Reflect the purpose and scope of the process• Are simple and repeatable• Track progress to goals• Are accepted as fair and helpful• Lead to action!
KPI Board
Safety Quality Delivery Cost
Created by funding from WIRED NW

GenerateECR
GroupAnalyzes
ECR
ValidECR?
AssignDraftingResource
GenerateChanges
Approved?
Bring ECOto Meeting
ImplementECO
ProblemCorrected
Problem IsNoticed
No
Yes
Yes
Customer
Cross Functional
ECO/ECR Meeting
Manufacturing
Engineering
Drafting
ECO Coordinator
No
Where Should The Process Be Measured?We typically only measure at the End
We should measure processes at Decision Blocks and at the End of the process
Created by funding from WIRED NW
Countermeasures
0
5
10
15
20
25
30
35
40
45
50
1 2 3 4 5 6
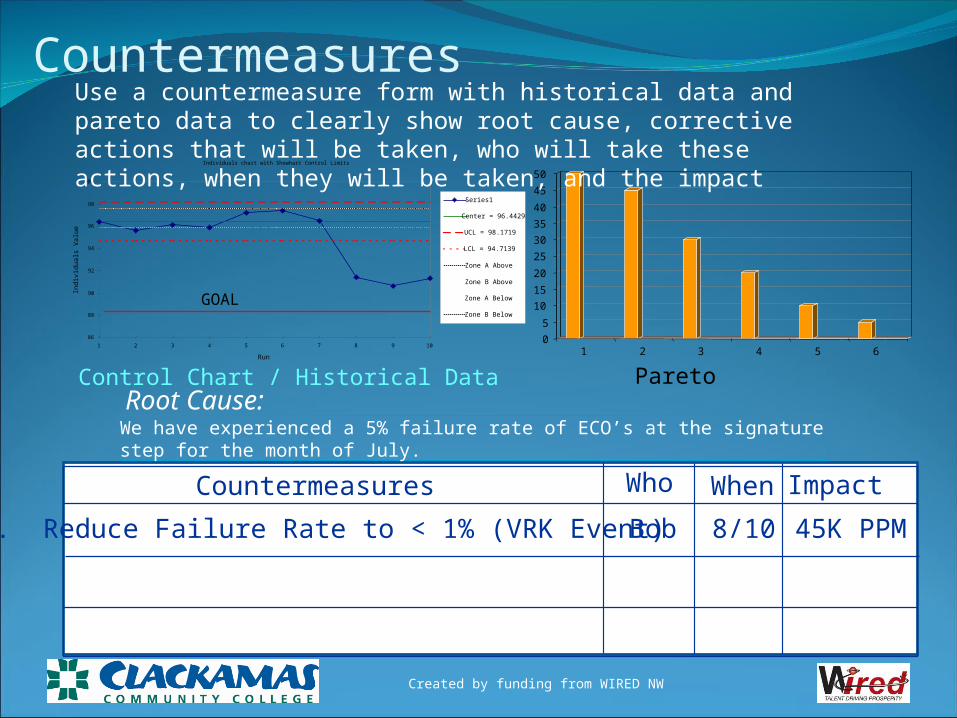
Control Chart / Historical Data ParetoRoot Cause:
We have experienced a 5% failure rate of ECO’s at the signature step for the month of July.
Individuals chart with Shewhart Control Limits
86
88
90
92
94
96
98
100
1 2 3 4 5 6 7 8 9 10
Run
Indi
vidu
als
Val
ue
Series1
Center = 96.4429
UCL = 98.1719
LCL = 94.7139
Zone A Above
Zone B Above
Zone A Below
Zone B Below
GOAL
Who WhenCountermeasures
1. Reduce Failure Rate to < 1% (VRK Event) Bob 8/10
Impact
45K PPM
Use a countermeasure form with historical data and pareto data to clearly show root cause, corrective actions that will be taken, who will take these actions, when they will be taken, and the impact
Created by funding from WIRED NW

Complete The Needed “Should Be Process” Forms
GenerateECR
GroupAnalyzes
ECR
ValidECR?
AssignDrafting
Resource
GenerateChanges
Approved?
Bring ECOto Meeting
Im plem entECO
ProblemCorrected
Problem IsNoticed
No
Yes
Yes
C ustom er
C ross FunctionalEC O/EC R M eeting
M anufacturingEngineering
D rafting
EC O C oordinator
No
Process Flow
LH-Chrys-001
L-Hand Bracket
5,400 23,600 Secs.
Date Completed:
11
Standard WIP # Pieces WIP TAKT Time Cycle Time
From:
To:
Part No.
Part Name:
Operation
Sequence
Quality Check Safety Precaution
17-Jul-02
Drawings Implemented
Problem Noticed Standard Work Sheet
Qty.
Mfg. Engneering
Product Engineering
Materials/ECO Imp. Engineering Services
Factory Floor
ECO Conference RoomMeetings 2X Per Week
ECO Process Standard Work1 - Mfg. Engineer generates ECR2 -Mfg. Engineer walks ECR to meeting3 - ECR is approved at meeting and converted to an ECO4 - Draftsman is assigned to ECO task at meeting5 - Draftsman drafts changes6 - Draftsman walks ECO to meeting7 - ECO is signed at meeting8 - ECO coordinator walks ECO to work area to implement
Standard Work Sheet / Spaghetti Diagram
Safety Quality Delivery Cost
Process Metrics
As Is Should Be PercentCategory Process Process Change
Total Processing Time 29,125 23,600 19.0%Number Of Steps 32 6 81.3%Distance Traveled 4,770 700 85.3%Number Of Handoffs 13 2 84.6%Number Of Inspection Steps 7 1 85.7%Number Of Queues 10 1 90.0%Amount Of WIP 140 11 92.1%
Process Data Summary Form
Process Being Observed: Highland ECOFrom: Problem NoticedTo: Drawings Implemented
Observed By: Bruce GrahamObservation Date: 12-Jul-2002
Process Data Summary
Standard Work Documentation
SOP’sVisual ControlsProgram ChangesPictures
Created by funding from WIRED NW

Future State MappingFuture State Mapping should be employed in TPI whenever there is a gap between what was accomplished during the TPI event and the ideal Future State. This Future State should be something that can be accomplished in about six months to one year.
Sometimes, although you may recognize the ideal Future State, there may be other organizational issues that need to be worked out first.
Another improvement that some companies realize is that they could eliminate a substantial amount of Non-Value Added activities by developing an electronic ECO system to improve and automate the following:
•ECR generation and submittal•FIFO management•Drawing Checkout process•ECO release process•ECO logging and tracking
You might chose not to automate these functions during the TPI event week to make sure the “Should Be” process works well before attempting to automate it.
Created by funding from WIRED NW

Documenting The Future-State Process
Here Are The Kaizen Bursts From The VSM Portion Of The Training
Establish FIFO
Develop Visual SystemFor High Priority ECO;s
Improve timeliness of Signature Process
Reduce # OfHandoffs
Reduce WIP
One organization has decided to attack their ECO process by implementing the following:
1. The ECR is generated by the Manufacturing Engineer (same as before)
2. The ECR will be evaluated at a cross functional meeting that will be
held 2X per week ( Reduces # Of Handoffs, Reduces WIP)
3. The cross functional meeting will evaluate ECR’s and check ECO’s for
approval. Signatures will happen right at the meeting which eliminates
the circulation process. High priority ECO’s will be color coded BLUE
so that they stand out. (Develop Visual System For High Priority ECO’s,
Improves Timeliness Of Signature Process)
4. The cross functional meeting will assign the ECR to a Draftsman who
will complete the changes. A first in first out system (FIFO) for high
priority ECO’s will be established and adhered to. (Establish FIFO)
5. After the drafting work is completed, the cross functional group will
check the ECO for quality and completeness
6. The ECO Coordinator will take the approved ECO and implement it.Created by funding from WIRED NW

OCT = 3,600Batch = 0Reject = 0%
27,000 Sec. Avail.
ECO Meeting
Drawings Implemented
TT = 6,750 Sec.
20 ECO’s Per Week1 ShiftImplement ECO
1
OCT = 5,400Batch =0Reject = 0%
27,000 Sec. Avail.
6 partial
OCT = 300PLT = 0Batch = 0.
27,000 Sec. Avail.
ECR
1
Mfg. Engineer
Notified O
f
Problem
Requiring ECO
ProblemNoticed
ECO Process Future State
Electronic Submission Of ECR
Completed
ECO’s
FIFO3 Max.
OCT = 10,800Batch = 0Reject = 0
27,000 Sec. Avail.
Make Chg’s
2
ECR’s FIFO
By Priority
VRKRej. % To 0
Software TPIElectronics Doc.System
FIFO
5 Max. In
3 Max O
ut
2X Per Week
Lead Time=2.75 DaysProcess Time=20,100
0 Days
300 Secs.
0 Days
3,600 Secs. 5,400 Secs.
Kaizen activities necessary for the company to get to their ideal state.
10,800 Secs.
2 Days .75 Days
Created by funding from WIRED NW
Kaizen Report Out
• Each team should take no longer then 15 minutes to present their results
• All team members stand with the entire team during the presentation
• Each team member should participate in some portion of the presentation
• At a minimum, the items from the presentation checklist should be presented. Any other significant item may be presented as appropriate. An example would be before and after pictures if the layout of an area was changed
• People from the areas that were kaizened who were not on a team should be present for the report out
Created by funding from WIRED NW
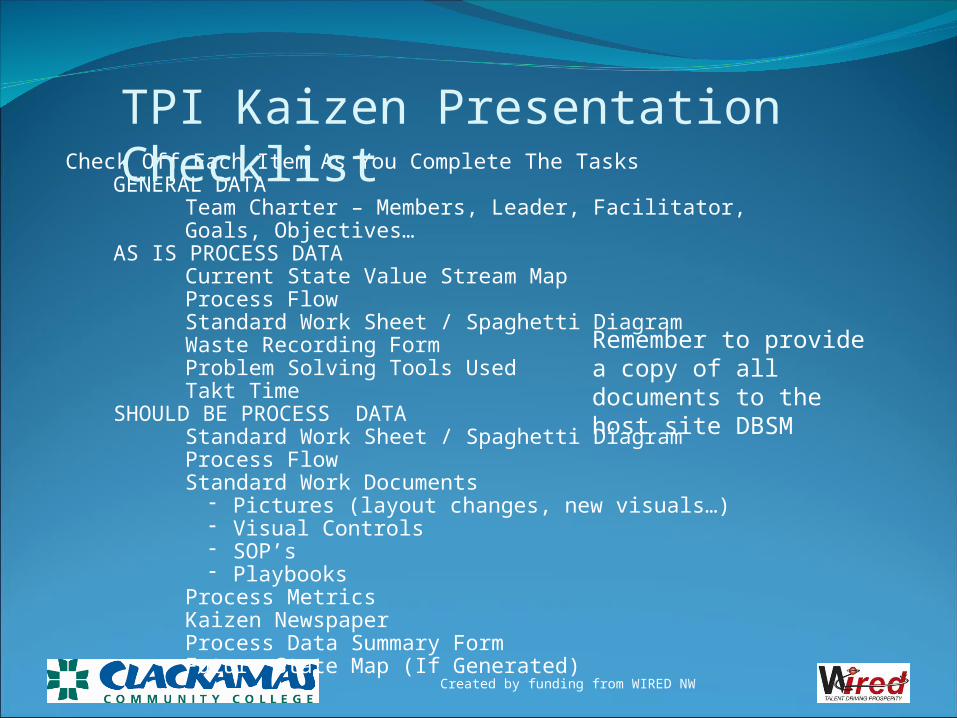
Check Off Each Item As You Complete The TasksGENERAL DATA
� Team Charter – Members, Leader, Facilitator, Goals, Objectives…AS IS PROCESS DATA
� Current State Value Stream Map� Process Flow� Standard Work Sheet / Spaghetti Diagram� Waste Recording Form� Problem Solving Tools Used� Takt Time
SHOULD BE PROCESS DATA� Standard Work Sheet / Spaghetti Diagram� Process Flow� Standard Work Documents
Pictures (layout changes, new visuals…) Visual Controls SOP’s Playbooks
� Process Metrics� Kaizen Newspaper� Process Data Summary Form� Future State Map (If Generated)
TPI Kaizen Presentation Checklist
Remember to provide a copy of all documents to the host site DBSM
Created by funding from WIRED NW

SummaryTransactional Process Improvement (TPI) is a
tool used to improve non manufacturing Value Streams
TPI is very similar to Value Stream MappingAny process can be mappedLook for opportunities to improveDevelop Kaizens to addressImplement improvements
Created by funding from WIRED NW

Independent Assignment1.Meet with your mentor and review the materials discussed in today’s session.2.Mutually agree on opportunities to apply what was learned today, using as many tools as possible.3.Value stream map a non-manufacturing process. 4.Identify Kaizen opportunities to improve the value stream.5.Identify an opportunity to apply transactional process improvement tools to a work area.
Created by funding from WIRED NW