CREATING CONSUMER-BASED BRAND EQUITY IN THE CHINESE SPORTS...
101
CREATING CONSUMER-BASED BRAND EQUITY IN THE CHINESE SPORTS SHOES MARKET: Measurement, challenges and opportunities A thesis submitted for the degree of Master of Science in International Marketing By Wenbo Cui Aalborg University September 2011
Transcript of CREATING CONSUMER-BASED BRAND EQUITY IN THE CHINESE SPORTS...
CREATING CONSUMER-BASED BRAND EQUITY
IN THE CHINESE SPORTS SHOES MARKET:
Measurement, challenges and opportunities
A thesis submitted for the degree of Master of Science in
International Marketing
By
Wenbo Cui
Aalborg University
September 2011
Acknowledgement
I would like to particularly thank my supervisor, Associate Professor
Svetla Marinova, whose gave me lots of inspirations and encouragement.
She read every word of every draft, pointing out the mistakes and helping
me to clarify my ideas. Her broad and profound knowledge gave me great
impression as well as great help.
I also wish to thank all my teachers whose gave me many helps, advices
and encouragement during my two years study at Aalborg University.
Especially, I shall extend my thanks to Professor Carsten Sitg Poulsen
for guidance support and encouragement.
Finally, I offer my regards and blessings to all of those who supported me
in any respect during the completion of the thesis.
Summary
Abstract
Brand equity is one of the significant concepts in brand management, as well as in
business practice and academic research. Developing and properly managing brand
equity has been emphasized as an important issue for most firms. Along with Chinese
sportswear sector fast growth, the competition of sportswear market is fierily and
fragmented due to numerous brands vying for consumer attention. This project is
using sports shoes as example to understand and comprehend the effects promotional
activities and dimensions brand equity on consumer based brand equity creating in
Chinese sportswear market. The main method adopted in this study was quantitative
and objective. A total of 84 Chinese respondents between 21 to 36 years old evaluated
5 brands of sports shoes. The results show that, four dimensions of brand equity
(brand awareness, brand association, perceived quality and brand loyalty) have
significant effects on brand equity; store image have positive influence on brand
equity dimensions, whereas celebrity endorsement have not influence on brand equity
dimensions.
Keywords: brand equity, dimensions of brand equity, promotional activities, sports
shoes, China.
Table of Content
1. Introduction ................................................................................................................................... 1
1.1 Background ............................................................................................................................. 1
1.2 Research purpose .................................................................................................................... 2
1.3 Research objective .................................................................................................................. 3
1.4 Research problem .................................................................................................................... 3
1.5 Structure of paper .................................................................................................................... 4
2. Literature review ........................................................................................................................... 5
2.1 Conceptual framework ............................................................................................................ 5
2.2 Brand equity ............................................................................................................................ 6
2.3 Customer-based brand equity .................................................................................................. 7
2.4 The relationship between brand equity and brand equity dimensions .................................... 8
2.4.1 Brand awareness ................................................................................................................ 9
2.4.2 Brand association ............................................................................................................. 10
2.4.3 Perceived quality .............................................................................................................. 11
2.4.4 Brand loyalty .................................................................................................................... 12
2.5 Effects of promotional activities on brand equity dimensions .............................................. 13
2.5.1 Advertising ....................................................................................................................... 14
2.5.2 Word of mouth ................................................................................................................. 15
2.5.3 Celebrity endorsement ..................................................................................................... 16
2.5.4 Sales promotion ................................................................................................................ 17
2.5.5 Store image ...................................................................................................................... 18
2.5.6 Event sponsorship ............................................................................................................ 19
2.6 Summary of literature review................................................................................................ 20
3. Methodology ............................................................................................................................... 23
3.1 Methodological approach for creating business knowledge ................................................. 23
3.2 Social science paradigm ........................................................................................................ 24
3.3 Assumption of this project .................................................................................................... 26
3.4 Three methodological approaches ......................................................................................... 28
3.5 Research design..................................................................................................................... 29
3.6 Exploratory VS conclusive research ..................................................................................... 30
3.7 Quantitative exploratory ....................................................................................................... 32
3.8 Survey techniques ................................................................................................................. 34
3.9 Sampling ............................................................................................................................... 34
3.10 Measurement ....................................................................................................................... 37
3.11 Data collection .................................................................................................................... 41
3.12 Summary of Methodolody .................................................................................................. 41
4. Analysis and discussion .............................................................................................................. 43
4.1 Demographic characteristics ................................................................................................. 43
4.2 Factor analysis ...................................................................................................................... 47
4.3 Reliability .............................................................................................................................. 49
4.4 Multiple regression analysis .................................................................................................. 50
4.4.1 Analysis of the relationship between brand equity and dimensions of brand equity ....... 50
4.4.2 Analysis of the relationship between dimensions of brand equity and promotional
activities .................................................................................................................................... 52
4.5 Summary of analysis and discussion ..................................................................................... 58
5. Conclusion and implication ........................................................................................................ 64
6. Limitation and suggestion for future research ............................................................................. 67
References ....................................................................................................................................... 68
Appendix ......................................................................................................................................... 72
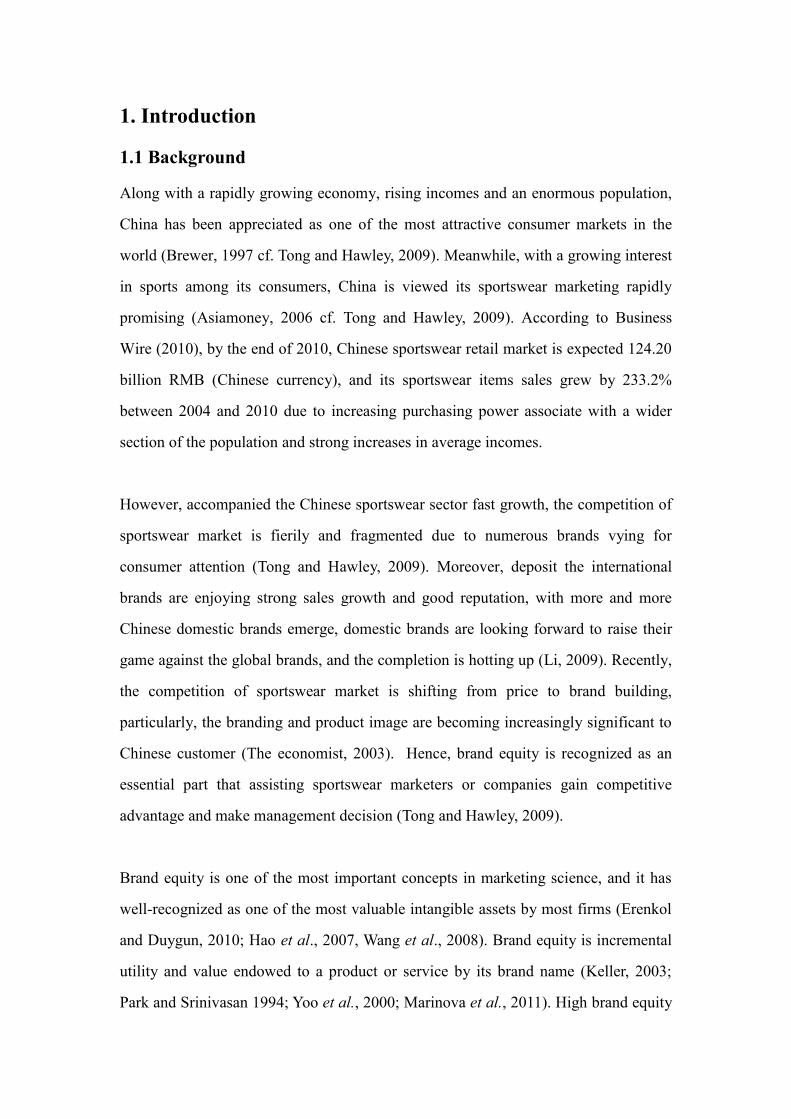
1. Introduction
1.1 Background
Along with a rapidly growing economy, rising incomes and an enormous population,
China has been appreciated as one of the most attractive consumer markets in the
world (Brewer, 1997 cf. Tong and Hawley, 2009). Meanwhile, with a growing interest
in sports among its consumers, China is viewed its sportswear marketing rapidly
promising (Asiamoney, 2006 cf. Tong and Hawley, 2009). According to Business
Wire (2010), by the end of 2010, Chinese sportswear retail market is expected 124.20
billion RMB (Chinese currency), and its sportswear items sales grew by 233.2%
between 2004 and 2010 due to increasing purchasing power associate with a wider
section of the population and strong increases in average incomes.
However, accompanied the Chinese sportswear sector fast growth, the competition of
sportswear market is fierily and fragmented due to numerous brands vying for
consumer attention (Tong and Hawley, 2009). Moreover, deposit the international
brands are enjoying strong sales growth and good reputation, with more and more
Chinese domestic brands emerge, domestic brands are looking forward to raise their
game against the global brands, and the completion is hotting up (Li, 2009). Recently,
the competition of sportswear market is shifting from price to brand building,
particularly, the branding and product image are becoming increasingly significant to
Chinese customer (The economist, 2003). Hence, brand equity is recognized as an
essential part that assisting sportswear marketers or companies gain competitive
advantage and make management decision (Tong and Hawley, 2009).
Brand equity is one of the most important concepts in marketing science, and it has
well-recognized as one of the most valuable intangible assets by most firms (Erenkol
and Duygun, 2010; Hao et al., 2007, Wang et al., 2008). Brand equity is incremental
utility and value endowed to a product or service by its brand name (Keller, 2003;
Park and Srinivasan 1994; Yoo et al., 2000; Marinova et al., 2011). High brand equity
can lead customers into a positive or strong brand association; gain or increase their
cash flow to the business, as well as make products differentiation in order to lead to
competitive advantages (Yoo et al., 2000; Aaker, 1991; Keller, 1993; Marinova et al.,
2011).
If the sportswear marketers or firms could better understand the importance of brand
equity, and then they would better gain competitive advantage, loyal their customers.
Therefore, this paper is mainly to investigate the relationship between selected
promotional activities toward brand equity dimensions and creation of brand equity,
thereby providing a conceptual framework for deeply understanding consumer based
brand equity related to Chinese sportswear market.
1.2 Research purpose
Sports style and the growth population of interest consumer in sports have a growing
influence in the clothing and footwear market in China (Tong and Hawley, 2009).
Competition is the most fundamental factor that directly affects the brand emergence
and growth. Today, the competition is fiercely in Chinese sportswear market due to
the threat of new entrances and rivals. The brand companies always try to outperform
their competitors to grab a greater share of market, thus, an appropriate marketing
strategy is necessary. Here, brand equity is a concept in marketing field which plays
an important role that affects developing business for a brand company. Hence, this
paper seeks to examine the effects promotional activities and dimensions brand equity
(brand awareness, brand association, perceived quality and brand loyalty) on
consumer based brand equity creating in Chinese sportswear market. The finding of
this paper will help sportswear marketers or companies to create positive brand equity
in order to increase develop their future‟s business growth and profit.
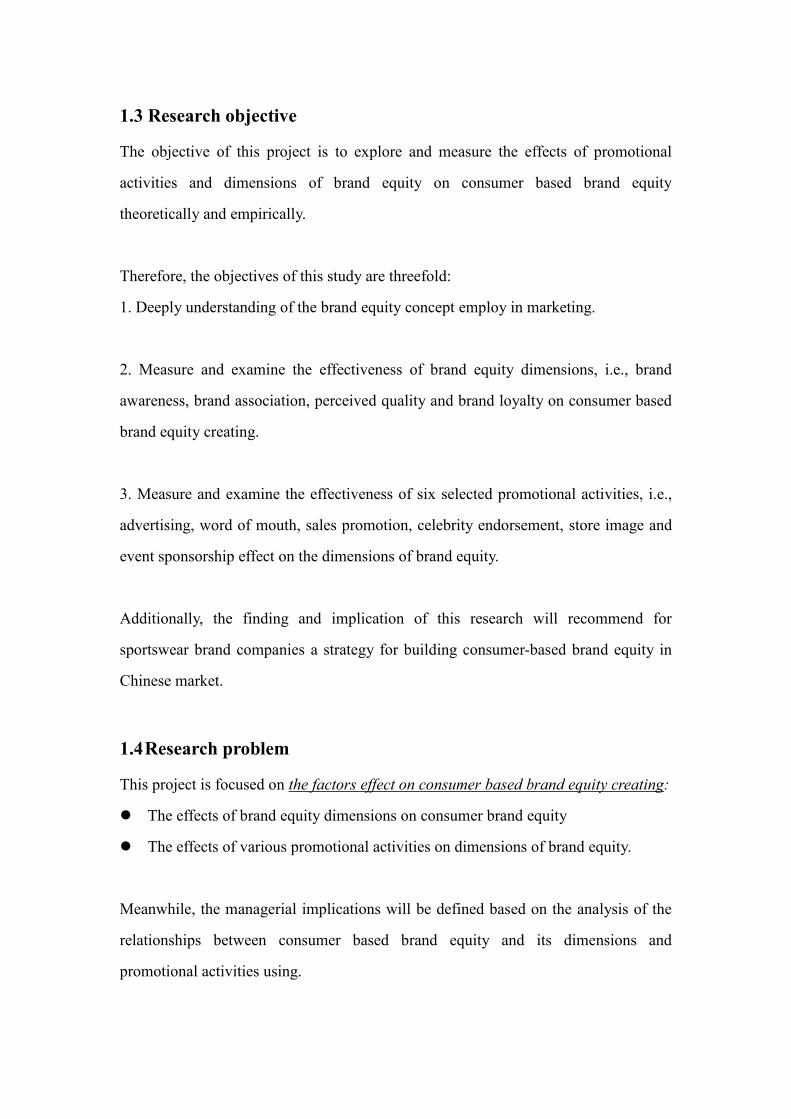
1.3 Research objective
The objective of this project is to explore and measure the effects of promotional
activities and dimensions of brand equity on consumer based brand equity
theoretically and empirically.
Therefore, the objectives of this study are threefold:
1. Deeply understanding of the brand equity concept employ in marketing.
2. Measure and examine the effectiveness of brand equity dimensions, i.e., brand
awareness, brand association, perceived quality and brand loyalty on consumer based
brand equity creating.
3. Measure and examine the effectiveness of six selected promotional activities, i.e.,
advertising, word of mouth, sales promotion, celebrity endorsement, store image and
event sponsorship effect on the dimensions of brand equity.
Additionally, the finding and implication of this research will recommend for
sportswear brand companies a strategy for building consumer-based brand equity in
Chinese market.
1.4 Research problem
This project is focused on the factors effect on consumer based brand equity creating:
The effects of brand equity dimensions on consumer brand equity
The effects of various promotional activities on dimensions of brand equity.
Meanwhile, the managerial implications will be defined based on the analysis of the
relationships between consumer based brand equity and its dimensions and
promotional activities using.
1.5 Structure of the paper
This paper will start with a brief background of Chinese sportswear industry, as well
as we introduce the importance of consumer based brand equity towards sportswear
industry. Moreover, the research problem, research purpose and the research objective
are also presented in the introduction part.
After having a general idea, the literature review will be conducted in theatrical
framework part. The theory discussion will be based on brand equity dimension and
its selected promotional activities on consumer based brand equity relationship.
Methodology part will discuss the chosen research approach and method in this study.
By clarifying the assumption of this paper, the method that will be used in this paper
is quantitative and objective; and therefore the analytical approach will be applied. By
using questionnaire survey, the collected data will be used in the empirical analysis
and discussion.
Subsequently, by using SPSS as statistical method, the collected data will be
analyzed. Based on the data analysis, it will be clear discussed the relationship
between consumer based brand equity and its dimensions and selected promotional
activities.
Finally, a conclusion will summarize the findings and discuss the implications for the
future study.
2. Literature review
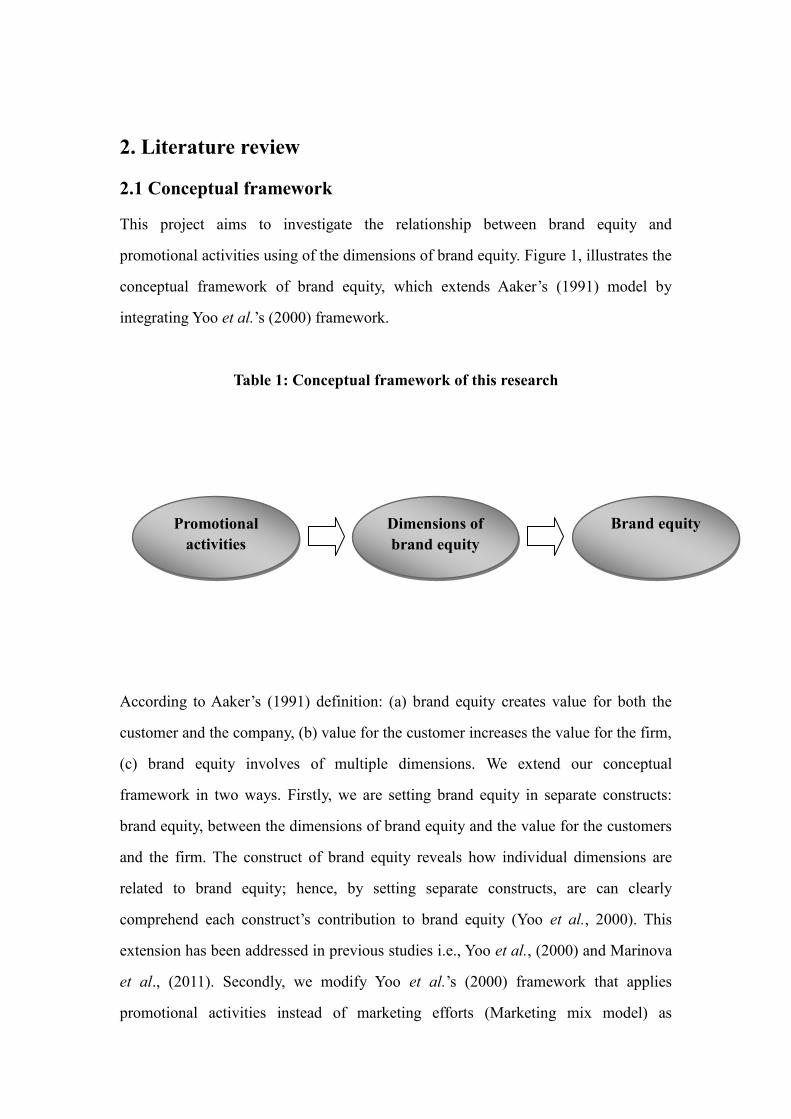
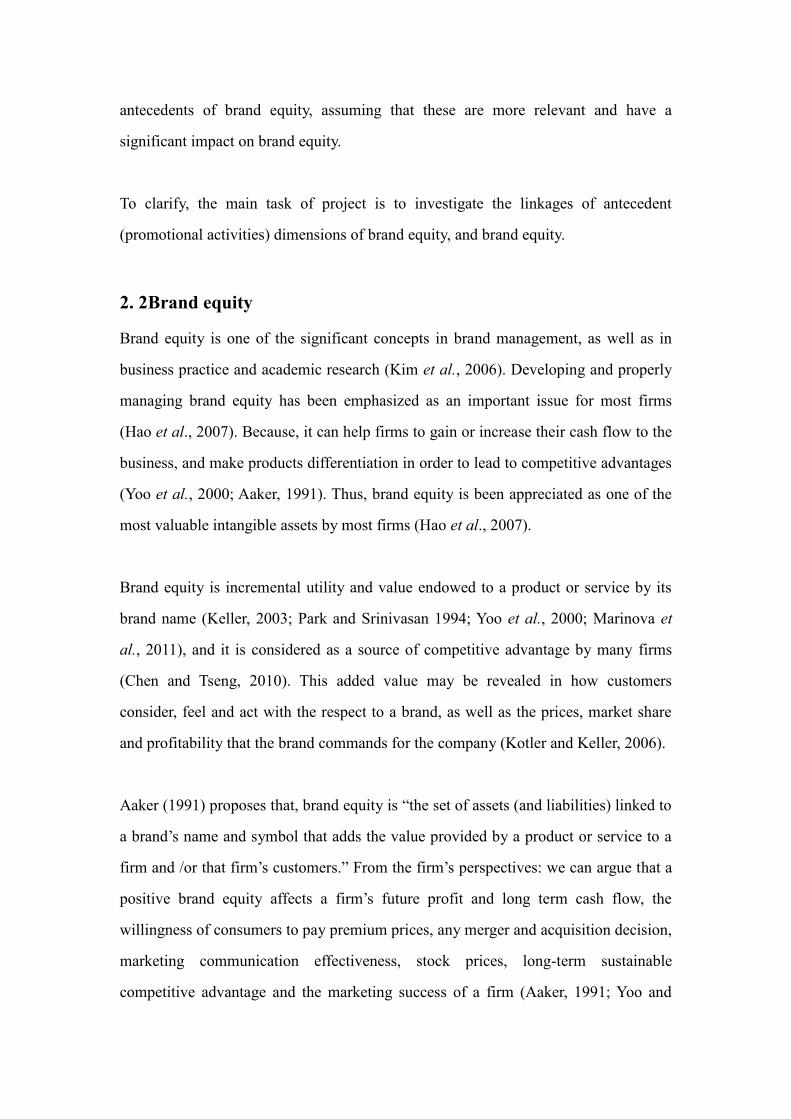
2.1 Conceptual framework
This project aims to investigate the relationship between brand equity and
promotional activities using of the dimensions of brand equity. Figure 1, illustrates the
conceptual framework of brand equity, which extends Aaker‟s (1991) model by
integrating Yoo et al.‟s (2000) framework.
Table 1: Conceptual framework of this research
According to Aaker‟s (1991) definition: (a) brand equity creates value for both the
customer and the company, (b) value for the customer increases the value for the firm,
(c) brand equity involves of multiple dimensions. We extend our conceptual
framework in two ways. Firstly, we are setting brand equity in separate constructs:
brand equity, between the dimensions of brand equity and the value for the customers
and the firm. The construct of brand equity reveals how individual dimensions are
related to brand equity; hence, by setting separate constructs, are can clearly
comprehend each construct‟s contribution to brand equity (Yoo et al., 2000). This
extension has been addressed in previous studies i.e., Yoo et al., (2000) and Marinova
et al., (2011). Secondly, we modify Yoo et al.‟s (2000) framework that applies
promotional activities instead of marketing efforts (Marketing mix model) as
Dimensions of
brand equity
Brand equity Promotional
activities
antecedents of brand equity, assuming that these are more relevant and have a
significant impact on brand equity.
To clarify, the main task of project is to investigate the linkages of antecedent
(promotional activities) dimensions of brand equity, and brand equity.
2. 2Brand equity
Brand equity is one of the significant concepts in brand management, as well as in
business practice and academic research (Kim et al., 2006). Developing and properly
managing brand equity has been emphasized as an important issue for most firms
(Hao et al., 2007). Because, it can help firms to gain or increase their cash flow to the
business, and make products differentiation in order to lead to competitive advantages
(Yoo et al., 2000; Aaker, 1991). Thus, brand equity is been appreciated as one of the
most valuable intangible assets by most firms (Hao et al., 2007).
Brand equity is incremental utility and value endowed to a product or service by its
brand name (Keller, 2003; Park and Srinivasan 1994; Yoo et al., 2000; Marinova et
al., 2011), and it is considered as a source of competitive advantage by many firms
(Chen and Tseng, 2010). This added value may be revealed in how customers
consider, feel and act with the respect to a brand, as well as the prices, market share
and profitability that the brand commands for the company (Kotler and Keller, 2006).
Aaker (1991) proposes that, brand equity is “the set of assets (and liabilities) linked to
a brand‟s name and symbol that adds the value provided by a product or service to a
firm and /or that firm‟s customers.” From the firm‟s perspectives: we can argue that a
positive brand equity affects a firm‟s future profit and long term cash flow, the
willingness of consumers to pay premium prices, any merger and acquisition decision,
marketing communication effectiveness, stock prices, long-term sustainable
competitive advantage and the marketing success of a firm (Aaker, 1991; Yoo and
Donthu, 2001; Chen and Tseng, 2010). However, from customers‟ point of view: a
strong brand can enhance customers‟ trust in purchasing a product as well as enable
customers to better imagine and comprehend intangible products (Chen and Tseng,
2010). In summary, brand equity not only creates value for the firm, but also creates
value for the customers. (Aaker, 1991)
2.3 Customer-based brand equity
Marketers and researchers apply different approaches to investigate brand equity
(Kotler and Keller, 2006). These various approaches can be classified into three main
perspectives i.e., customers-based perspective, financial perspective and combined
perspective (Keller, 1993).
The customers-based brand equity is a study of brand equity from the customers‟
perspective (Xu and Chan, 2010), and it can be described as different brand
knowledge such as customers association, familiarity, which are affect customer‟
reaction to the marketing of a brand (Keller, 1993; Tong and Hawley, 2009).
Customer-based brand equity occurs when customers are familiar with a brand and
hold some brand associations in their memory such as favorable, strong and unique
(Wang et al., 2008).
However, the financial brand equity has a “focus on the financial value of brand equity
from a company‟s point of view” (Yoo, 1996). Chen and Tseng (2010) further explain
that the financial perspective is based on “the incremental discounted future cash
flows that result from a branded product‟s revenue over the revenue of an unbranded
product”. This perspective aims to analyses sales income, market share and premium,
as well as firm‟s value, hence, is also can be considered as the perspective of an
enterprise (Li et al., 2011).
Moreover, the combined brand equity integrates both customer-based and financial
brand equity. Customers-based brand equity plays an important role for the successful
brand management of a firm. Positive customers-based brand equity can “lead to
greater revenue, lower cost and higher profit” (Keller, 1993 cf. Tong and Hawley,
2009). Therefore, in this research, customers-based brand equity will be explored and
applied for investigation.
2.4 The relationship between brand equity and brand equity
dimensions
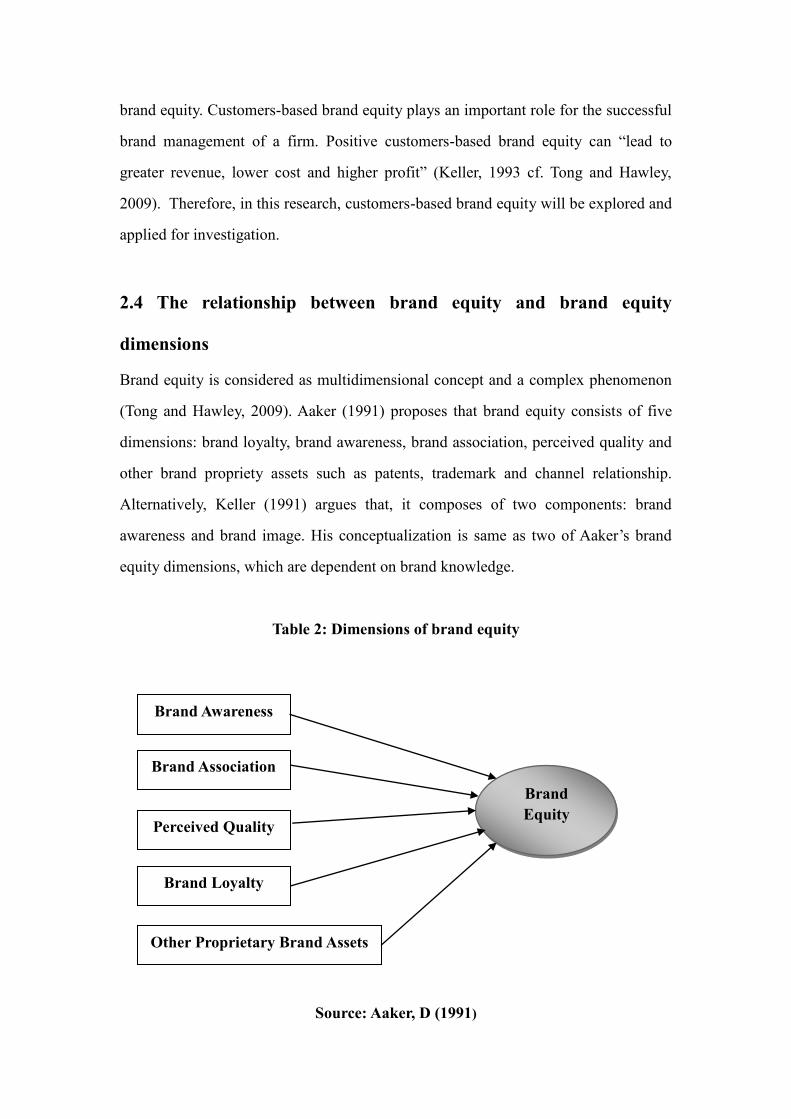
Brand equity is considered as multidimensional concept and a complex phenomenon
(Tong and Hawley, 2009). Aaker (1991) proposes that brand equity consists of five
dimensions: brand loyalty, brand awareness, brand association, perceived quality and
other brand propriety assets such as patents, trademark and channel relationship.
Alternatively, Keller (1991) argues that, it composes of two components: brand
awareness and brand image. His conceptualization is same as two of Aaker‟s brand
equity dimensions, which are dependent on brand knowledge.
Table 2: Dimensions of brand equity
Source: Aaker, D (1991)
Other Proprietary Brand Assets
Brand
Equity
Brand Awareness
Brand Association
Perceived Quality
Brand Loyalty
Considering the above given definitions, we believe that brand awareness, brand
association, perceived quality and brand loyalty as common dimensions of brand
equity, which perspective has been adopted by other researchers (Tong and Hawley,
2009; Yoo et al., 2000; Chen and Tseng, 2010; Erenkol and Duygun, 2010). Positive
brand equity implies that customers have a lot of positive and strong associations
relate to the brand, high quality perception and can lead to brand loyalty (Yoo et al.,
2000). Hence, this study will adopt Aaker‟s (1991) model.
2.4.1 Brand awareness
Brand awareness is the first and fundamental attribute of customer brand equity; and
sometimes it is underestimated component of brand equity (Aaker, 1991; Aaker, 1986;
Tong and Hawley, 2009). Brand awareness is defined as “the ability of a buyer to
recognize or re call that brand is a member of certain product category” (Aaker,
1991). Keller (1993) found that it composes of both brand recall and recognition. He
further (Keller 1993, p3) explains that brand recognition “relates to consumer‟ ability
to confirm the prior exposure to the brand when given the brand as a cue”. However,
brand recall is “related to consumer‟ ability to retrieve the brand when given the
product category, the needs fulfilled by the category, or some other type of probe as a
cue”. (Keller, 1993, p3) For a new or niche brand, the important issue is recognition;
on the other hand, for a well-known brand, recall and top-of–mind is more sensitive
and significant (Aaker, 1986).
Beside, brand awareness affects customers to make their decision, particularly for
low-involvement packaged goods and strengthens brand performance in the market
(Huang and Sarigöllü, 2011). Hence, marketers should concentrate on brand
management and appropriate tactics to build and maintain customers‟ brand
awareness by enhancing connection between a product and its customers, so as to
influence customer brand selection (Wang et al., 2008; Xu and Chen, 2010).
In summary, “brand awareness precedes building brand equity” in the consumer mind
set (Huang and Sarigöllü, 2011); it affects customers‟ perception and attitudes, as well
as it influences customer‟s brand choice and brand loyalty (Aaker, 1986). Based on
this, the following hypothesis is formulated:
H1a. Brand awareness has a significant positive effect on consumer-based brand
equity (brand equity).
2.4.2 Brand association
Brand association is another important component of brand equity. It is described as
“anything linked in memory to a brand” and brand image is as seen as “a set of
associations, usually related in some meaningful way” (Aaker, 1991). Keller (1993)
defined brand associations as “impressions based on other information that is related
to impressions created by the brand in the minds of consumers and that include the
brand„s meaning for the consumers”. Based on prior research, Xu and Chen (2010)
found that the related association (impression) link could be a product, country of
origin, firm, competitor, seller, or users with particular demographic or lifestyle
characteristic. However, the association to a brand might be stronger when it is based
on numerous experiences or exposure to communications, rather than few (Aaker,
1991; Marinova et al., 2011).
Erenkol and Duygun (2010) propose that brand associations help communicators to
easier deliver an idea of a product or service to consumers or communicate thoughts
related to the brand, but also provide brand differentiation and positioning.
Furthermore, brand association creates value for the firm as well as for its customers
by assisting to process information, distinguishes the brand, creates positive attitudes
and feeling, provides a reason to purchase a brand and forms the basis for brand
extensions (Aaker, 1991; Tong and Hawley, 2009).
Brand association, which is the outcome of high brand awareness, is positively relate
to brand equity, since it is viewed as “a sign of quality and commitment”, leading
customers to familiarizes purchasers with a brand, as well as “helping them consider it
at the point of purchase” (Aaker, 1991; Tong and Hawley, 2009; Marinova et al.,
2011; Yoo et al., 2000). Building positive brand associations may lead to the
formation of a positive brand image, which is a conceptual antecedent to enhanced
brand equity (Aaker, 1991; Faircloth et al., 2001).Thus, the flowing hypothesis is
posited:
H1b. Brand association has a significant positive effect on consumer-based brand
equity (brand equity).
2.4.3 Perceived quality
Perceived quality is one of the main dimensions of brand equity; it is “the core
construct” in the study to measuring brand equity (Aaker, 1996). Perceived quality is
defined as “the consumer‟s subjective judgment about a product‟s overall excellence
or superiority” (Zeithaml, 1988). That is, perceived quality is not the real quality of
product, but the consumer‟s subjective assessment of that product (Zeithaml, 1988;
Erenkol and Duygun, 2010). “Personal product experience, unique needs, and
consumption situation” can be affecting the consumer‟s subjective evaluation of
quality (Yoo et al., 2000).
Aaker (Aaker, 1991 cf. Erenkol and Duygun, 2010) points out the values that
perceived quality provides for the firms, which include:
“- Establishing reasons for purchase for the customers.
- Differentiating the brand from competitive brands and positing the brand.
- Making it possible to change high prices
- Attracting the interest of distribution channel member
- Making it possible for the brand to grow.” (p. 97)
In summary, perceived quality is a component of brand value, which leading
consumers to select a particular brand rather than another competing brand (Yoo et
al., 2000). Hence, we believe that high perceived quality will increase brand equity,
and the following hypothesis is proposed:
H1c. Perceived quality has a significant positive effect on consumer-based brand
equity (brand equity).
2.4.4 Brand loyalty
Aaker (1991) states that, brand loyalty is “a measure of the attachment that a customer
has to a brand” (p. 91). Subsequently, Oliver (1979) explains brand equity as “a
deeply held commitment to rebury or re-patronize a preferred product or service
consistently in the future, deposit situation influences and marketing efforts having
the potential to cause switching behavior” (p. 392) Thus, brand loyalty is believed to
be the most important brand equity dimension, which results in above three given
brand equity dimensions-i.e. brand awareness, brand association and perceived quality
(Tong and Hawley, 2009).
Consequently, brand loyalty is different from other brand equity dimensions, because
it is associated with usage experience (Aaker, 1991) Moreover, brand loyalty reduces
uncertainty as well as saves costs of seeking new relational exchanges with other
brand (Erenkol and Duygun, 2010). Brand loyalty makes consumers buy a brand
routinely and resist switching to other competing brand (Yoo et al., 2000).
As a result, (brand) loyalty is a concept that firms emphasize, since it may create or
sustain a customers' patronage over the long-term (Marshall, 2010), thereby increase
brand equity. Based on this definition and argument, the following hypothesis is
formulated:
H1d. Brand loyalty has a significant positive effect on consumer-based brand equity
(brand equity).
2.5 Effects of promotional activities on brand equity dimensions
Brand equity is seen as the outcome of long term marketing efforts operated to build a
sustainable, differential advantage relative to competitors (Doyle, 1990 cf. Yoo,
1996). Yoo (1996) suggests, any marketing actions will affect on customers‟ brand
knowledge e.g., psychological perception, which is result in a positive or negative
impact on brand equity. Moreover, According to Keller (1993, P.8) “a brand is said to
have a positive (negative) customer-based brand equity if consumers react more or
less favorably to the product, price, promotion, or distribution of the brand than they
do to same marketing mix element when it is attributed to a fictitiously names or
unnamed version of the product or service‟‟
Thus, this study will select the following 6 promotional activities which can affect on
the perceptions of consumers as well as brand equity; they are (figure 3): advertising,
world of mouth, celebrity endorsement, sales promotion, store image, and event
sponsorship. These selected activities are represented as the most popular marketing
activities that marketers apply frequently in China when marketing products and
services.
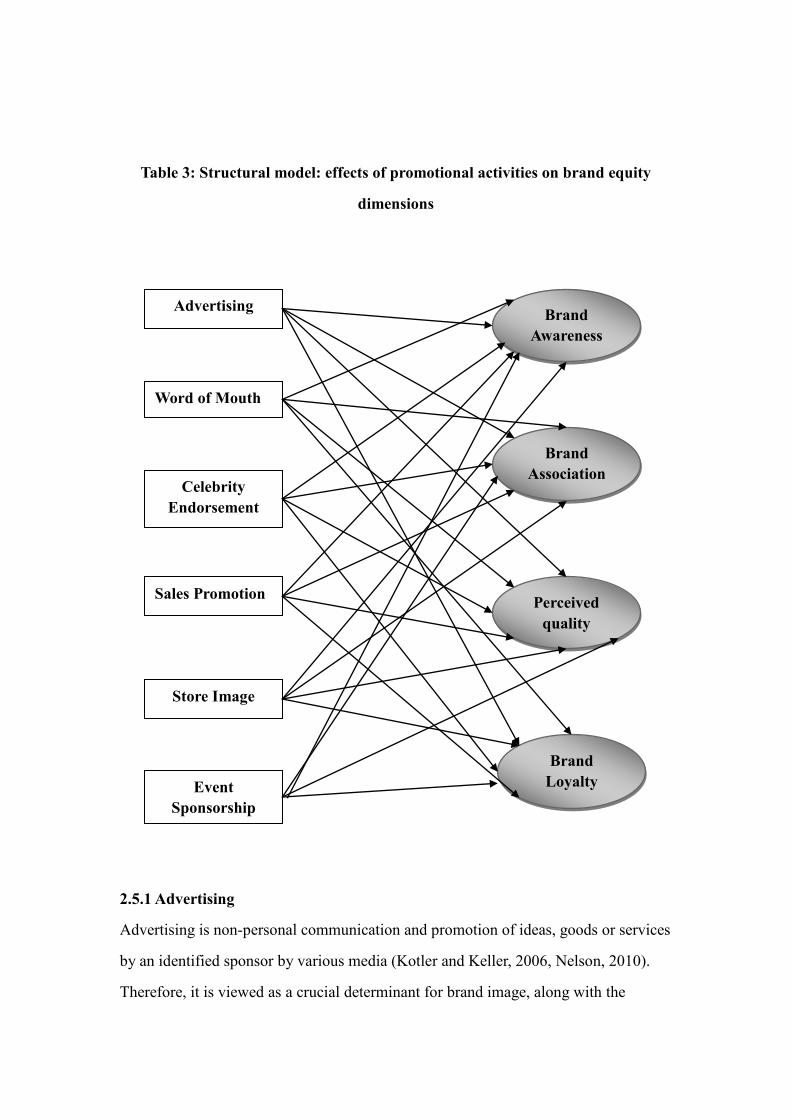
Table 3: Structural model: effects of promotional activities on brand equity
dimensions
2.5.1 Advertising
Advertising is non-personal communication and promotion of ideas, goods or services
by an identified sponsor by various media (Kotler and Keller, 2006, Nelson, 2010).
Therefore, it is viewed as a crucial determinant for brand image, along with the
Brand
Awareness
Brand
Association
Perceived
quality
Brand
Loyalty
Advertising
Word of Mouth
Celebrity
Endorsement
Sales Promotion
Store Image
Event
Sponsorship
physical characteristics of the brand, the price charged and the satisfaction that is
derived from the brand” (Nelson, 2010).
Advertising can create long-term brand image for a product (service) or trigger quick
sales (Kotler and Keller, 2006). Consequently, based on past research (Aaker, 1991;
Batra et al., 1995; Keller, 1993; Rossiter and Percy, 1987; Yoo et al., 2000;
Krishnan and Chakravarti, 1993; Huang and Sarigöllü, 2011), it can argue that,
advertising can create and increase brand awareness by exposing brands to customers,
as well as it strengthen the brand's likelihood of being included in consumers' mind
set, thereby enhancing the market performance of a brand.
Aaker (1991) proposes that, brand equity is the long-term outcome of advertising
spending rather than sales promotion. Brand‟s advertising exposes product to
consumers more frequently, and thus can develop their high or positive brand
awareness and stronger association, but also their perception of high brand quality
(Tong and Hawley 2009; Yoo et al., 2000; Cobb-Walgren et al., 1995). Advertising is
also can create strong brands and make unshakeable consumer loyalty to the brand
(White, 2000 cf. Nelson, 2010). Yoo (1996) summarizes this by arguing that,
advertising expenditure has positive effects on all elements of the brand knowledge
such as, brand awareness, perceived quality, strong association, brand loyalty and
brand equity. Thus, we hypothesize that:
H2a. Advertising has a significant positive effect on brand awareness.
H2b. Advertising has a significant positive effect on brand association
H2c. Advertising has a significant positive effect on perceived quality
H2d. Advertising has a significant positive effect on brand loyalty
2.5.2 Word of Mouth
Word of mouth (WoM) is argued to be an informal tool of communication between
private parties in which evaluation of a product or service takes place (Mazzarol et al.,
2007; Lim and Chung, 2011). Compared with other promotional activities, WoM is a
low-cost and reliable way of spreading information or experiences regarding products
or services, thus it is believed as a key issue in information or experience diffusion in
consumer markets as well as shaping consumer‟s expectation (Lim and Chung, 2011).
WoM is different from traditional marketing communication, because it is initiated by
loyal customers who are committed to a brand or shared information or experiences in
order to help others to make brand selection (Xu and Chan, 2010). WoM is a
transmitting tool, which has a greater influence than other marketing activities such as
print advertising, personal selling and radio advertising. (De Bruyn and Lilien, 2008).
Xu and Chan (2010) believe that WoM is more trustworthy, since it is not “perceived
as marketing”, and “the information from relevant others (such as friends and
relatives) is taken as evidence of reality, supporting or adding to what the consumers
already believe the about some salient aspects of product and service” (Lim and
Chung, 2011).
However, WoM in general has both positive and negative assessment on product or
service perception (Lim and Chung, 2011). Positive WoM increases probabilities of
purchasing, whereas negative WoM causes the dissemination of complaints, and has a
damaging effect (Xu and Chan, 2010). Positive WoM affects the evaluation of a brand
product (Xu and Chan, 2010), and it implies that customers have favorable and clear
brand awareness of a product, strong association, a high quality perception, and are
loyal to it. Thus, it can be hypothesized that:
H3a. Word of Mouth has a significant positive effect on brand awareness.
H3b. Word of Mouth has a significant positive effect on brand association
H3c. Word of Mouth has a significant positive effect on perceived quality
H3d. Word of Mouth has a significant positive effect on brand loyalty
2.5.3 Celebrity endorsement
Celebrity endorsement is a common communication tool in nowadays marketing
(O‟Mahony and Meenaghan, 1997/1998). McCracken (1989) defines celebrity
endorser as “any individual who enjoys public recognition and who uses this
recognition on behalf of a consumer good by appearing with it in an advertisement”.
To date, firms invest large amounts of money to align themselves and their products
with famous celebrities in the belief that they will draw attention to the endorsed
products or services, and transfer image values to these products or services by virtue
of their celebrity profile and engaging attributes. (O‟Mahony and Meenaghan,
1997/1998)
Firms invite a celebrity to endorse their brand; they expect the brand will be acquired
from customer‟s awareness of a celebrity, which could include perceived quality,
educational value and a positive image (Tong and Hawley, 2009). .
In particular, Chinese people tend to adopt reference groups as influencer, e.g. sports
or pop music celebrities, which have a favorable effect on customers‟ attitudes and
behavior (Hchu and Yang, 1972 cf. Tong and Hawley, 2009). Hence, we hypothesize
that:
H4a. Celebrity endorsement has a significant positive effect on brand awareness.
H4b. Celebrity endorsement has a significant positive effect on brand association
H4c. Celebrity endorsement has a significant positive effect on perceived quality
H4d. Celebrity endorsement has a significant positive effect on brand loyalty
2.5.4 Sales promotion (price and non-price)
Sales promotion is seen as temporary incentives to encourage the trial or use of a
product or service (Tong and Hawley 2009; Delvecchio et al., 2006). It includes short-
term price reduction, premium (free gift with purchase), coupons package, cents-off
and price deal and refunds, that firms have utilized frequently in order to make a
stronger and quicker buyers response (Kotler and Keller, 2006; Shih, 2010).
Kotler and Keller (2006) outline three benefits of sales promotion tools: “(1) gain
attention and lead the consumer to the product (Communication); (2) incorporate
some concession, inducement, or contribution that gives value to the consumer
(incentive); (3) they include a distinct invitation to engage in the transaction now
(invitation).”
Sales promotion in general can be classified into two types, as such: price promotion
and non-price promotion (Tong and Hawley, 2009). Price promotion can gain
attention and obtain short-term finacial profit (Yoo et al. 2000). Many scholars (Yoo
et al. 2000; Delvecchio et al., 2006; Shih, 2010) agree with that, price promotion may
have a negative influence on brand‟s quality and image, because, from the long-term,
price reductions reflect as low quality brand image to the consumers(Yoo et al. 2000).
However, Chinese people are different from Westerner, they are more price-conscious
and less brand sophisticated, and they enjoy price promotion, such as beginning and
end-of-season sales promotion (Schmitt et al., 1994 cf. Tong and Hawley, 2009).
Compare with price promotion, non-price promotion (such as premium, coupons
package and etc.) can enhance brand image in the long-term, as well as strengthens
brand relationship with customers (Tong and Hawley, 2009). Non-price promotion
can “bring some computable economic saving” as well as add value of “excitement
and immeasurable” to a brand (Tong and Hawley, 2009). Hence, in the context of
China, we argue that, both price promotion and non-price promotion will have a
positive effect on the dimension of brand equity:
H5a. Sales promotion has a significant positive effect on brand awareness.
H5b. Sales promotion has a significant positive effect on brand association
H5c. Sales promotion has a significant positive effect on perceived quality
H5d. Sales promotion has a significant positive effect on brand loyalty
2.5.5 Store image
Store image refers to the way in which the store “is perceived by shoppers and
defined in shoppers‟ mind”, and is part of a retailer‟s personality (Martineau, 1958;
Cornelius et al., 2010). Bloemer and De Ruyter, (1997) define store image as a
combination of consumers‟ perceptions of a store on different characteristics or
attributes. Cornelius et al. (2010) believe that store image is the basis of consumers‟
objective and subjective perceptions learned over time. “High quality or high
reputation stores will result in high brand loyalty and high brand awareness by
signaling high quality brands and stimulating word-of-mouth communication” (Yoo,
1996 p49).
Store image may indirectly influence brand equity, since it effects product
associations on the basis of the association related to the retail store in consumers‟
mind (Keller 2002). Store image has significant positive effects on perceived quality;
a favorable store image can attract more attention, contacts and potential customer
visits (Shih, 2010, Yoo, 1996). Thus, a brand through a good image store will build
favorable brand awareness, brand association, high quality perception than a store
with bad image. Hence, we hypothesize that:
H6a. Store image has a significant positive effect on brand awareness.
H6b. Store image has a significant positive effect on brand association
H6c. Store image has a significant positive effect on perceived quality
H6d. Store image has a significant positive effect on brand loyalty
2.5.6 Event sponsorship
To date, corporate sponsorship is considered an increasingly visible instrument in the
marketing communication mix (Javalgi et al., 1994). Event sponsorship, which is
includes sports, music, and cultural events, has become an effective communication
tool for building or enhancing brand awareness, brand image, corporate image, and
directly stimulating products‟ sales, it also can inspire customers‟ loyalty (Javalgi et
al., 1994; Henseler et al., 2011; Tong and Hawley, 2009).
Based on research of International Events Group (2011), Henseler et al., (2011)
indicate that, “68% of sponsorship money is invested in sport”. Hence, sport
sponsorship is viewed a most popular device for the management of brand image,
brand personality, and other brand equity dimensions (Henseler et al., 2011).
Particularly, in China, event sponsorship is viewed as among the most important
marketing activities. Music and sport events are considered as the most effective
promotional activities in building and enhancing favorable link between consumers
and brand image (Tong and Hawley, 2009). Based on this, we formulate the following
hypothesis:
H7a. Event sponsorship has a significant positive effect on brand awareness.
H7b. Event sponsorship has a significant positive effect on brand association
H7c. Event sponsorship has a significant positive effect on perceived quality
H7d. Event sponsorship has a significant positive effect on brand loyalty
2.6 Summary of literature review
Brand equity is one of the significant concepts in brand management, as well as in
business practice and academic research. Developing and properly managing brand
equity has been emphasized as an important issue for most firms. Brand equity can be
classified into three main perspectives i.e., customers-based perspective, financial
perspective and combined perspective
Moreover, brand equity is considered as multidimensional concept and a complex
phenomenon. According to Aaker (1991) that, brand equity consist of five
dimensions: brand loyalty, brand awareness, brand association, perceived quality and
other brand propriety assets. Brand awareness is defined as “the ability of a buyer to
recognize or re call that brand is a member of certain product category”, and it is
considered as the first and fundamental attribute of customer brand equity. Beside,
Brand association is described as “anything linked in memory to a brand” and brand
image is as seen as “a set of associations, usually related in some meaningful way”, it
is the outcome of high brand awareness, is positively relate to brand equity.
Subsequently, perceived quality is not the real quality of product, but the consumer‟s
subjective assessment of that product; it is “the core construct” in the study to
measuring brand equity. However, brand loyalty is different from other brand equity
dimensions, because it is associated with usage experience, as well as it results in
three given brand equity dimensions-i.e. brand awareness, brand association and
perceived quality. Brand loyalty is a concept that firms emphasize, since it may create
or sustain a customers' patronage over the long-term, thereby increase brand equity.
Brand equity is seen as the outcome of long term marketing efforts operated to build a
sustainable, differential advantage relative to competitors, any marketing actions will
affect on customers‟ brand knowledge.
Advertising is the most popular marketing activities, it can create long-term brand
image for a product (service) or trigger quick sales, as well as it may positive effects
on all elements of the brand knowledge. Compared with others, Compared with other
promotional activities, Word of mouth is a low-cost and reliable way of spreading
information or experiences regarding products or services thus it is believed as a key
issue in information or experience diffusion in consumer markets as well as shaping
consumer‟s expectation. Further, firms invite a celebrity to endorse their brand; they
expect the brand will be acquired from customer‟s awareness of a celebrity, which
could include perceived quality, educational value and a positive image. However,
Sales promotion is seen as temporary incentives to encourage the trial or use of a
product or service that firms have utilized frequently in order to make a stronger and
quicker buyers‟ response. In the context of China, both price promotion and non-price
promotion are considered as have a positive effect on the dimension of brand equity.
Consequently, a brand through a good image store will build favorable brand
awareness, brand association, high quality perception than a store with bad image.
In China, event sponsorship is viewed as among the most important marketing
activities, it has become an effective communication tool for building or enhancing
brand awareness, brand image, corporate image, and directly stimulating products‟
sales, it also can inspire customers‟ loyalty.
3. Methodology
3.1 Methodological approach for creating business knowledge
In the area of business study, there are many different methodological approaches
(such as Arbnor and Bjerke1, Burrell and Morgan
2) that have been created by business
researchers. Burrell and Morgan (1979) and Arbnor and Bjerke (1997) employ
different viewpoints from which they create their paradigmatic assumptions.
According to Burrell and Morgan (1979), there are four philosophical assumptions
which present different ways for study e.g., ontology, epistemology, human nature and
methodology. Meanwhile, Arbnor and Bjerk (1997) explore other four as such,
conception of reality, and conception of science, scientific ideals, ethical and
esthetical aspects.
Arbnor and Bjerke develop their assumptions based on philosophy; and they suggest
the knowledge is root from people‟s education. However, Burrell and Morgan`s
assumptions is roots in philosophy and social studies, and the knowledge is achieved
from observation and participation.
In this project, the approach of methodology will be based on Arbnor and Bjerk‟s
business research methodology. According to Arbnor and Bjerk a methodological
approach “has a double relation in that it encompasses certain ultimate presumptions
at the same time that it provides the framework for a more concrete approach, that is,
the framework for the development of the operative paradigm”. Besides, they further
motioned that a paradigm as a bridge between ultimate presumptions assumptions and
the methodological approach, as well as the operative paradigm are connect the
methodological approach with the study area and they are related with the ultimate
1 Arbnor, I and Bjerke, B., (1997) Methodology for creating business knowledge. Sage Publications, 2nd ed.
2 Burrell, G. and Morgan, G., (1979) Sociological Paradigms and Organisational Analysis: elements of the
sociology of corporate life, London: Heinemann.
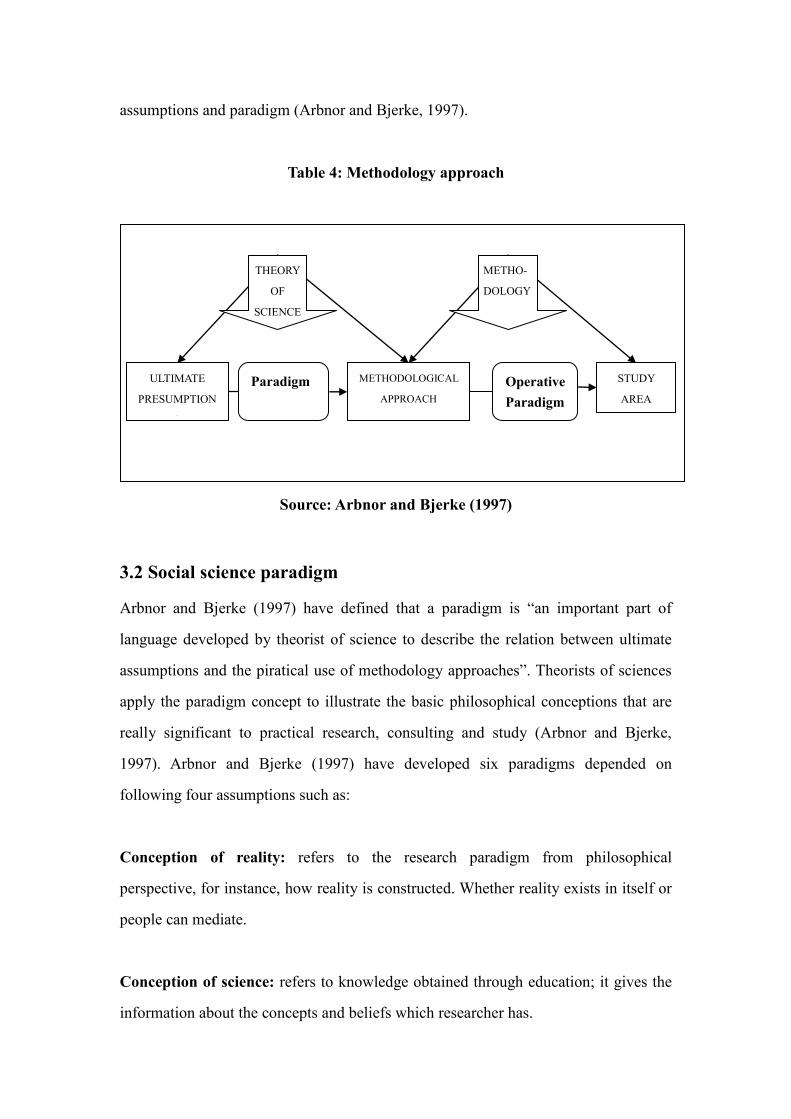
assumptions and paradigm (Arbnor and Bjerke, 1997).
Table 4: Methodology approach
Source: Arbnor and Bjerke (1997)
3.2 Social science paradigm
Arbnor and Bjerke (1997) have defined that a paradigm is “an important part of
language developed by theorist of science to describe the relation between ultimate
assumptions and the piratical use of methodology approaches”. Theorists of sciences
apply the paradigm concept to illustrate the basic philosophical conceptions that are
really significant to practical research, consulting and study (Arbnor and Bjerke,
1997). Arbnor and Bjerke (1997) have developed six paradigms depended on
following four assumptions such as:
Conception of reality: refers to the research paradigm from philosophical
perspective, for instance, how reality is constructed. Whether reality exists in itself or
people can mediate.
Conception of science: refers to knowledge obtained through education; it gives the
information about the concepts and beliefs which researcher has.
ULTIMATE
PRESUMPTION
S
METHODOLOGICAL
APPROACH
STUDY
AREA
THEORY
OF
SCIENCE
METHO-
DOLOGY
Paradigm Operative
Paradigm
Scientific ideals: refers to the desires of the researchers, the achievement of
researchers.
Ethical and aesthetical aspects: refers to a researcher claim is morally suitable or
not, beautiful or not and so on.
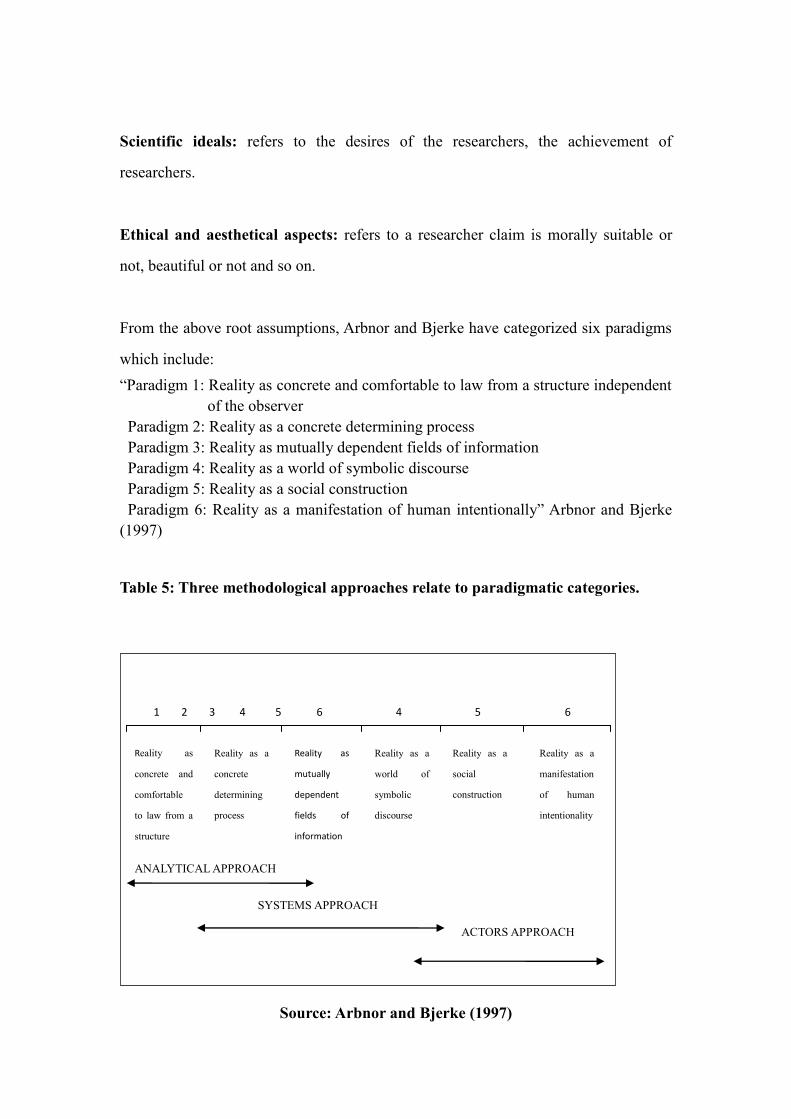
From the above root assumptions, Arbnor and Bjerke have categorized six paradigms
which include:
“Paradigm 1: Reality as concrete and comfortable to law from a structure independent
of the observer
Paradigm 2: Reality as a concrete determining process
Paradigm 3: Reality as mutually dependent fields of information
Paradigm 4: Reality as a world of symbolic discourse
Paradigm 5: Reality as a social construction
Paradigm 6: Reality as a manifestation of human intentionally” Arbnor and Bjerke
(1997)
Table 5: Three methodological approaches relate to paradigmatic categories.
Source: Arbnor and Bjerke (1997)
Reality as
concrete and
comfortable
to law from a
structure
independent
of the
observer
Reality as a
concrete
determining
process
Reality as
mutually
dependent
fields of
information
Reality as a
world of
symbolic
discourse
Reality as a
social
construction
Reality as a
manifestation
of human
intentionality
1 2 3 4 5 6 4 5 6
ANALYTICAL APPROACH
SYSTEMS APPROACH
ACTORS APPROACH
3.3 Assumption of this project
Conception of reality:
As introduction has noted, rapidly economy growth, rising incomes and a huge
population, China is recognized as one of the most attractive consumer markets in the
world. As well as growth interest in sport among its consumers, the sportswear
marketing is fast promising.
However, the competition of sportswear market is fierily due to numerous brands
vying for consumer attention. Under this circumstance, the sportswear brand
marketers (companies) require to employ an appropriate marketing strategy in order
to develop their future business‟s growth and profit. Hence, brand equity is believed
as a one of important concepts in marketing area that many brand marketers or
managers are often applied.
Marketing scholars have been studying extensively marketing strategy, particularly
brand management for many years; they suggest that brand equity is most the
essential issue for the marketing strategy. Today, many sportswear brand (marketers)
companies have aware the importance of developing the brand equity since it can help
them to gain competitive advantage and make management decision.
Thus, we believes that reality as “concrete and comfortable to law from a structure
independent of the observer” in this project. The reality as “consumer based brand
equity)” is considered as independent of observer, it can be viewed as an external and
objective phenomenon that can be measured and observed. That is, brand equity
dimensions and its promotional activities effect on create consumers based brand
equity is seem as a reality that will be measured by quantitative method through
structured questionnaire survey.
Conception of science:
The purpose of this project aims to examine the factors effects on creating consumers
based brand equity theoretically and empirically. As well as this paper aims to
understand that brand equity is an important concept in marketing field that affects
developing business, since it can gain the competitive advantage and so on. Hence,
the knowledge is based on prior scholars‟ study and academic materials; by building
up a conceptual model, it can be deeply understand and comprehend the relationship
between brand equity and its dimensions.
Scientific ideal:
This project aims at study the consumer based brand equity from the objective point
of view. Based on author‟s many years‟ college study and academic knowledge, this
project start with a literature review to discuss and explain consumer based brand
equity theoretically.
Moreover, this project will adopt quantitative method as empirical study to explain the
chosen subject. The mainly quantitative method is including questionnaire survey and
statistics procedure (SPSS) such as descriptive analysis, factor analysis and regression
analysis to measuring the relationship between brand equity and its dimensions.
Ethical and aesthetical aspect:
The finding and implication of this research will help sportswear brand companies or
marketers for corporate strategy in order to for creating successful consumer based
brand equity in Chinese market.
Deposit the statistic procedure is abstract and difficult, and it is a big challenge to the
author, however, is still interesting to investigate in this project. Especially, the skill of
SPSS (statistical package for the social sciences) will give author a very helpful
advantage in future career.
3. 4 Three methodological approaches
Arbnor and Bjerke (1997) state that in social science, there are three methodological
approaches for creating knowledge as such: Analytical approach, Systems approach
and Actors approach.
Analytical approach
Analytical approach is the oldest of three methodological approaches, and it origins in
classic analytical philosophy. The knowledge developed through the analytical
approach depends on the independence of observer, is based formal logic that is
represented by specific judgments that are independent of individual subjective
experiences. However, these judgments can be verified and falsified hypotheses
(Arbnor and Bjerke, 1997). Analytical approach assumes reality is objective. Beside,
its assumption about the quality of reality is that reality has a “summative character”;
as such, “the whole is the sum of its parts”. Once a researcher gets to know the
different parts of the whole, the parts can be added together to get the total picture.
(Arbnor and Bjerke, 1997)
The Systems Approach
Today, the system thinking has been perceived is the main point of view in business
area, and it is very frequent in business to attempt a rather holistic approach to
problems. The systems approach views reality is objectively accessible which is
different from the perspective of the analytical approach‟s assumption, and the reality
is considered that “the whole differ from the sum of its parts” (Arbnor and Bjerke,
1997). The knowledge development of systems approach is based on systems
principle. The individual parts will be explained and (sometimes) understood
regarding systems characteristics. That is, systems approach explains and understands
parts “through the characteristics of the whole” (Arbnor and Bjerke, 1997).
The Actors Approach

The actors approach, however, is completely different from the analytical approach
since assumes that reality is a social construction (subjective). The actor approach
seen reality as “the whole is understood by the characteristics of its parts”. The
knowledge of this approach is according to individuals, the whole is understood
through actors‟ finite provinces meaning. “Actors approach is not interested in
explanations, but rather it is interested understanding social wholes” and “it directed
at reproducing the meanings that various actors associate with their acts and the
surrounding context” (Arbnor and Bjerke, 1997).
Approach of this project
As stated above, the reality of this project is indentified as objective. The reality is
recognized as concrete and comfortable to law from a structure independent of the
observer; therefore, the analytical approach will be considered the most appropriate
approach for this study.
According to the analytical approach characteristics, it depends on the independence
of observer. Based on the individual parts i.e., dimensions of brand equity (brand
awareness, brand association, perceived quality and brand loyalty) and promotional
activities (advertising, word of mouth, celebrity endorsement, sales promotion, store
image and event sponsorship), the “whole picture” as consumer based brand equity
will be summarized. Furthermore, by using analytical approach, it also can help for
verify and falsify our given hypotheses.
3.5 Research design
A research design is a framework for conducting a marketing research project. It
specifies the details of the procedures necessary for obtain the information needed to
structure or solve marketing research problems. A good research design not only lays
the foundation conducting project, but also will ensure the marketing research project
is conducting effectively and efficiently (Malhotra and Birks, 2006). Otherwise,
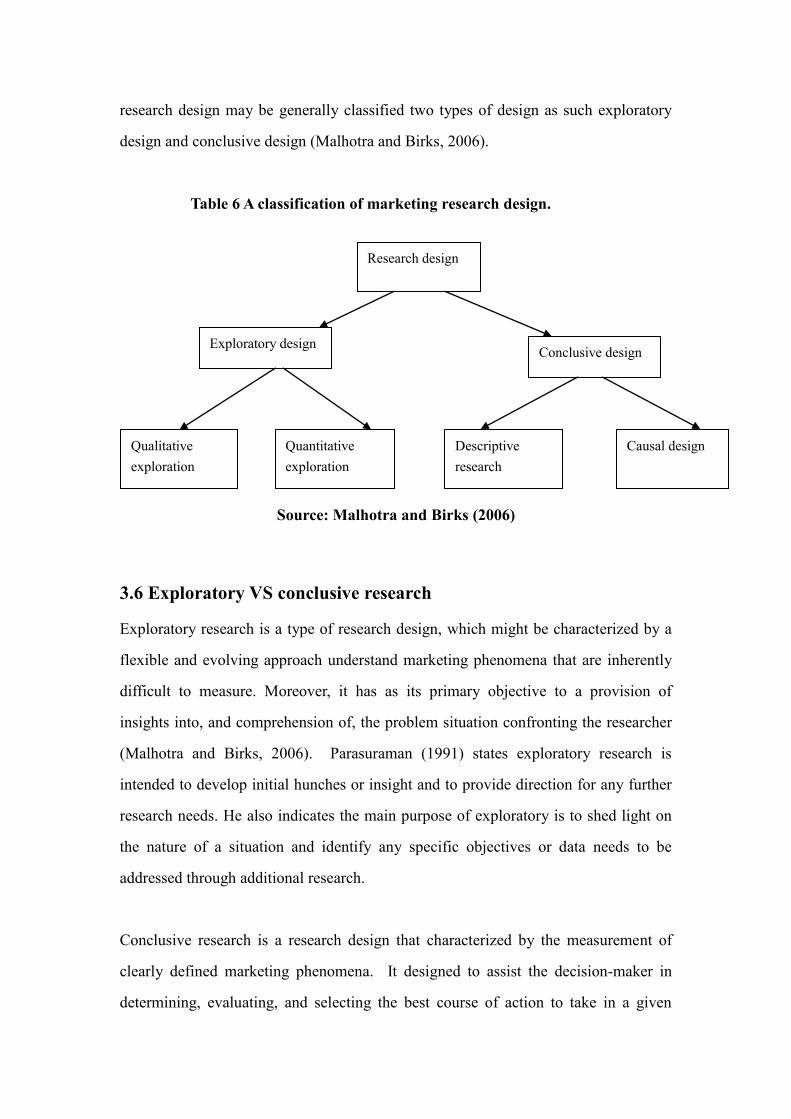
research design may be generally classified two types of design as such exploratory
design and conclusive design (Malhotra and Birks, 2006).
Table 6 A classification of marketing research design.
Source: Malhotra and Birks (2006)
3.6 Exploratory VS conclusive research
Exploratory research is a type of research design, which might be characterized by a
flexible and evolving approach understand marketing phenomena that are inherently
difficult to measure. Moreover, it has as its primary objective to a provision of
insights into, and comprehension of, the problem situation confronting the researcher
(Malhotra and Birks, 2006). Parasuraman (1991) states exploratory research is
intended to develop initial hunches or insight and to provide direction for any further
research needs. He also indicates the main purpose of exploratory is to shed light on
the nature of a situation and identify any specific objectives or data needs to be
addressed through additional research.
Conclusive research is a research design that characterized by the measurement of
clearly defined marketing phenomena. It designed to assist the decision-maker in
determining, evaluating, and selecting the best course of action to take in a given
Research design
Conclusive design Exploratory design
Causal design Descriptive
research
Quantitative
exploration
Qualitative
exploration
situation (Malhotra and Birks, 2006). Furthermore, Conclusive research intended
verify insight and to aid decision markets in selecting a specific course of action,
sometimes also known as confirmation research is to help decision market choose the
best course in situation ( Parasuraman,1991).
According to above theoretical argument, both research designs, we have chosen the
conclusive research design that will utilized throughout the marketing research in this
paper in order to deep understanding marketing phenomena in terms of relationship
between brand equity and its dimension. For the reason that, conclusive design not
only can estimate the percentage in specified population exhibition a certain form of
behavior, but also can determine the degree to marketing variables are associated
(Malhotra and Birks, 2006). Beside, the objective of exploratory research is to
understand phenomena of marketing, whereas conclusive is measure the marketing
phenomena. Hence, the exploratory will not apply, since this project is to measure and
examine the relationship.
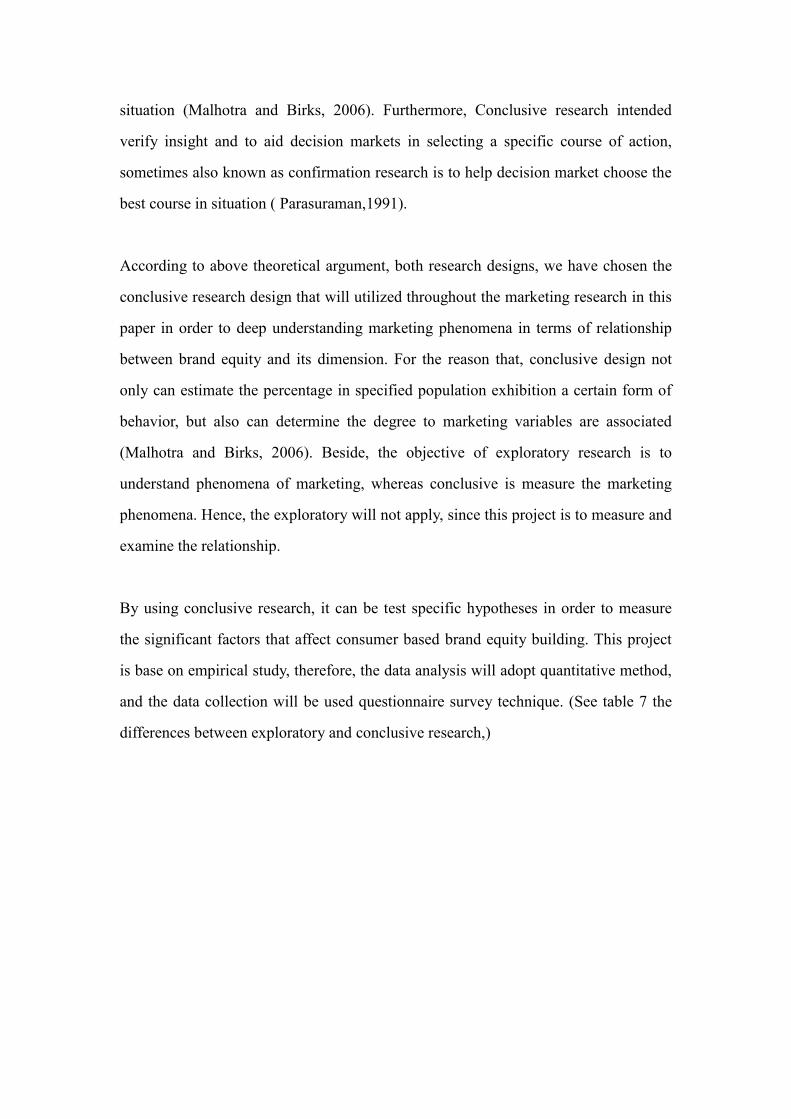
By using conclusive research, it can be test specific hypotheses in order to measure
the significant factors that affect consumer based brand equity building. This project
is base on empirical study, therefore, the data analysis will adopt quantitative method,
and the data collection will be used questionnaire survey technique. (See table 7 the
differences between exploratory and conclusive research,)
Table 7: Differences between exploratory and conclusive research
Items Exploratory Conclusive
Objective To provide insights
Understand of the nature of
marketing phenomena
To test specific hypotheses
and examine relationships
To measure
Characteristic Information needed may be loosely
defined
Data analysis can be qualitative or
quantitative.
Information needed is
clearly define
Data analysis can be
quantitative
Method of data
collection
Expert survey
Pilot survey
Quantitative exploratory multivariate
methods
Survey
Databases
Experiment
Source: Malhotra and Birks (2006)
3.7 Quantitative exploration
As stated, the method of marketing research will be selected by conclusive research;
the method of data collection thus can be either among qualitative and quantitative
research.
Quantitative VS qualitative
Malhotra and Birks (2006) introduce quantitative research is a research manner which
seeks to quantify data; especially, it employed some form of statistic analysis. Indeed,
Parasuraman (1991) argue quantitative research is a form of conclusive research
involving large representative samples and fairly structured data collection
procedures. He also explained that quantitative research is comprised by large scale
questionnaire survey or structure observation in conclusive research projects. Again,
Veal (2006) defines that quantitative research including statistical analysis that relies
on numerical evidence to draw conclusions or to test hypotheses, often, it is essential
to research relatively large numbers of people and to utilize computer to analysis the
data to be sure of the reliability of the results.
Conversely, qualitative research is an unstructured primary exploratory design based
on small samples, intended to provide insight and understand (Malhotra and Birks,
2006). Qualitative research involves collection, analyzing and interpreting data cannot
be meaningfully quantified that summarized in form of numbers (Parasuraman, 1991).
It encompasses a variety of methods that may be applied in a flexible manner, to
enable respondents to reflect upon and express their views or to observe their
behavior. In practically, it seeks to summarize the behavior, experiences and feeling of
respondents in their own terms and context. Qualitative research therefore is a
significant contributor to the market research industry, accounting for substantial
expenditure, and is growing (Malhotra and Birks, 2006).
There are large different between the qualitative and quantitative approaches to
studying and understanding target group. There are circumstances where qualitative
research can be used to present detailed descriptions that cannot be measured in a
quantifiable manner. In contrast, quantitative research are used to conclusively answer
specify hypotheses or research questions using descriptive or experimental techniques
(Malhotra and Birks, 2006).
The given concepts of above parts as quantitative and qualitative research have
clarified both characters and function in order to make decision upon alternative
marketing research method. Chosen quantitative and qualitative method is a question
of trading off breadth and depth in the results of the investigation (Hollensen, 2007).
In this project, we take quantitative research as data collection method for
investigating Chinese consumer.
3.8 Survey techniques
Survey research can be takes place the early stages of research into a phenomenon,
when the objective is to gain preliminary insight on a topic, and provides the basis for
more in-depth survey, as well as survey techniques are based upon use of structure
questionnaire given to a sample of population (Malhotra and Birks, 2006).
Respondents may be asked a variety question regarding the behavior, intention,
attitude, awareness, motivation, demographic and life characteristics. Thus, it will be
selected to obtain the data of respondents in this case.
As a result, survey is low cost and rapidity method in order to collect the data from
the target group that is efficiency for this marketing research. This survey
questionnaire was mostly collected by personal (face to face) interview. Because
personal interview yield the highest rate of response, it can gather huge amounts of
information, and the educated interviewers can hold the respondents‟ attention for a
long time, and can clarified the complicated questions (Hollensen, 2007; Malhotra
and Birks, 2006)
Moreover, electronic mail survey was also applied in this investigation. Electronic
mail and the internet are rising rapidly, so that electronic mail is used to transmit a
letter of request and an attached copy of a questionnaire to potential respondents
(Veal, 2006). The advantage of chosen electronic mail survey is that saving cost, more
convenience, and respondent data can be acquired soon.
3.9 Sampling
There are two types of sampling techniques that may be divided as probability and
non-probability. Probability is a sampling procedure in which each element of the
population has a fixed probabilistic chance of being select for the sampling. This
requires not only a precise definition of the target population but also a general
specification of the sampling frame (Malhotra and Birks, 2006).
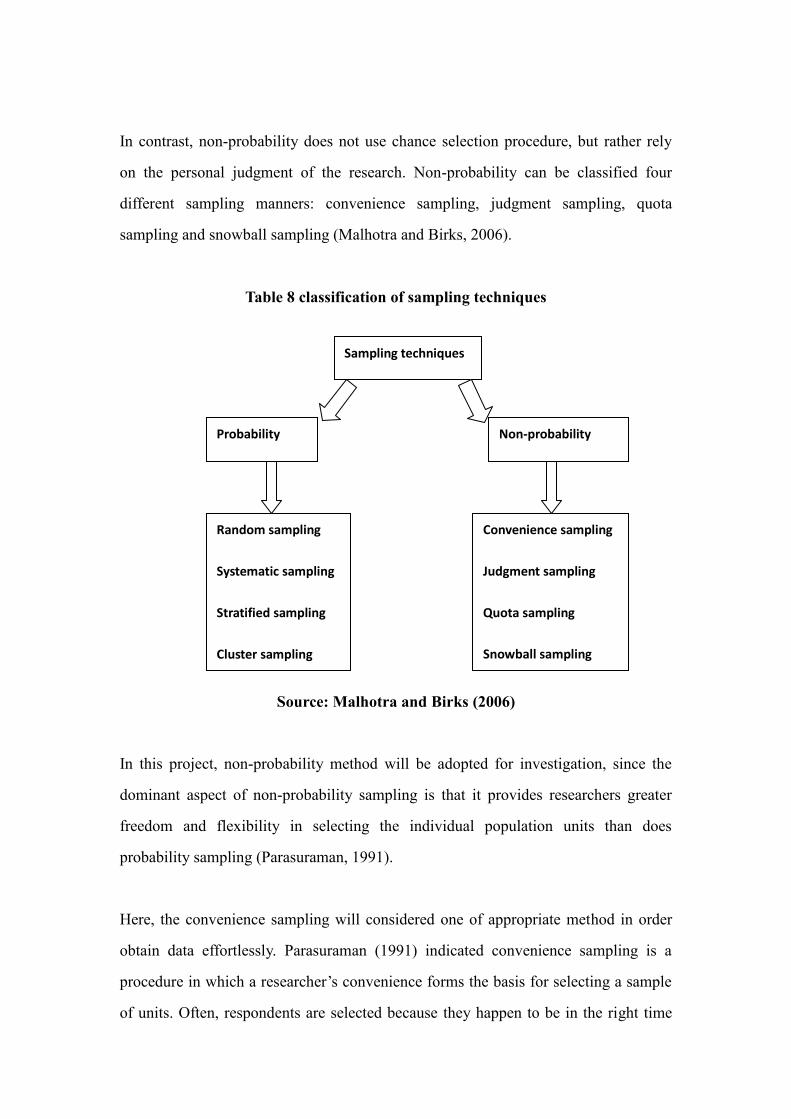
In contrast, non-probability does not use chance selection procedure, but rather rely
on the personal judgment of the research. Non-probability can be classified four
different sampling manners: convenience sampling, judgment sampling, quota
sampling and snowball sampling (Malhotra and Birks, 2006).
Table 8 classification of sampling techniques
Source: Malhotra and Birks (2006)
In this project, non-probability method will be adopted for investigation, since the
dominant aspect of non-probability sampling is that it provides researchers greater
freedom and flexibility in selecting the individual population units than does
probability sampling (Parasuraman, 1991).
Here, the convenience sampling will considered one of appropriate method in order
obtain data effortlessly. Parasuraman (1991) indicated convenience sampling is a
procedure in which a researcher‟s convenience forms the basis for selecting a sample
of units. Often, respondents are selected because they happen to be in the right time
Sampling techniques
Non-probability Probability
Convenience sampling
Judgment sampling
Quota sampling
Snowball sampling
Random sampling
Systematic sampling
Stratified sampling
Cluster sampling
and right place, so that implies selecting any respondent who is readily available
(Malhotra and Birks, 2006). We selected personal interview and email survey as the
priority manner. At the beginning, we print out questionnaires, and delivery to the
respondents. Meanwhile, some of questionnaires were sent by email.
Beside, we also used snow ball sampling technique, firstly, by sending out the
questionnaires to the friends, classmates, family and etc, and then asked them to
distribute questionnaires to other respondents via their social network.
Target respondents
In this study, young people will be selected as target group for investigation. Young
people are considered as the most interest in sports, as well as these people are willing
to spend more time and money to buy sports shoes (or clothing); therefore, this target
group are represent one of the most important market segment in China (Tong and
Hawley, 2009).
Product stimuli
In order to examine and measure the effects of promotional activities and dimensions
of brand equity on creating brand equity, this study focus on sportswear product as
sports shoes in Chinese market. Based on the performance and popularity of
sportswear product in Chinese market, and consider to avoiding respondents fatigue,
only five sport shoes brands were chosen as product stimuli they are: Adidas, Nike,
Kappa, Li-Ning, and Anta.
Adidas and Nike both brands are the leading sportswear product in the world. Kappa
is a brand which is very popular sports brand in China recent year. However, Li-Ning
and Anta are the well-known Chinese brands which are considered the leading sports
brand in domestic sports market. From the five listed brands, respondents will be
asked to select the one they are most familiar with, and then to answer all the
statement in the questionnaire for that each brands.
3.10 Measurement
The concepts of scaling and measurement should be considered if the marketing
researcher has a clear understanding of what they want to know in their target
respondents (Malhotra and Birks, 2006). Summers (1970) defined a typical definition
of measurement is “the assignment of numbers to observations (or responses)
according to some set of rules”. Malhotra and Birks (2006) suggest that measurement
means passing on numbers or other symbols to distinctive of objects according to
certain pre-specified rules. The specification of rules for passing on numbers to the
characteristics is the most important feature of measurement. It is very important that
the marketing researcher develop operational definitions of the concepts to be
measured and that these are stated clearly. Theory plays an important role in
measurement; there can be no measurement without theory (Malhotra and Birks,
2006).
Parasuraman (1991) declare that the first step in developing a measure to be used in
marketing study is to devise the type of response scale that can be correctly performed
by using the collected data. Malhotra and Birks (2006) argued that scaling may be
“considered an extension of measurement”. Scaling involves creating the answering
from the respondents and measured the objects located are. In this project, likert scale
has been using for questionnaire measurement, because it is a widely used rating scale
that requires the respondents to indicate a degree of agreement or disagreement with
each of a series of statements about the stimulus objects (Miller and Salkind, 2002). In
general, likert scale is used to measure respondents attitudes of the product; it is easy
to construct administer and understand. Information on brand equity dimensions of
brand equity and selected 6 promotional activities were collected by survey
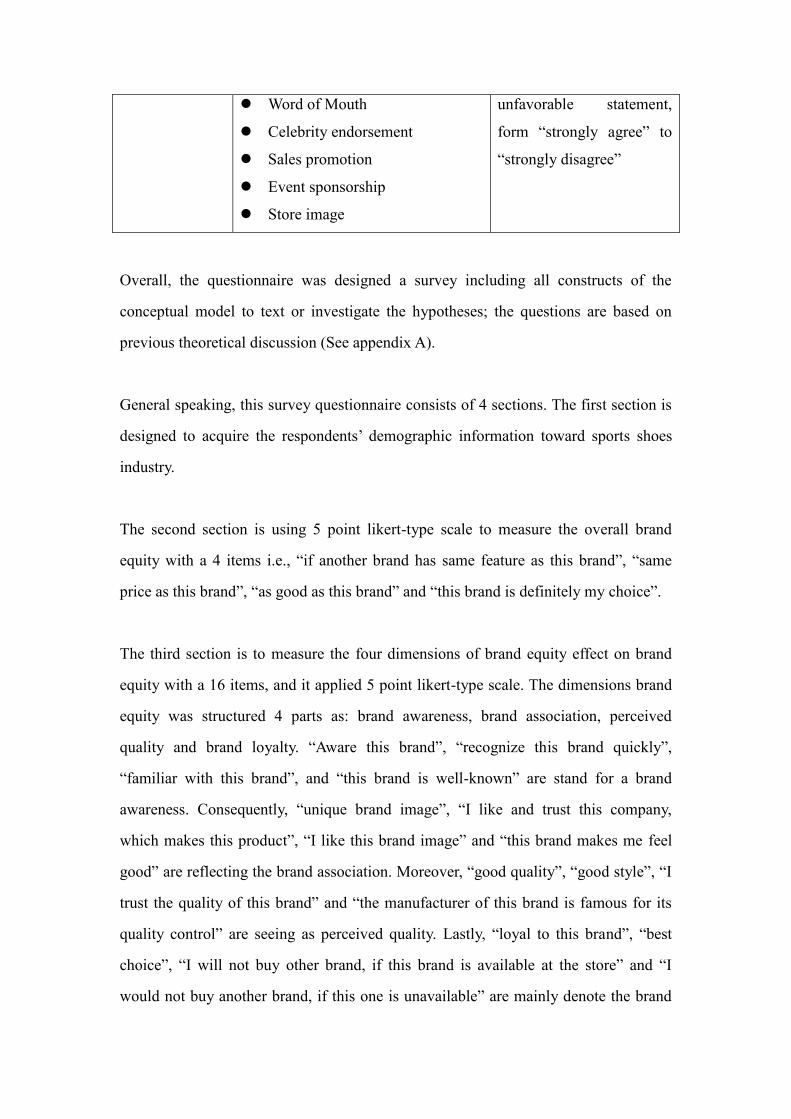
questionnaire. The entire of measurements will be presented in following table.
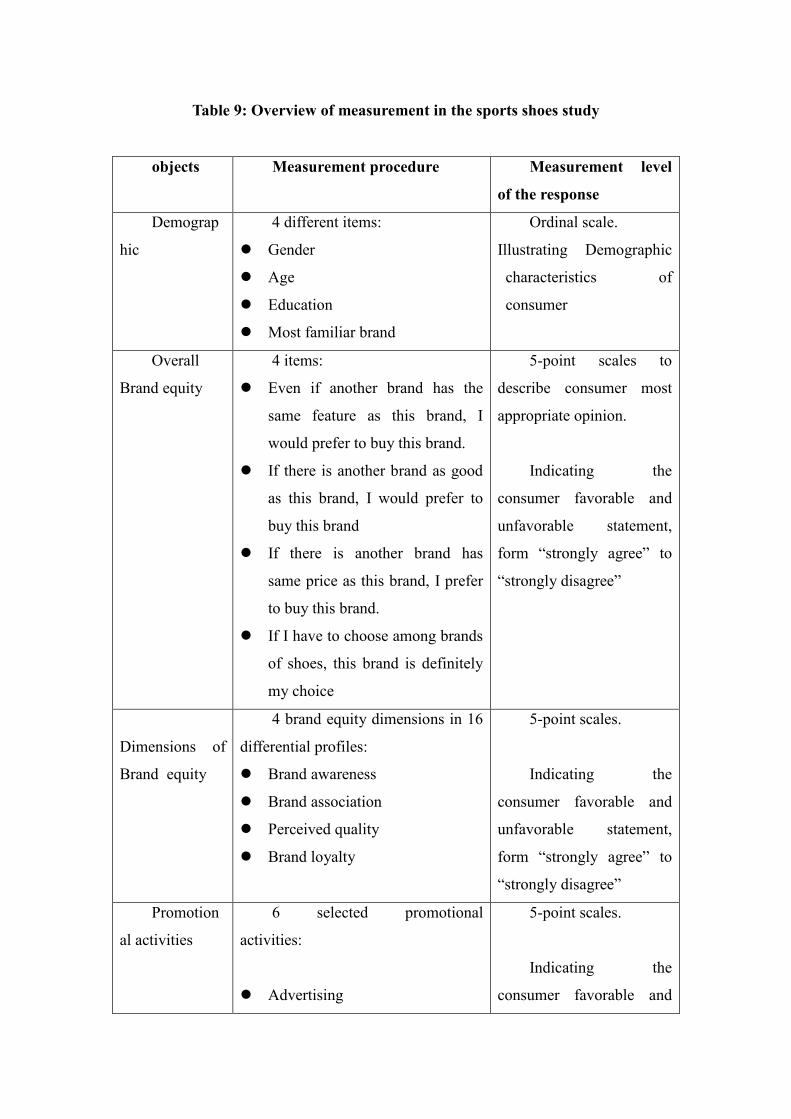
Table 9: Overview of measurement in the sports shoes study
objects
Measurement procedure Measurement level
of the response
Demograp
hic
4 different items:
Gender
Age
Education
Most familiar brand
Ordinal scale.
Illustrating Demographic
characteristics of
consumer
Overall
Brand equity
4 items:
Even if another brand has the
same feature as this brand, I
would prefer to buy this brand.
If there is another brand as good
as this brand, I would prefer to
buy this brand
If there is another brand has
same price as this brand, I prefer
to buy this brand.
If I have to choose among brands
of shoes, this brand is definitely
my choice
5-point scales to
describe consumer most
appropriate opinion.
Indicating the
consumer favorable and
unfavorable statement,
form “strongly agree” to
“strongly disagree”
Dimensions of
Brand equity
4 brand equity dimensions in 16
differential profiles:
Brand awareness
Brand association
Perceived quality
Brand loyalty
5-point scales.
Indicating the
consumer favorable and
unfavorable statement,
form “strongly agree” to
“strongly disagree”
Promotion
al activities
6 selected promotional
activities:
Advertising
5-point scales.
Indicating the
consumer favorable and
Word of Mouth
Celebrity endorsement
Sales promotion
Event sponsorship
Store image
unfavorable statement,
form “strongly agree” to
“strongly disagree”
Overall, the questionnaire was designed a survey including all constructs of the
conceptual model to text or investigate the hypotheses; the questions are based on
previous theoretical discussion (See appendix A).
General speaking, this survey questionnaire consists of 4 sections. The first section is
designed to acquire the respondents‟ demographic information toward sports shoes
industry.
The second section is using 5 point likert-type scale to measure the overall brand
equity with a 4 items i.e., “if another brand has same feature as this brand”, “same
price as this brand”, “as good as this brand” and “this brand is definitely my choice”.
The third section is to measure the four dimensions of brand equity effect on brand
equity with a 16 items, and it applied 5 point likert-type scale. The dimensions brand
equity was structured 4 parts as: brand awareness, brand association, perceived
quality and brand loyalty. “Aware this brand”, “recognize this brand quickly”,
“familiar with this brand”, and “this brand is well-known” are stand for a brand
awareness. Consequently, “unique brand image”, “I like and trust this company,
which makes this product”, “I like this brand image” and “this brand makes me feel
good” are reflecting the brand association. Moreover, “good quality”, “good style”, “I
trust the quality of this brand” and “the manufacturer of this brand is famous for its
quality control” are seeing as perceived quality. Lastly, “loyal to this brand”, “best
choice”, “I will not buy other brand, if this brand is available at the store” and “I
would not buy another brand, if this one is unavailable” are mainly denote the brand
loyalty.
The last section is to measure the promotional activities effect on four brand equity
dimensions with 24 items. Again, this section also used 5 likert-type scale form
“strongly agree” to “strongly disagree”. The promotional activities consist of 6
dimensions: advertising, word of mouth, celebrity endorsement, sales promotion, and
store image and event sponsorship. All of promotional activities were measured brand
equity dimensions using the same 4 items as such: “X of this brand is seen frequently
on TV or other media, “X this brand is seen very interesting, funny, exciting”, “X of
this brand is very popular” and “X of this brand is easy to remember”.
Translation
In order to make respondents to understand this questionnaire survey, back translation
technique was applied. Back translation is a technique that “translates a questionnaire
from the base language by a translator whose native language is the language into
which the questionnaire is being translated” (Malhotra and Birks, 2006).
In this research, an English version questionnaire was developed firstly, and then the
questionnaire was sent to author‟s supervisor. After having correction, a new
questionnaire was re-structured. Finally, the author and other Chinese people whose
English speaker translated the questionnaire from English version into Chinese
version.
3.11 Data collection
The questionnaire has been sent to total number of 200, and collection of data was
conducted in two mouths. In order to make the data more representative and precisely,
this survey was chosen a broad target population for investigation.
Target population: Young people
Sampling unit: Chinese and Chinese people who study or living in Denmark
Location: Shenyang, China and Aarhus, Denmark.
Time: Beginning of June to end of July, 2011
After sent total number of 200 questionnaires to the target group, 84 respondents of
data have been returned (42% respondent rate).
3.12 Summary of methodology
Methodology part was discussed the using method of this project. In the beginning,
we have defined the methodological approach in creating business knowledge, and
explained the assumption of this study. As we indentified, brand equity dimensions
and its promotional activities effect on create consumers based brand equity is seem
as a reality. Hence, the method that will be used in this study is quantitative and
objective; and analytical approach considered the most relevant approach.
Because, this project is an empirical study, the research design of this project was
chosen by concussive research, and the data analysis was applied quantitative method.
In order to obtain the data, questionnaires survey administered through the electronic
mail and face-to-face interview.
Non-probability method is used for this investigation, and we exploited two types i.e.,
convenience sampling and snowball sampling for selecting respondents. Young people
will selected as target group for investigation, since they are most interest in sports and
willing to spend more time and money to buy sports shoes (or clothing). Moreover,
based on the performance and popularity of sportswear product in Chinese market,
and consider to avoiding respondents fatigue, five sport shoes brands such as Adidas,
Nike, Kappa, Li-Ning, and Anta were chosen as product stimuli.
Subsequently, in this project, the research questionnaire composed of 4 sections i.e.,:
(1) demographic description, (2) overall brand equity, (3) the brand equity dimensions
effect on brand equity with 16 items, and (4) promotional activities effect on four
brand equity dimensions. In order to make respondents to understand this
questionnaire survey, back translation technique was applied. An English version
questionnaire was developed firstly, and the author and other Chinese people whose
English speaker translated the questionnaire from English version into Chinese
version
Our research questionnaire has been sent to total number of 200, and collection of
data was conducted in two mouths, 84 respondents of data have been returned.
4. Analysis and discussion
In this research, Statistical Package for Social Science programs (SPSS) 17.0 is used
for the data analysis. The methods used in data analysis are including descriptive
analysis, factor analysis, and multiple regression analysis. Descriptive analysis is used
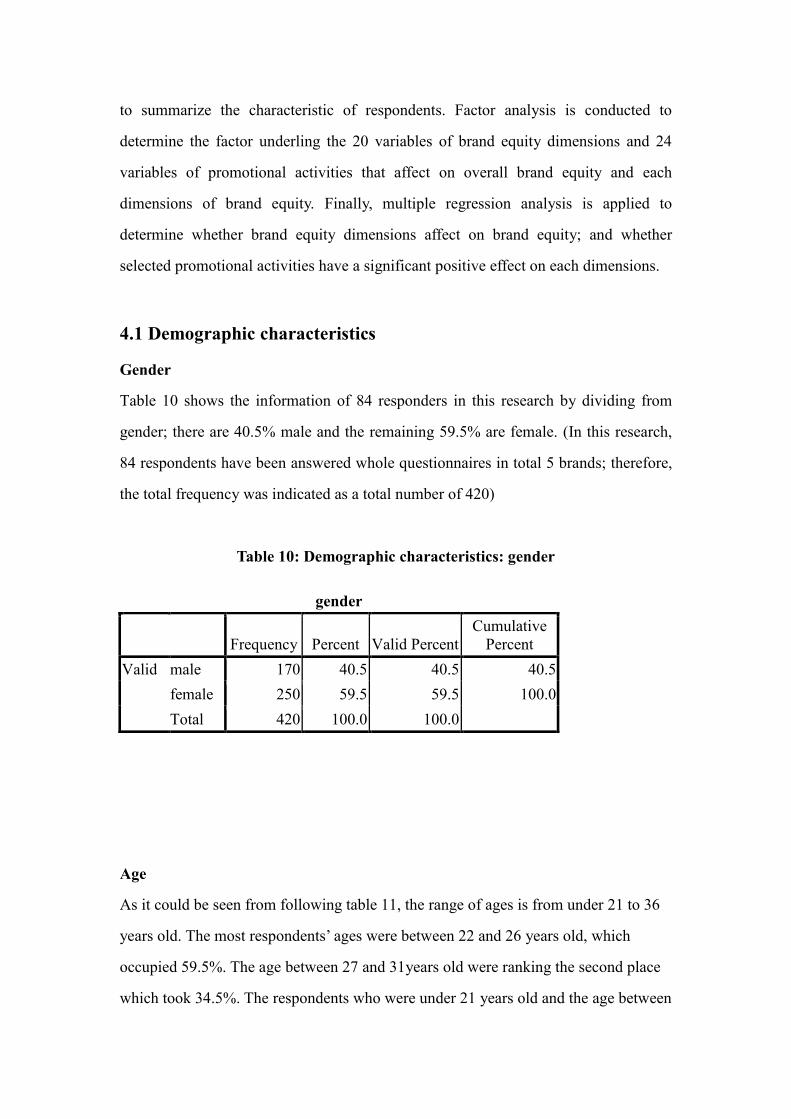
to summarize the characteristic of respondents. Factor analysis is conducted to
determine the factor underling the 20 variables of brand equity dimensions and 24
variables of promotional activities that affect on overall brand equity and each
dimensions of brand equity. Finally, multiple regression analysis is applied to
determine whether brand equity dimensions affect on brand equity; and whether
selected promotional activities have a significant positive effect on each dimensions.
4.1 Demographic characteristics
Gender
Table 10 shows the information of 84 responders in this research by dividing from
gender; there are 40.5% male and the remaining 59.5% are female. (In this research,
84 respondents have been answered whole questionnaires in total 5 brands; therefore,
the total frequency was indicated as a total number of 420)
Table 10: Demographic characteristics: gender
gender
Frequency Percent Valid Percent
Cumulative
Percent
Valid male 170 40.5 40.5 40.5
female 250 59.5 59.5 100.0
Total 420 100.0 100.0
Age
As it could be seen from following table 11, the range of ages is from under 21 to 36
years old. The most respondents‟ ages were between 22 and 26 years old, which
occupied 59.5%. The age between 27 and 31years old were ranking the second place
which took 34.5%. The respondents who were under 21 years old and the age between
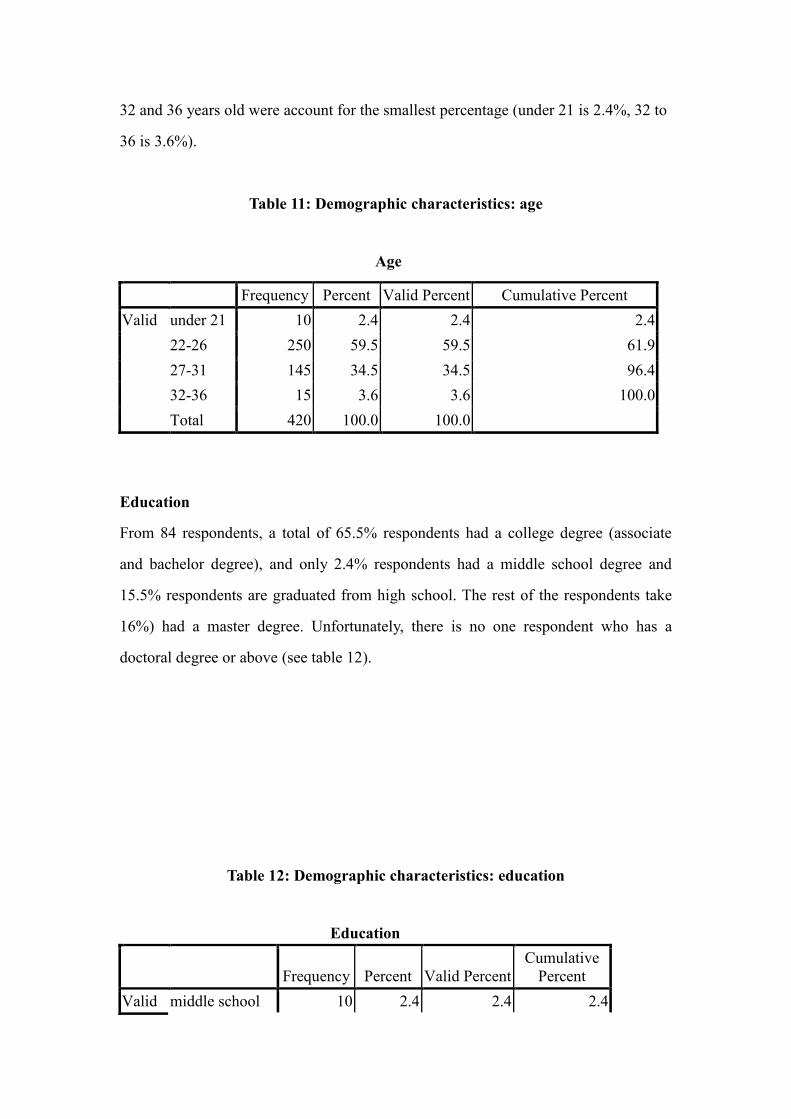
32 and 36 years old were account for the smallest percentage (under 21 is 2.4%, 32 to
36 is 3.6%).
Table 11: Demographic characteristics: age
Age
Frequency Percent Valid Percent Cumulative Percent
Valid under 21 10 2.4 2.4 2.4
22-26 250 59.5 59.5 61.9
27-31 145 34.5 34.5 96.4
32-36 15 3.6 3.6 100.0
Total 420 100.0 100.0
Education
From 84 respondents, a total of 65.5% respondents had a college degree (associate
and bachelor degree), and only 2.4% respondents had a middle school degree and
15.5% respondents are graduated from high school. The rest of the respondents take
16%) had a master degree. Unfortunately, there is no one respondent who has a
doctoral degree or above (see table 12).
Table 12: Demographic characteristics: education
Education
Frequency Percent Valid Percent
Cumulative
Percent
Valid middle school 10 2.4 2.4 2.4
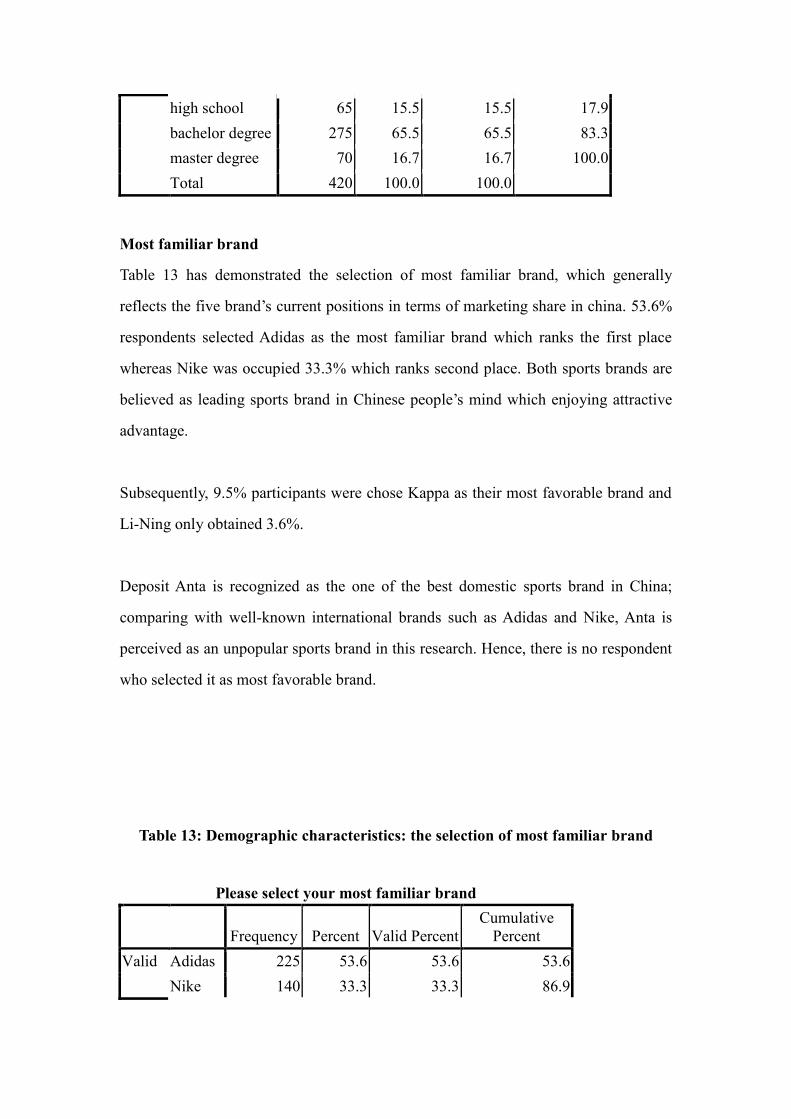
high school 65 15.5 15.5 17.9
bachelor degree 275 65.5 65.5 83.3
master degree 70 16.7 16.7 100.0
Total 420 100.0 100.0
Most familiar brand
Table 13 has demonstrated the selection of most familiar brand, which generally
reflects the five brand‟s current positions in terms of marketing share in china. 53.6%
respondents selected Adidas as the most familiar brand which ranks the first place
whereas Nike was occupied 33.3% which ranks second place. Both sports brands are
believed as leading sports brand in Chinese people‟s mind which enjoying attractive
advantage.
Subsequently, 9.5% participants were chose Kappa as their most favorable brand and
Li-Ning only obtained 3.6%.
Deposit Anta is recognized as the one of the best domestic sports brand in China;
comparing with well-known international brands such as Adidas and Nike, Anta is
perceived as an unpopular sports brand in this research. Hence, there is no respondent
who selected it as most favorable brand.
Table 13: Demographic characteristics: the selection of most familiar brand
Please select your most familiar brand
Frequency Percent Valid Percent
Cumulative
Percent
Valid Adidas 225 53.6 53.6 53.6
Nike 140 33.3 33.3 86.9
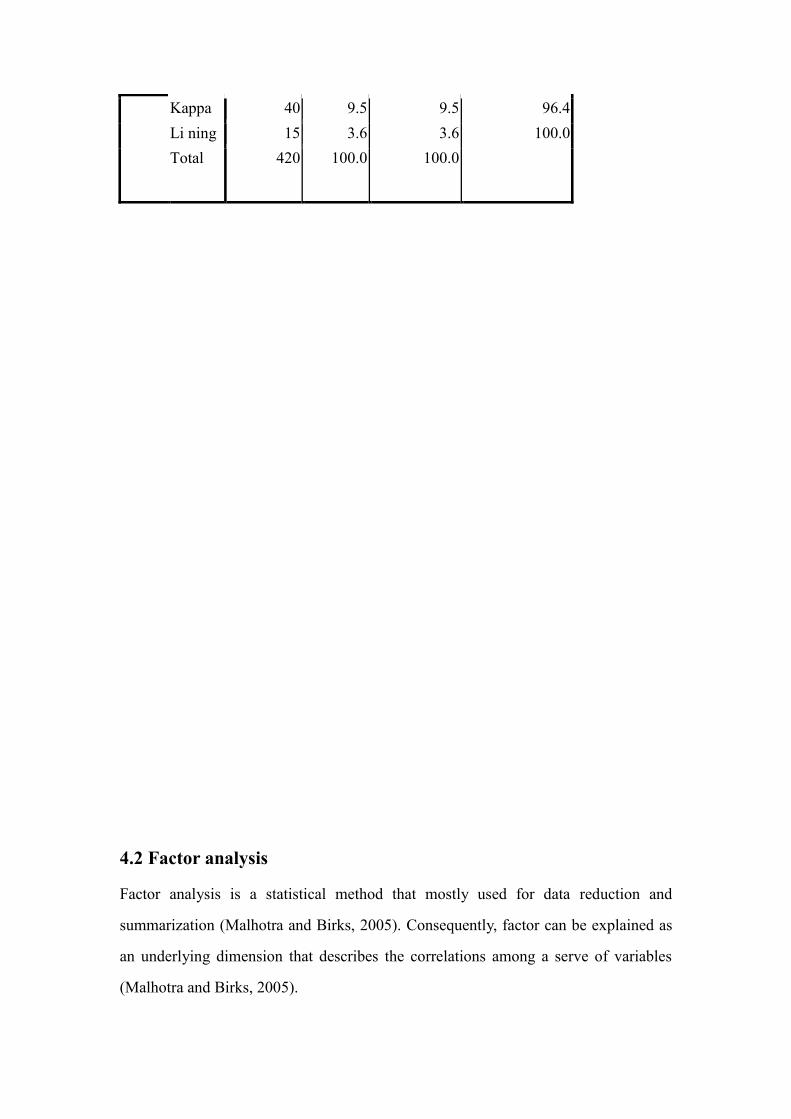
Kappa 40 9.5 9.5 96.4
Li ning 15 3.6 3.6 100.0
Total 420 100.0 100.0
4.2 Factor analysis
Factor analysis is a statistical method that mostly used for data reduction and
summarization (Malhotra and Birks, 2005). Consequently, factor can be explained as
an underlying dimension that describes the correlations among a serve of variables
(Malhotra and Birks, 2005).
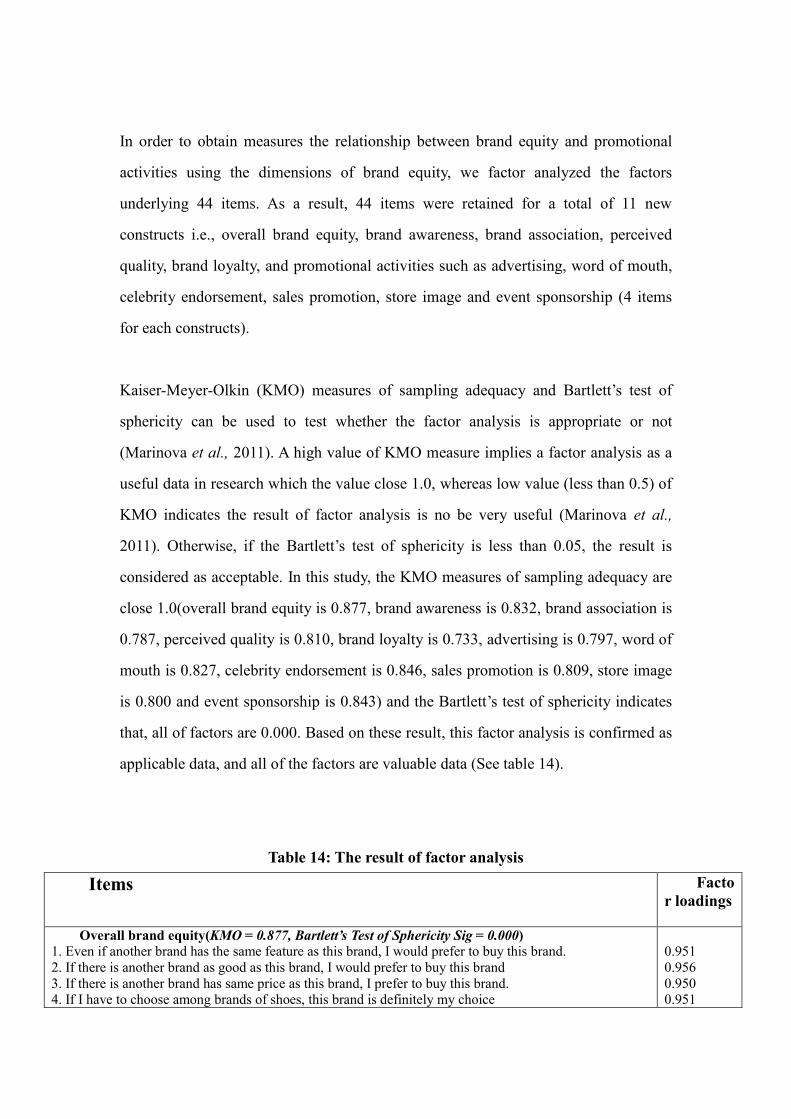
In order to obtain measures the relationship between brand equity and promotional
activities using the dimensions of brand equity, we factor analyzed the factors
underlying 44 items. As a result, 44 items were retained for a total of 11 new
constructs i.e., overall brand equity, brand awareness, brand association, perceived
quality, brand loyalty, and promotional activities such as advertising, word of mouth,
celebrity endorsement, sales promotion, store image and event sponsorship (4 items
for each constructs).
Kaiser-Meyer-Olkin (KMO) measures of sampling adequacy and Bartlett‟s test of
sphericity can be used to test whether the factor analysis is appropriate or not
(Marinova et al., 2011). A high value of KMO measure implies a factor analysis as a
useful data in research which the value close 1.0, whereas low value (less than 0.5) of
KMO indicates the result of factor analysis is no be very useful (Marinova et al.,
2011). Otherwise, if the Bartlett‟s test of sphericity is less than 0.05, the result is
considered as acceptable. In this study, the KMO measures of sampling adequacy are
close 1.0(overall brand equity is 0.877, brand awareness is 0.832, brand association is
0.787, perceived quality is 0.810, brand loyalty is 0.733, advertising is 0.797, word of
mouth is 0.827, celebrity endorsement is 0.846, sales promotion is 0.809, store image
is 0.800 and event sponsorship is 0.843) and the Bartlett‟s test of sphericity indicates
that, all of factors are 0.000. Based on these result, this factor analysis is confirmed as
applicable data, and all of the factors are valuable data (See table 14).
Table 14: The result of factor analysis
Items Facto
r loadings
Overall brand equity(KMO = 0.877, Bartlett’s Test of Sphericity Sig = 0.000)
1. Even if another brand has the same feature as this brand, I would prefer to buy this brand.
2. If there is another brand as good as this brand, I would prefer to buy this brand
3. If there is another brand has same price as this brand, I prefer to buy this brand.
4. If I have to choose among brands of shoes, this brand is definitely my choice
0.951
0.956
0.950
0.951
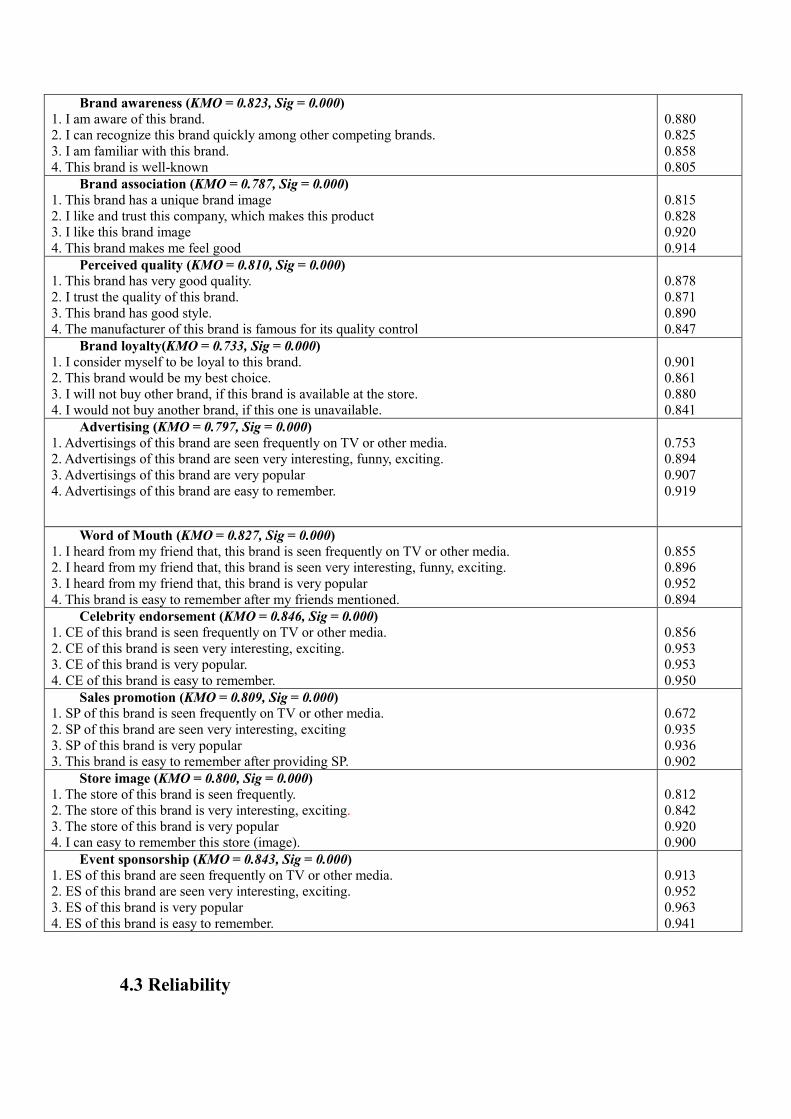
Brand awareness (KMO = 0.823, Sig = 0.000)
1. I am aware of this brand.
2. I can recognize this brand quickly among other competing brands.
3. I am familiar with this brand.
4. This brand is well-known
0.880
0.825
0.858
0.805
Brand association (KMO = 0.787, Sig = 0.000)
1. This brand has a unique brand image
2. I like and trust this company, which makes this product
3. I like this brand image
4. This brand makes me feel good
0.815
0.828
0.920
0.914
Perceived quality (KMO = 0.810, Sig = 0.000)
1. This brand has very good quality.
2. I trust the quality of this brand.
3. This brand has good style.
4. The manufacturer of this brand is famous for its quality control
0.878
0.871
0.890
0.847
Brand loyalty(KMO = 0.733, Sig = 0.000)
1. I consider myself to be loyal to this brand.
2. This brand would be my best choice.
3. I will not buy other brand, if this brand is available at the store.
4. I would not buy another brand, if this one is unavailable.
0.901
0.861
0.880
0.841
Advertising (KMO = 0.797, Sig = 0.000)
1. Advertisings of this brand are seen frequently on TV or other media.
2. Advertisings of this brand are seen very interesting, funny, exciting.
3. Advertisings of this brand are very popular
4. Advertisings of this brand are easy to remember.
0.753
0.894
0.907
0.919
Word of Mouth (KMO = 0.827, Sig = 0.000)
1. I heard from my friend that, this brand is seen frequently on TV or other media.
2. I heard from my friend that, this brand is seen very interesting, funny, exciting.
3. I heard from my friend that, this brand is very popular
4. This brand is easy to remember after my friends mentioned.
0.855
0.896
0.952
0.894
Celebrity endorsement (KMO = 0.846, Sig = 0.000)
1. CE of this brand is seen frequently on TV or other media.
2. CE of this brand is seen very interesting, exciting.
3. CE of this brand is very popular.
4. CE of this brand is easy to remember.
0.856
0.953
0.953
0.950
Sales promotion (KMO = 0.809, Sig = 0.000)
1. SP of this brand is seen frequently on TV or other media.
2. SP of this brand are seen very interesting, exciting
3. SP of this brand is very popular
3. This brand is easy to remember after providing SP.
0.672
0.935
0.936
0.902
Store image (KMO = 0.800, Sig = 0.000)
1. The store of this brand is seen frequently.
2. The store of this brand is very interesting, exciting.
3. The store of this brand is very popular
4. I can easy to remember this store (image).
0.812
0.842
0.920
0.900
Event sponsorship (KMO = 0.843, Sig = 0.000)
1. ES of this brand are seen frequently on TV or other media.
2. ES of this brand are seen very interesting, exciting.
3. ES of this brand is very popular
4. ES of this brand is easy to remember.
0.913
0.952
0.963
0.941
4.3 Reliability
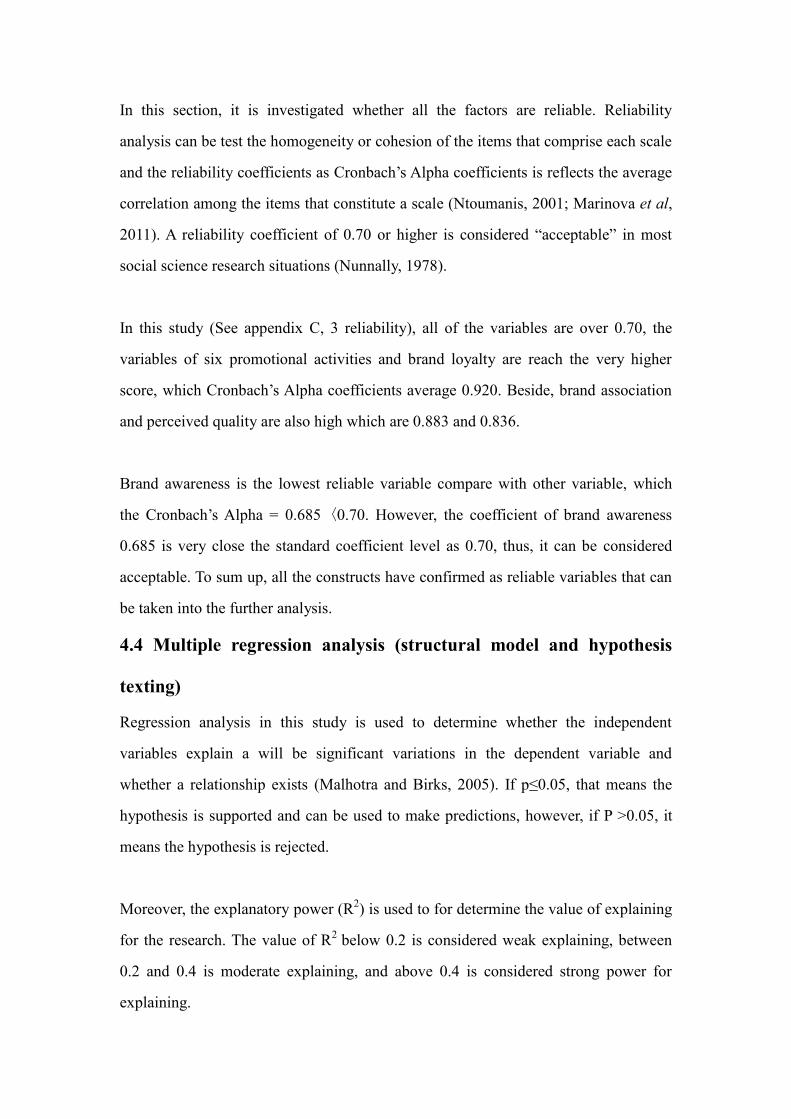
In this section, it is investigated whether all the factors are reliable. Reliability
analysis can be test the homogeneity or cohesion of the items that comprise each scale
and the reliability coefficients as Cronbach‟s Alpha coefficients is reflects the average
correlation among the items that constitute a scale (Ntoumanis, 2001; Marinova et al,
2011). A reliability coefficient of 0.70 or higher is considered “acceptable” in most
social science research situations (Nunnally, 1978).
In this study (See appendix C, 3 reliability), all of the variables are over 0.70, the
variables of six promotional activities and brand loyalty are reach the very higher
score, which Cronbach‟s Alpha coefficients average 0.920. Beside, brand association
and perceived quality are also high which are 0.883 and 0.836.
Brand awareness is the lowest reliable variable compare with other variable, which
the Cronbach‟s Alpha = 0.685〈0.70. However, the coefficient of brand awareness
0.685 is very close the standard coefficient level as 0.70, thus, it can be considered
acceptable. To sum up, all the constructs have confirmed as reliable variables that can
be taken into the further analysis.
4.4 Multiple regression analysis (structural model and hypothesis
texting)
Regression analysis in this study is used to determine whether the independent
variables explain a will be significant variations in the dependent variable and
whether a relationship exists (Malhotra and Birks, 2005). If p≤0.05, that means the
hypothesis is supported and can be used to make predictions, however, if P >0.05, it
means the hypothesis is rejected.
Moreover, the explanatory power (R2) is used to for determine the value of explaining
for the research. The value of R2
below 0.2 is considered weak explaining, between
0.2 and 0.4 is moderate explaining, and above 0.4 is considered strong power for
explaining.
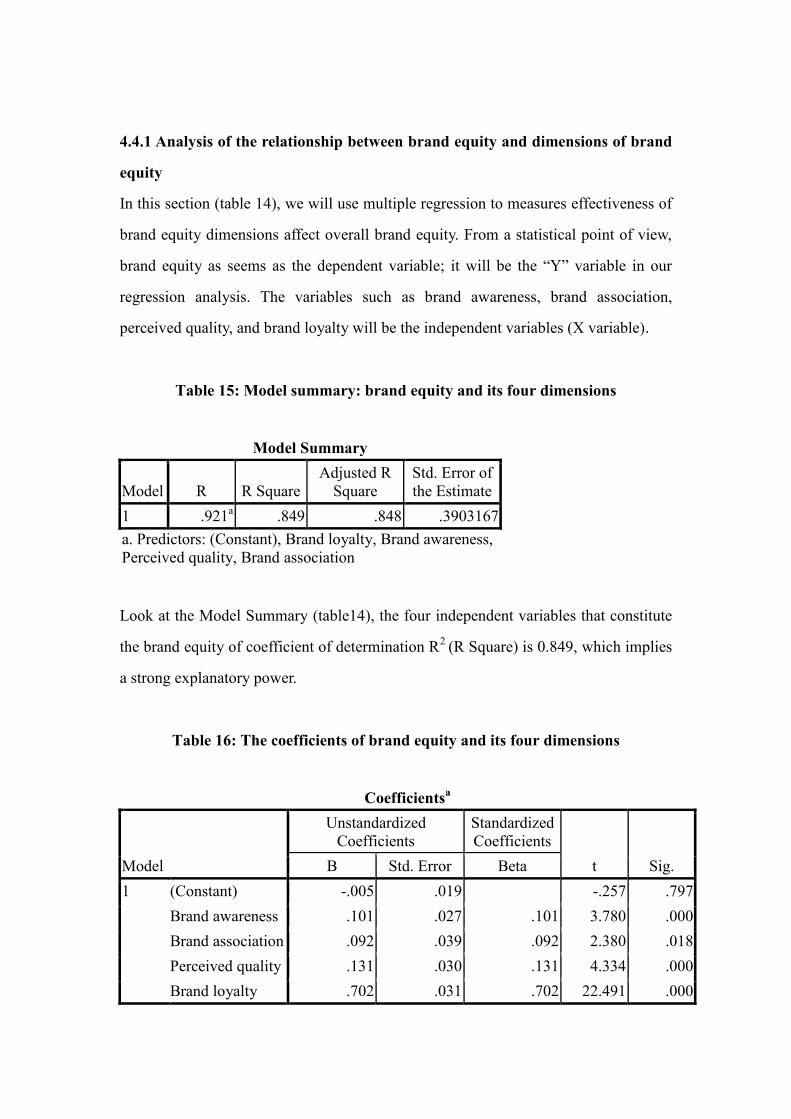
4.4.1 Analysis of the relationship between brand equity and dimensions of brand
equity
In this section (table 14), we will use multiple regression to measures effectiveness of
brand equity dimensions affect overall brand equity. From a statistical point of view,
brand equity as seems as the dependent variable; it will be the “Y” variable in our
regression analysis. The variables such as brand awareness, brand association,
perceived quality, and brand loyalty will be the independent variables (X variable).
Table 15: Model summary: brand equity and its four dimensions
Model Summary
Model R R Square
Adjusted R
Square
Std. Error of
the Estimate
1 .921a .849 .848 .3903167
a. Predictors: (Constant), Brand loyalty, Brand awareness,
Perceived quality, Brand association
Look at the Model Summary (table14), the four independent variables that constitute
the brand equity of coefficient of determination R2
(R Square) is 0.849, which implies
a strong explanatory power.
Table 16: The coefficients of brand equity and its four dimensions
Coefficientsa
Model
Unstandardized
Coefficients
Standardized
Coefficients
t Sig. B Std. Error Beta
1 (Constant) -.005 .019 -.257 .797
Brand awareness .101 .027 .101 3.780 .000
Brand association .092 .039 .092 2.380 .018
Perceived quality .131 .030 .131 4.334 .000
Brand loyalty .702 .031 .702 22.491 .000
a. Dependent Variable: Brand equity
As hypothesized in literature review, brand awareness (H1a), brand association (H1b),
perceived quality (H1c) and brand loyalty (H1d) have significant positive effect on
consumer based brand equity. As it can be seen from table 15, brand awareness
(0,000), brand association (0,018), perceived quality (0,000) and brand loyalty (0,000)
were significant at p-value <0, 05. Hence, these four hypothesizes were all supported,
this finding is consistent with previous conceptualizations as Marinova et al. (2011);
Yoo et al. (2000); Tong and Hawley, 2009; and Erenkol and Duygun (2010). To sum
up, all of dimensions of brand equity brand have significant positive effect on
consumer based brand equity in this research.
Moreover, according to regression coefficient (beta), brand loyalty is at the first place
of importance for dimensions of brand equity on brand equity, perceived quality ranks
the second place, brand awareness and brand association are at third and the last
place. According to t-text result that explains the significant of coefficients, brand
loyal has most positive effect on brand equity, whereas brand association has lowest
impact on brand equity.
4.4.2 Analysis of the relationship between dimensions of brand equity and
promotional activities
Six promotional activities effect on Brand awareness
As table 16 shown below, brand awareness seems as the dependent variable; it will be
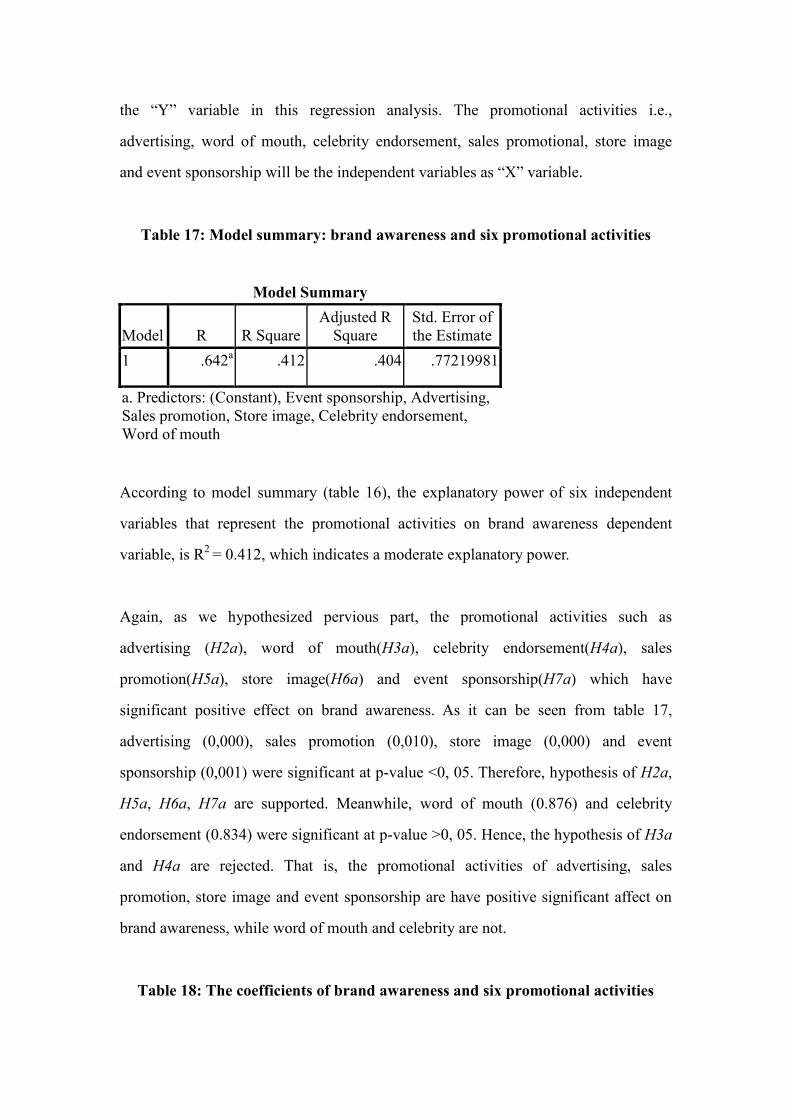
the “Y” variable in this regression analysis. The promotional activities i.e.,
advertising, word of mouth, celebrity endorsement, sales promotional, store image
and event sponsorship will be the independent variables as “X” variable.
Table 17: Model summary: brand awareness and six promotional activities
Model Summary
Model R R Square
Adjusted R
Square
Std. Error of
the Estimate
1 .642a .412 .404 .77219981
a. Predictors: (Constant), Event sponsorship, Advertising,
Sales promotion, Store image, Celebrity endorsement,
Word of mouth
According to model summary (table 16), the explanatory power of six independent
variables that represent the promotional activities on brand awareness dependent
variable, is R2
= 0.412, which indicates a moderate explanatory power.
Again, as we hypothesized pervious part, the promotional activities such as
advertising (H2a), word of mouth(H3a), celebrity endorsement(H4a), sales
promotion(H5a), store image(H6a) and event sponsorship(H7a) which have
significant positive effect on brand awareness. As it can be seen from table 17,
advertising (0,000), sales promotion (0,010), store image (0,000) and event
sponsorship (0,001) were significant at p-value <0, 05. Therefore, hypothesis of H2a,
H5a, H6a, H7a are supported. Meanwhile, word of mouth (0.876) and celebrity
endorsement (0.834) were significant at p-value >0, 05. Hence, the hypothesis of H3a
and H4a are rejected. That is, the promotional activities of advertising, sales
promotion, store image and event sponsorship are have positive significant affect on
brand awareness, while word of mouth and celebrity are not.
Table 18: The coefficients of brand awareness and six promotional activities
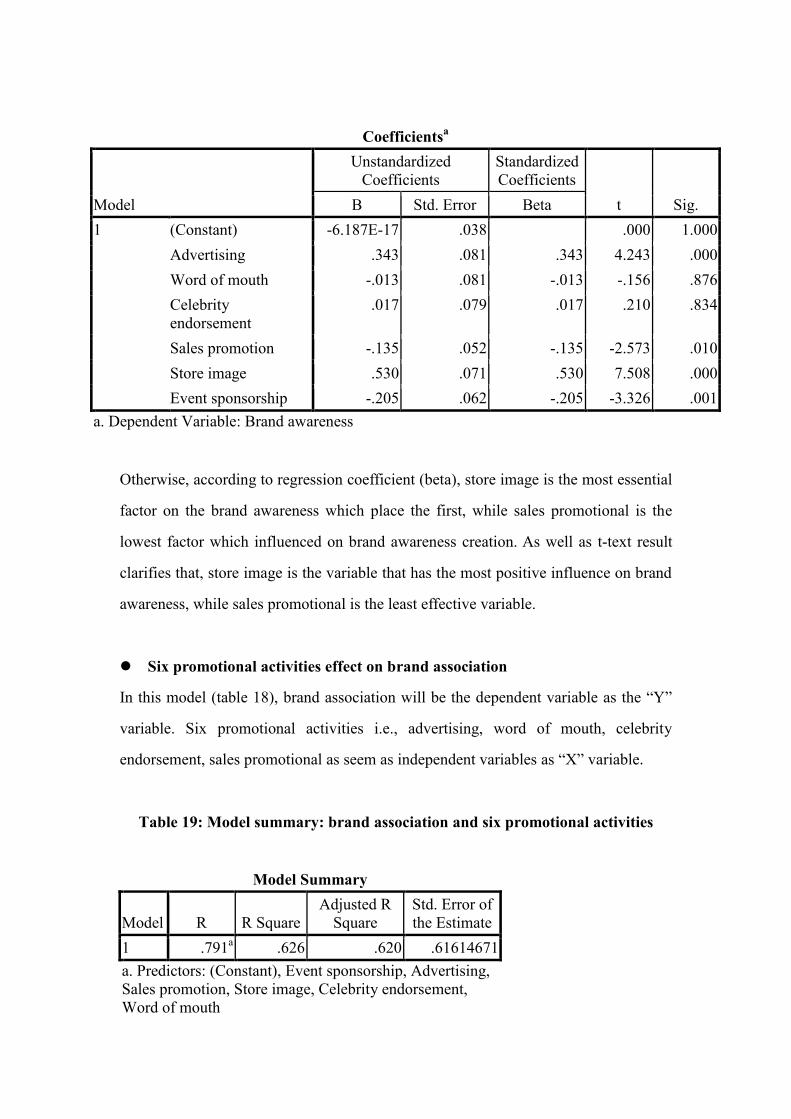
Coefficientsa
Model
Unstandardized
Coefficients
Standardized
Coefficients
t Sig. B Std. Error Beta
1 (Constant) -6.187E-17 .038 .000 1.000
Advertising .343 .081 .343 4.243 .000
Word of mouth -.013 .081 -.013 -.156 .876
Celebrity
endorsement
.017 .079 .017 .210 .834
Sales promotion -.135 .052 -.135 -2.573 .010
Store image .530 .071 .530 7.508 .000
Event sponsorship -.205 .062 -.205 -3.326 .001
a. Dependent Variable: Brand awareness
Otherwise, according to regression coefficient (beta), store image is the most essential
factor on the brand awareness which place the first, while sales promotional is the
lowest factor which influenced on brand awareness creation. As well as t-text result
clarifies that, store image is the variable that has the most positive influence on brand
awareness, while sales promotional is the least effective variable.
Six promotional activities effect on brand association
In this model (table 18), brand association will be the dependent variable as the “Y”
variable. Six promotional activities i.e., advertising, word of mouth, celebrity
endorsement, sales promotional as seem as independent variables as “X” variable.
Table 19: Model summary: brand association and six promotional activities
Model Summary
Model R R Square
Adjusted R
Square
Std. Error of
the Estimate
1 .791a .626 .620 .61614671
a. Predictors: (Constant), Event sponsorship, Advertising,
Sales promotion, Store image, Celebrity endorsement,
Word of mouth
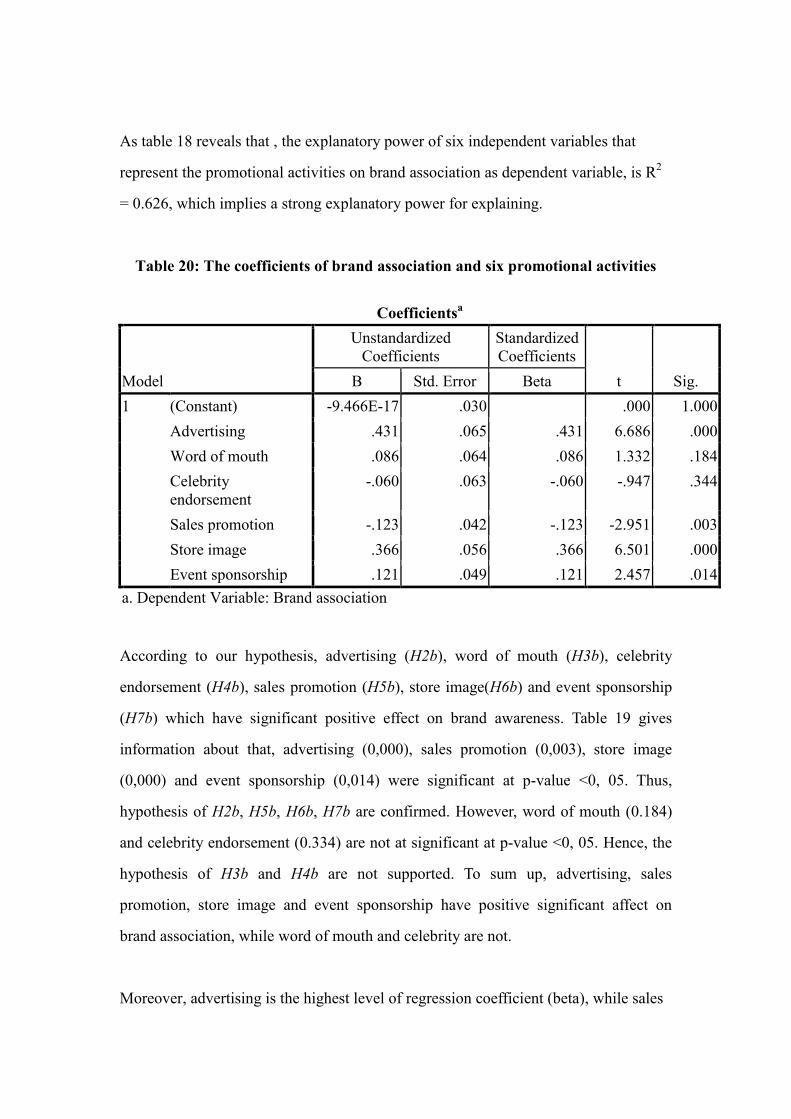
As table 18 reveals that , the explanatory power of six independent variables that
represent the promotional activities on brand association as dependent variable, is R2
= 0.626, which implies a strong explanatory power for explaining.
Table 20: The coefficients of brand association and six promotional activities
Coefficientsa
Model
Unstandardized
Coefficients
Standardized
Coefficients
t Sig. B Std. Error Beta
1 (Constant) -9.466E-17 .030 .000 1.000
Advertising .431 .065 .431 6.686 .000
Word of mouth .086 .064 .086 1.332 .184
Celebrity
endorsement
-.060 .063 -.060 -.947 .344
Sales promotion -.123 .042 -.123 -2.951 .003
Store image .366 .056 .366 6.501 .000
Event sponsorship .121 .049 .121 2.457 .014
a. Dependent Variable: Brand association
According to our hypothesis, advertising (H2b), word of mouth (H3b), celebrity
endorsement (H4b), sales promotion (H5b), store image(H6b) and event sponsorship
(H7b) which have significant positive effect on brand awareness. Table 19 gives
information about that, advertising (0,000), sales promotion (0,003), store image
(0,000) and event sponsorship (0,014) were significant at p-value <0, 05. Thus,
hypothesis of H2b, H5b, H6b, H7b are confirmed. However, word of mouth (0.184)
and celebrity endorsement (0.334) are not at significant at p-value <0, 05. Hence, the
hypothesis of H3b and H4b are not supported. To sum up, advertising, sales
promotion, store image and event sponsorship have positive significant affect on
brand association, while word of mouth and celebrity are not.
Moreover, advertising is the highest level of regression coefficient (beta), while sales
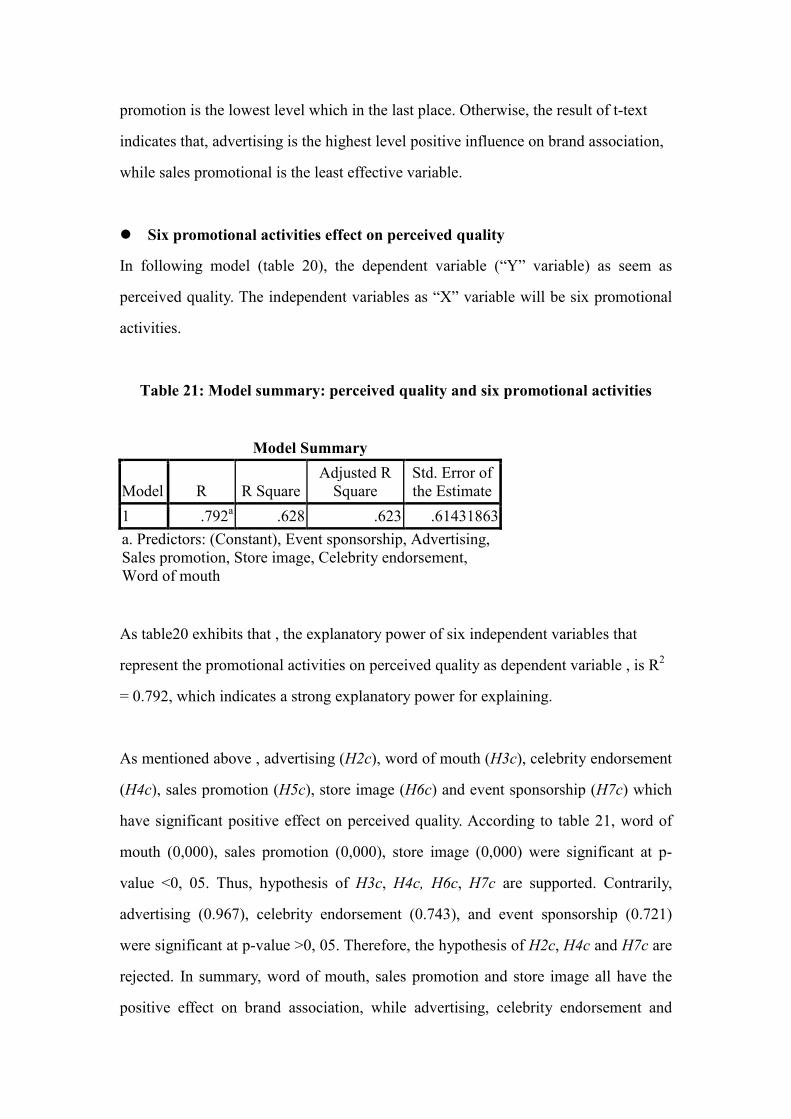
promotion is the lowest level which in the last place. Otherwise, the result of t-text
indicates that, advertising is the highest level positive influence on brand association,
while sales promotional is the least effective variable.
Six promotional activities effect on perceived quality
In following model (table 20), the dependent variable (“Y” variable) as seem as
perceived quality. The independent variables as “X” variable will be six promotional
activities.
Table 21: Model summary: perceived quality and six promotional activities
Model Summary
Model R R Square
Adjusted R
Square
Std. Error of
the Estimate
1 .792a .628 .623 .61431863
a. Predictors: (Constant), Event sponsorship, Advertising,
Sales promotion, Store image, Celebrity endorsement,
Word of mouth
As table20 exhibits that , the explanatory power of six independent variables that
represent the promotional activities on perceived quality as dependent variable , is R2
= 0.792, which indicates a strong explanatory power for explaining.
As mentioned above , advertising (H2c), word of mouth (H3c), celebrity endorsement
(H4c), sales promotion (H5c), store image (H6c) and event sponsorship (H7c) which
have significant positive effect on perceived quality. According to table 21, word of
mouth (0,000), sales promotion (0,000), store image (0,000) were significant at p-
value <0, 05. Thus, hypothesis of H3c, H4c, H6c, H7c are supported. Contrarily,
advertising (0.967), celebrity endorsement (0.743), and event sponsorship (0.721)
were significant at p-value >0, 05. Therefore, the hypothesis of H2c, H4c and H7c are
rejected. In summary, word of mouth, sales promotion and store image all have the
positive effect on brand association, while advertising, celebrity endorsement and
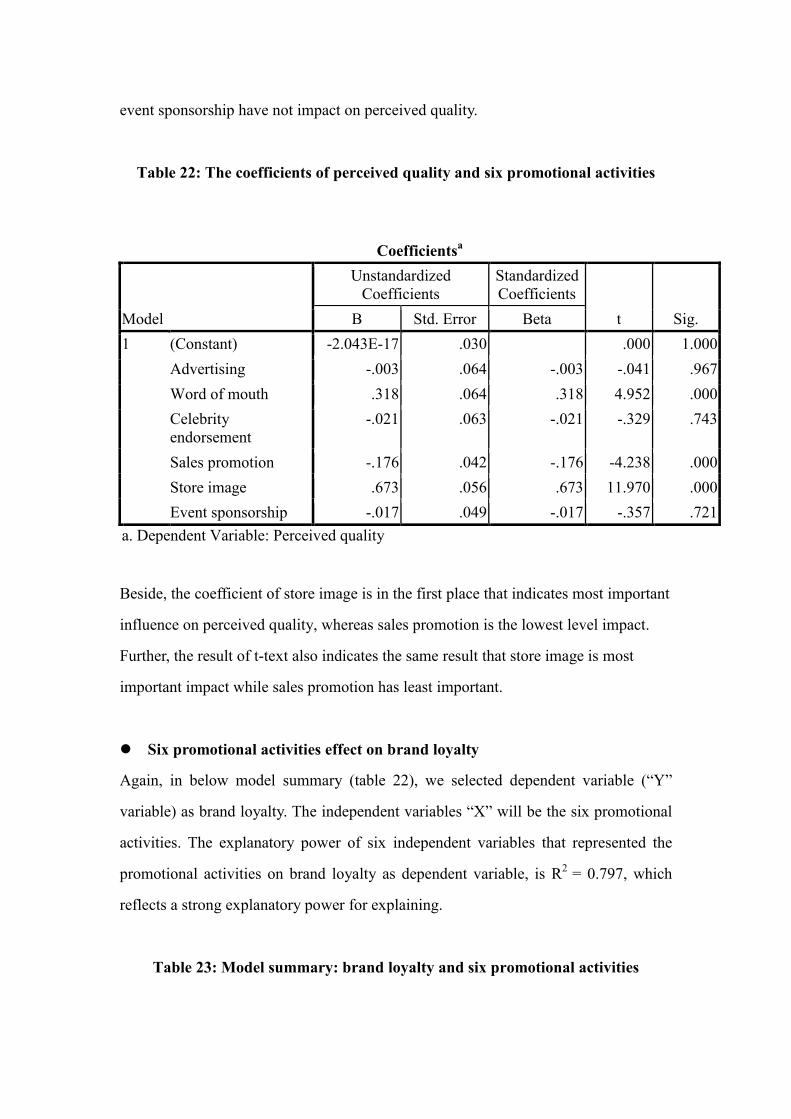
event sponsorship have not impact on perceived quality.
Table 22: The coefficients of perceived quality and six promotional activities
Coefficientsa
Model
Unstandardized
Coefficients
Standardized
Coefficients
t Sig. B Std. Error Beta
1 (Constant) -2.043E-17 .030 .000 1.000
Advertising -.003 .064 -.003 -.041 .967
Word of mouth .318 .064 .318 4.952 .000
Celebrity
endorsement
-.021 .063 -.021 -.329 .743
Sales promotion -.176 .042 -.176 -4.238 .000
Store image .673 .056 .673 11.970 .000
Event sponsorship -.017 .049 -.017 -.357 .721
a. Dependent Variable: Perceived quality
Beside, the coefficient of store image is in the first place that indicates most important
influence on perceived quality, whereas sales promotion is the lowest level impact.
Further, the result of t-text also indicates the same result that store image is most
important impact while sales promotion has least important.
Six promotional activities effect on brand loyalty
Again, in below model summary (table 22), we selected dependent variable (“Y”
variable) as brand loyalty. The independent variables “X” will be the six promotional
activities. The explanatory power of six independent variables that represented the
promotional activities on brand loyalty as dependent variable, is R2
= 0.797, which
reflects a strong explanatory power for explaining.
Table 23: Model summary: brand loyalty and six promotional activities
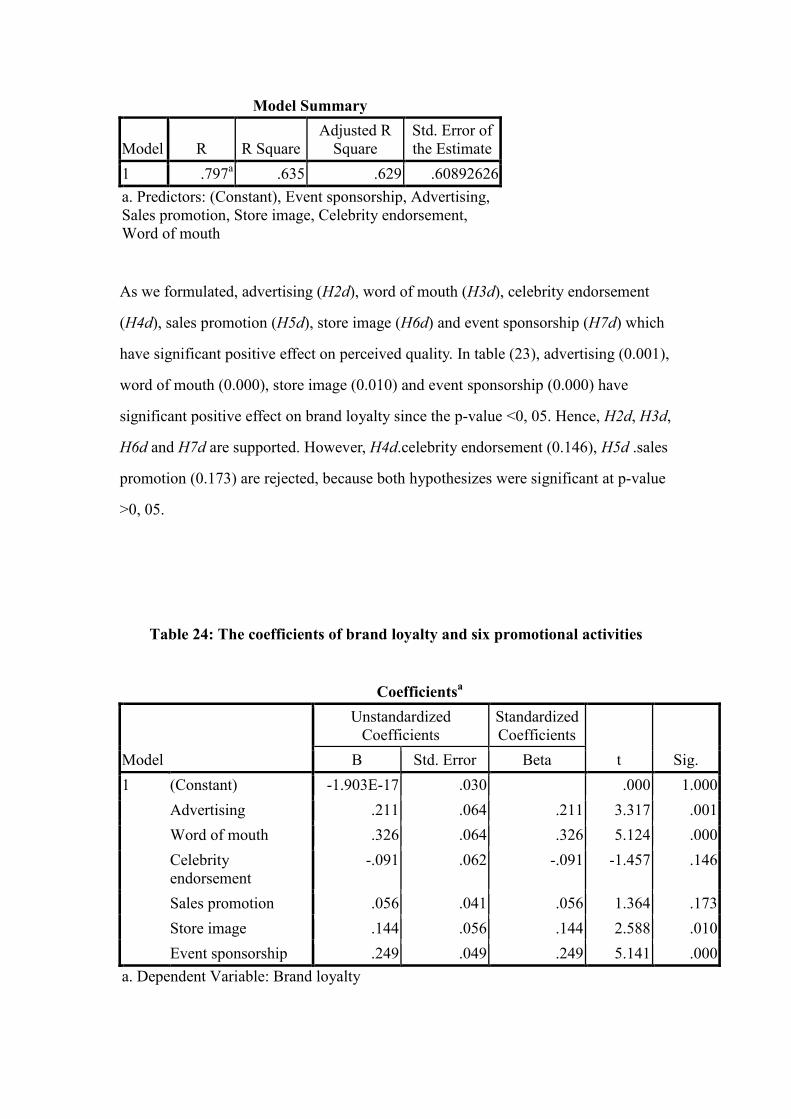
Model Summary
Model R R Square
Adjusted R
Square
Std. Error of
the Estimate
1 .797a .635 .629 .60892626
a. Predictors: (Constant), Event sponsorship, Advertising,
Sales promotion, Store image, Celebrity endorsement,
Word of mouth
As we formulated, advertising (H2d), word of mouth (H3d), celebrity endorsement
(H4d), sales promotion (H5d), store image (H6d) and event sponsorship (H7d) which
have significant positive effect on perceived quality. In table (23), advertising (0.001),
word of mouth (0.000), store image (0.010) and event sponsorship (0.000) have
significant positive effect on brand loyalty since the p-value <0, 05. Hence, H2d, H3d,
H6d and H7d are supported. However, H4d.celebrity endorsement (0.146), H5d .sales
promotion (0.173) are rejected, because both hypothesizes were significant at p-value
>0, 05.
Table 24: The coefficients of brand loyalty and six promotional activities
Coefficientsa
Model
Unstandardized
Coefficients
Standardized
Coefficients
t Sig. B Std. Error Beta
1 (Constant) -1.903E-17 .030 .000 1.000
Advertising .211 .064 .211 3.317 .001
Word of mouth .326 .064 .326 5.124 .000
Celebrity
endorsement
-.091 .062 -.091 -1.457 .146
Sales promotion .056 .041 .056 1.364 .173
Store image .144 .056 .144 2.588 .010
Event sponsorship .249 .049 .249 5.141 .000
a. Dependent Variable: Brand loyalty
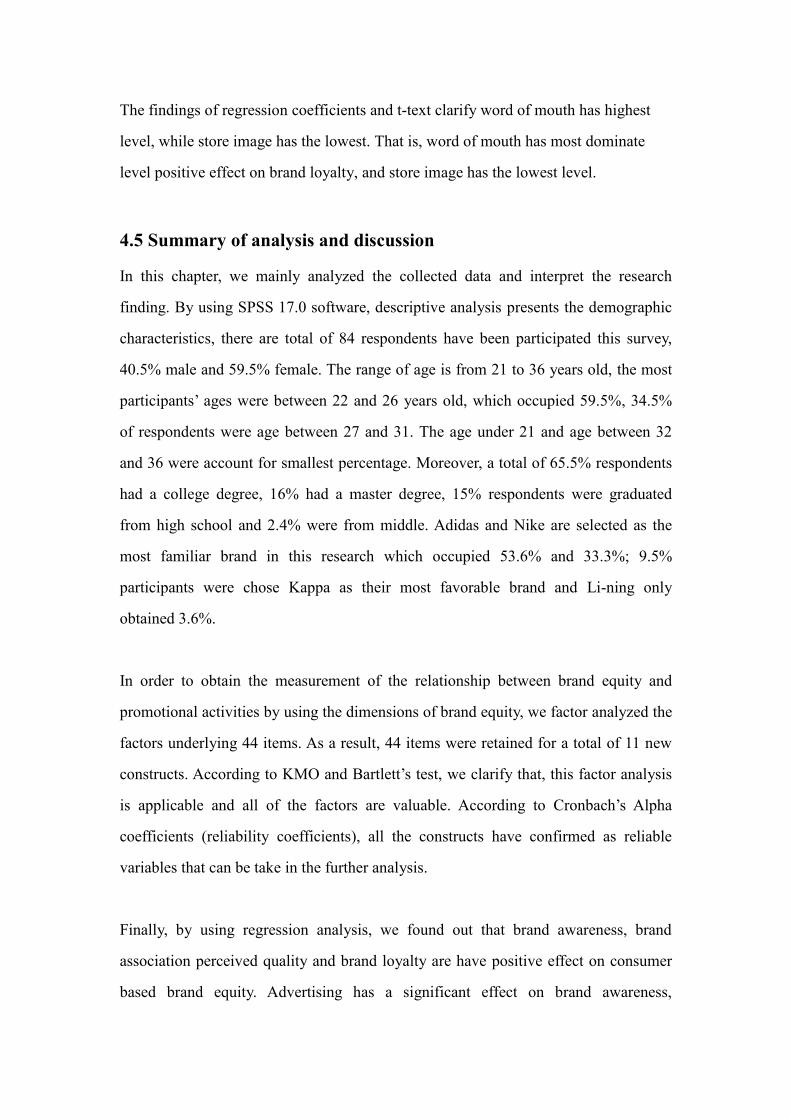
The findings of regression coefficients and t-text clarify word of mouth has highest
level, while store image has the lowest. That is, word of mouth has most dominate
level positive effect on brand loyalty, and store image has the lowest level.
4.5 Summary of analysis and discussion
In this chapter, we mainly analyzed the collected data and interpret the research
finding. By using SPSS 17.0 software, descriptive analysis presents the demographic
characteristics, there are total of 84 respondents have been participated this survey,
40.5% male and 59.5% female. The range of age is from 21 to 36 years old, the most
participants‟ ages were between 22 and 26 years old, which occupied 59.5%, 34.5%
of respondents were age between 27 and 31. The age under 21 and age between 32
and 36 were account for smallest percentage. Moreover, a total of 65.5% respondents
had a college degree, 16% had a master degree, 15% respondents were graduated
from high school and 2.4% were from middle. Adidas and Nike are selected as the
most familiar brand in this research which occupied 53.6% and 33.3%; 9.5%
participants were chose Kappa as their most favorable brand and Li-ning only
obtained 3.6%.
In order to obtain the measurement of the relationship between brand equity and
promotional activities by using the dimensions of brand equity, we factor analyzed the
factors underlying 44 items. As a result, 44 items were retained for a total of 11 new
constructs. According to KMO and Bartlett‟s test, we clarify that, this factor analysis
is applicable and all of the factors are valuable. According to Cronbach‟s Alpha
coefficients (reliability coefficients), all the constructs have confirmed as reliable
variables that can be take in the further analysis.
Finally, by using regression analysis, we found out that brand awareness, brand
association perceived quality and brand loyalty are have positive effect on consumer
based brand equity. Advertising has a significant effect on brand awareness,
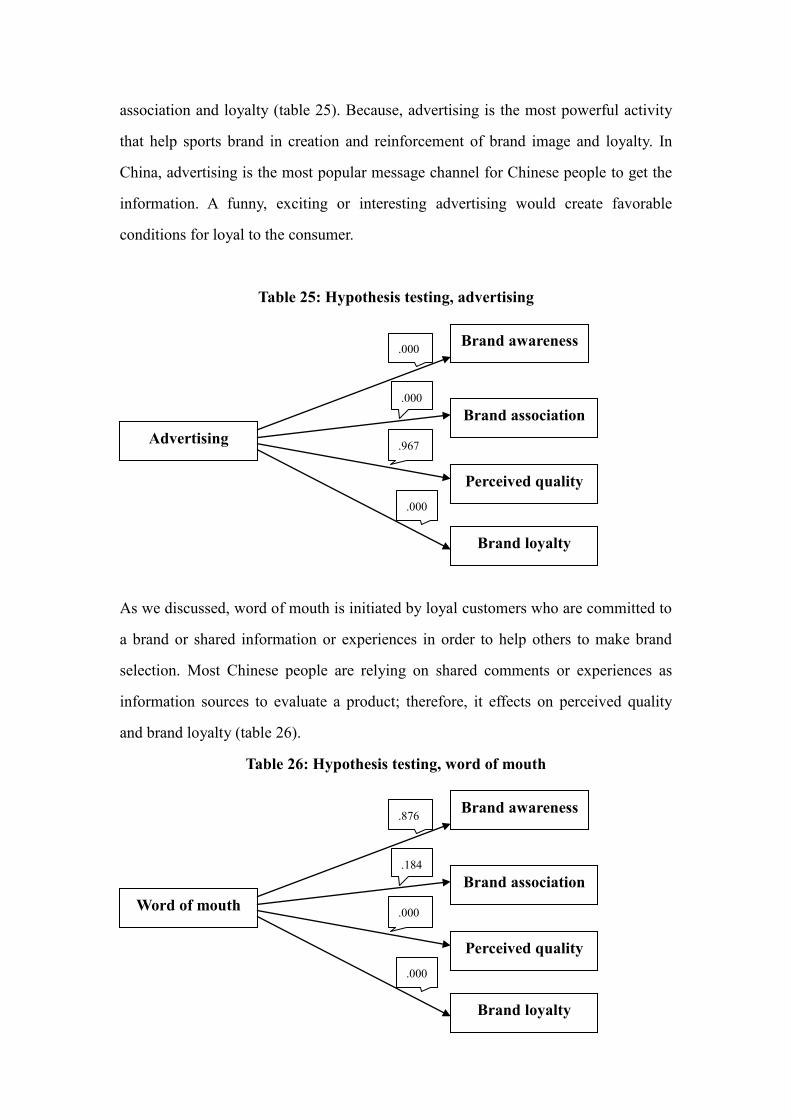
association and loyalty (table 25). Because, advertising is the most powerful activity
that help sports brand in creation and reinforcement of brand image and loyalty. In
China, advertising is the most popular message channel for Chinese people to get the
information. A funny, exciting or interesting advertising would create favorable
conditions for loyal to the consumer.
Table 25: Hypothesis testing, advertising
As we discussed, word of mouth is initiated by loyal customers who are committed to
a brand or shared information or experiences in order to help others to make brand
selection. Most Chinese people are relying on shared comments or experiences as
information sources to evaluate a product; therefore, it effects on perceived quality
and brand loyalty (table 26).
Table 26: Hypothesis testing, word of mouth
Advertising
Brand loyalty
Brand association
Perceived quality
Brand awareness .000
.000
.967
.000
Word of mouth
Brand loyalty
Brand association
Perceived quality
Brand awareness .876
.184
.000
.000
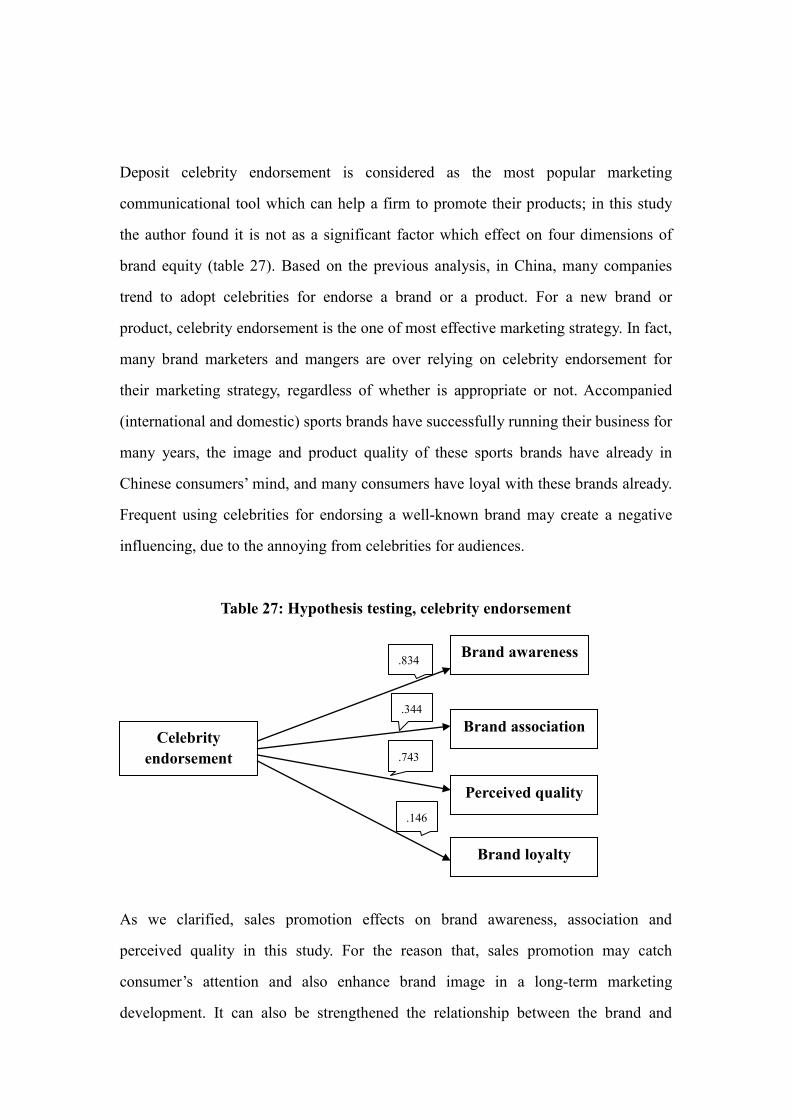
Deposit celebrity endorsement is considered as the most popular marketing
communicational tool which can help a firm to promote their products; in this study
the author found it is not as a significant factor which effect on four dimensions of
brand equity (table 27). Based on the previous analysis, in China, many companies
trend to adopt celebrities for endorse a brand or a product. For a new brand or
product, celebrity endorsement is the one of most effective marketing strategy. In fact,
many brand marketers and mangers are over relying on celebrity endorsement for
their marketing strategy, regardless of whether is appropriate or not. Accompanied
(international and domestic) sports brands have successfully running their business for
many years, the image and product quality of these sports brands have already in
Chinese consumers‟ mind, and many consumers have loyal with these brands already.
Frequent using celebrities for endorsing a well-known brand may create a negative
influencing, due to the annoying from celebrities for audiences.
Table 27: Hypothesis testing, celebrity endorsement
As we clarified, sales promotion effects on brand awareness, association and
perceived quality in this study. For the reason that, sales promotion may catch
consumer‟s attention and also enhance brand image in a long-term marketing
development. It can also be strengthened the relationship between the brand and
Celebrity
endorsement
Brand loyalty
Brand association
Perceived quality
Brand awareness .834
.344
.743
.146
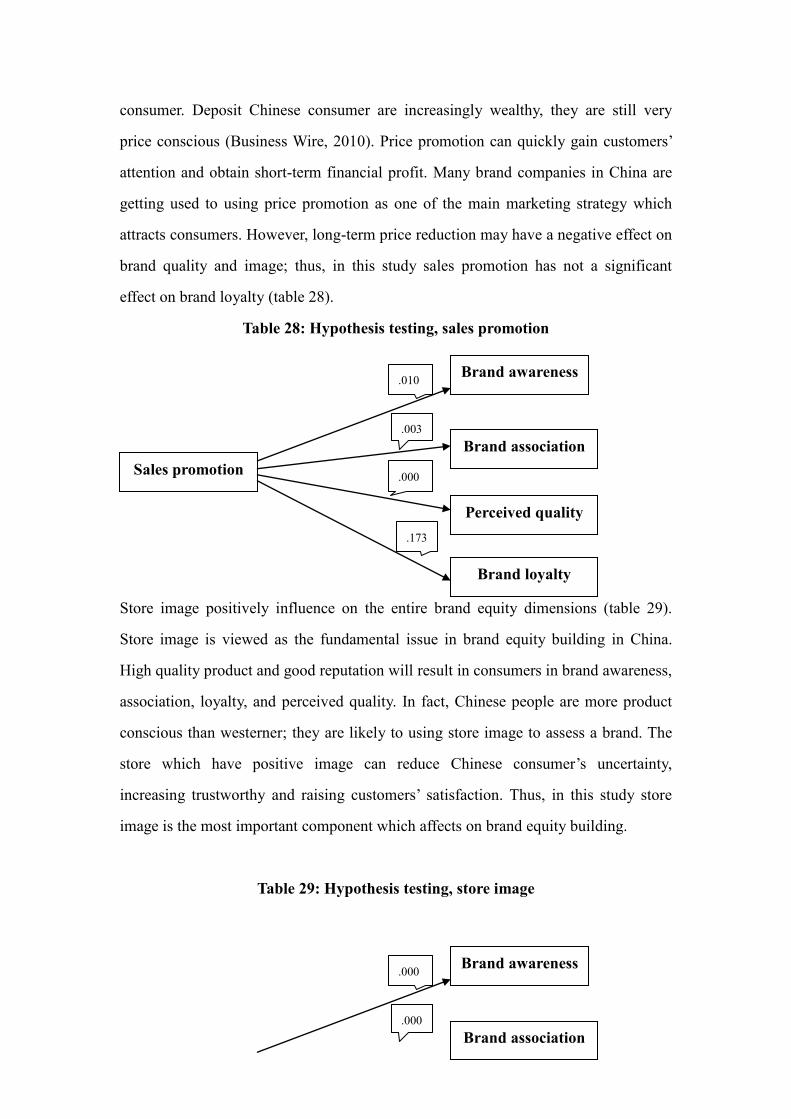
consumer. Deposit Chinese consumer are increasingly wealthy, they are still very
price conscious (Business Wire, 2010). Price promotion can quickly gain customers‟
attention and obtain short-term financial profit. Many brand companies in China are
getting used to using price promotion as one of the main marketing strategy which
attracts consumers. However, long-term price reduction may have a negative effect on
brand quality and image; thus, in this study sales promotion has not a significant
effect on brand loyalty (table 28).
Table 28: Hypothesis testing, sales promotion
Store image positively influence on the entire brand equity dimensions (table 29).
Store image is viewed as the fundamental issue in brand equity building in China.
High quality product and good reputation will result in consumers in brand awareness,
association, loyalty, and perceived quality. In fact, Chinese people are more product
conscious than westerner; they are likely to using store image to assess a brand. The
store which have positive image can reduce Chinese consumer‟s uncertainty,
increasing trustworthy and raising customers‟ satisfaction. Thus, in this study store
image is the most important component which affects on brand equity building.
Table 29: Hypothesis testing, store image
Sales promotion
Brand loyalty
Brand association
Perceived quality
Brand awareness .010
.003
.000
.173
Brand association
Brand awareness .000
.000
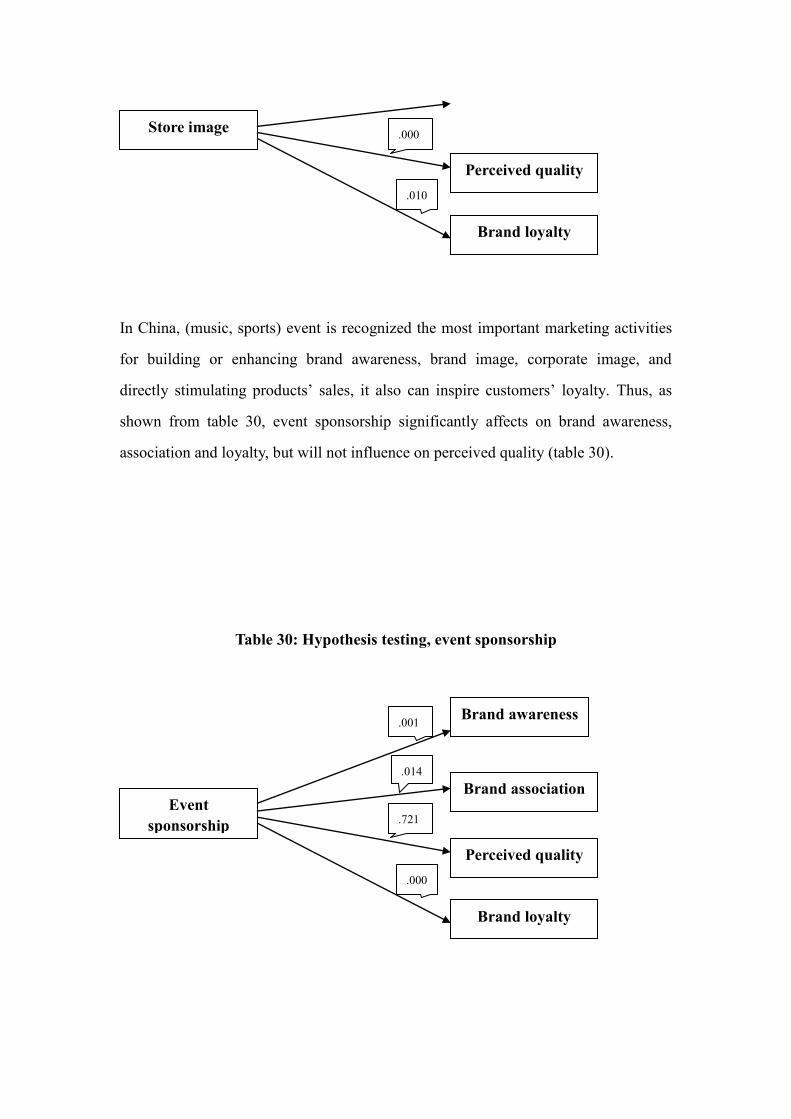
In China, (music, sports) event is recognized the most important marketing activities
for building or enhancing brand awareness, brand image, corporate image, and
directly stimulating products‟ sales, it also can inspire customers‟ loyalty. Thus, as
shown from table 30, event sponsorship significantly affects on brand awareness,
association and loyalty, but will not influence on perceived quality (table 30).
Table 30: Hypothesis testing, event sponsorship
Store image
Brand loyalty
Perceived quality
.000
.010
Event
sponsorship
Brand loyalty
Brand association
Perceived quality
Brand awareness .001
.014
.721
.000
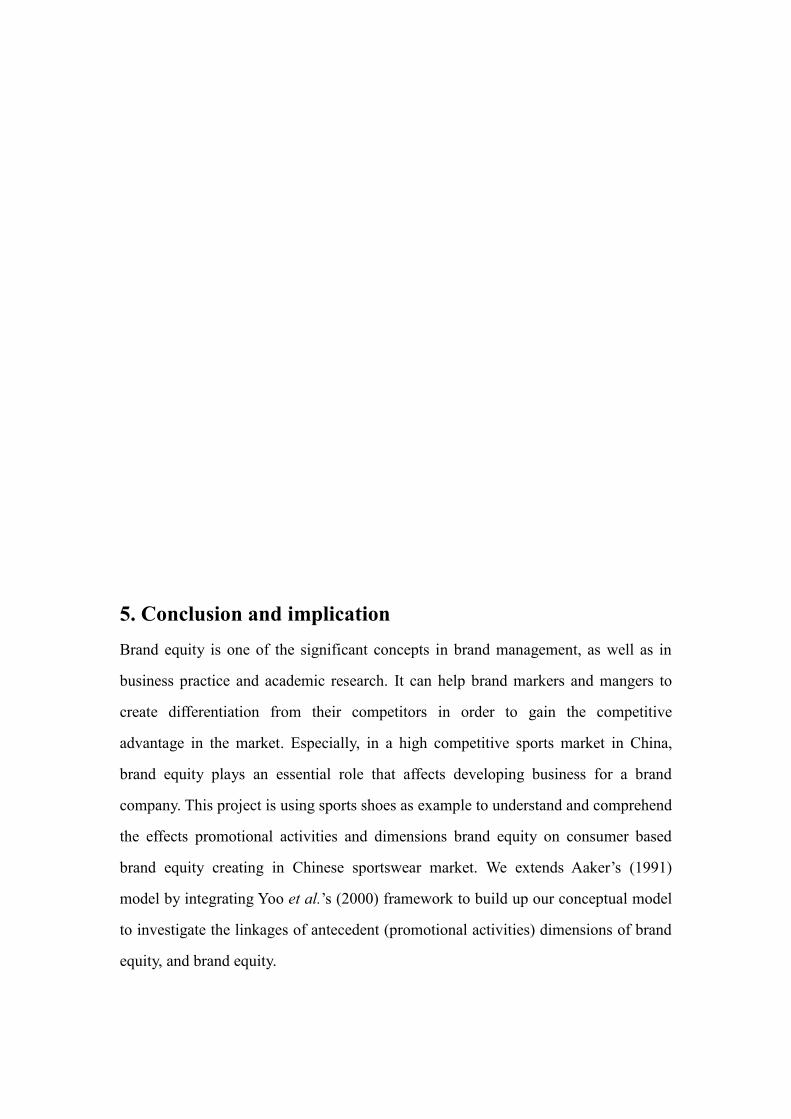
5. Conclusion and implication
Brand equity is one of the significant concepts in brand management, as well as in
business practice and academic research. It can help brand markers and mangers to
create differentiation from their competitors in order to gain the competitive
advantage in the market. Especially, in a high competitive sports market in China,
brand equity plays an essential role that affects developing business for a brand
company. This project is using sports shoes as example to understand and comprehend
the effects promotional activities and dimensions brand equity on consumer based
brand equity creating in Chinese sportswear market. We extends Aaker‟s (1991)
model by integrating Yoo et al.‟s (2000) framework to build up our conceptual model
to investigate the linkages of antecedent (promotional activities) dimensions of brand
equity, and brand equity.
In general, the method of this study is quantitative and objective. We selected young
people as the target group since they are most interest in sport than the other groups
and willing to spend more time and money to buy sports shoes. Based on the
performance and popularity of sportswear product in Chinese market, and consider to
avoiding respondents fatigue, five sport shoes brands such as Adidas, Nike, Kappa,
Li-Ning, and Anta were chosen as product stimuli. The questionnaires survey
administered through the electronic mail and face-to-face interview, after sent total
number of 200 questionnaires to the target group, 84 respondents of data have been
returned.
Through software SPSS 17.0 statistically analysis data, we found out that, four brand
equity dimensions are all affect on brand equity, this finding is consistent with as prior
research i.e., Marinova et al. (2011); Yoo et al. (2000); Tong and Hawley (2009); and
Erenkol and Duygun (2010). Store image is positively influence on the entire brand
equity dimensions. However, while celebrity endorsement is recognized as most
popular marketing communicational tool which can help for a firm to promote their
product, but it actually not has the positive impact on dimensions of brand equity in
this study. The rest of promotional activities such as advertising, word of mouth, sales
promotion and event sponsorship all have different significant effect on each brand
equity dimensions (See table 24, the conclusion of structural model).
Table 25: Conclusion of structural model
Hypothesis Sig. Conclusio
n H1a. Brand awareness brand equity .000 Supported
H1b. Brand association brand equity .018 Supported
H1c. Perceived quality brand equity .000 Supported
H1d. Brand loyalty brand equity .000 Supported
H2a. Advertising brand awareness .000 Supported
H2b. Advertising brand association .000 Supported
H2c. Advertising perceived quality .967 Not
supported
H2d. Advertising brand loyalty .001 Supported
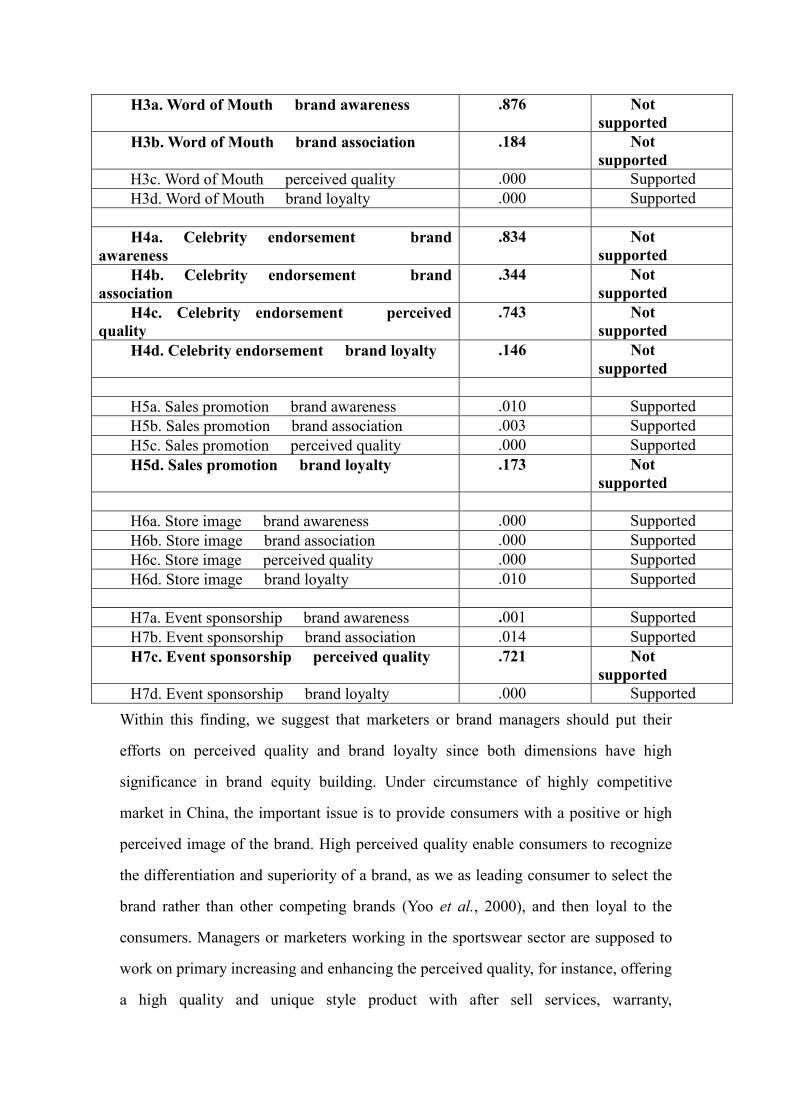
H3a. Word of Mouth brand awareness .876 Not
supported
H3b. Word of Mouth brand association .184 Not
supported
H3c. Word of Mouth perceived quality .000 Supported
H3d. Word of Mouth brand loyalty .000 Supported
H4a. Celebrity endorsement brand
awareness
.834 Not
supported
H4b. Celebrity endorsement brand
association
.344 Not
supported
H4c. Celebrity endorsement perceived
quality
.743 Not
supported
H4d. Celebrity endorsement brand loyalty .146 Not
supported
H5a. Sales promotion brand awareness .010 Supported
H5b. Sales promotion brand association .003 Supported
H5c. Sales promotion perceived quality .000 Supported
H5d. Sales promotion brand loyalty .173 Not
supported
H6a. Store image brand awareness .000 Supported
H6b. Store image brand association .000 Supported
H6c. Store image perceived quality .000 Supported
H6d. Store image brand loyalty .010 Supported
H7a. Event sponsorship brand awareness .001 Supported
H7b. Event sponsorship brand association .014 Supported
H7c. Event sponsorship perceived quality .721 Not
supported
H7d. Event sponsorship brand loyalty .000 Supported
Within this finding, we suggest that marketers or brand managers should put their
efforts on perceived quality and brand loyalty since both dimensions have high
significance in brand equity building. Under circumstance of highly competitive
market in China, the important issue is to provide consumers with a positive or high
perceived image of the brand. High perceived quality enable consumers to recognize
the differentiation and superiority of a brand, as we as leading consumer to select the
brand rather than other competing brands (Yoo et al., 2000), and then loyal to the
consumers. Managers or marketers working in the sportswear sector are supposed to
work on primary increasing and enhancing the perceived quality, for instance, offering
a high quality and unique style product with after sell services, warranty,
reimbursement in order to providing high quality perceived to the consumers, as well
as consistent with other dimensions, i.e., brand awareness, brand association. The
effective promotional activities such as advertising, word of mouth, sales promotion,
store image and event sponsorship that would be helped in building high perceived
quality and loyalty for a brand. Especially, building a positive store image can also
reduce Chinese consumer‟s uncertainty, increasing trustworthy and raising customers‟
satisfaction.
6. Limitation and suggestion for future research
This research is only examined the relationship between brand equity and promotional
activities by using of the dimensions of brand equity. As we have mentioned, the
collecting data is using non-profitability sampling that only in one large city in
Northeast China, Shenyang. Therefore, the result only represented the behavior and
attitude from Northeast Chinese; it may not precisely indicate the Chinese sportswear
market in general. China is a very big country, different cities and different region
have many different behaviors, attitudes and culture. Further research should take
more respondents from different cities in order to analyze the data more precise.
Moreover, due to lack of time for data collecting, this study only acquired 84
respondents for investigation, so that further research needs to spend more time in
order to obtain more respondents for precisely investigation.
Reference
Aaker, D. A. (1991) Managing Brand Equity. The Free Press, New York.
Aaker, D. A. (1986) Measuring brand equity across products and markets. California
Management Review, Vol.38, No. 3, Pg 102.
Arbnor, I and Bjerke, B., (1997) Methodology for creating business knowledge. Sage
Publications, 2nd
ed.
Bloemer, J.,and De Ruyter, K. (1997) On the relationship between store image, store
satisfaction and store loyal. European Journal of Marketing, Vol. 32 Iss: 5/6, pp.499 -
513
Burrell, G. and Morgan, G., (1979) Sociological Paradigms and Organisational
Analysis: elements of the sociology of corporate life, London: Heinemann.
Business Wire (2010) Research and markets: OTC Sportswear retailing in China
2010-The total sportswear retail market is estimated to reach RMB 124.20bn by the
end of 2010. New York.
Chen, C, F. and Tseng, W, S. (2010) Exploring customer-based airline brand equity:
evidence from Taiwan. Transportation Journal, Vol. 49, Pg.29 (11).
Cobb-Walgren CJ, Beal C, Donthu N. (1995) Brand equity, brand preference, and
purchase intent. J Advertising; 24(3):25 ±40.
Cornelius, B., Natter, M., and Faure, C.(2010). How storefront displays influence
retail store image. Journal of Retailing and Customer Services. Vol.17 Pg. 143-151.
De Bruyn, A., and Lilien, G. (2008). A mulit-stage model of word of mouth influence
through viral marketing. International Journal of Research in Marketing, Vol. 25, Iss.
3, Pg 151-163.
Delvecchio, D., Henard, D, H., and Freling, T, H. (2006). The effect of sales
promotion on post-promotion brand preference: A meta-analysis. Journal of Retailing.
82, 203-213.
Erenkol, A, D. and Duygun, A. (2010) Customers‟ perceived brand equity and a
research on the customers of Bellona which is a Turkish furniture brand, The Journal
of American Academy of Business, Vol.16, No. 1.
Faircloth, J, B., Capella, L, M., and Alford, B, L. (2001) The effect of brand attitude
and brand image on brand equity. Journal of Marketing Theory and Practice, Vol. 9,
Iss. 3, Pg, 61.
Javalgi, R, G., Traylor, M, B., Gross, A, C., and Lampman, E.(1994). Awareness of
sponsorship and corporate image: An empirical investigation. Journal of Advertising.
Vol.23, Iss. 4, Pg. 47.
Keller, K.L. (1993) Conceptualizing, measuring and managing customer-based brand
equity. Journal of Marketing, Vol.57, No. 1, Pg 1-22.
Keller, K.L. (2002) Strategic brand management: building, measuring, and
Management brand equity, 2nd
ed., Pearson Education, Upper Saddle River, NJ.
Kim, K, H., Kim, K, S., Kim, D, Y., Kim, J, H., and Kang, S, H. (2008) Brand equity
in hospital marketing. Journal of Business Research, Vol. 61, Issue 1, pp 75-82
Kotler, P. and Keller, K, L. (2006) Marketing management. 12th edition, Pearson
education,Inc., Upper saddle river, New Jersey.
Hao, L., Gao, C., and Liu, Z. (2007) Customer-based brand equity and improvement
strategy for mobile phone brands: Foreign versus local in the Chinese market.
International Management Review. Vol. 3, Iss. 3; pg. 76, 9 pgs
Henseler, J., Wilson, B., and Westberg, K. (2011). Managers‟ perception of the
imapact of sport sponsorship on brand equity: which aspect of sponsorship matter
most? Sport Marketing Quarterly. Vol. 20, No. 1, Pg. 7-21.
Hollensen, S. (2007) Global Marketing: A Decision Oriented Approach. 4th edition.
Edinburgh Gate: Pearson Education Limited
Huang, R., and Sarigöllü, E. (2011) How brand awareness relates to market outcome,
brand equity, and the marketing mix. Journal of Business Research, 07136.
Li, B. (2009) Chinese sportswear battle intensifies. Media, Pg 5. Hong Kong.
Li, H., Jin, H., and Yuan, G. (2011) Research on brand equity of sports---take the
replacement of the brand Lining as example. Journal of Sustainable Development,
Vol. 4, No. 1.
Lim, B, C., and Chung, M, Y. (2011) The impact of word-of–mouth communication
on attribute evaluation. Journal of Business Research. 64, 18-23.
Malhotra, N.K. and Birks, D.F. (2006) Marketing research: An applied Approach.
Updated 2nd
European edition. FT Prentice Hall. Financial times.
Marinova, S., Cui, J., Marinov, M., and Shiu, E. (2011) Customers relationship and
brand equity: A study of bank retailing in China. WBC, poznau, 6-9.
Mazzarol, T., Sweeney, J, C., and Soutar, G, N. (2007) Conceptualizing word-of –
mouth activity, triggers and conditions: an exploratory study. European Journal of
Marketing. Vol. 41, Iss. 11/12; pg. 1475
McCracken, G. (1989) Who is the Celebrity Endorser? Cultural Foundations of the
Endorsement Process. The Journal of Consumer Research, Vol. 16, No. 3
Martineau, P. (1958). The personality of the retail store. Harvard Bus. Rev. 36 pp. 47–
55.
Miller, D.C. and Salkind, N.J. (2002) Handbook of research Design and Social
Measurement. 6th
edition. Thousand Oaks, CA:Sage.
Nelson, O. (2010) Celebrity advertising and its effectiveness on brand loyalty.
Interdisciplinary Journal of Contemporary Research in Business. Vol.1, No.9.
Ntoumanis, N. (2001) A step by step guide to SPSS for sport and exercise studies.
London and New York: Routledge.
Nunnally, J. (1978) Psychometric Theory, McGraw-Hill Series in Psychology, New
York.
Oliver RL. (1997) Satisfaction: A Behavioral Perspective on the Consumer. New
York: McGraw-Hill.
O'Mahony, S and Meenaghan, T., (1997/1998) The imapct of celebrity endorsements
on consumers. Irish marketing review. Dublin, Vol. 10, Iss. 2; pg. 15, 10 pgs
Parauraman, A. (1991) Marketing Research. 2nd
edition. Addison-Wesley
Park C, S., and Srinivasan, V. (1994). A survey-based method for measuring and
understanding brand equity and its extendibility. Journal of Marketing Research, 31, P
271-288.
Shih, T, Y. (2010). Comparative analysis of marketing strategies for manufactures‟
and retailer‟ brands. International Journal of Electronic Business Management. Vol.8,
No. 1, Pg. 56-57.
Summers, G.F. (1970) Attitude Measurement. 1st edition.Chicago: Rand McNally.
The economist (2003) Business: „just do it‟ Chinese-style; China and brand. Vol. 368,
No. 8335, Pg. 67.
Tong, X. and Hawley, J. M. (2009) Measuring customer-based brand equity: empirical
evidence from the sportswear market in China, Journal of Product and Brand
Management, 18(4), 262-271.
Veal, A.J. (2006) Research methods for leisure and tourism- a practical guide. Third
edition; Prentice Hall.
Wang, H., Wei, Y., and Yu, C. (2008) Global brand equity model: customer-based with
product-market outcome approaches. Journal of Product Management,17/5,305-316.
Xu, J, B., and Chen, A. (2010) A conceptual framework of hotel experience and
customers-based brand equity. International Journal of Contemporary Hospitality
Management, Vol. 22, No. 2, Pg 174-193.
Yoo, B. (1996) The effects of marketing efforts and culture on brand equity formation,
Georgia State University.
Yoo,B., Donthu, N., and Lee, S., (2000) An Examination of Selected Marketing Mix
Elements and Brand Equity. Journal of the Academy of Marketing Science, 28 (2):
195-211.
Yoo,B., and Donthu, N.(2001) Developing and validating a multidimesional
consumer- based brand eqiuty scale. Journal of Business Research, Vol. 52, Issue 1, p
1-14.
Zeithaml, V. (1988) Consumer perception of price, quality and the value. A mean-end
and synthesis of evidence. Journal of Marketing, 52(2),2-22.
Appendix
Appendix A. English version questionnaire
1. Gender: _____
1. Male 2. Female
2. Age: ________
1. Under 21 2. 22 to 26 3. 27 to 31 4. 32 to 36 5. Over 36
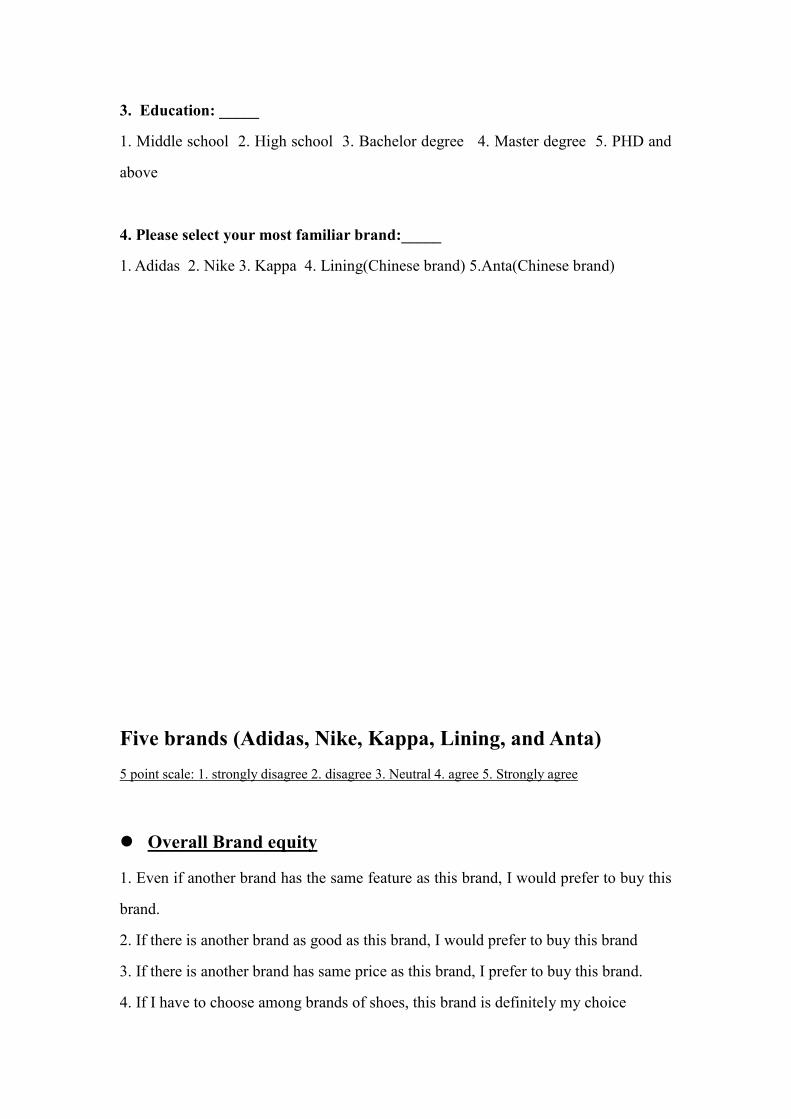
3. Education: _____
1. Middle school 2. High school 3. Bachelor degree 4. Master degree 5. PHD and
above
4. Please select your most familiar brand:_____
1. Adidas 2. Nike 3. Kappa 4. Lining(Chinese brand) 5.Anta(Chinese brand)
Five brands (Adidas, Nike, Kappa, Lining, and Anta)
5 point scale: 1. strongly disagree 2. disagree 3. Neutral 4. agree 5. Strongly agree
Overall Brand equity
1. Even if another brand has the same feature as this brand, I would prefer to buy this
brand.
2. If there is another brand as good as this brand, I would prefer to buy this brand
3. If there is another brand has same price as this brand, I prefer to buy this brand.
4. If I have to choose among brands of shoes, this brand is definitely my choice
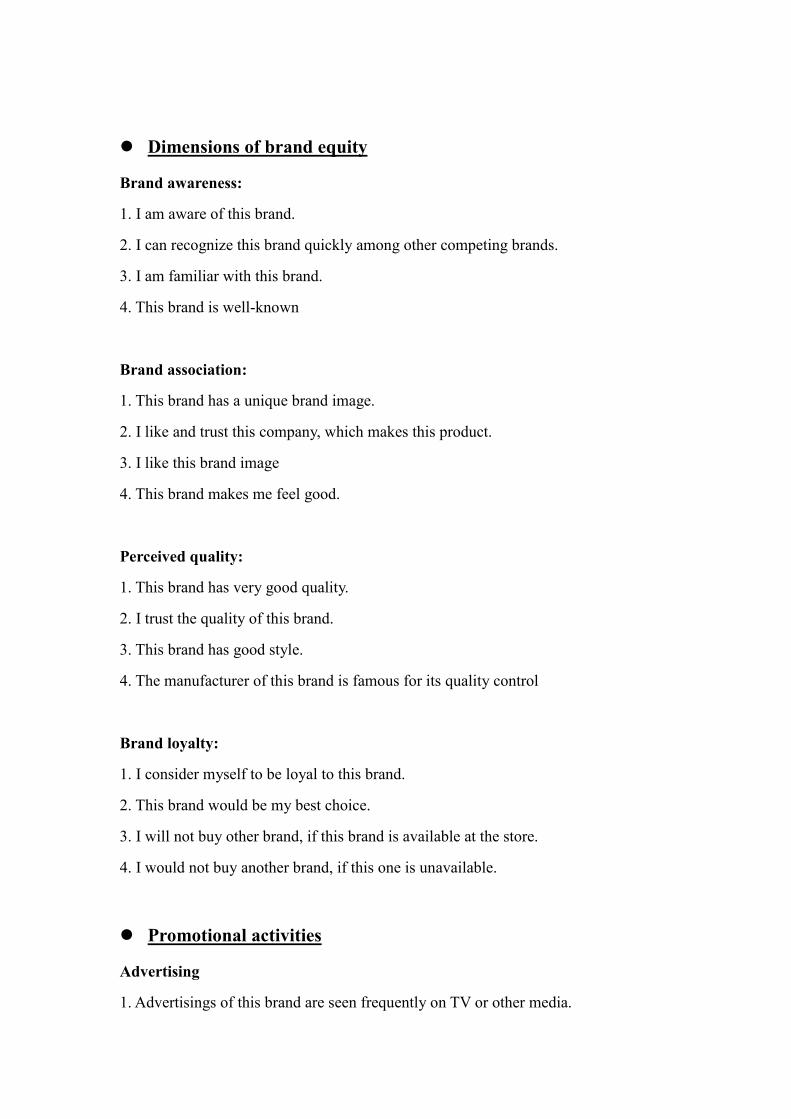
Dimensions of brand equity
Brand awareness:
1. I am aware of this brand.
2. I can recognize this brand quickly among other competing brands.
3. I am familiar with this brand.
4. This brand is well-known
Brand association:
1. This brand has a unique brand image.
2. I like and trust this company, which makes this product.
3. I like this brand image
4. This brand makes me feel good.
Perceived quality:
1. This brand has very good quality.
2. I trust the quality of this brand.
3. This brand has good style.
4. The manufacturer of this brand is famous for its quality control
Brand loyalty:
1. I consider myself to be loyal to this brand.
2. This brand would be my best choice.
3. I will not buy other brand, if this brand is available at the store.
4. I would not buy another brand, if this one is unavailable.
Promotional activities
Advertising
1. Advertisings of this brand are seen frequently on TV or other media.
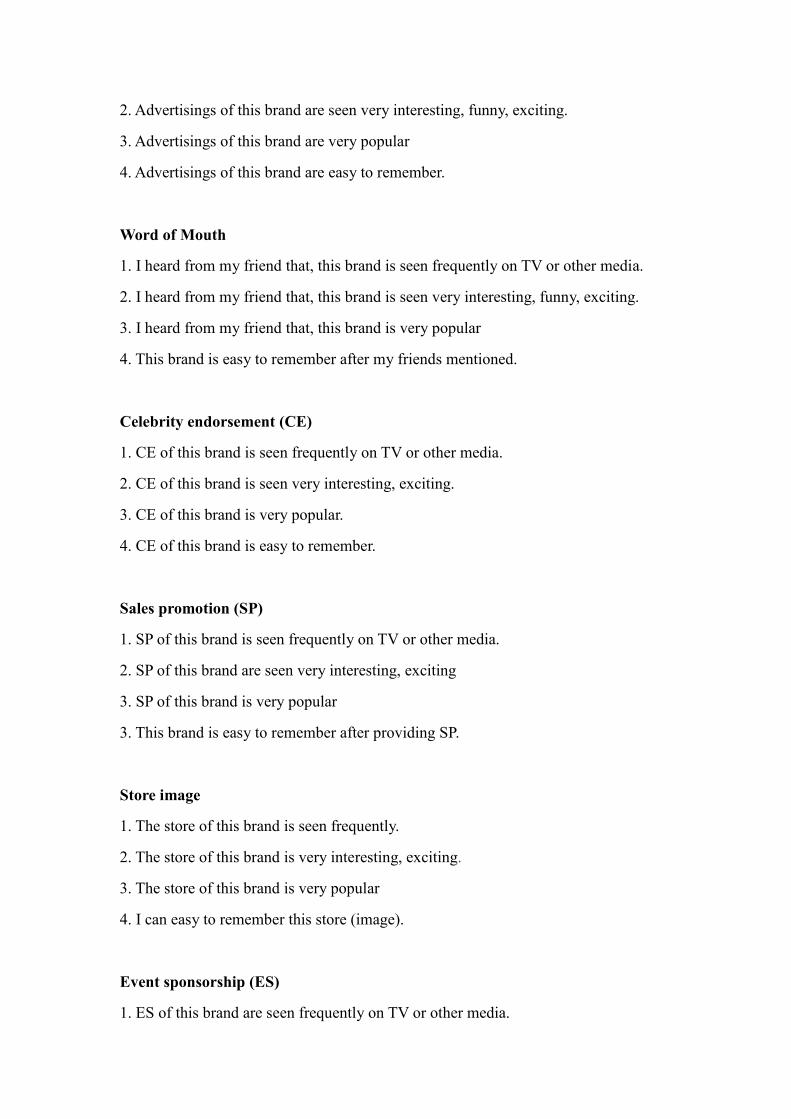
2. Advertisings of this brand are seen very interesting, funny, exciting.
3. Advertisings of this brand are very popular
4. Advertisings of this brand are easy to remember.
Word of Mouth
1. I heard from my friend that, this brand is seen frequently on TV or other media.
2. I heard from my friend that, this brand is seen very interesting, funny, exciting.
3. I heard from my friend that, this brand is very popular
4. This brand is easy to remember after my friends mentioned.
Celebrity endorsement (CE)
1. CE of this brand is seen frequently on TV or other media.
2. CE of this brand is seen very interesting, exciting.
3. CE of this brand is very popular.
4. CE of this brand is easy to remember.
Sales promotion (SP)
1. SP of this brand is seen frequently on TV or other media.
2. SP of this brand are seen very interesting, exciting
3. SP of this brand is very popular
3. This brand is easy to remember after providing SP.
Store image
1. The store of this brand is seen frequently.
2. The store of this brand is very interesting, exciting.
3. The store of this brand is very popular
4. I can easy to remember this store (image).
Event sponsorship (ES)
1. ES of this brand are seen frequently on TV or other media.
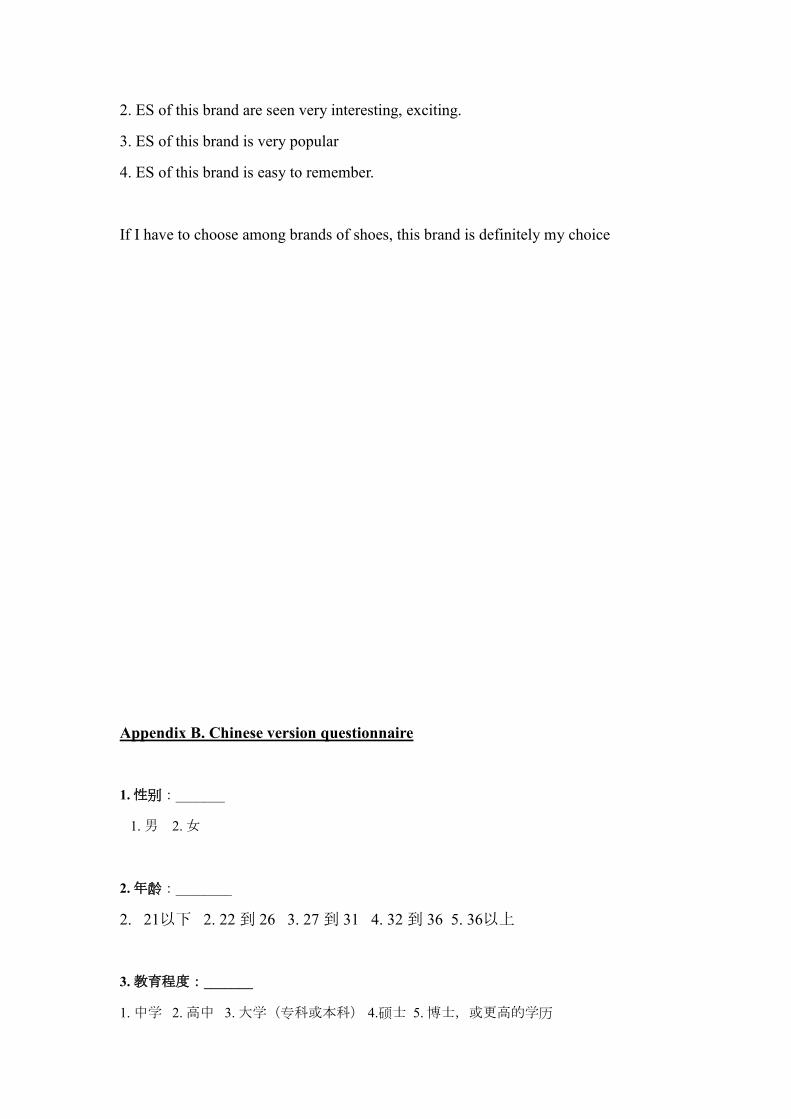
2. ES of this brand are seen very interesting, exciting.
3. ES of this brand is very popular
4. ES of this brand is easy to remember.
If I have to choose among brands of shoes, this brand is definitely my choice
Appendix B. Chinese version questionnaire
1. 性别:_______
1. 男 2. 女
2. 年龄:________
2. 21以下 2. 22 到 26 3. 27 到 31 4. 32 到 36 5. 36以上
3. 教育程度:_______
1. 中学 2. 高中 3. 大学(专科或本科) 4.硕士 5. 博士,或更高的学历
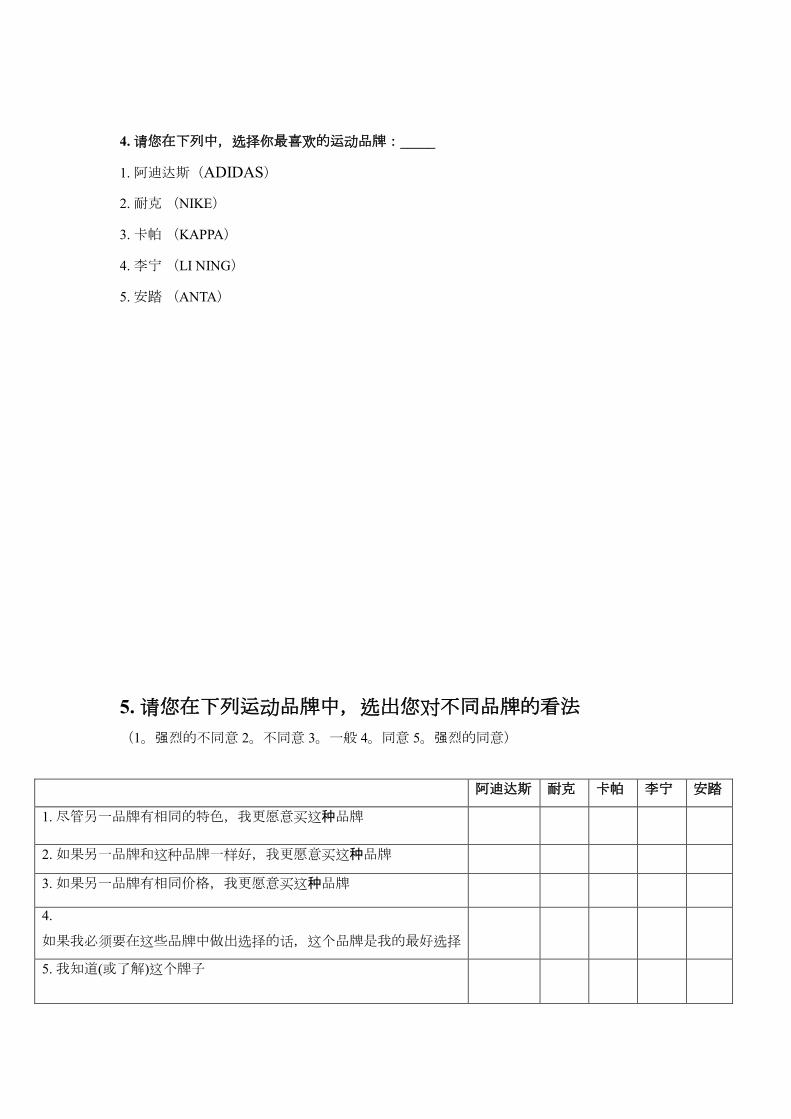
4. 请您在下列中,选择你最喜欢的运动品牌:_____
1. 阿迪达斯(ADIDAS)
2. 耐克 (NIKE)
3. 卡帕 (KAPPA)
4. 李宁 (LI NING)
5. 安踏 (ANTA)
5. 请您在下列运动品牌中,选出您对不同品牌的看法
(1。强烈的不同意 2。不同意 3。一般 4。同意 5。强烈的同意)
阿迪达斯 耐克 卡帕 李宁 安踏
1. 尽管另一品牌有相同的特色,我更愿意买这种品牌
2. 如果另一品牌和这种品牌一样好,我更愿意买这种品牌
3. 如果另一品牌有相同价格,我更愿意买这种品牌
4.
如果我必须要在这些品牌中做出选择的话,这个品牌是我的最好选择
5. 我知道(或了解)这个牌子
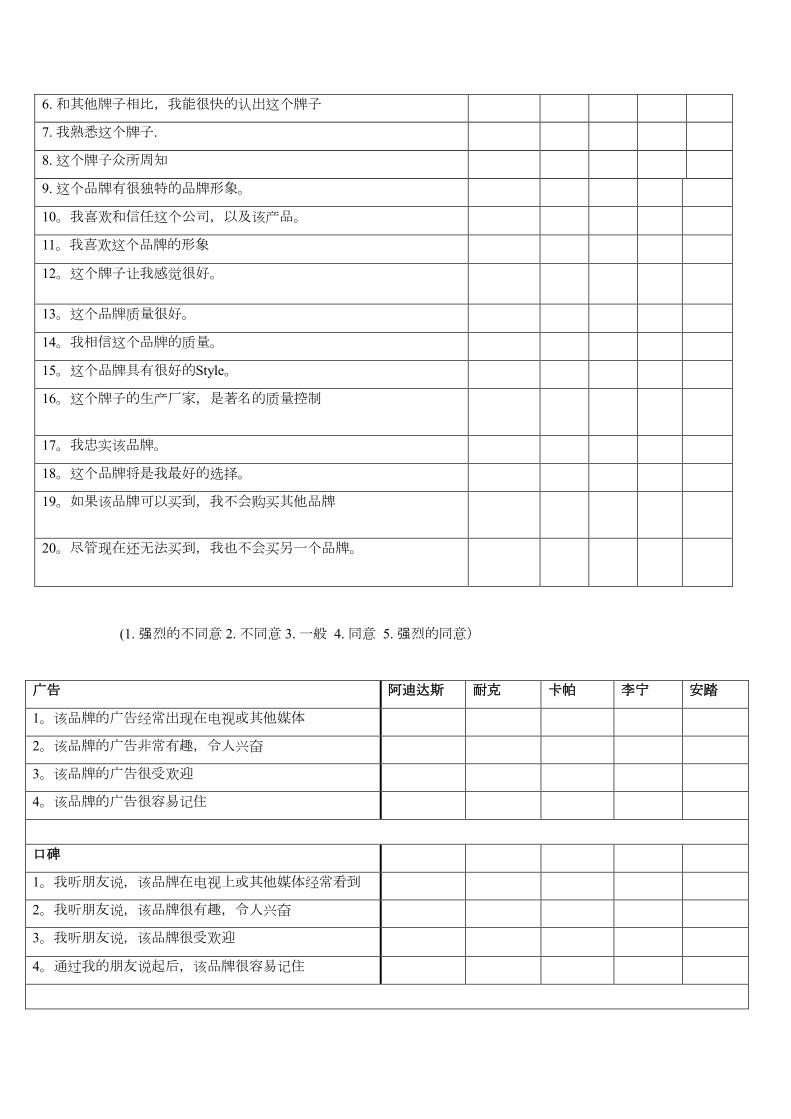
6. 和其他牌子相比,我能很快的认出这个牌子
7. 我熟悉这个牌子.
8. 这个牌子众所周知
9. 这个品牌有很独特的品牌形象。
10。我喜欢和信任这个公司,以及该产品。
11。我喜欢这个品牌的形象
12。这个牌子让我感觉很好。
13。这个品牌质量很好。
14。我相信这个品牌的质量。
15。这个品牌具有很好的Style。
16。这个牌子的生产厂家,是著名的质量控制
17。我忠实该品牌。
18。这个品牌将是我最好的选择。
19。如果该品牌可以买到,我不会购买其他品牌
20。尽管现在还无法买到,我也不会买另一个品牌。
(1. 强烈的不同意 2. 不同意 3. 一般 4. 同意 5. 强烈的同意)
广告 阿迪达斯 耐克 卡帕 李宁 安踏
1。该品牌的广告经常出现在电视或其他媒体
2。该品牌的广告非常有趣,令人兴奋
3。该品牌的广告很受欢迎
4。该品牌的广告很容易记住
口碑
1。我听朋友说,该品牌在电视上或其他媒体经常看到
2。我听朋友说,该品牌很有趣,令人兴奋
3。我听朋友说,该品牌很受欢迎
4。通过我的朋友说起后,该品牌很容易记住
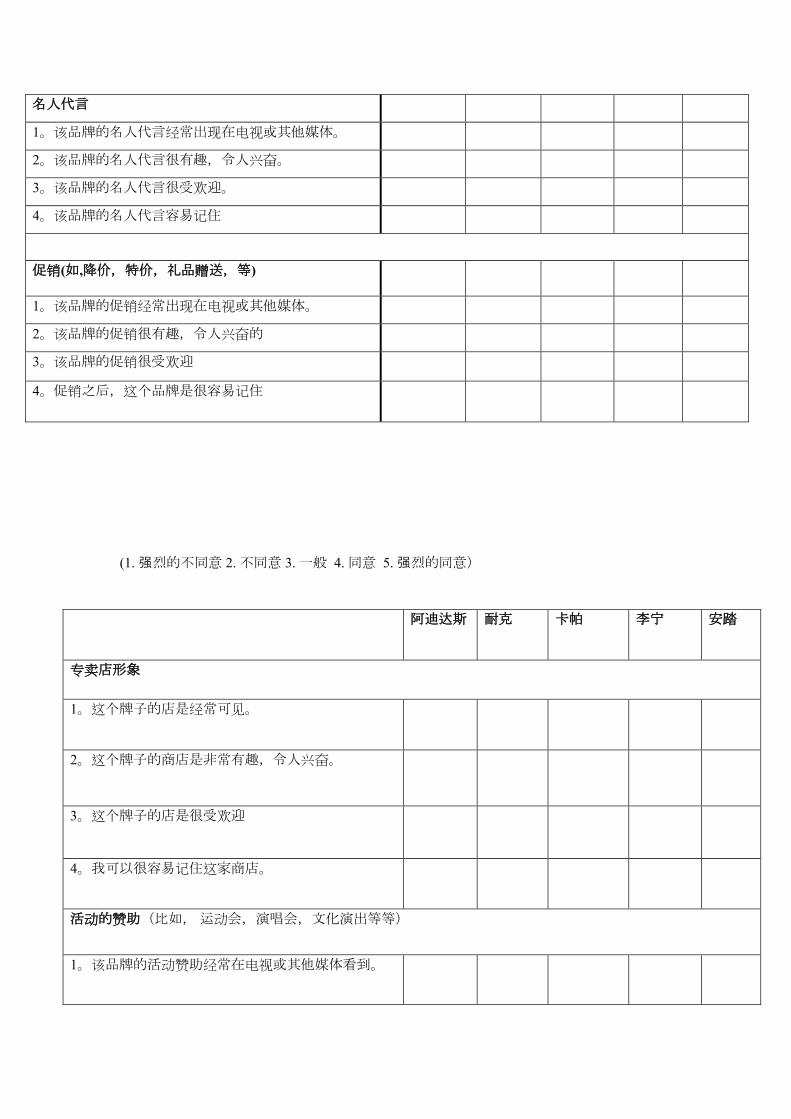
名人代言
1。该品牌的名人代言经常出现在电视或其他媒体。
2。该品牌的名人代言很有趣,令人兴奋。
3。该品牌的名人代言很受欢迎。
4。该品牌的名人代言容易记住
促销(如,降价,特价,礼品赠送,等)
1。该品牌的促销经常出现在电视或其他媒体。
2。该品牌的促销很有趣,令人兴奋的
3。该品牌的促销很受欢迎
4。促销之后,这个品牌是很容易记住
(1. 强烈的不同意 2. 不同意 3. 一般 4. 同意 5. 强烈的同意)
阿迪达斯 耐克 卡帕 李宁 安踏
专卖店形象
1。这个牌子的店是经常可见。
2。这个牌子的商店是非常有趣,令人兴奋。
3。这个牌子的店是很受欢迎
4。我可以很容易记住这家商店。
活动的赞助(比如, 运动会,演唱会,文化演出等等)
1。该品牌的活动赞助经常在电视或其他媒体看到。

2。该品牌的活动赞助很有趣,令人兴奋。
3。该品牌的活动赞助非常受欢迎
4。该品牌的活动赞助容易记住。
非常感谢您在百忙之中对于此次问卷调查的配合与参与!
Appendix C. data analysis
1. Descriptive analysis
Gender :
Age:
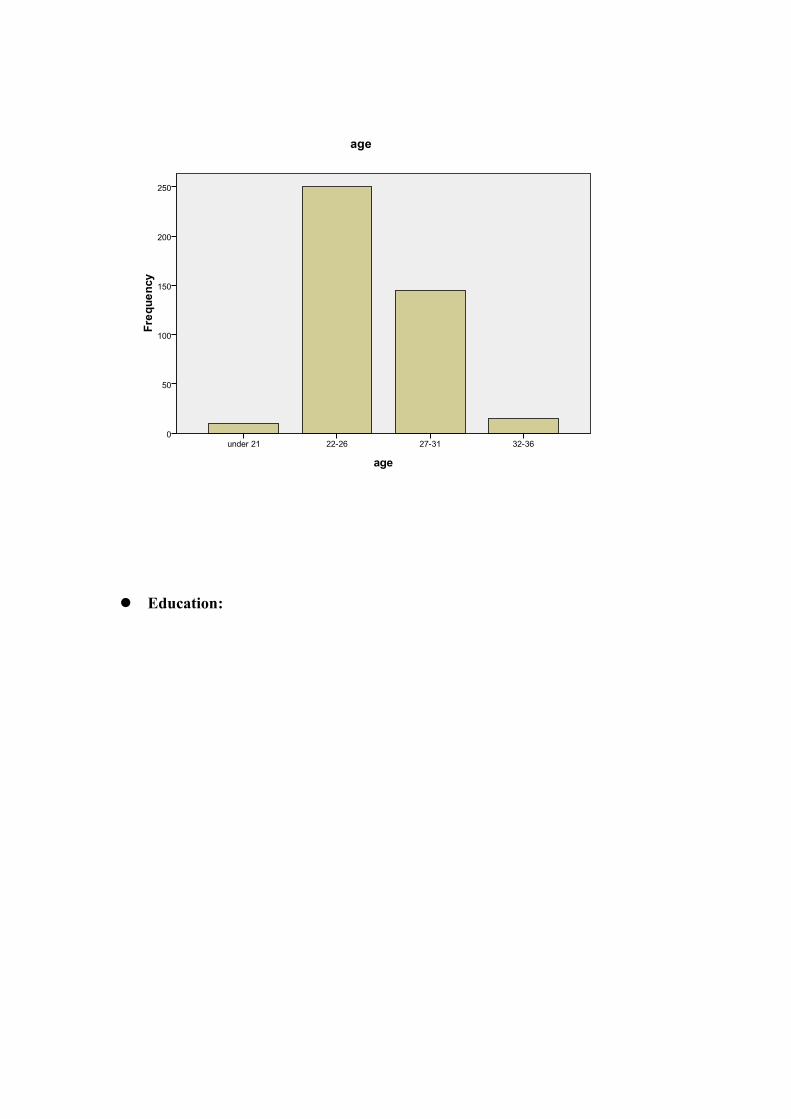
Education:
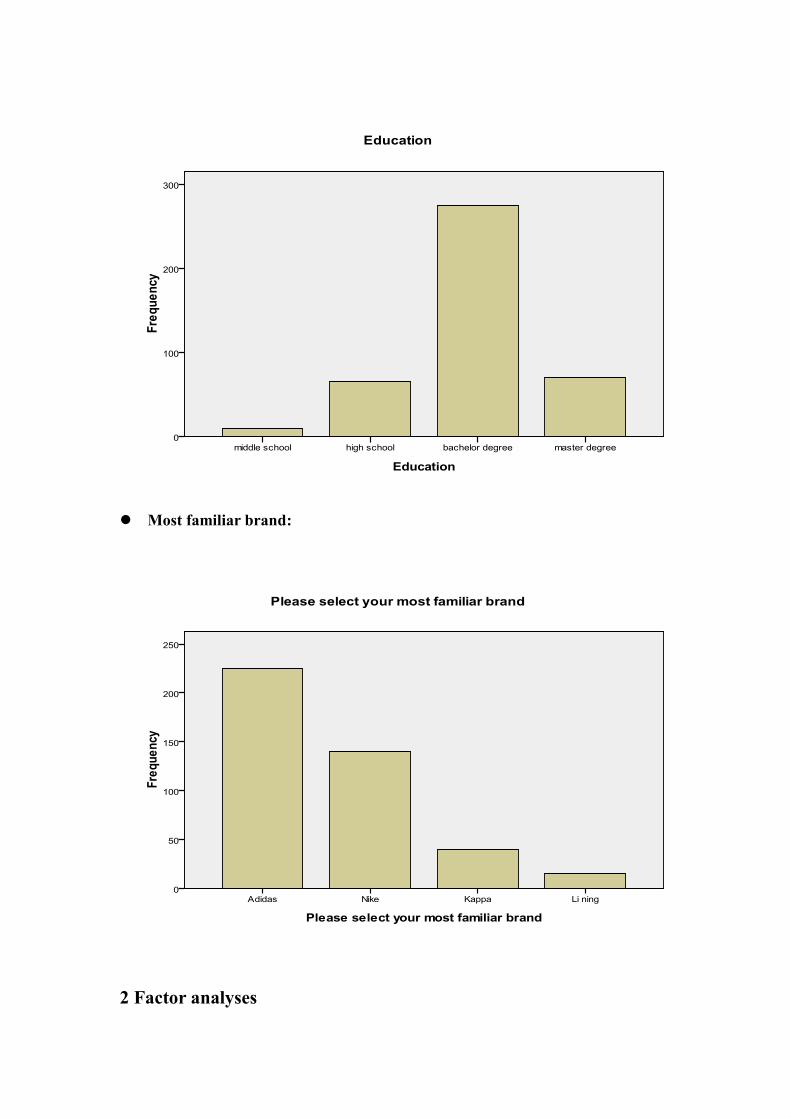
Most familiar brand:
2 Factor analyses
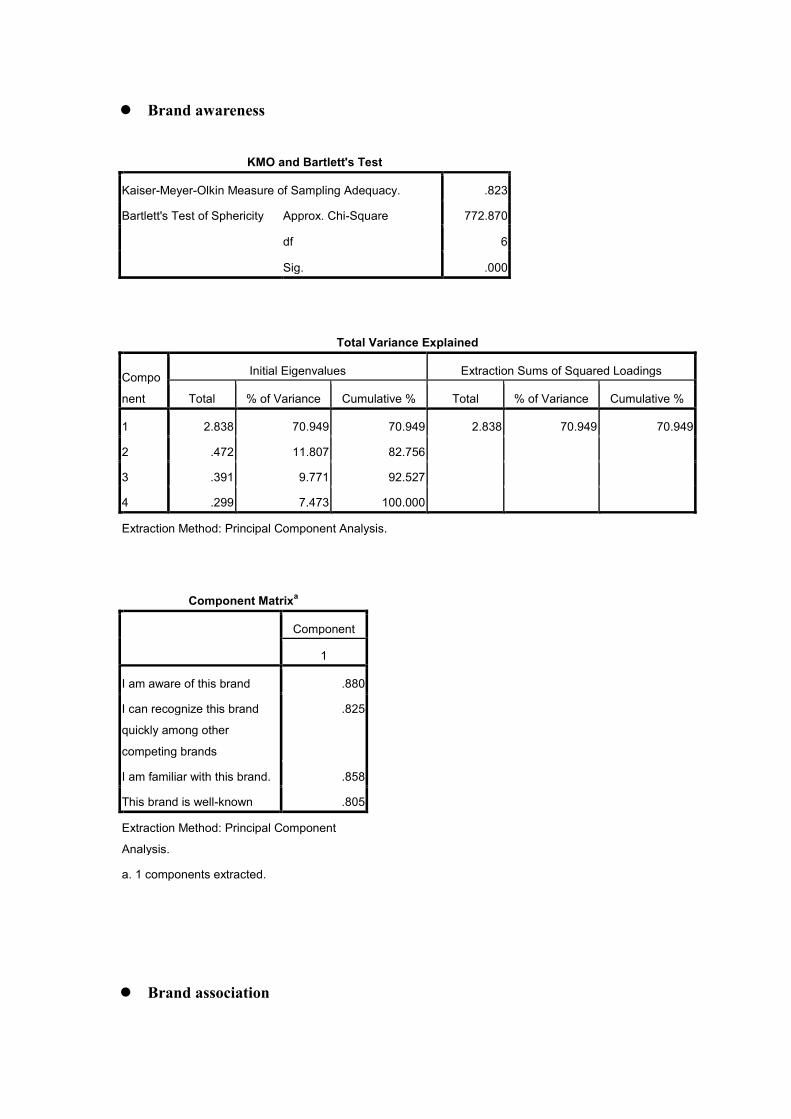
Brand awareness
KMO and Bartlett's Test
Kaiser-Meyer-Olkin Measure of Sampling Adequacy. .823
Bartlett's Test of Sphericity Approx. Chi-Square 772.870
df 6
Sig. .000
Total Variance Explained
Compo
nent
Initial Eigenvalues Extraction Sums of Squared Loadings
Total % of Variance Cumulative % Total % of Variance Cumulative %
1 2.838 70.949 70.949 2.838 70.949 70.949
2 .472 11.807 82.756
3 .391 9.771 92.527
4 .299 7.473 100.000
Extraction Method: Principal Component Analysis.
Component Matrixa
Component
1
I am aware of this brand .880
I can recognize this brand
quickly among other
competing brands
.825
I am familiar with this brand. .858
This brand is well-known .805
Extraction Method: Principal Component
Analysis.
a. 1 components extracted.
Brand association
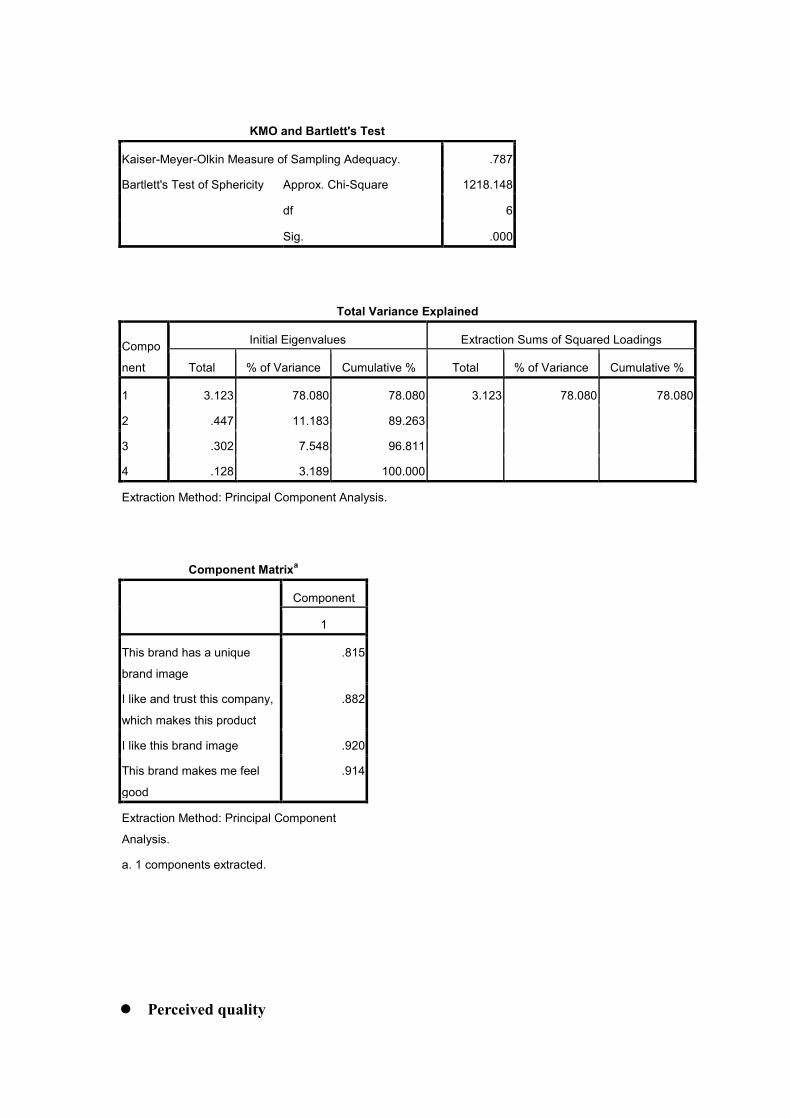
KMO and Bartlett's Test
Kaiser-Meyer-Olkin Measure of Sampling Adequacy. .787
Bartlett's Test of Sphericity Approx. Chi-Square 1218.148
df 6
Sig. .000
Total Variance Explained
Compo
nent
Initial Eigenvalues Extraction Sums of Squared Loadings
Total % of Variance Cumulative % Total % of Variance Cumulative %
1 3.123 78.080 78.080 3.123 78.080 78.080
2 .447 11.183 89.263
3 .302 7.548 96.811
4 .128 3.189 100.000
Extraction Method: Principal Component Analysis.
Component Matrixa
Component
1
This brand has a unique
brand image
.815
I like and trust this company,
which makes this product
.882
I like this brand image .920
This brand makes me feel
good
.914
Extraction Method: Principal Component
Analysis.
a. 1 components extracted.
Perceived quality
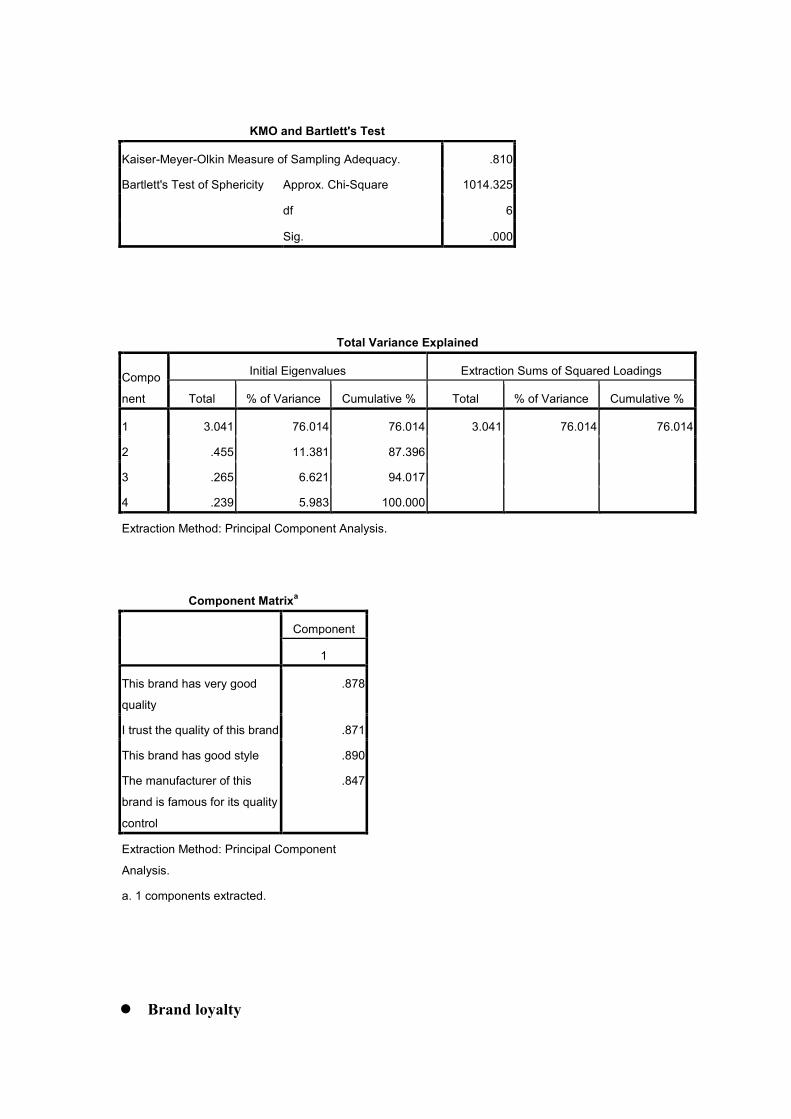
KMO and Bartlett's Test
Kaiser-Meyer-Olkin Measure of Sampling Adequacy. .810
Bartlett's Test of Sphericity Approx. Chi-Square 1014.325
df 6
Sig. .000
Total Variance Explained
Compo
nent
Initial Eigenvalues Extraction Sums of Squared Loadings
Total % of Variance Cumulative % Total % of Variance Cumulative %
1 3.041 76.014 76.014 3.041 76.014 76.014
2 .455 11.381 87.396
3 .265 6.621 94.017
4 .239 5.983 100.000
Extraction Method: Principal Component Analysis.
Component Matrixa
Component
1
This brand has very good
quality
.878
I trust the quality of this brand .871
This brand has good style .890
The manufacturer of this
brand is famous for its quality
control
.847
Extraction Method: Principal Component
Analysis.
a. 1 components extracted.
Brand loyalty
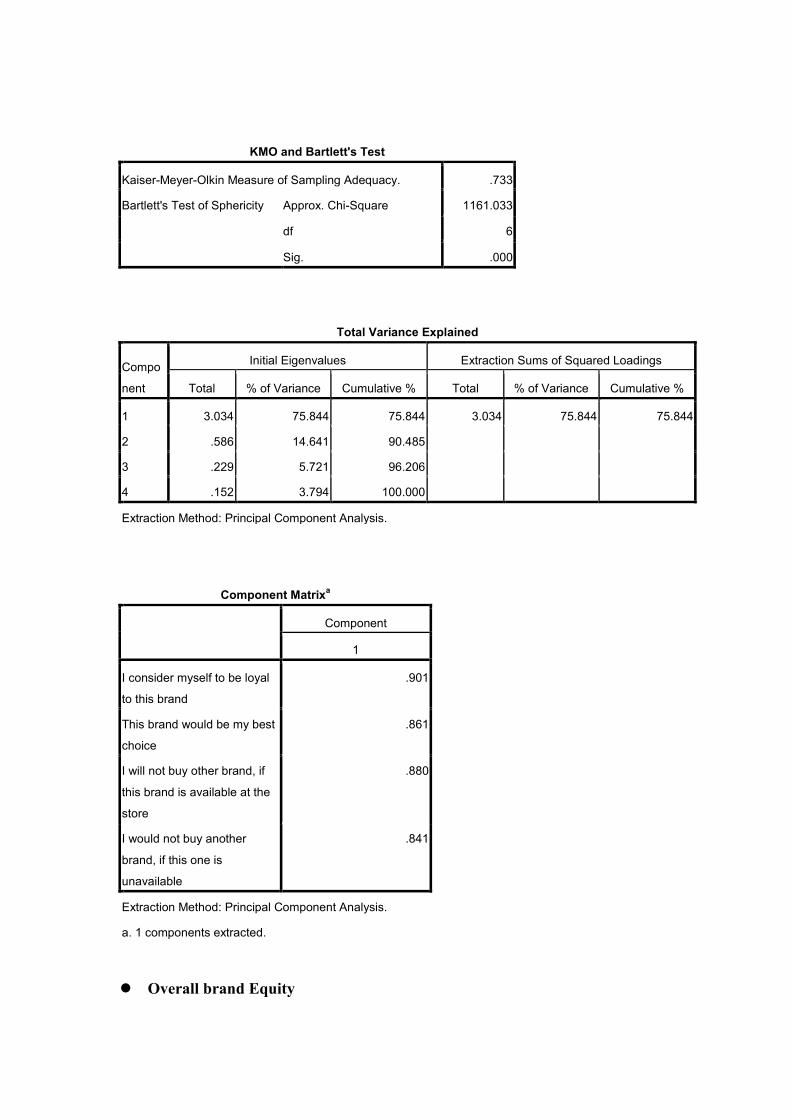
KMO and Bartlett's Test
Kaiser-Meyer-Olkin Measure of Sampling Adequacy. .733
Bartlett's Test of Sphericity Approx. Chi-Square 1161.033
df 6
Sig. .000
Total Variance Explained
Compo
nent
Initial Eigenvalues Extraction Sums of Squared Loadings
Total % of Variance Cumulative % Total % of Variance Cumulative %
1 3.034 75.844 75.844 3.034 75.844 75.844
2 .586 14.641 90.485
3 .229 5.721 96.206
4 .152 3.794 100.000
Extraction Method: Principal Component Analysis.
Component Matrixa
Component
1
I consider myself to be loyal
to this brand
.901
This brand would be my best
choice
.861
I will not buy other brand, if
this brand is available at the
store
.880
I would not buy another
brand, if this one is
unavailable
.841
Extraction Method: Principal Component Analysis.
a. 1 components extracted.
Overall brand Equity
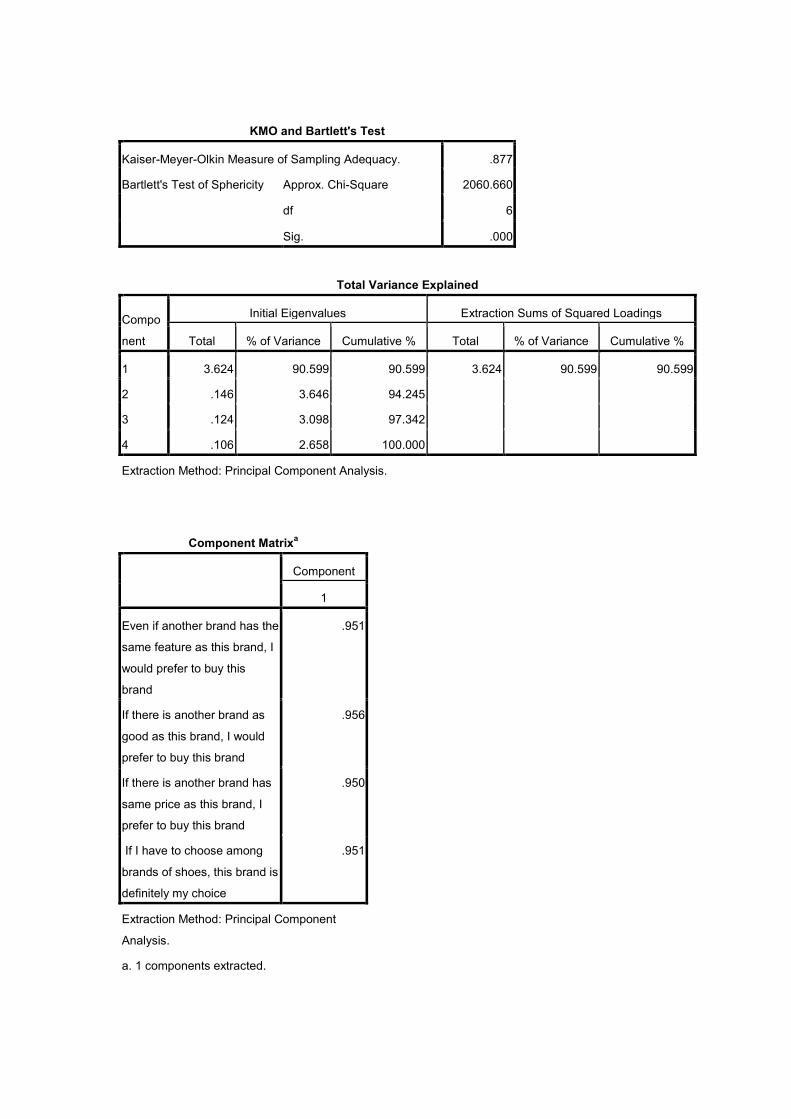
KMO and Bartlett's Test
Kaiser-Meyer-Olkin Measure of Sampling Adequacy. .877
Bartlett's Test of Sphericity Approx. Chi-Square 2060.660
df 6
Sig. .000
Total Variance Explained
Compo
nent
Initial Eigenvalues Extraction Sums of Squared Loadings
Total % of Variance Cumulative % Total % of Variance Cumulative %
1 3.624 90.599 90.599 3.624 90.599 90.599
2 .146 3.646 94.245
3 .124 3.098 97.342
4 .106 2.658 100.000
Extraction Method: Principal Component Analysis.
Component Matrixa
Component
1
Even if another brand has the
same feature as this brand, I
would prefer to buy this
brand
.951
If there is another brand as
good as this brand, I would
prefer to buy this brand
.956
If there is another brand has
same price as this brand, I
prefer to buy this brand
.950
If I have to choose among
brands of shoes, this brand is
definitely my choice
.951
Extraction Method: Principal Component
Analysis.
a. 1 components extracted.
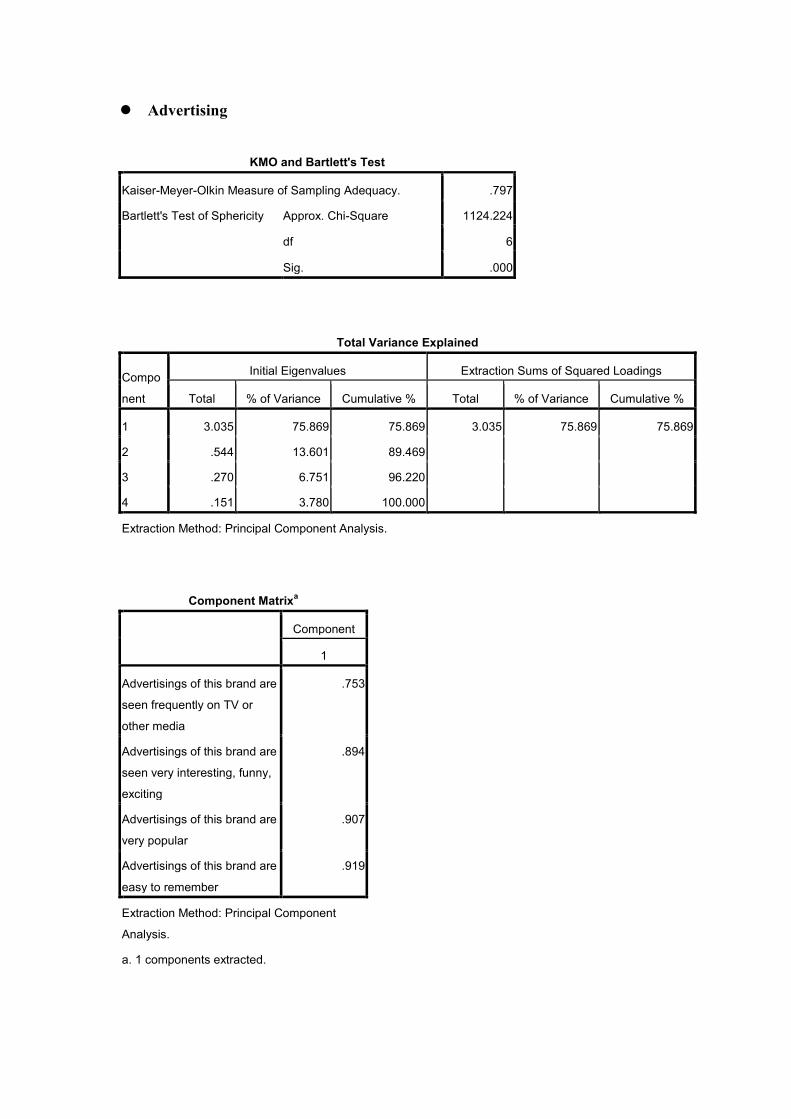
Advertising
KMO and Bartlett's Test
Kaiser-Meyer-Olkin Measure of Sampling Adequacy. .797
Bartlett's Test of Sphericity Approx. Chi-Square 1124.224
df 6
Sig. .000
Total Variance Explained
Compo
nent
Initial Eigenvalues Extraction Sums of Squared Loadings
Total % of Variance Cumulative % Total % of Variance Cumulative %
1 3.035 75.869 75.869 3.035 75.869 75.869
2 .544 13.601 89.469
3 .270 6.751 96.220
4 .151 3.780 100.000
Extraction Method: Principal Component Analysis.
Component Matrixa
Component
1
Advertisings of this brand are
seen frequently on TV or
other media
.753
Advertisings of this brand are
seen very interesting, funny,
exciting
.894
Advertisings of this brand are
very popular
.907
Advertisings of this brand are
easy to remember
.919
Extraction Method: Principal Component
Analysis.
a. 1 components extracted.
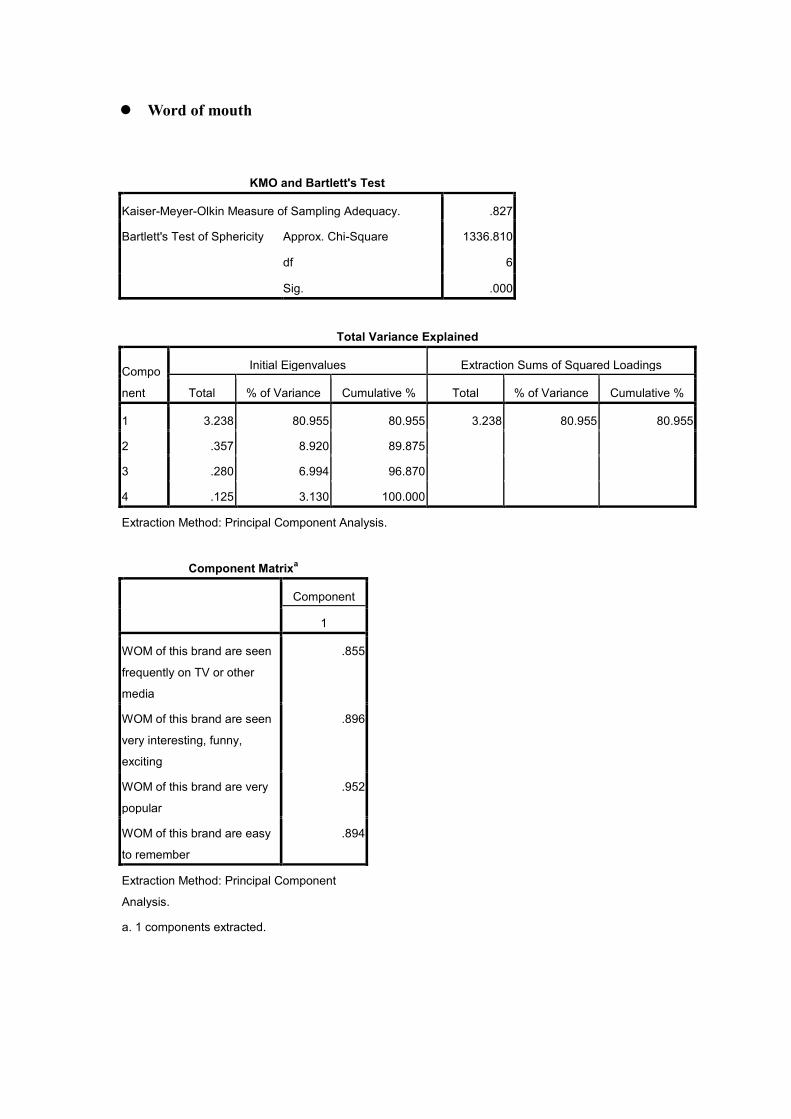
Word of mouth
KMO and Bartlett's Test
Kaiser-Meyer-Olkin Measure of Sampling Adequacy. .827
Bartlett's Test of Sphericity Approx. Chi-Square 1336.810
df 6
Sig. .000
Total Variance Explained
Compo
nent
Initial Eigenvalues Extraction Sums of Squared Loadings
Total % of Variance Cumulative % Total % of Variance Cumulative %
1 3.238 80.955 80.955 3.238 80.955 80.955
2 .357 8.920 89.875
3 .280 6.994 96.870
4 .125 3.130 100.000
Extraction Method: Principal Component Analysis.
Component Matrixa
Component
1
WOM of this brand are seen
frequently on TV or other
media
.855
WOM of this brand are seen
very interesting, funny,
exciting
.896
WOM of this brand are very
popular
.952
WOM of this brand are easy
to remember
.894
Extraction Method: Principal Component
Analysis.
a. 1 components extracted.
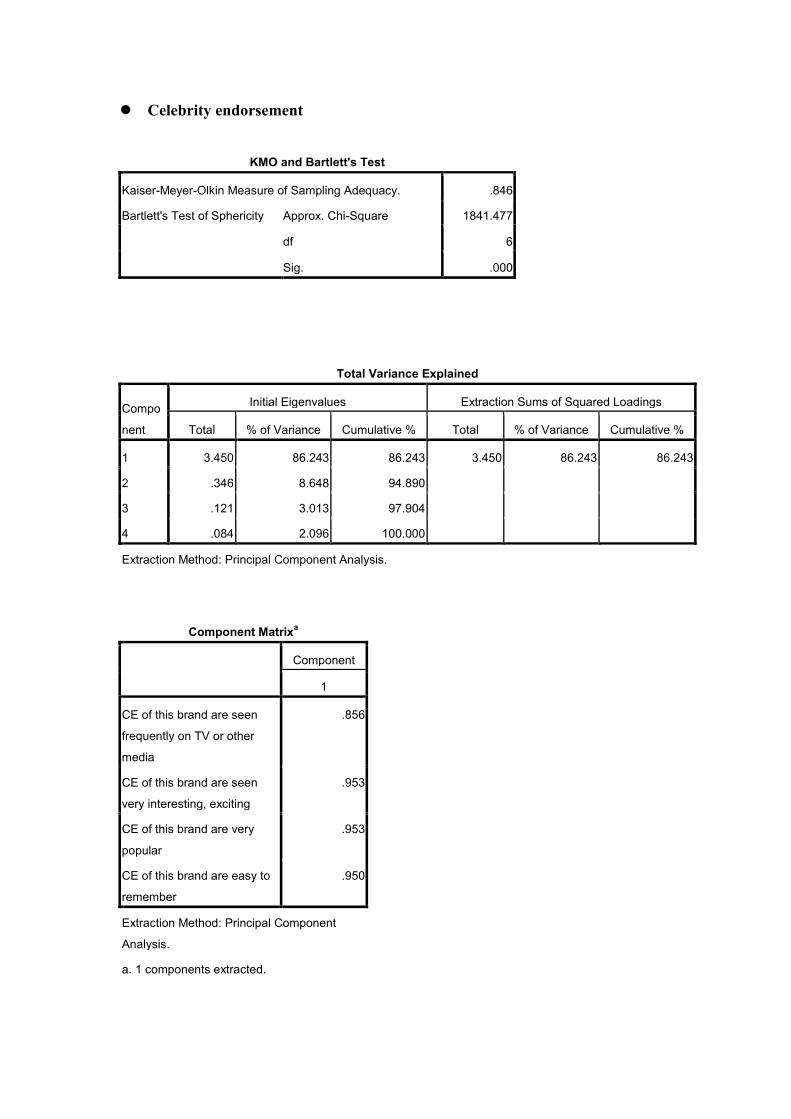
Celebrity endorsement
KMO and Bartlett's Test
Kaiser-Meyer-Olkin Measure of Sampling Adequacy. .846
Bartlett's Test of Sphericity Approx. Chi-Square 1841.477
df 6
Sig. .000
Total Variance Explained
Compo
nent
Initial Eigenvalues Extraction Sums of Squared Loadings
Total % of Variance Cumulative % Total % of Variance Cumulative %
1 3.450 86.243 86.243 3.450 86.243 86.243
2 .346 8.648 94.890
3 .121 3.013 97.904
4 .084 2.096 100.000
Extraction Method: Principal Component Analysis.
Component Matrixa
Component
1
CE of this brand are seen
frequently on TV or other
media
.856
CE of this brand are seen
very interesting, exciting
.953
CE of this brand are very
popular
.953
CE of this brand are easy to
remember
.950
Extraction Method: Principal Component
Analysis.
a. 1 components extracted.
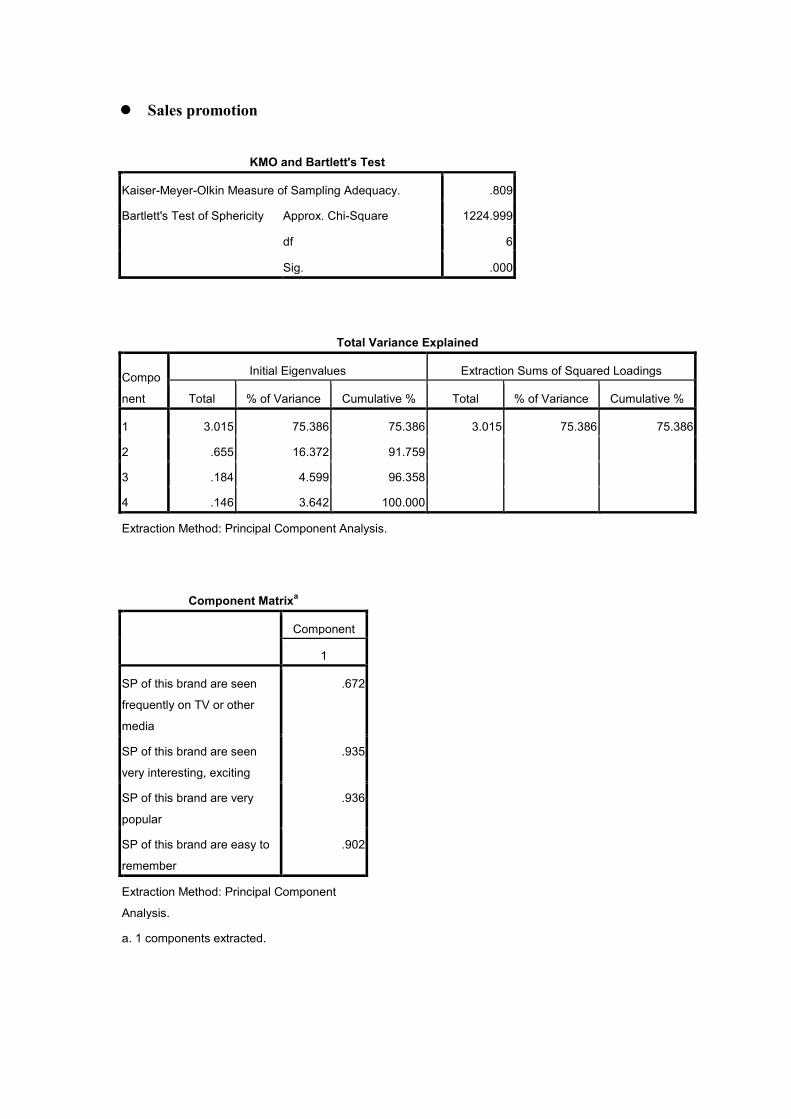
Sales promotion
KMO and Bartlett's Test
Kaiser-Meyer-Olkin Measure of Sampling Adequacy. .809
Bartlett's Test of Sphericity Approx. Chi-Square 1224.999
df 6
Sig. .000
Total Variance Explained
Compo
nent
Initial Eigenvalues Extraction Sums of Squared Loadings
Total % of Variance Cumulative % Total % of Variance Cumulative %
1 3.015 75.386 75.386 3.015 75.386 75.386
2 .655 16.372 91.759
3 .184 4.599 96.358
4 .146 3.642 100.000
Extraction Method: Principal Component Analysis.
Component Matrixa
Component
1
SP of this brand are seen
frequently on TV or other
media
.672
SP of this brand are seen
very interesting, exciting
.935
SP of this brand are very
popular
.936
SP of this brand are easy to
remember
.902
Extraction Method: Principal Component
Analysis.
a. 1 components extracted.
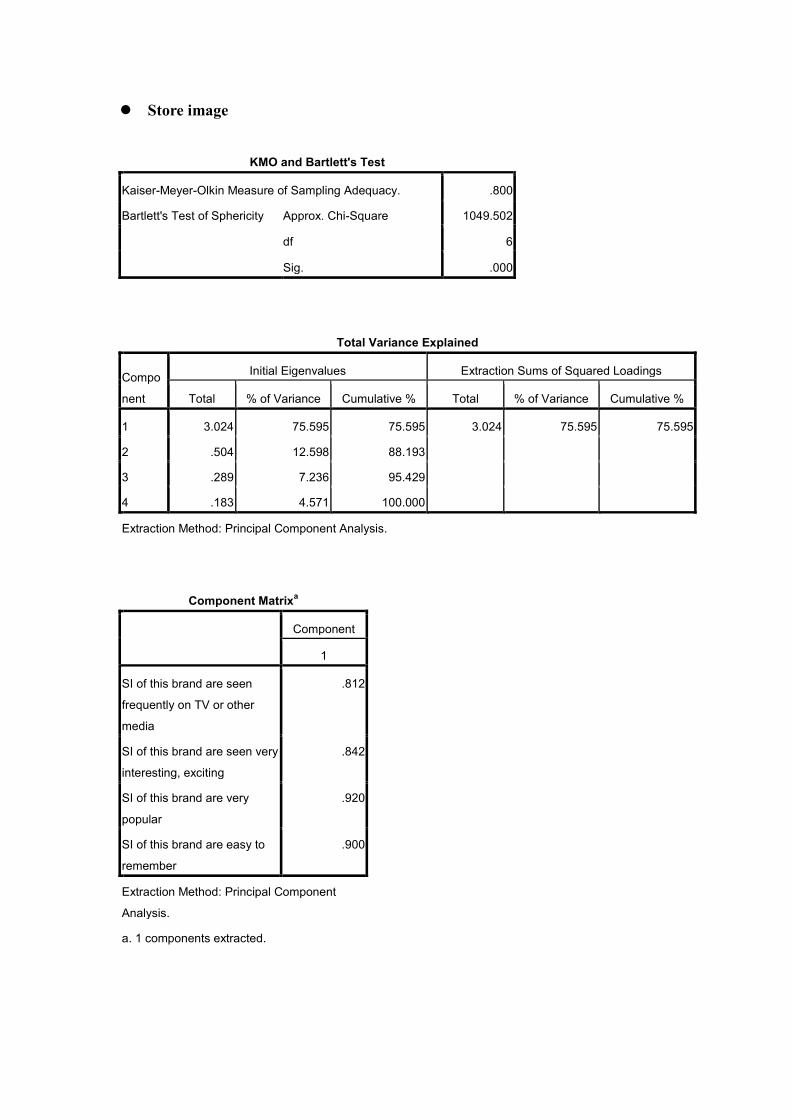
Store image
KMO and Bartlett's Test
Kaiser-Meyer-Olkin Measure of Sampling Adequacy. .800
Bartlett's Test of Sphericity Approx. Chi-Square 1049.502
df 6
Sig. .000
Total Variance Explained
Compo
nent
Initial Eigenvalues Extraction Sums of Squared Loadings
Total % of Variance Cumulative % Total % of Variance Cumulative %
1 3.024 75.595 75.595 3.024 75.595 75.595
2 .504 12.598 88.193
3 .289 7.236 95.429
4 .183 4.571 100.000
Extraction Method: Principal Component Analysis.
Component Matrixa
Component
1
SI of this brand are seen
frequently on TV or other
media
.812
SI of this brand are seen very
interesting, exciting
.842
SI of this brand are very
popular
.920
SI of this brand are easy to
remember
.900
Extraction Method: Principal Component
Analysis.
a. 1 components extracted.

Event sponsorship
KMO and Bartlett's Test
Kaiser-Meyer-Olkin Measure of Sampling Adequacy. .843
Bartlett's Test of Sphericity Approx. Chi-Square 1981.423
df 6
Sig. .000
Total Variance Explained
Compo
nent
Initial Eigenvalues Extraction Sums of Squared Loadings
Total % of Variance Cumulative % Total % of Variance Cumulative %
1 3.552 88.795 88.795 3.552 88.795 88.795
2 .221 5.517 94.312
3 .158 3.946 98.258
4 .070 1.742 100.000
Extraction Method: Principal Component Analysis.
Component Matrixa
Component
1
ES of this brand are seen
frequently on TV or other
media
.913
ES of this brand are seen
very interesting, exciting
.952
ES of this brand are very
popular
.963
ES of this brand are easy to
remember
.941
Extraction Method: Principal Component
Analysis.
a. 1 components extracted.
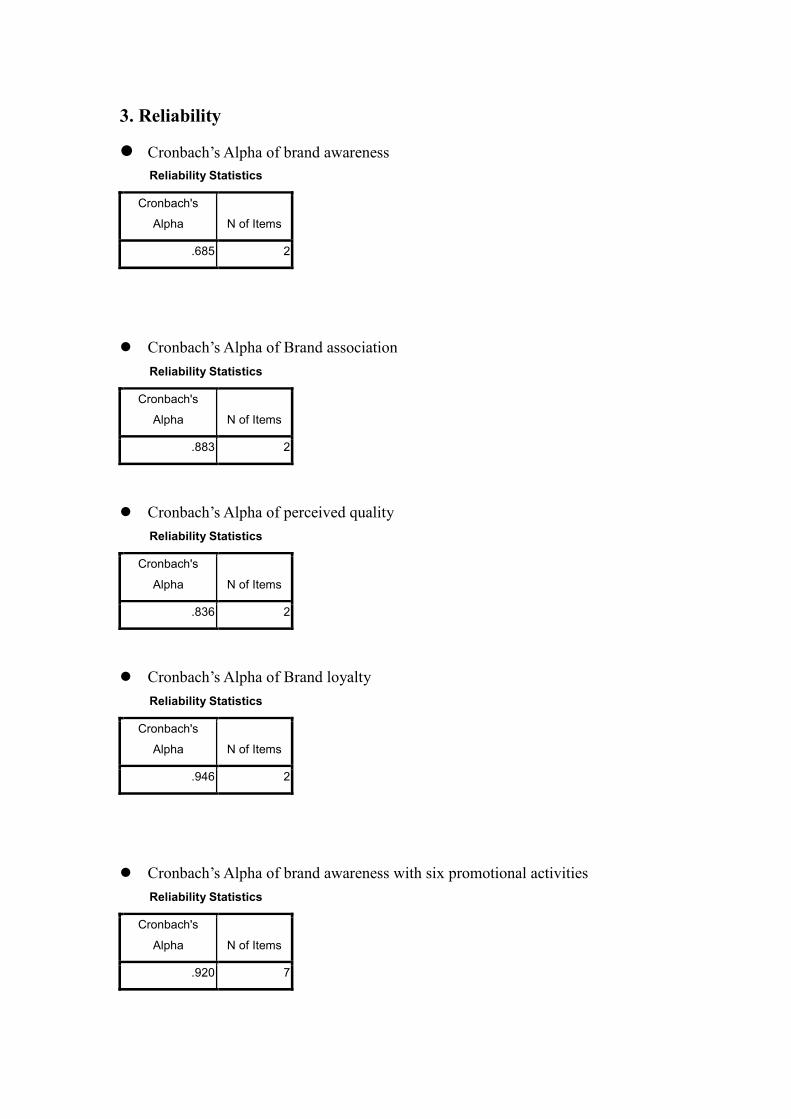
3. Reliability
Cronbach‟s Alpha of brand awareness
Reliability Statistics
Cronbach's
Alpha N of Items
.685 2
Cronbach‟s Alpha of Brand association
Reliability Statistics
Cronbach's
Alpha N of Items
.883 2
Cronbach‟s Alpha of perceived quality
Reliability Statistics
Cronbach's
Alpha N of Items
.836 2
Cronbach‟s Alpha of Brand loyalty
Reliability Statistics
Cronbach's
Alpha N of Items
.946 2
Cronbach‟s Alpha of brand awareness with six promotional activities
Reliability Statistics
Cronbach's
Alpha N of Items
.920 7
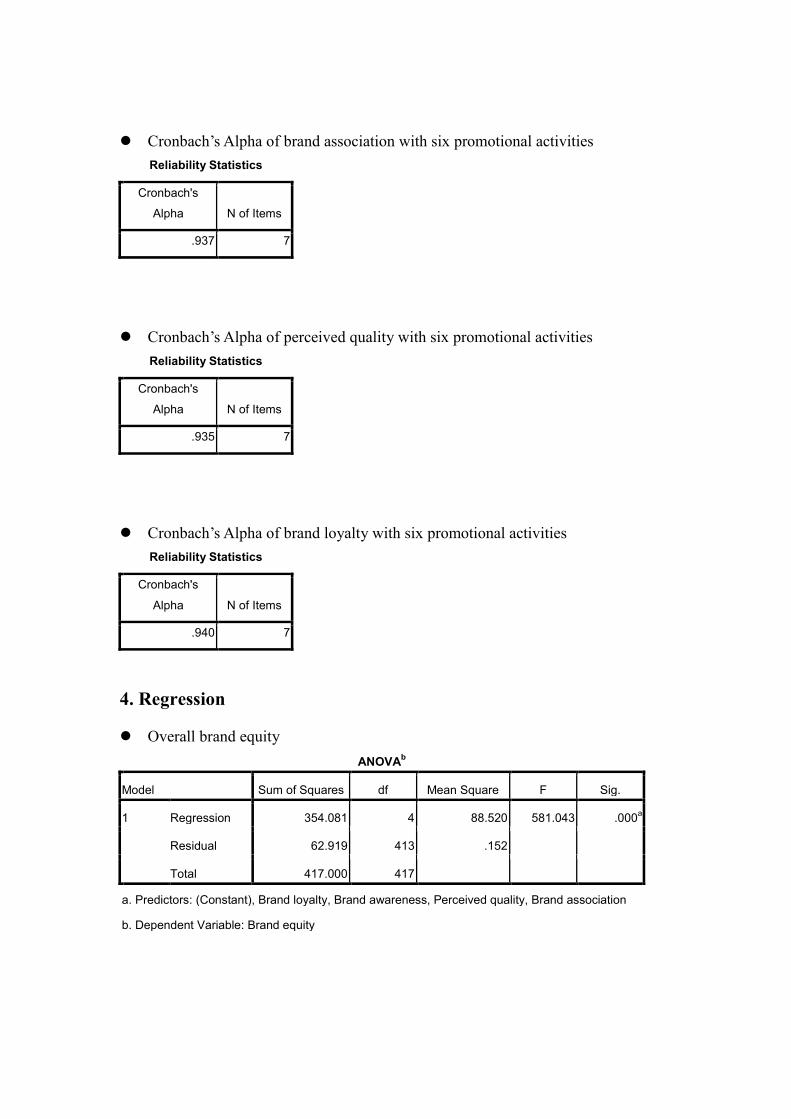
Cronbach‟s Alpha of brand association with six promotional activities
Reliability Statistics
Cronbach's
Alpha N of Items
.937 7
Cronbach‟s Alpha of perceived quality with six promotional activities
Reliability Statistics
Cronbach's
Alpha N of Items
.935 7
Cronbach‟s Alpha of brand loyalty with six promotional activities
Reliability Statistics
Cronbach's
Alpha N of Items
.940 7
4. Regression
Overall brand equity
ANOVAb
Model Sum of Squares df Mean Square F Sig.
1 Regression 354.081 4 88.520 581.043 .000a
Residual 62.919 413 .152
Total 417.000 417
a. Predictors: (Constant), Brand loyalty, Brand awareness, Perceived quality, Brand association
b. Dependent Variable: Brand equity
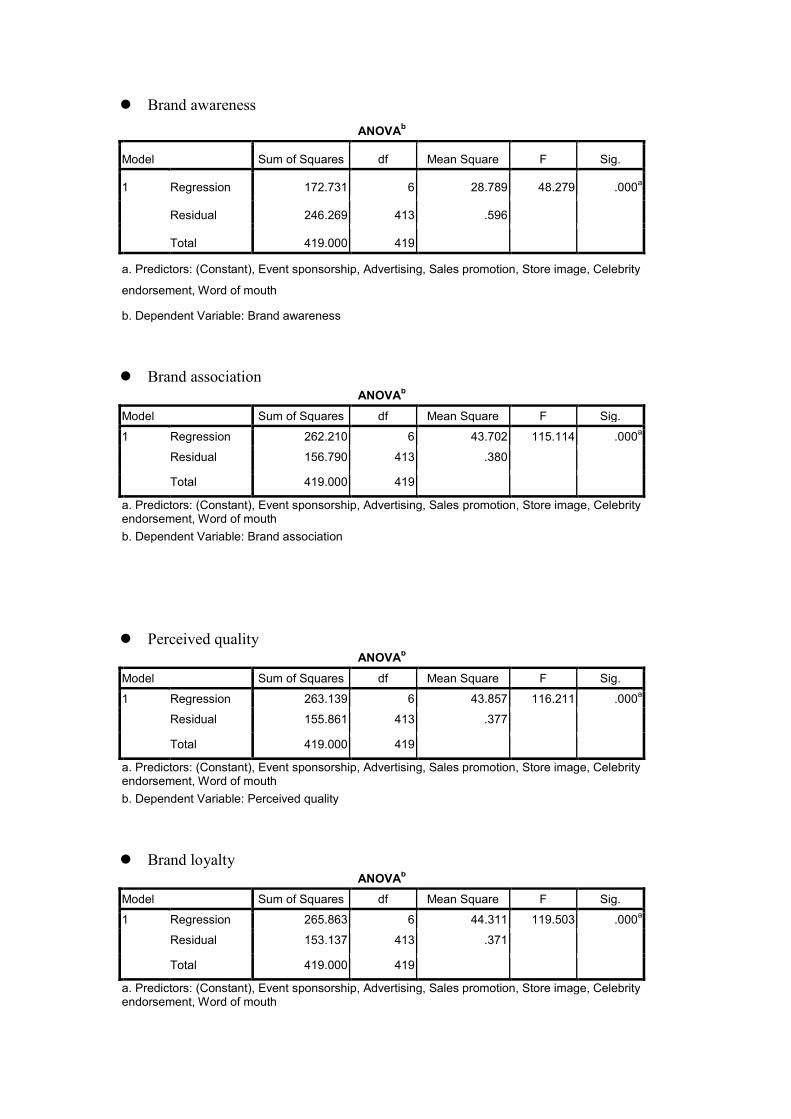
Brand awareness
ANOVAb
Model Sum of Squares df Mean Square F Sig.
1 Regression 172.731 6 28.789 48.279 .000a
Residual 246.269 413 .596
Total 419.000 419
a. Predictors: (Constant), Event sponsorship, Advertising, Sales promotion, Store image, Celebrity
endorsement, Word of mouth
b. Dependent Variable: Brand awareness
Brand association ANOVA
b
Model Sum of Squares df Mean Square F Sig.
1 Regression 262.210 6 43.702 115.114 .000a
Residual 156.790 413 .380
Total 419.000 419
a. Predictors: (Constant), Event sponsorship, Advertising, Sales promotion, Store image, Celebrity endorsement, Word of mouth
b. Dependent Variable: Brand association
Perceived quality ANOVA
b
Model Sum of Squares df Mean Square F Sig.
1 Regression 263.139 6 43.857 116.211 .000a
Residual 155.861 413 .377
Total 419.000 419
a. Predictors: (Constant), Event sponsorship, Advertising, Sales promotion, Store image, Celebrity endorsement, Word of mouth
b. Dependent Variable: Perceived quality
Brand loyalty ANOVA
b
Model Sum of Squares df Mean Square F Sig.
1 Regression 265.863 6 44.311 119.503 .000a
Residual 153.137 413 .371
Total 419.000 419
a. Predictors: (Constant), Event sponsorship, Advertising, Sales promotion, Store image, Celebrity endorsement, Word of mouth

ANOVAb
Model Sum of Squares df Mean Square F Sig.
1 Regression 265.863 6 44.311 119.503 .000a
Residual 153.137 413 .371
Total 419.000 419
a. Predictors: (Constant), Event sponsorship, Advertising, Sales promotion, Store image, Celebrity endorsement, Word of mouth
b. Dependent Variable: Brand loyalty