Creating Activity-Based Costing System Tool
65
Creating Activity-Based Costing System Tool Case: Service Company X Sayed Mehdi Kazemi Bachelor’s Thesis International Business 2015 brought to you by CORE View metadata, citation and similar papers at core.ac.uk provided by Theseus
Transcript of Creating Activity-Based Costing System Tool
Creating Activity-Based Costing System Tool
Case: Service Company X
Sayed Mehdi Kazemi
Bachelor’s Thesis
International Business
2015
brought to you by COREView metadata, citation and similar papers at core.ac.uk
provided by Theseus

Abstract
Author Sayed Mehdi Kazemi
Degree programme International Business
Report/thesis title Creating Activity Based Costing System Tool
Number of pages and appendix pages 44 +17
This product-based thesis is meant to create an Activity- Based costing system tool for com-pany X, which provides after-school care for children and is a sub-contractor of municipality of Y. The thesis aims to create costing information system mechanism for the case company in order to be used as a means to understand cost, costing issues and profitability of the cost objects in this case. Hence this thesis does not address the way of using information and analyzing it. As that is another issue and relates to the Activity based management. This study was started by meeting the manager of the company about the topic in February 2015. Then I started to study ABC’s system issues were then studied in view of theory. The process of creating the tool started by studying the income statement and interviewing the manager of the company to collect as much information as possible. During the process the nature and type of required information was revised and changed for many times. The final result is a tool which can be helpful to understand cost and profitability of the firm as a whole.
Keywords ABC, Cost, Cost behavior, Direct/ Indirect Cost/ labor and material,
Table of contents
1 Introduction ................................................................................................................... 1
1.1 Background and project problem .......................................................................... 1
1.2 Project objectives and tasks .................................................................................. 2
1.3 Internationalization and project risks ..................................................................... 3
1.4 Demarcation ......................................................................................................... 3
1.5 The project result .................................................................................................. 3
1.6 Stakeholder benefits ............................................................................................. 3
1.7 Key concepts ........................................................................................................ 4
1.8 Education and Training industry ............................................................................ 5
1.9 Case company ...................................................................................................... 6
1.10 Structure of the project .......................................................................................... 6
2 Theoretical framework ................................................................................................... 7
2.1 ABC definition ....................................................................................................... 8
2.2 ABC in service sectors .......................................................................................... 9
2.3 Advantages and disadvantages .......................................................................... 10
2.4 Costs and cost behavior ...................................................................................... 11
2.5 Elements of Cost ................................................................................................. 13
2.5.1 Overheads ............................................................................................... 13
2.6 Sources of data collection ................................................................................... 14
2.7 Key components of Activity-Based Costing ......................................................... 14
2.8 Implementation Guidelines and Steps ................................................................. 15
3 Implementing ABC to the company X .......................................................................... 17
3.1 Discussion .......................................................................................................... 17
3.2 Cost and cost behavior of the company .............................................................. 20
3.3 Implementation Steps and Designing the tool ..................................................... 21
3.3.1 Identifying Cost objects ............................................................................ 23
3.3.2 Identifying Direct Costs of Cost objects .................................................... 24
3.3.3 Identifying activities and allocation bases for allocating indirect costs to
cost objects ......................................................................................................... 29
3.3.4 Identifying costs of activities ..................................................................... 31
3.3.5 Computing the rate per unit of cost allocation bases ................................ 34
3.3.6 Computing indirect costs of cost objects .................................................. 34
3.3.7 Adding direct and indirect costs of each cost object: ................................ 35
3.4 Profitability Analysis ............................................................................................ 36
3.4.1 Conclusion ............................................................................................... 36
4 Summary and personal learning .................................................................................. 40
List of tables .................................................................................................................... 41
List of figures ................................................................................................................... 42
Reference ........................................................................................................................ 43
Appendix 1....................................................................................................................... 45
Appendix 2....................................................................................................................... 46
Appendix 3....................................................................................................................... 47
1
1 Introduction
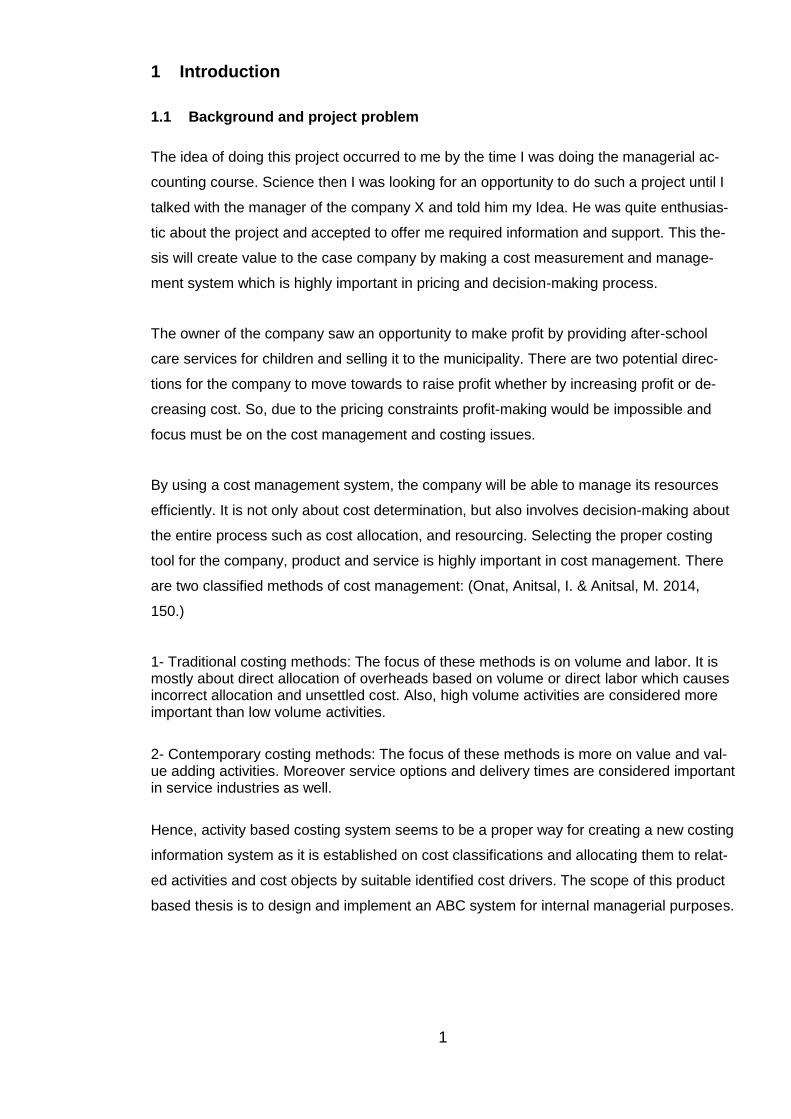
1.1 Background and project problem
The idea of doing this project occurred to me by the time I was doing the managerial ac-
counting course. Science then I was looking for an opportunity to do such a project until I
talked with the manager of the company X and told him my Idea. He was quite enthusias-
tic about the project and accepted to offer me required information and support. This the-
sis will create value to the case company by making a cost measurement and manage-
ment system which is highly important in pricing and decision-making process.
The owner of the company saw an opportunity to make profit by providing after-school
care services for children and selling it to the municipality. There are two potential direc-
tions for the company to move towards to raise profit whether by increasing profit or de-
creasing cost. So, due to the pricing constraints profit-making would be impossible and
focus must be on the cost management and costing issues.
By using a cost management system, the company will be able to manage its resources
efficiently. It is not only about cost determination, but also involves decision-making about
the entire process such as cost allocation, and resourcing. Selecting the proper costing
tool for the company, product and service is highly important in cost management. There
are two classified methods of cost management: (Onat, Anitsal, I. & Anitsal, M. 2014,
150.)
1- Traditional costing methods: The focus of these methods is on volume and labor. It is mostly about direct allocation of overheads based on volume or direct labor which causes incorrect allocation and unsettled cost. Also, high volume activities are considered more important than low volume activities.
2- Contemporary costing methods: The focus of these methods is more on value and val-ue adding activities. Moreover service options and delivery times are considered important in service industries as well.
Hence, activity based costing system seems to be a proper way for creating a new costing
information system as it is established on cost classifications and allocating them to relat-
ed activities and cost objects by suitable identified cost drivers. The scope of this product
based thesis is to design and implement an ABC system for internal managerial purposes.
2
1.2 Project objectives and tasks
The aim of this project is to create an Activity-Based costing system tool by Excel which
the company can use for internal managerial purposes. The main aim of such a tool is to
aid the owner and decision makers have a better costing information system and better
understanding of company’s expenses of the operating places to manage the business
effectively.
The thesis is a qualitative study and in (PT1) a theoretical framework will be made by
studying current theories of ABC and other costing issues from different sources such as
books, reports, articles and etc. In (PT2) information gathered on implementation will be
used to create the tool. Also, needed data related to the company will be gathered by in-
terviewing the operations manager and analyzing the income statement for designing and
implementing the tool. (PT3) is about writing a manual guide for users of the tool. In (PT4)
the tool will be tested and evaluated by using numbers, however those are not going to be
shown in this text because of the confidentiality purposes. Instead, manipulation of the
real figures will be used in PT2 while designing the tool. The project tasks are illustrated in
table 1.
Table 1: Project tasks ( PTs)
Project tasks (PTs) Theories Project Management method
Outcome
PT1: Studying ABC and related issues to design theoretical framework
ABC system theories and types of imple-mentation
Desktop Research Theoretical framework
PT2: Data Collection, Im-plementing and designing an Excel-based ABC tool
Collecting data through interview and financial statement analysis and implementing based on the theories
Documentary analysis and interviews/ Desk-top work
Gathering Primary information / data needed and creat-ing an ABC tool
PT3: Creating User’s Man-ual
Preparing the instruc-tion ( guidance)
Based on the tool Instruction for manager/s
PT4: Evaluating the project Project evaluation criteria
3
1.3 Internationalization and project risks
The case company currently operates in city Y in Finland but, there is a possibility that it
starts providing its services abroad for instance Estonia. Therefore, by adjusting prefer-
ences such as allocated percentages of activities to cost objects and redefining its costs
and expense resources the tool can be applied to foreign operations as well. However, a
market and competitors’ analysis of the desired countries should be conducted.
The main risk that the project can face is lack of information for many reasons, such as
the company is not willing to give its true costs, or company may not have specific infor-
mation related to its costs and activities. However, the firm is quite eager to have the tool
and supports it as much as possible.
1.4 Demarcation
This is a product-based thesis and the purpose is designing an ABC system tool for the
company by understanding and categorizing costs related to different activities of the firm
to allocate overheads to operating places. At this point the purpose of the project is to
create a tool which provides a means of analyzing profitability of operating places. How-
ever profitability analysis issues and understanding the result of the tool are not going to
be explained deeply in this thesis. Interpreting the results and proper using of the results
of the tool as well as changing the costing system are related to Activity-Based Manage-
ment. The purpose of this tool is to be used for internal decision-making only so the re-
sults are not useful for external financial purposes. Also, the thesis is not related to risk
management, accounting, and attracting investors. However, the thesis is not about pric-
ing as the company has no authority in charging customers as prices are determined by
the Finnish law.
1.5 The project result
The outcome of the project will be an ABC system tool. By using this tool the manager
and decision makers will be able to have a greater understanding of the company’s cost
structure and profitability of the operating places. So, managers can have a useful costing
information system to make efficient decisions.
1.6 Stakeholder benefits
The stakeholders are the company, the school and the author. The case company will
benefit by using the tool for managerial decision-making purposes.

4
Haaga-Helia can benefit by understanding the level of its efficiency and practicability of
the current training system. However, the author can benefit more by implementing his
theoretical knowledge and gaining experience and using it in his future careers. These
mentioned benefits can motivate stakeholders to be cooperative during the project.
1.7 Key concepts
ABC: It is an accounting method of identifying different activities performed in an organi-
zation and relating direct costs to them by providing an appropriate cost driver, however
unlike traditional methods indirect costs are also assigned to activities (Investopedia
2015a).
Cost: It is a monetary measurement of used resources to achieve a defined objective of
acquiring products or services (Drury 2008, 27).
Cost object: It is an activity or anything else that requires a separate measurement of cost
(Drury 2008, 28).
Direct cost: It is a cost that can be traced directly to a cost object (Drury 2008, 28).
Indirect cost: It is an untraceable cost for a specific cost object (Drury 2008, 28).
Direct material: It is a directly used material to make a product (Drury 2008, 29).
Indirect material: Needed material such as maintenance tools, cleaning products or office
supplies to produce products or offer services which are not directly related to the process
(WebFinance 2015).
Direct labor: It is a labor that is assigned directly to a specific product or service, e.g. Ma-
chine operators, assembly line operators, painters in manufacturing firms and consultants,
lawyers and etc. in service firms (accountingtools 2015a).
Indirect Labor: It is a labor which is not directly involved in the production process and is
performed to support the process (accountingtools 2015b).
Cost drivers: are assessment indicators of the usage level of expense resources by activi-
ties (Institute of Management Accountants 2006, 2).
5
EBIT: Earnings before interests and tax, is a profit obtained from revenue minus Cost of
goods sold and operating expense. Interests and tax are not deducted or added to this
profit (Investopedia 2015b).
1.8 Education and Training industry
The chapter 8a in the Finnish legislation provides the act on before- and after school activ-
ities 1136/2003.
According to the chapter 8a section 48a, the aims of the morning and afternoon activities
are to develop children’s emotions in life and ethical growth by engaging them into social
activities. Additionally, promoting well-being and equality of society are the aim of provid-
ing such activities. These sorts of activities are provided in a peaceful environment under
the supervision of skilled and suitable persons. The morning and evening activities’ criteria
are planned and decided by the National Board of Education in cooperation with the
Health research and Development center.
Based on the section 48b of the chapter 8a (1136/2003), The Morning & Afternoon activi-
ties can be arranged and provided by the municipality itself or obtained from other public
or private service providers. The service is mainly provided for the first and the second
years of primary school. Services can be offered to each student either for 570 hours or
760 hours during the school year from the 7:00 to 17:00.
Section 48f of the before-and after school activities act (1136/2003) states that service
providers are subjected to a monthly fee. According to the legislation the payment will be
a maximum of 60 euro per hour for part-time equivalent of 560 hours and 80 euro per hour
for full-time equivalent of 760 hours. However, if the services are provided for 10 days per
month and the child is absent due to any reason rather than illness half of the amount will
be paid. If the absence lasts for the whole month due to illness no fee will be paid.

6
1.9 Case company
The company X is providing after school care services for its customers. The company is
a sub-contractor of the municipality of Y city in Finland who is buying services provided by
the company for final customers who are parents. Customers are mainly employed par-
ents who cannot take care of the children in certain hours from 12:00 am to 17:00 pm,
however there are parents whose children require different types of help such as assisting
in doing homework and etc.
The company has six operating places and the main office. There are 25 employees work-
ing for the company. There are 4 permanent employees, 18 part time and 3 substitutes
who are moving from one place to another based on the need of more work force in any of
the operating places. Currently there are 261 children, whether part time or full-time using
the services provided by the company. Children are categorized into two groups Normal
students and Special students that need extra care, even in some cases one particular
instructor is needed to take care of them.
1.10 Structure of the project
The text consists of five chapters. Chapter 1: Introduction provides information about the
text and the case company. In chapter 2: Theoretical framework describes the theories of
implementing and designing of the tool. Chapter 3: Implementing ABC to the company
explains the process of the company and the process of designing and implementing the
tool based on the provided theories. And finally chapter 4: Summary and Personal Learn-
ing is about the text, future consideration and author’s learnings from doing the project.
There are three appendices in this text. Appendix 1 provides the translated income state-
ment of the company, appendix 2 shows the questionnaire and user manual is available in
appendix 3.
7
2 Theoretical framework
This chapter will discuss Project Task 1 (PT1) which is about gathering theories and mod-
els to form theoretical data of the project.
Although understanding costs and their behavior are growing issues for organizations, but
still there is a confusion about how to distinguish costs and their measurement methodol-
ogies to be competitive in the market as well as being accurate. However, different meth-
odologies of cost measurement such as ABC, Standard costing, Throughput accounting,
Target costing and etc. can exist side by side rather than competing against each other.
(Institute of Management Accountants 2006.)
According to Hicks (1999, 2) cost information is used by managers and outsiders for mak-
ing critical decisions such as: Evaluating inventories, Cost of Goods Sold, Strategic &
operational planning, Capital & operational budgeting, Cost control, Costing & pricing,
Decision modelling and Financial analysis, so, an improper cost information misleads de-
cision makers . Therefore, ABC was introduced in 1980s to correct fundamental problems
of traditional standard-costing system.
Traditionally accounting information was used as the source of planning and controlling
operation as they were assumed to be accurate and relevant in reflecting the true cost of
products and services (Institute of Management Accountants 2006). So, typically the focus
was only on labor, material and overheads (Kaplan R.S & Anderson S.R 2007). Because
of the automation and changes in industrial engineering ability, instead of mass production
many companies started to offer a greater variety of products and services to different
types of target groups (Institute of Management Accountants 2006.)
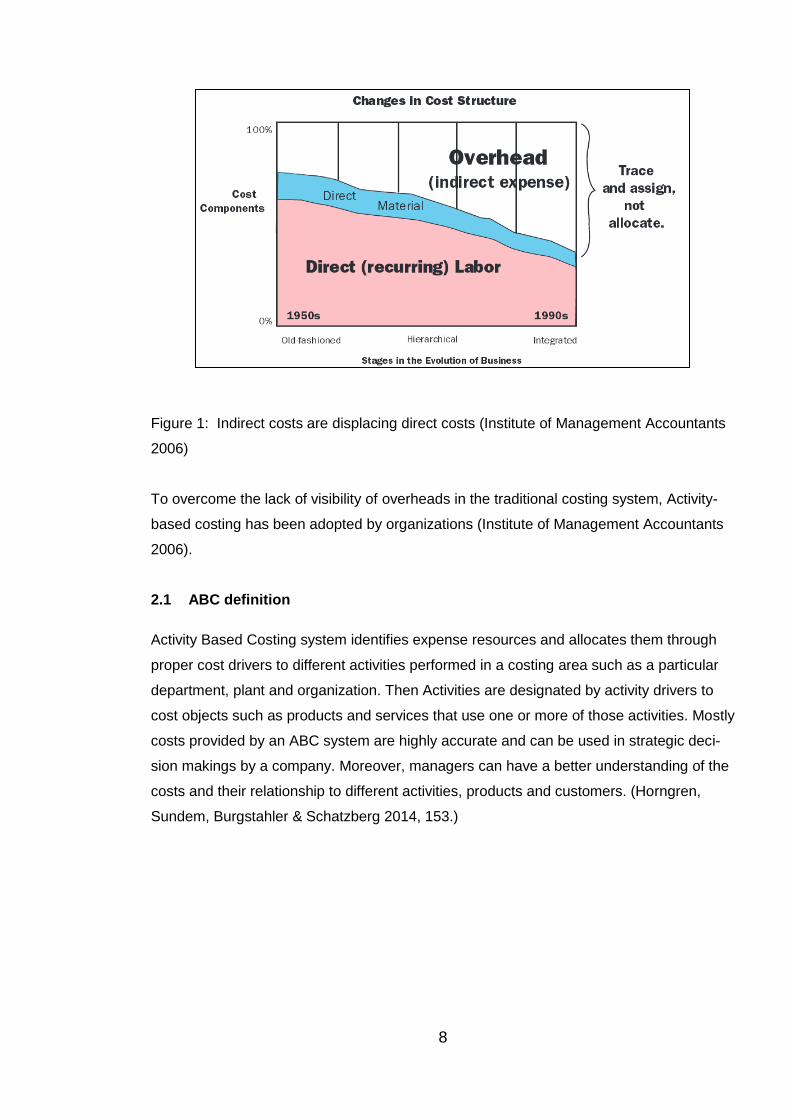
As figure 3 in the next page shows direct expenses are displaced by increasing of indirect
expenses. So, a traditional costing system is not applicable due to the rising of the over-
heads which are not assigned to the products or services and decision makers will be
misguided in the process of making decisions. (Institute of Management Accountants
2006.)
8
Figure 1: Indirect costs are displacing direct costs (Institute of Management Accountants
2006)
To overcome the lack of visibility of overheads in the traditional costing system, Activity-
based costing has been adopted by organizations (Institute of Management Accountants
2006).
2.1 ABC definition
Activity Based Costing system identifies expense resources and allocates them through
proper cost drivers to different activities performed in a costing area such as a particular
department, plant and organization. Then Activities are designated by activity drivers to
cost objects such as products and services that use one or more of those activities. Mostly
costs provided by an ABC system are highly accurate and can be used in strategic deci-
sion makings by a company. Moreover, managers can have a better understanding of the
costs and their relationship to different activities, products and customers. (Horngren,
Sundem, Burgstahler & Schatzberg 2014, 153.)
9
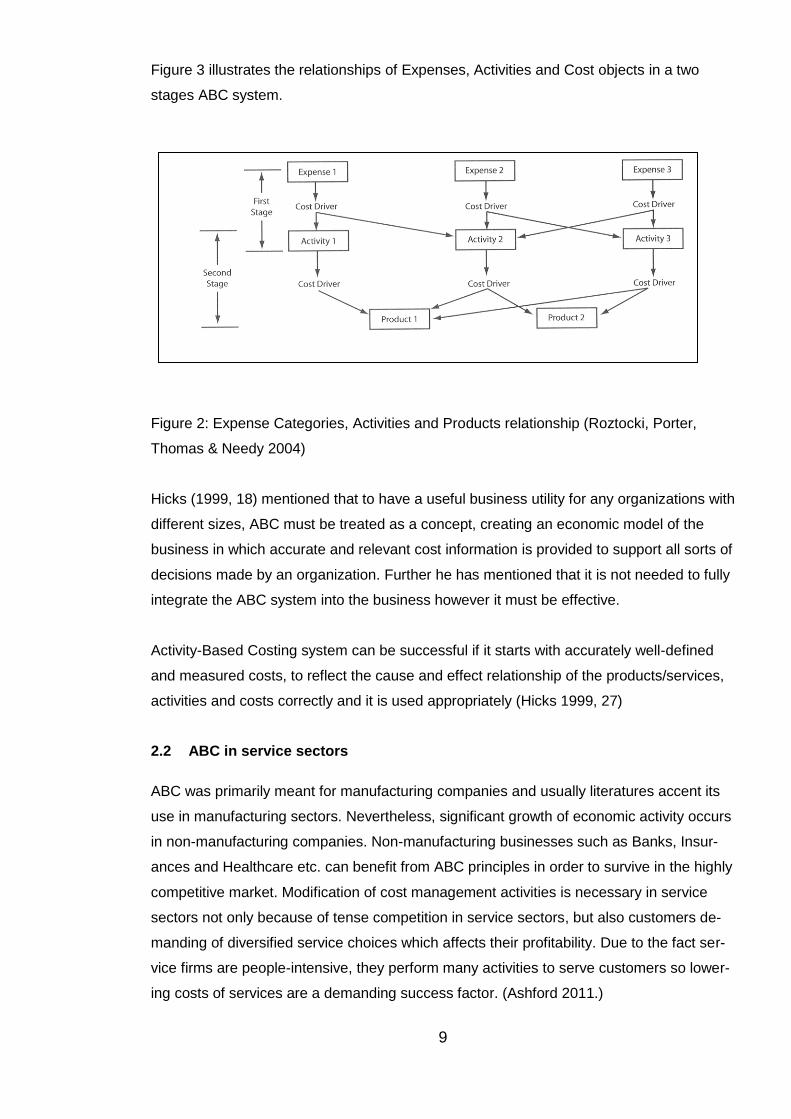
Figure 3 illustrates the relationships of Expenses, Activities and Cost objects in a two
stages ABC system.
Figure 2: Expense Categories, Activities and Products relationship (Roztocki, Porter,
Thomas & Needy 2004)
Hicks (1999, 18) mentioned that to have a useful business utility for any organizations with
different sizes, ABC must be treated as a concept, creating an economic model of the
business in which accurate and relevant cost information is provided to support all sorts of
decisions made by an organization. Further he has mentioned that it is not needed to fully
integrate the ABC system into the business however it must be effective.
Activity-Based Costing system can be successful if it starts with accurately well-defined
and measured costs, to reflect the cause and effect relationship of the products/services,
activities and costs correctly and it is used appropriately (Hicks 1999, 27)
2.2 ABC in service sectors
ABC was primarily meant for manufacturing companies and usually literatures accent its
use in manufacturing sectors. Nevertheless, significant growth of economic activity occurs
in non-manufacturing companies. Non-manufacturing businesses such as Banks, Insur-
ances and Healthcare etc. can benefit from ABC principles in order to survive in the highly
competitive market. Modification of cost management activities is necessary in service
sectors not only because of tense competition in service sectors, but also customers de-
manding of diversified service choices which affects their profitability. Due to the fact ser-
vice firms are people-intensive, they perform many activities to serve customers so lower-
ing costs of services are a demanding success factor. (Ashford 2011.)
10
Managers in service firms can use ABC as a tool to identify and reform unnecessary activ-
ities to increase customer profitability. As consumption of resources such as direct labor
costs and overheads varies by each customer a proper tracking and assigning of costs
enables firms to evaluate and analyze each customer’s profitability. (Ashford 2011.)
2.3 Advantages and disadvantages
All types of costing methods have advantages and disadvantages but, some of them are
more convenient. So, they are more often accepted and used by businesses in different
manufacturing or services industries. One of the main reasons for using ABC in service
companies is that marketing strategies such as pricing, promotion, branding and etc. can
be implemented more effective and creative. More advantages and disadvantages of ABC
are mentioned below: (Onat, Anitsal, I. & Anitsal, M. 2014.)
Advantages:
Product cost improvement and enhancing performance measurement
More accurate cost information is provided
Cost reduction improvement
Activity based performance measurement
Applicable to cost objects other than products
Aiming to reduce costs
Disadvantages:
Complications in implementing of process
Difficult to identify activities
Difficult to collect data
Resistance to change from management and employees
First, implementing ABC system gives the case company the advantage of having a cost-
ing system to identify and understand its costs properly. Second, the company can use
this tool to make plenty of the decisions from which dropping or accepting places, is the
major one. Timing and Data collecting are the two disadvantages that the company will
face. Currently, the company does not trace its costs properly and there is no costing sys-
tem. Records of the expenses are not available or difficult to find. Therefore, because of
the level of efforts in the beginning to trace and collect information, the staff in the main
office may not be reluctant to use the system. But once they see the benefit of using it,
they will be persuaded to use and even improve the current tool.
11
2.4 Costs and cost behavior
Costs are usually monetary measurements of sacrificed resources for achieving specified
goals and objectives (Drury 2008, 27). Costs can be actual or budgeted. Actual costs are
the real costs of acquiring goods and services, and budgeted costs, are estimated costs
that will be incurred in the future. However, cost is a different term from expense. As it has
already been mentioned costs are monetary measurements of used resources in produc-
ing products or offering services. But, Expenses are those costs which have already hap-
pened and are deducted from revenue. The remaining unused costs are counted as as-
sets. To clarify this, depreciation expense is used as an example. Depreciation on an as-
set such as a plant will be booked into the profit and loss account and the remaining cost
of the plant will be counted as an asset in the balance sheet. (Arora 2009.) Costs can be
further classified into Direct and Indirect (Drury 2008, 28).
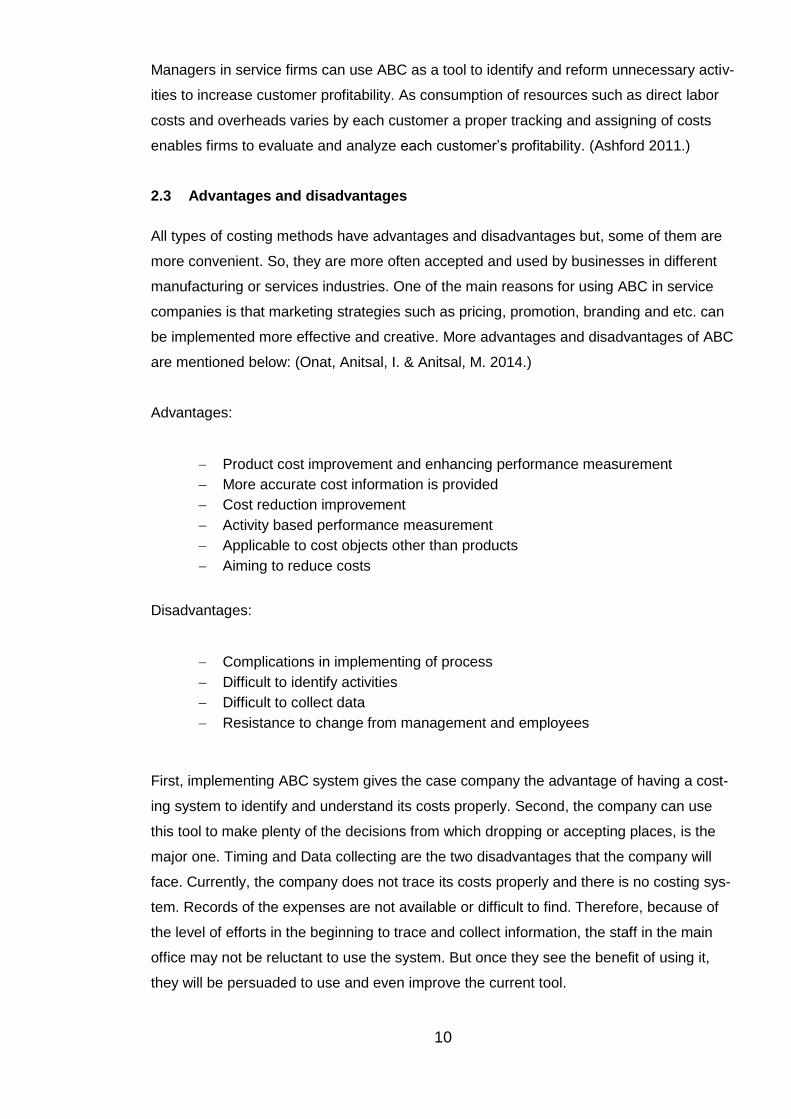
To determine the cost of services and products companies must be able to classify and
distinguish costs based on their nature. Costs can be classified as direct and indirect, re-
garding the cost object. A cost object is anything that requires a separate measurement.
Direct costs such as direct materials and direct labors are costs that are traceable to the
cost object. While indirect cost such as indirect materials and indirect labors are related
costs to cost objects, but they cannot be traced directly to cost objects. (Braun & Tietz
2013, 53.) Figure 4 illustrates cost assignment to a cost object.
However, for making proper decisions cost behavior and changing pattern must be under-
stood by managers. Cost behavior can be divided into three categories: Variable costs,
Fixed costs, Mixed costs. (Horngren & al. 2014, 60.) Figure 6 illustrates variable and fixed
costs. Variable costs change in direct proportion of changes in the amount of total activity
or volume. Despite, changes in total variable cost, they remain the same per unit. (Braun
& Tietz 2013, 320.) Fixed costs do not change in direct proportion of changes in the
amount of total activity and volume in a given period, but direct fixed costs are not con-
TYPE OF COST
COST ASIGN-
MENT
Cost Tracing
Based on material
requisition documents
Cost Allocation
no requisition document
Direct Costs
Indirect
Costs
COST OBJECT
Department
Customer
Line of Busi-
ness
Figure: Cost assignment to a cost object (Horngren & al. 2012, 51)
12
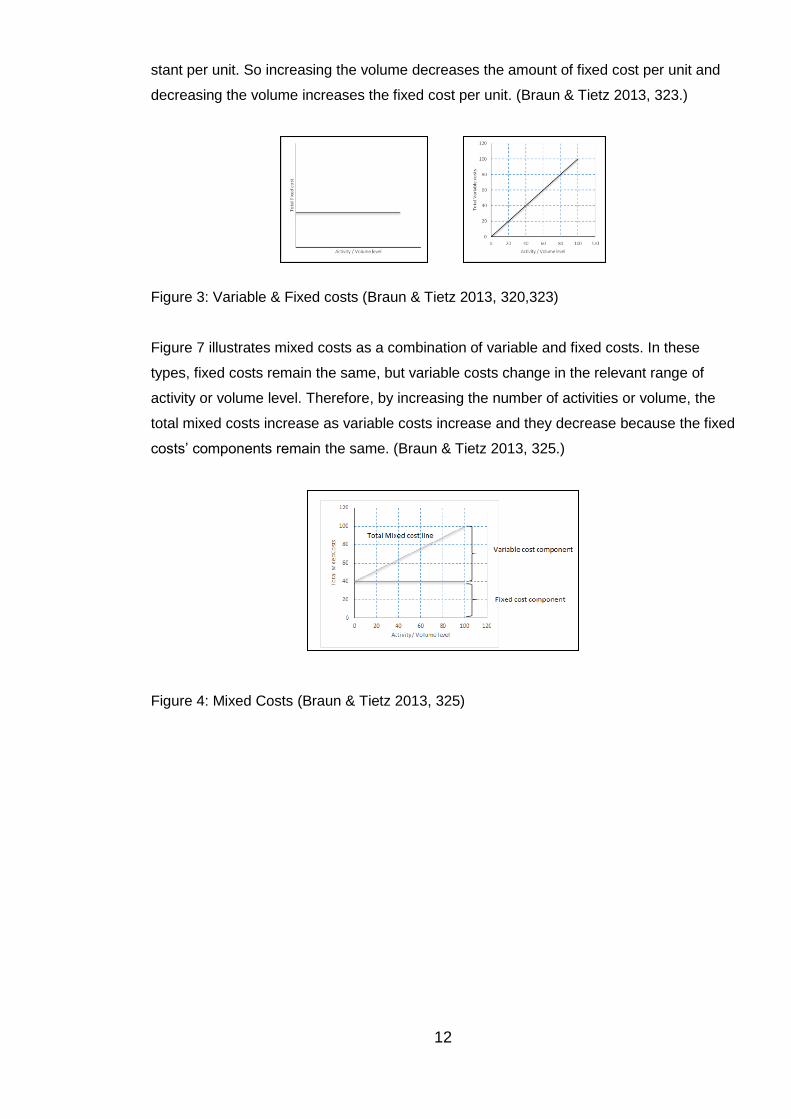
stant per unit. So increasing the volume decreases the amount of fixed cost per unit and
decreasing the volume increases the fixed cost per unit. (Braun & Tietz 2013, 323.)
Figure 3: Variable & Fixed costs (Braun & Tietz 2013, 320,323)
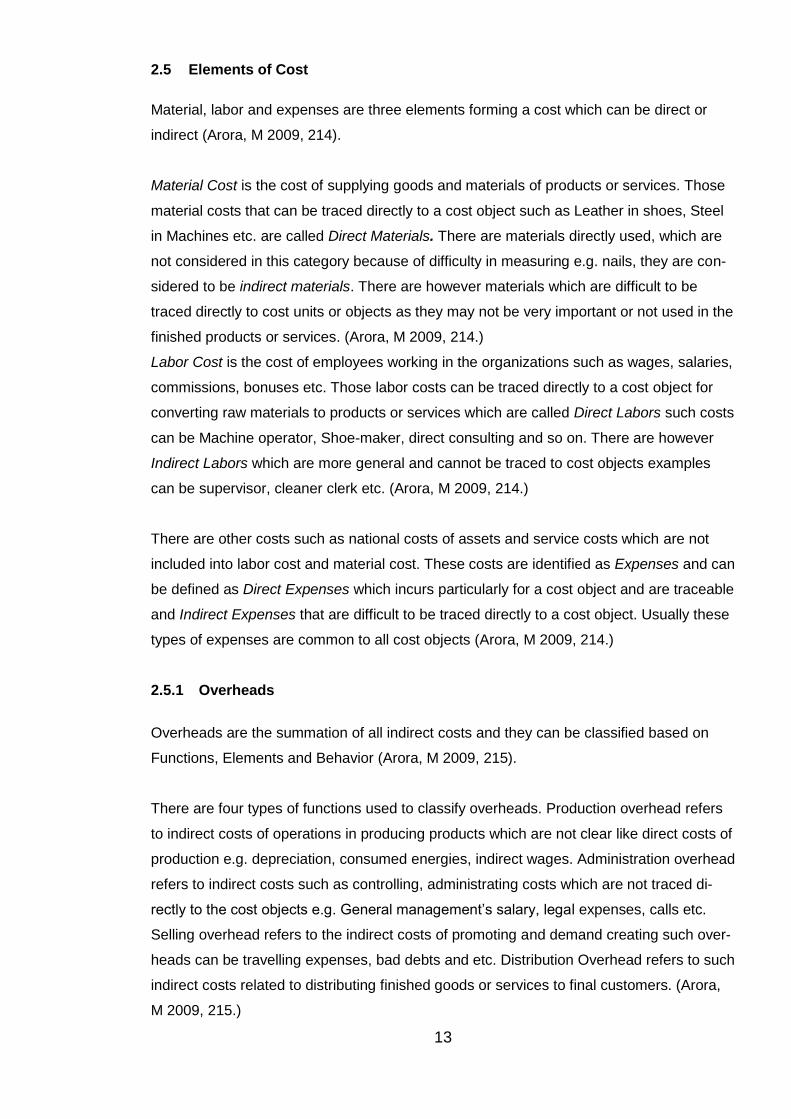
Figure 7 illustrates mixed costs as a combination of variable and fixed costs. In these
types, fixed costs remain the same, but variable costs change in the relevant range of
activity or volume level. Therefore, by increasing the number of activities or volume, the
total mixed costs increase as variable costs increase and they decrease because the fixed
costs’ components remain the same. (Braun & Tietz 2013, 325.)
Figure 4: Mixed Costs (Braun & Tietz 2013, 325)
13
2.5 Elements of Cost
Material, labor and expenses are three elements forming a cost which can be direct or
indirect (Arora, M 2009, 214).
Material Cost is the cost of supplying goods and materials of products or services. Those
material costs that can be traced directly to a cost object such as Leather in shoes, Steel
in Machines etc. are called Direct Materials. There are materials directly used, which are
not considered in this category because of difficulty in measuring e.g. nails, they are con-
sidered to be indirect materials. There are however materials which are difficult to be
traced directly to cost units or objects as they may not be very important or not used in the
finished products or services. (Arora, M 2009, 214.)
Labor Cost is the cost of employees working in the organizations such as wages, salaries,
commissions, bonuses etc. Those labor costs can be traced directly to a cost object for
converting raw materials to products or services which are called Direct Labors such costs
can be Machine operator, Shoe-maker, direct consulting and so on. There are however
Indirect Labors which are more general and cannot be traced to cost objects examples
can be supervisor, cleaner clerk etc. (Arora, M 2009, 214.)
There are other costs such as national costs of assets and service costs which are not
included into labor cost and material cost. These costs are identified as Expenses and can
be defined as Direct Expenses which incurs particularly for a cost object and are traceable
and Indirect Expenses that are difficult to be traced directly to a cost object. Usually these
types of expenses are common to all cost objects (Arora, M 2009, 214.)
2.5.1 Overheads
Overheads are the summation of all indirect costs and they can be classified based on
Functions, Elements and Behavior (Arora, M 2009, 215).
There are four types of functions used to classify overheads. Production overhead refers
to indirect costs of operations in producing products which are not clear like direct costs of
production e.g. depreciation, consumed energies, indirect wages. Administration overhead
refers to indirect costs such as controlling, administrating costs which are not traced di-
rectly to the cost objects e.g. General management’s salary, legal expenses, calls etc.
Selling overhead refers to the indirect costs of promoting and demand creating such over-
heads can be travelling expenses, bad debts and etc. Distribution Overhead refers to such
indirect costs related to distributing finished goods or services to final customers. (Arora,
M 2009, 215.)
14
Overheads can be classified based on the Elements and origins of expenses as well. The
classification is made based on the Indirect Materials, Indirect Wages and Indirect Ex-
penses. Moreover, overheads can be classified based on the Behavior of the costs which
are Fixed, Variable and Mixed. (Arora, M 2009, 215.) These terms have been already ex-
plained.
2.6 Sources of data collection
Information can be obtained by interviewing people who are directly involved in performing
activities, using general ledger (Income statement) to get elements of cost and IT system
which has all the required measurements and information about cost object. These
sources will be used to create an ABC system. Collected data is used to identify activities,
elements of cost, cause and effect relationship determination and identifying accurate cost
drivers for allocating expense resources to activities and activity costs to cost objects.
(Institute of Management Accountants 2006.)
2.7 Key components of Activity-Based Costing
Key components of Activity-Based Costing are Expenses resources, Cost drivers, Activi-
ties, Activity drivers and Cost objects (Bahnub 2010).
Expense resources are means and resources consumed by activities to achieve the goal.
They can be categorized and grouped in a logical way to form cost pools. (Bahnub 2010,
2.) Example of Expense resources are Administration, Depreciation, Rent & utilities, Office
expenses, Transport, Advertising, etc. (Roztocki & al. 2004).
Cost drivers are assessment indicators of the usage level of expense resources by activi-
ties. Cost drivers must be different for each costing pool otherwise it is possible to com-
bine costing pools (Bahnub 2010, 4.)
Activities are performed by people in an enterprise to add value to products and services
for serving customers and meeting their requirements (Investopedia 2015c). Therefore,
activities consume resources which are manageable. Each activity consists of certain
tasks representing the logical process model of the business. Moreover, to achieve a goal
related and interrelated activities are grouped together to form a process. (Bahnub 2010,
4.)

15
Activity drivers are assessment indicators of activities’ usage by cost objects. However if
activity drivers are the same for some activities it is possible to combine activities (Bahnub
2010, 4.)
Cost objects can be anything such as customers, departments, processes, etc. that use
activities performed in an organization (Bahnub 2010, 4).
2.8 Implementation Guidelines and Steps
The refined costing system (Activity-Based Costing) can be implemented by following the
three guidelines and seven steps (Horngren & al. 2012).
Required guidelines are (Horngren & al. 2012, 168):
1- Tracing direct costs: By identifying all relevant direct costs the amount of indirect costs classification will be minimized.
2- Creating Indirect cost pools: the aim is to gather indirect costs and create homogene-ous cost pools as many as possible. Homogeneous cost pools have a cause and ef-fect relationship with one of the cost drivers which will be used as the cost allocation base.
3- Identifying Cost allocation bases: cost drivers are used as cost allocation bases for every single homogeneous cost pools.
Required implementing steps are (Horngren & al.2012, 172):
1- Identifying cost objects: in this step cost objects must be identified based on the com-pany’s goal of calculating costs and allocating overheads.
2- Identifying direct costs of cost objects: in this step direct cost related to cost objects are identified so there is no need for them to be allocated by using allocation bases. Direct cost such as e.g. material cost, labor cost, maintenance costs, etc. can be iden-tified by analyzing financial statements (Roztocki 2001).
3- Identifying activities and allocation bases for allocating indirect costs to cost objects: in
this step activities are identified by analyzing the business process (Roztocki & al. 2004). Cost allocation base provides reliable data and measurement information about grouping homogeneous activities and costs which have the same cost drivers. If ob-taining data for the measurement is difficult, other complex measurements might be used. (Horngren & al. 2012.)
4- Identifying indirect costs of activities: in this step overheads (Indirect costs) are as-
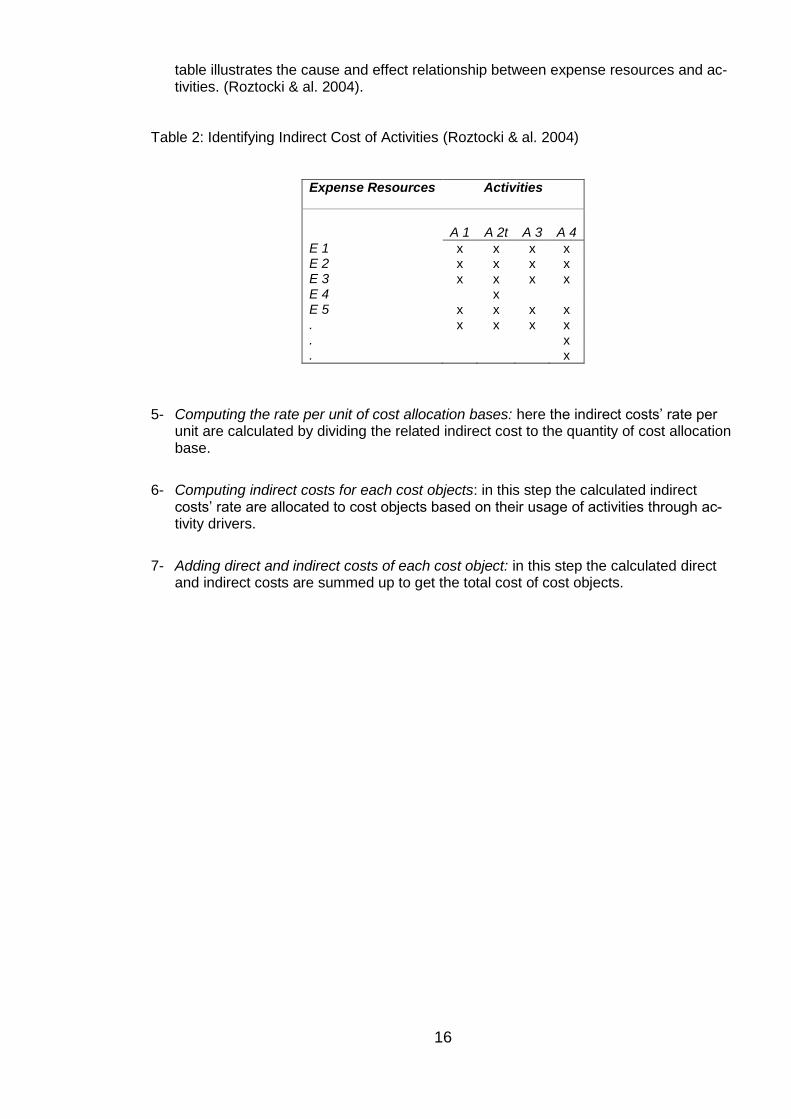
signed to activities based on the cause and effect relationships between cost alloca-tion bases of costs and activities, however the relationship varies from one cost pool to another. Table 2 can be used to identify indirect costs of activities. The sign X in this
16
table illustrates the cause and effect relationship between expense resources and ac-tivities. (Roztocki & al. 2004).
Table 2: Identifying Indirect Cost of Activities (Roztocki & al. 2004)
Expense Resources Activities
A 1
A 2t
A 3
A 4
E 1 x x x x E 2 x x x x E 3 x x x x E 4 x E 5 x x x x . x x x x . x . x
5- Computing the rate per unit of cost allocation bases: here the indirect costs’ rate per
unit are calculated by dividing the related indirect cost to the quantity of cost allocation base.
6- Computing indirect costs for each cost objects: in this step the calculated indirect costs’ rate are allocated to cost objects based on their usage of activities through ac-tivity drivers.
7- Adding direct and indirect costs of each cost object: in this step the calculated direct and indirect costs are summed up to get the total cost of cost objects.
17
3 Implementing ABC to the company X
This chapter explains the implementation process and testing the tool at the same time.
Tables are generated with manipulated numbers from income statement and interviewing
the Manager of the company.
The process begun with interviewing the general manager of the company, to understand
the company’s structure and requirements from the tool and the refined costing system.
There were four meetings which each of them last for 2 hours. After the first meeting the
process of gathering information and creating theoretical framework started. The other
three meeting sessions were about checking the outcome of analysis, informing the man-
ager about the progress of the processes and requiring more information. In order to un-
derstand the topic and creating theoretical framework a desktop study was conducted.
Then all information related to the topic was gathered and analyzed according to the ABC
implementation steps and requirements of the company. Afterward by analyzing gathered
data the required theories for creating an Activity-based costing system tool were picked
up and the goal of the project which is “understanding the cost structure and its relevancy
to operating places” were defined clearly.
3.1 Discussion
It has already been mentioned that the company is in the business of providing evening
after school services for children and is a sub-contractor of the municipality Y. The opera-
tions are performed in six different places and there is a main office from where all the
other places are managed. Activities of the company can be divided into instruction activi-
ties taken place in operating places and supporting managerial activities performed in the
main office. The activities performed in operating places are to instruct children and con-
sidered to be direct activities related to providing the service. Therefore, activities taking
place in the main office are considered to be Indirect activities. All activities are consuming
certain types of costs whether direct or indirect. This project aims to allocate costs occur-
ring in the main office which are considered to be overheads (Indirect costs) to each oper-
ating places to understand the real cost of running them and consequently analyzing prof-
itability of places and their contribution to the total revenue.
When the municipality Y decides to offer a school with such a service, it will request pro-
posals from different service providers such as the case company. Therefore each firm
provides the municipality with their proposals including types of services (Activities to en-
tertain and taking care of children) and quality of their services.
18
Over the past few years the company has expanded from one operating place with two
people to the current 6 operating places (Clubs) with 25 staffs and a main office. Reve-
nues from each operating place varies regarding the number of children, types of services
required such as services for normal students or special students as well as the amount of
the part-time or full-time customers.
Once providing services to an operating place is given to the company, managerial team
(consists of the owner and general manager) starts planning process to run the place.
Planning is necessary for budgeting, recruiting, identifying activities, required facilities and
etc.
By starting the educational season in the middle of August the managerial team in the
main office gets engaged with more activities in order to provide sufficient services to
each one of the places at hand. The performance of clubs is monitored on the daily basis
through responsive instructors (Director). Usually each club has one director plus other
instructors which the number is dependent on the amount of children in the club. The
company not only records working hours every day but also checks inventory to see if
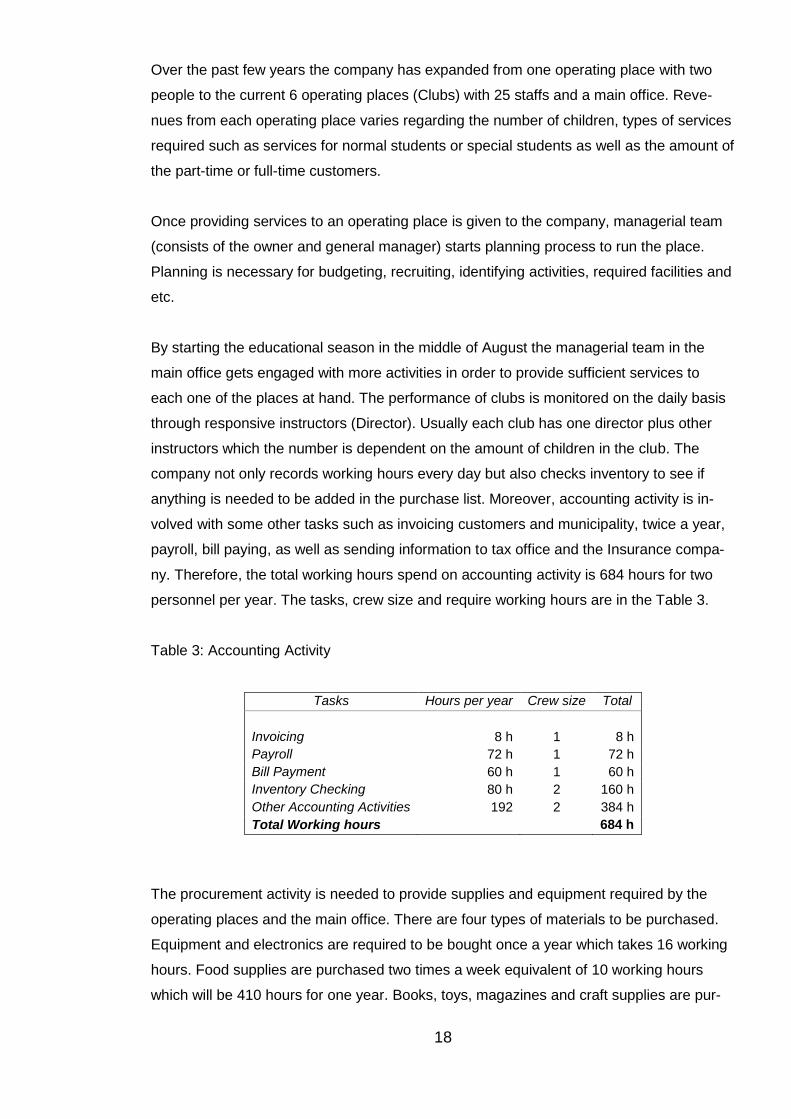
anything is needed to be added in the purchase list. Moreover, accounting activity is in-
volved with some other tasks such as invoicing customers and municipality, twice a year,
payroll, bill paying, as well as sending information to tax office and the Insurance compa-
ny. Therefore, the total working hours spend on accounting activity is 684 hours for two
personnel per year. The tasks, crew size and require working hours are in the Table 3.
Table 3: Accounting Activity
Tasks Hours per year Crew size Total
Invoicing
8 h
1
8 h
Payroll 72 h 1 72 h
Bill Payment 60 h 1 60 h
Inventory Checking 80 h 2 160 h
Other Accounting Activities 192 2 384 h
Total Working hours 684 h
The procurement activity is needed to provide supplies and equipment required by the
operating places and the main office. There are four types of materials to be purchased.
Equipment and electronics are required to be bought once a year which takes 16 working
hours. Food supplies are purchased two times a week equivalent of 10 working hours
which will be 410 hours for one year. Books, toys, magazines and craft supplies are pur-
19
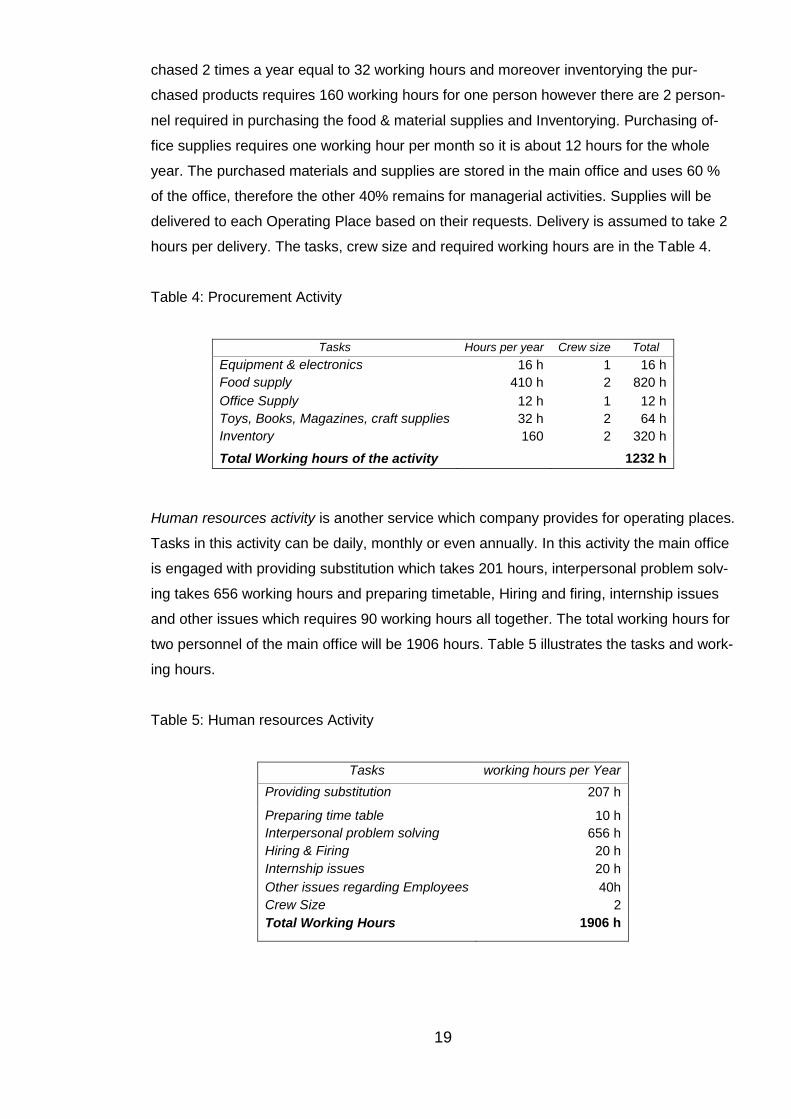
chased 2 times a year equal to 32 working hours and moreover inventorying the pur-
chased products requires 160 working hours for one person however there are 2 person-
nel required in purchasing the food & material supplies and Inventorying. Purchasing of-
fice supplies requires one working hour per month so it is about 12 hours for the whole
year. The purchased materials and supplies are stored in the main office and uses 60 %
of the office, therefore the other 40% remains for managerial activities. Supplies will be
delivered to each Operating Place based on their requests. Delivery is assumed to take 2
hours per delivery. The tasks, crew size and required working hours are in the Table 4.
Table 4: Procurement Activity
Tasks Hours per year Crew size Total
Equipment & electronics 16 h 1 16 h
Food supply 410 h 2 820 h
Office Supply 12 h 1 12 h
Toys, Books, Magazines, craft supplies 32 h 2 64 h
Inventory 160 2 320 h
Total Working hours of the activity 1232 h
Human resources activity is another service which company provides for operating places.
Tasks in this activity can be daily, monthly or even annually. In this activity the main office
is engaged with providing substitution which takes 201 hours, interpersonal problem solv-
ing takes 656 working hours and preparing timetable, Hiring and firing, internship issues
and other issues which requires 90 working hours all together. The total working hours for
two personnel of the main office will be 1906 hours. Table 5 illustrates the tasks and work-
ing hours.
Table 5: Human resources Activity
Tasks working hours per Year
Providing substitution 207 h
Preparing time table 10 h
Interpersonal problem solving 656 h
Hiring & Firing 20 h
Internship issues 20 h
Other issues regarding Employees 40h
Crew Size 2
Total Working Hours 1906 h
20
Transportation activity is required to deliver supplies to operating places and purchasing
of the supplies. Another purpose is to deliver employees from one place to another be-
cause of meetings for instance with families and municipality or internal meeting of the
company.
The educational season will end on 31 May. Then it is time to close the books, and to
open a new book for the next educational year. During the summer the operating places
are closed but the main office is open and the owner and the general manager are work-
ing on planning, scheduling and other business related issues. All of other possible activi-
ties like dealing with the municipality, banks, insurances and others are considered to be
included in General & Administration activity pool.
3.2 Cost and cost behavior of the company
Regarding the operations and providing services, different types of costs incur in the com-
pany. Costs of the company are categorized based on the elements of costs which are
Material, Labor and Expenses. Elements of Costs can be Direct or Indirect.
Direct costs are those that can be traced back directly to the operating places and Indirect
Costs are those costs incurring in the main office. It is important to mention some costs
such as interests and taxes as well as fixed material costs such as furniture, computers,
and mobile phones, snack dining, car, toys, books and magazines are not included into
the calculation of overheads to operating places. Those costs are business costs and are
not periodically used but they can get depreciated which is used into the calculations
(Hicks 1999, 34).
21
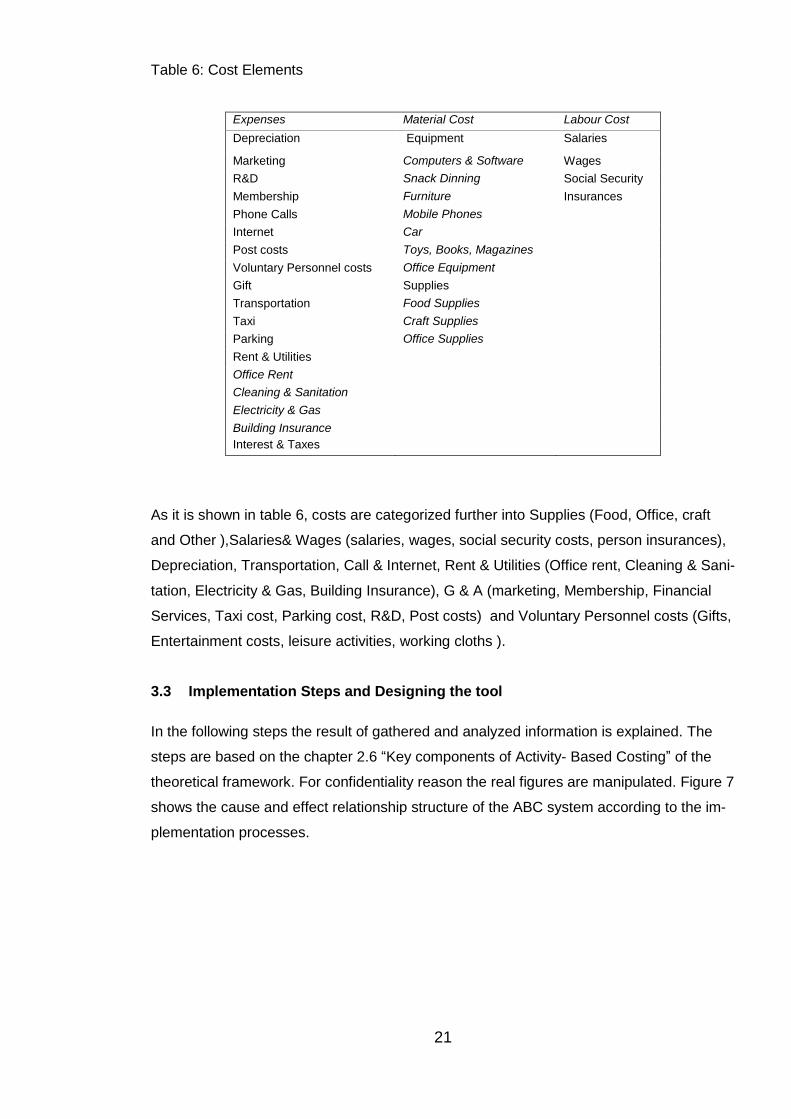
Table 6: Cost Elements
Expenses Material Cost Labour Cost
Depreciation Equipment Salaries
Marketing Computers & Software Wages
R&D Snack Dinning Social Security
Membership Furniture Insurances
Phone Calls Mobile Phones
Internet Car
Post costs Toys, Books, Magazines
Voluntary Personnel costs Office Equipment
Gift Supplies
Transportation Food Supplies
Taxi Craft Supplies
Parking Office Supplies
Rent & Utilities
Office Rent
Cleaning & Sanitation
Electricity & Gas
Building Insurance
Interest & Taxes
As it is shown in table 6, costs are categorized further into Supplies (Food, Office, craft
and Other ),Salaries& Wages (salaries, wages, social security costs, person insurances),
Depreciation, Transportation, Call & Internet, Rent & Utilities (Office rent, Cleaning & Sani-
tation, Electricity & Gas, Building Insurance), G & A (marketing, Membership, Financial
Services, Taxi cost, Parking cost, R&D, Post costs) and Voluntary Personnel costs (Gifts,
Entertainment costs, leisure activities, working cloths ).
3.3 Implementation Steps and Designing the tool
In the following steps the result of gathered and analyzed information is explained. The
steps are based on the chapter 2.6 “Key components of Activity- Based Costing” of the
theoretical framework. For confidentiality reason the real figures are manipulated. Figure 7
shows the cause and effect relationship structure of the ABC system according to the im-
plementation processes.

22
Figure 5: Expense Categories, Activities and Products relationship of The company
(Horngren & al. 2012)
Before going any further, figures from income statement is required. Therefor the tool is
started by Schedule # 1 which is illustrated in Table 7. It is designed based on the income
statement format of the company.
In this schedule, the total revenue of the company for the year XXXX is 687,686 €. The
total cost is 552,188 € which is 80 % of the revenue and the other 20% which is 135,498€
is Earnings before interest and tax.
Now we will continue to the implementation steps in the next pages starting by identifying
Cos objects.

23
Table 7: Income Statement
Income Statement Year XXXX Schedule #1
Company X € % of Total Revenue
Turnover 687,686 Club Income 266,104 Grands 421,582 Total Material Cost 6,728 1%
Supplies 6,728 Food Supplies 3,744
Craft Supplies 468 Office Supplies 2,516
Total Salaries & wages 497,750 72%
Salaries 160,000 Wages 229,182 Social Security 108,568 Insurances
Total Expenses 47,710 7%
Depreciation 2,280 Transportation 14,165
Rent & Utilities 12,642 Office Rent 12,279 Cleaning & Sanitation 363 Electricity & Gas -
Building Insurance - Phone Calls & Internet 10,770
G &A 7,853 Financial service cost 207 Marketing 1,623 R&D 602 Membership fees 1,302 Post costs 95 Taxi 52 Parking -
Total Voluntary Personnel costs 3,972
Entertainments and leisure 164 Gift for personnel - Voluntary Personnel costs 3,808
Total Costs 552,188 80%
EBIT 135,498 20%
3.3.1 Identifying Cost objects
Cost objects can be whether the operating places, customer groups or an individual cus-
tomer. In this case Operating Places are identified as cost objects according to the consul-
tation with the thesis advisor and the requirements of the company. Currently the compa-
ny is running 6 Operating Places (Ops).Table 8 illustrates Schedule #3.1 which provides
information regarding the number of personnel, children, number of payrolls and invoices,
direct working hours and total distance Km of the Operating Places. The information in
this table will be used in the later calculation of assigning costs to activities and cost ob-
24
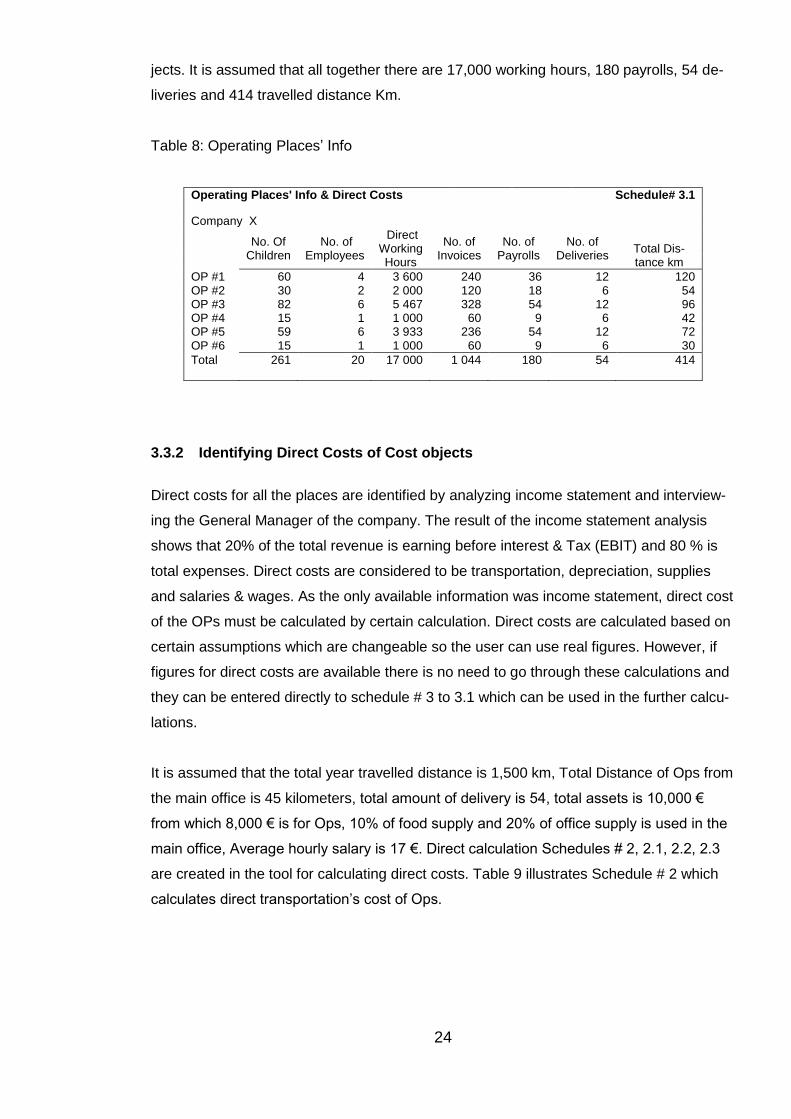
jects. It is assumed that all together there are 17,000 working hours, 180 payrolls, 54 de-
liveries and 414 travelled distance Km.
Table 8: Operating Places’ Info
Operating Places' Info & Direct Costs Schedule# 3.1
Company X
No. Of Children
No. of Employees
Direct Working Hours
No. of Invoices
No. of Payrolls
No. of Deliveries
Total Dis-tance km
OP #1 60 4 3 600 240 36 12 120 OP #2 30 2 2 000 120 18 6 54 OP #3 82 6 5 467 328 54 12 96 OP #4 15 1 1 000 60 9 6 42 OP #5 59 6 3 933 236 54 12 72 OP #6 15 1 1 000 60 9 6 30
Total 261 20 17 000 1 044 180 54 414
3.3.2 Identifying Direct Costs of Cost objects
Direct costs for all the places are identified by analyzing income statement and interview-
ing the General Manager of the company. The result of the income statement analysis
shows that 20% of the total revenue is earning before interest & Tax (EBIT) and 80 % is
total expenses. Direct costs are considered to be transportation, depreciation, supplies
and salaries & wages. As the only available information was income statement, direct cost
of the OPs must be calculated by certain calculation. Direct costs are calculated based on
certain assumptions which are changeable so the user can use real figures. However, if
figures for direct costs are available there is no need to go through these calculations and
they can be entered directly to schedule # 3 to 3.1 which can be used in the further calcu-
lations.
It is assumed that the total year travelled distance is 1,500 km, Total Distance of Ops from
the main office is 45 kilometers, total amount of delivery is 54, total assets is 10,000 €
from which 8,000 € is for Ops, 10% of food supply and 20% of office supply is used in the
main office, Average hourly salary is 17 €. Direct calculation Schedules # 2, 2.1, 2.2, 2.3
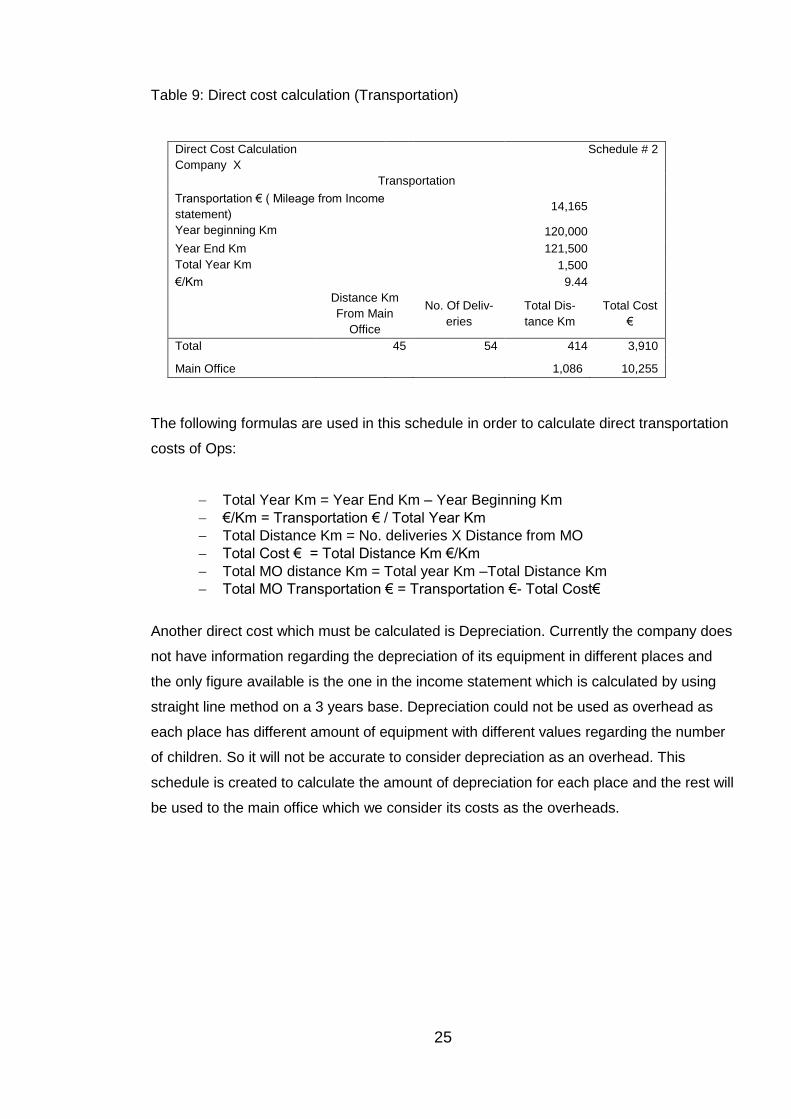
are created in the tool for calculating direct costs. Table 9 illustrates Schedule # 2 which
calculates direct transportation’s cost of Ops.
25
Table 9: Direct cost calculation (Transportation)
The following formulas are used in this schedule in order to calculate direct transportation
costs of Ops:
Total Year Km = Year End Km – Year Beginning Km
€/Km = Transportation € / Total Year Km
Total Distance Km = No. deliveries X Distance from MO
Total Cost € = Total Distance Km €/Km
Total MO distance Km = Total year Km –Total Distance Km
Total MO Transportation € = Transportation €- Total Cost€
Another direct cost which must be calculated is Depreciation. Currently the company does
not have information regarding the depreciation of its equipment in different places and
the only figure available is the one in the income statement which is calculated by using
straight line method on a 3 years base. Depreciation could not be used as overhead as
each place has different amount of equipment with different values regarding the number
of children. So it will not be accurate to consider depreciation as an overhead. This
schedule is created to calculate the amount of depreciation for each place and the rest will
be used to the main office which we consider its costs as the overheads.
Direct Cost Calculation Schedule # 2
Company X
Transportation
Transportation € ( Mileage from Income
statement)
14,165
Year beginning Km
120,000
Year End Km
121,500
Total Year Km
1,500
€/Km
9.44
Distance Km
From Main
Office
No. Of Deliv-
eries
Total Dis-
tance Km
Total Cost
€
Total 45 54 414 3,910
Main Office
1,086 10,255
26
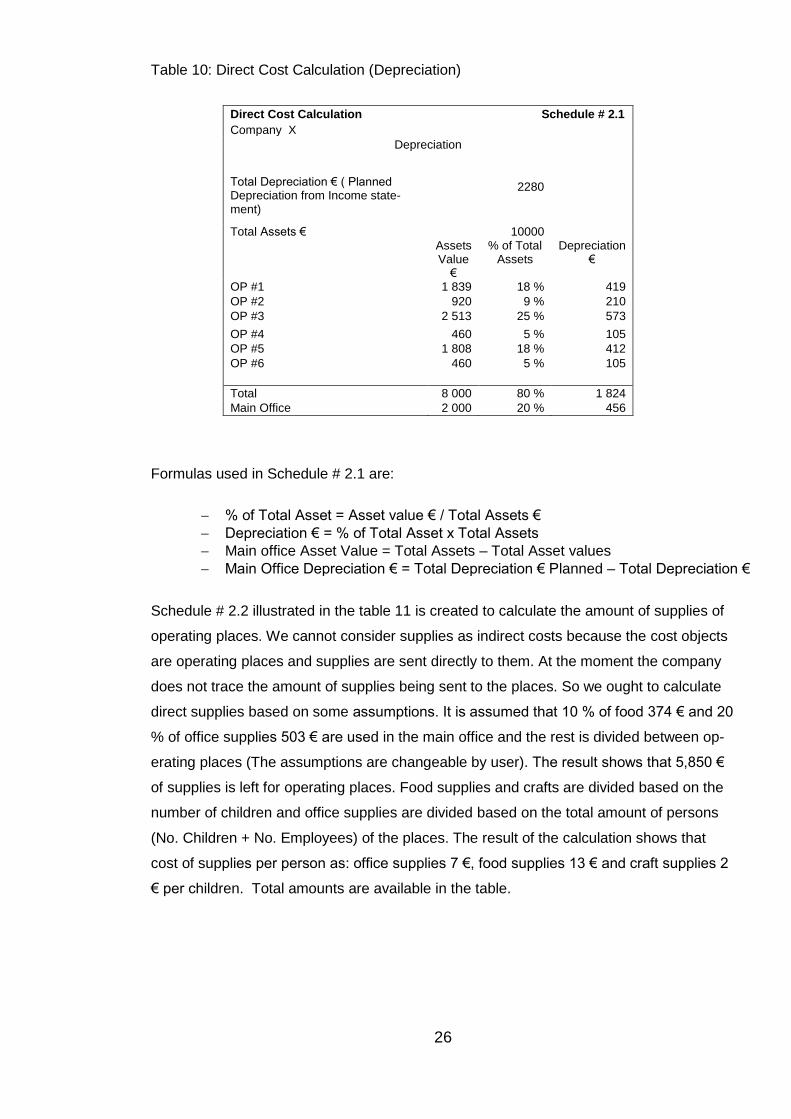
Table 10: Direct Cost Calculation (Depreciation)
Formulas used in Schedule # 2.1 are:
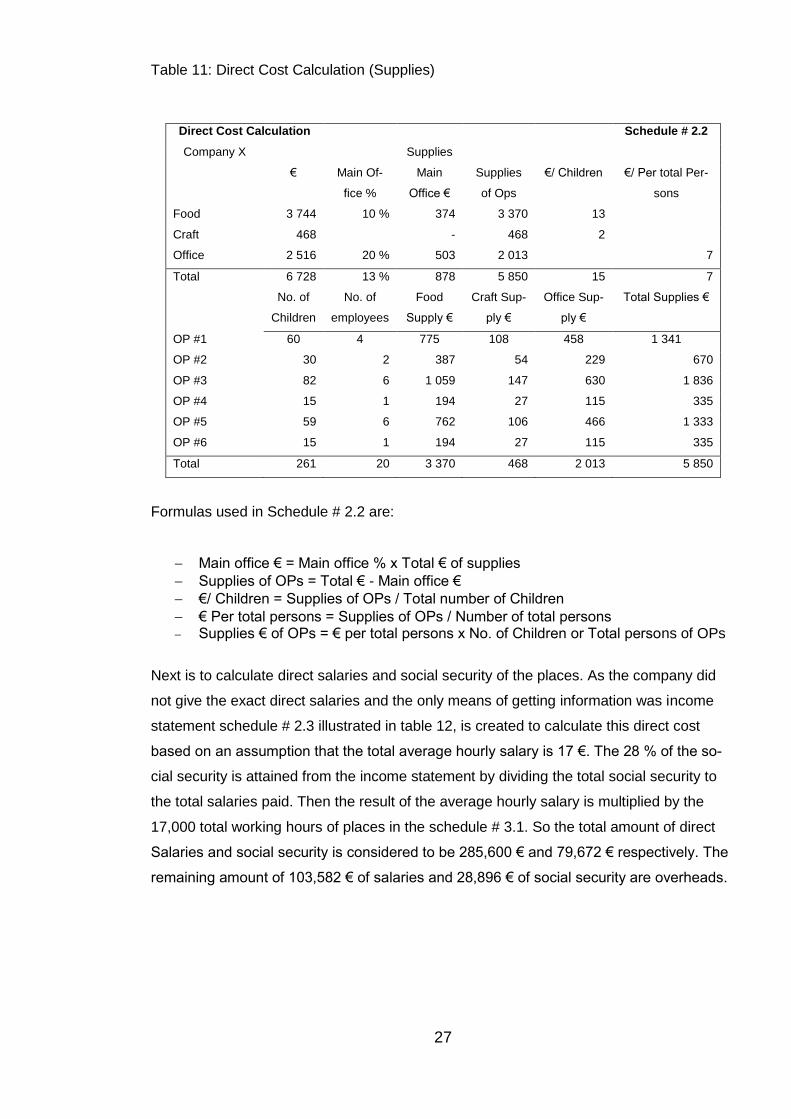
Schedule # 2.2 illustrated in the table 11 is created to calculate the amount of supplies of
operating places. We cannot consider supplies as indirect costs because the cost objects
are operating places and supplies are sent directly to them. At the moment the company
does not trace the amount of supplies being sent to the places. So we ought to calculate
direct supplies based on some assumptions. It is assumed that 10 % of food 374 € and 20
% of office supplies 503 € are used in the main office and the rest is divided between op-
erating places (The assumptions are changeable by user). The result shows that 5,850 €
of supplies is left for operating places. Food supplies and crafts are divided based on the
number of children and office supplies are divided based on the total amount of persons
(No. Children + No. Employees) of the places. The result of the calculation shows that
cost of supplies per person as: office supplies 7 €, food supplies 13 € and craft supplies 2
€ per children. Total amounts are available in the table.
Direct Cost Calculation Schedule # 2.1
Company X Depreciation
Total Depreciation € ( Planned Depreciation from Income state-ment)
2280
Total Assets € 10000
Assets Value
€
% of Total Assets
Depreciation €
OP #1 1 839 18 % 419
OP #2 920 9 % 210
OP #3 2 513 25 % 573
OP #4 460 5 % 105
OP #5 1 808 18 % 412
OP #6 460 5 % 105
Total 8 000 80 % 1 824
Main Office 2 000 20 % 456
% of Total Asset = Asset value € / Total Assets €
Depreciation € = % of Total Asset x Total Assets
Main office Asset Value = Total Assets – Total Asset values
Main Office Depreciation € = Total Depreciation € Planned – Total Depreciation €
27
Table 11: Direct Cost Calculation (Supplies)
Formulas used in Schedule # 2.2 are:
Main office € = Main office % x Total € of supplies
Supplies of OPs = Total € - Main office €
€/ Children = Supplies of OPs / Total number of Children
€ Per total persons = Supplies of OPs / Number of total persons Supplies € of OPs = € per total persons x No. of Children or Total persons of OPs
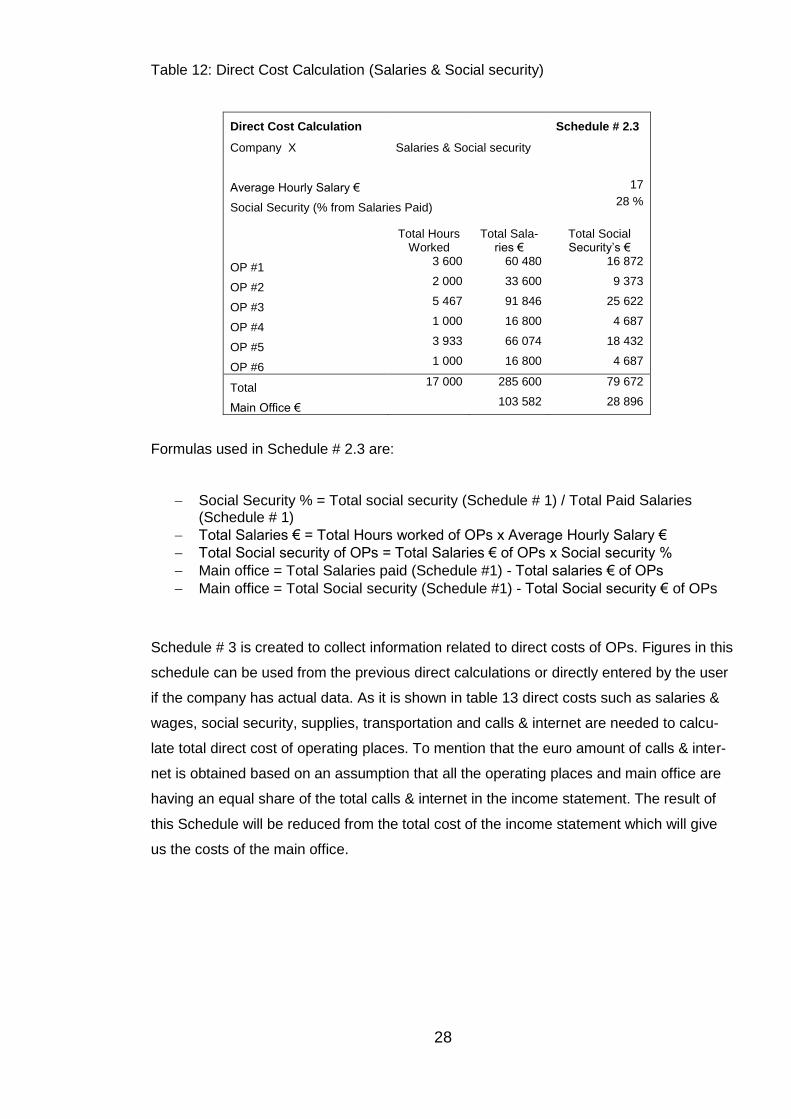
Next is to calculate direct salaries and social security of the places. As the company did
not give the exact direct salaries and the only means of getting information was income
statement schedule # 2.3 illustrated in table 12, is created to calculate this direct cost
based on an assumption that the total average hourly salary is 17 €. The 28 % of the so-
cial security is attained from the income statement by dividing the total social security to
the total salaries paid. Then the result of the average hourly salary is multiplied by the
17,000 total working hours of places in the schedule # 3.1. So the total amount of direct
Salaries and social security is considered to be 285,600 € and 79,672 € respectively. The
remaining amount of 103,582 € of salaries and 28,896 € of social security are overheads.
Direct Cost Calculation Schedule # 2.2
Company X Supplies
€ Main Of-
fice %
Main
Office €
Supplies
of Ops
€/ Children €/ Per total Per-
sons
Food 3 744 10 % 374 3 370 13
Craft 468 - 468 2
Office 2 516 20 % 503 2 013 7
Total 6 728 13 % 878 5 850 15 7
No. of
Children
No. of
employees
Food
Supply €
Craft Sup-
ply €
Office Sup-
ply €
Total Supplies €
OP #1 60 4 775 108 458 1 341
OP #2 30 2 387 54 229 670
OP #3 82 6 1 059 147 630 1 836
OP #4 15 1 194 27 115 335
OP #5 59 6 762 106 466 1 333
OP #6 15 1 194 27 115 335
Total 261 20 3 370 468 2 013 5 850
28
Table 12: Direct Cost Calculation (Salaries & Social security)
Direct Cost Calculation Schedule # 2.3
Company X Salaries & Social security
Average Hourly Salary €
17
Social Security (% from Salaries Paid)
28 %
Total Hours Worked
Total Sala-ries €
Total Social Security’s €
OP #1 3 600 60 480 16 872
OP #2 2 000 33 600 9 373
OP #3 5 467 91 846 25 622
OP #4 1 000 16 800 4 687
OP #5 3 933 66 074 18 432
OP #6 1 000 16 800 4 687
Total 17 000 285 600 79 672
Main Office € 103 582 28 896
Formulas used in Schedule # 2.3 are:
Social Security % = Total social security (Schedule # 1) / Total Paid Salaries (Schedule # 1)
Total Salaries € = Total Hours worked of OPs x Average Hourly Salary €
Total Social security of OPs = Total Salaries € of OPs x Social security %
Main office = Total Salaries paid (Schedule #1) - Total salaries € of OPs
Main office = Total Social security (Schedule #1) - Total Social security € of OPs
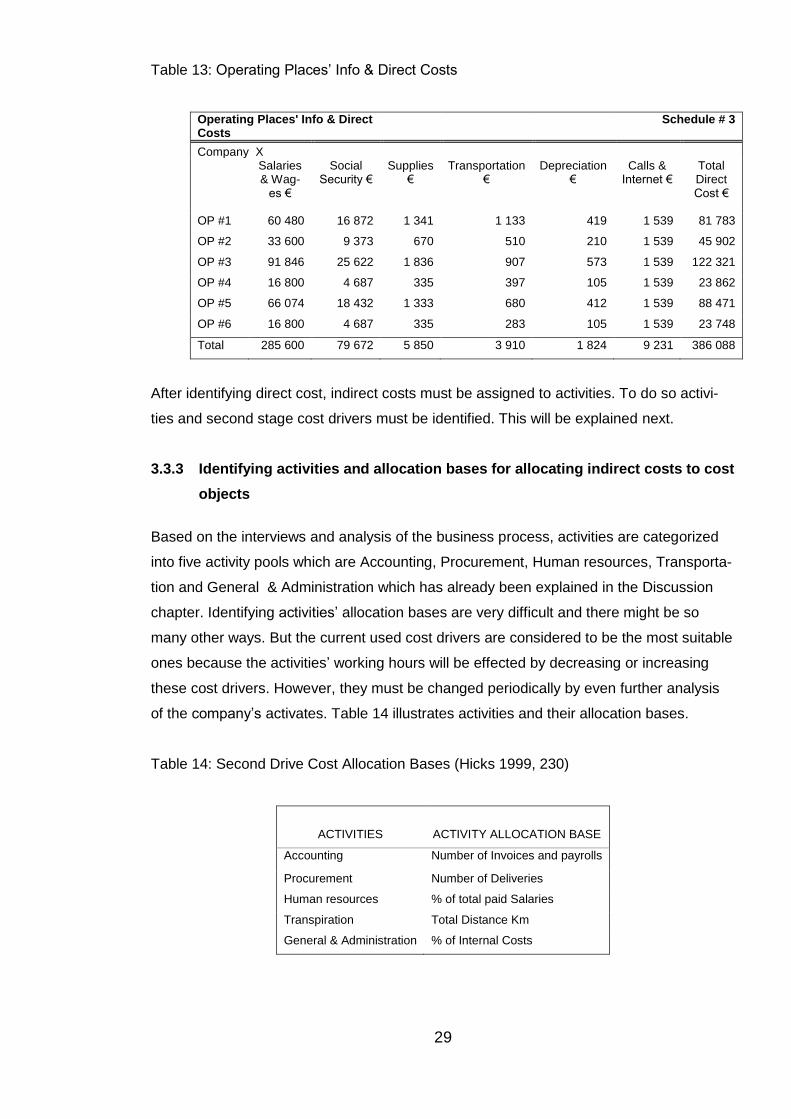
Schedule # 3 is created to collect information related to direct costs of OPs. Figures in this
schedule can be used from the previous direct calculations or directly entered by the user
if the company has actual data. As it is shown in table 13 direct costs such as salaries &
wages, social security, supplies, transportation and calls & internet are needed to calcu-
late total direct cost of operating places. To mention that the euro amount of calls & inter-
net is obtained based on an assumption that all the operating places and main office are
having an equal share of the total calls & internet in the income statement. The result of
this Schedule will be reduced from the total cost of the income statement which will give
us the costs of the main office.
29
Table 13: Operating Places’ Info & Direct Costs
Operating Places' Info & Direct Costs
Schedule # 3
Company X
Salaries & Wag-
es €
Social Security €
Supplies €
Transportation €
Depreciation €
Calls & Internet €
Total Direct Cost €
OP #1 60 480 16 872 1 341 1 133 419 1 539 81 783
OP #2 33 600 9 373 670 510 210 1 539 45 902
OP #3 91 846 25 622 1 836 907 573 1 539 122 321
OP #4 16 800 4 687 335 397 105 1 539 23 862
OP #5 66 074 18 432 1 333 680 412 1 539 88 471
OP #6 16 800 4 687 335 283 105 1 539 23 748
Total 285 600 79 672 5 850 3 910 1 824 9 231 386 088
After identifying direct cost, indirect costs must be assigned to activities. To do so activi-
ties and second stage cost drivers must be identified. This will be explained next.
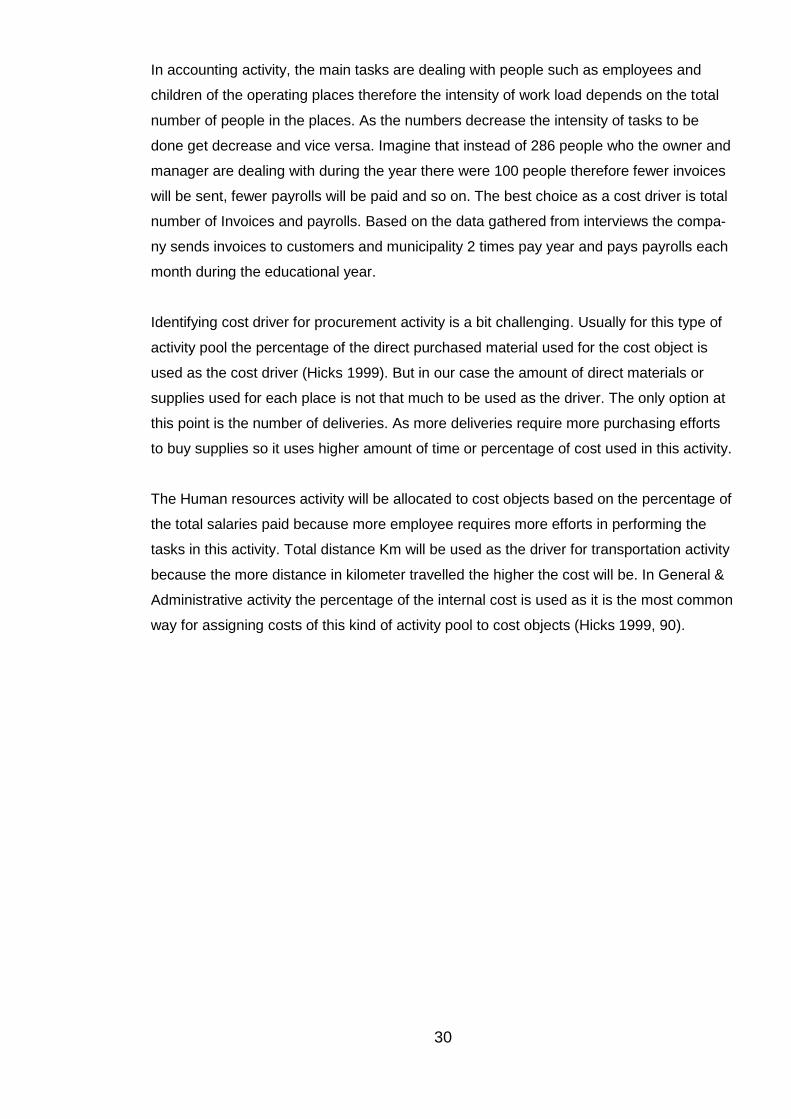
3.3.3 Identifying activities and allocation bases for allocating indirect costs to cost
objects
Based on the interviews and analysis of the business process, activities are categorized
into five activity pools which are Accounting, Procurement, Human resources, Transporta-
tion and General & Administration which has already been explained in the Discussion
chapter. Identifying activities’ allocation bases are very difficult and there might be so
many other ways. But the current used cost drivers are considered to be the most suitable
ones because the activities’ working hours will be effected by decreasing or increasing
these cost drivers. However, they must be changed periodically by even further analysis
of the company’s activates. Table 14 illustrates activities and their allocation bases.
Table 14: Second Drive Cost Allocation Bases (Hicks 1999, 230)
ACTIVITIES
ACTIVITY ALLOCATION BASE
Accounting Number of Invoices and payrolls
Procurement Number of Deliveries
Human resources % of total paid Salaries
Transpiration Total Distance Km
General & Administration % of Internal Costs
30
In accounting activity, the main tasks are dealing with people such as employees and
children of the operating places therefore the intensity of work load depends on the total
number of people in the places. As the numbers decrease the intensity of tasks to be
done get decrease and vice versa. Imagine that instead of 286 people who the owner and
manager are dealing with during the year there were 100 people therefore fewer invoices
will be sent, fewer payrolls will be paid and so on. The best choice as a cost driver is total
number of Invoices and payrolls. Based on the data gathered from interviews the compa-
ny sends invoices to customers and municipality 2 times pay year and pays payrolls each
month during the educational year.
Identifying cost driver for procurement activity is a bit challenging. Usually for this type of
activity pool the percentage of the direct purchased material used for the cost object is
used as the cost driver (Hicks 1999). But in our case the amount of direct materials or
supplies used for each place is not that much to be used as the driver. The only option at
this point is the number of deliveries. As more deliveries require more purchasing efforts
to buy supplies so it uses higher amount of time or percentage of cost used in this activity.
The Human resources activity will be allocated to cost objects based on the percentage of
the total salaries paid because more employee requires more efforts in performing the
tasks in this activity. Total distance Km will be used as the driver for transportation activity
because the more distance in kilometer travelled the higher the cost will be. In General &
Administrative activity the percentage of the internal cost is used as it is the most common
way for assigning costs of this kind of activity pool to cost objects (Hicks 1999, 90).

31
3.3.4 Identifying costs of activities
Table 15 illustrates the relationship between activities and Expense Resources which are
costs of the Min Office.
Table 15: Identifying Costs of Activities
EXPENSE RE-
SOURCES
ACTIVITIES
Accounting Procurement HR Transportation G & A
Supplies X X X X
Salaries & Wages X X X X
Depreciation X X X X
Transportation X X
Call & Internet X
Rent & Utilities X X X X
G& A X
Expense categories are identified to different activities based on their cause and effect
relationship (Hicks 1999). Supplies, Salaries & Wages, Depreciation, Call & Internet and
Rent & Utilities are used by all the activity pools. So the cross “X” shows which expenses
are used by activities. If one of the resources is used by all activities, then the percentage
of usage differs for activities. Moreover, there are expenses which are related to one par-
ticular activity pool such expense resources are Transportation, G & A, and Voluntary
Personnel Cost. Transportation is totally assigned to transportation activity. G & A cost is
the expense resource that allocated totally to G & A activity pool as those were assumed
to be used for other purposes and no other identified activities.
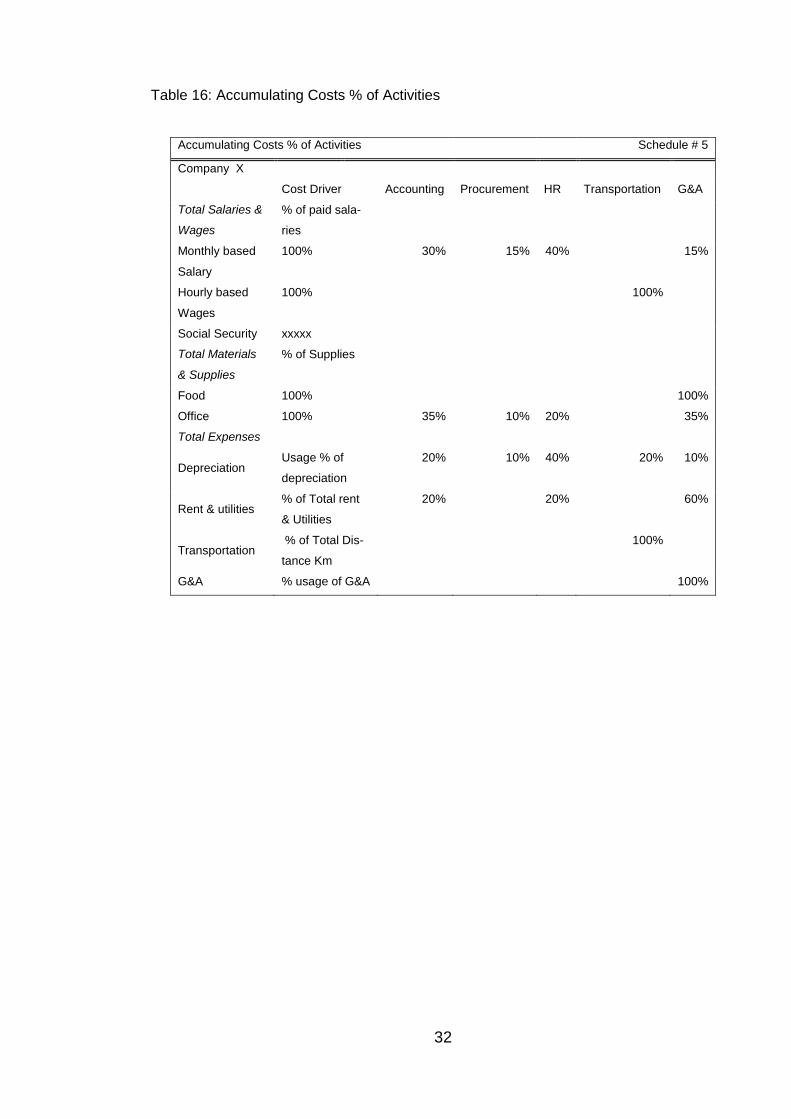
Schedule # 5 is created to accumulate costs of activities by giving the percentages of us-
ages. Cost drivers of resource expenses and percentages of usages are illustrated in ta-
ble 16. Current percentages in the table are assumptions based on which expense re-
sources are divided among activities. The first stage cost drivers are defined based on the
types and intensity usages of expenses. As most of the activities are performed by a cer-
tain number of people and there is no actual working hours for staff in the main office allo-
cation based on the working hours is not possible. So the percentage of usage for assign-
ing expenses to activities is used.
32
Table 16: Accumulating Costs % of Activities
Accumulating Costs % of Activities Schedule # 5
Company X
Cost Driver Accounting Procurement HR Transportation G&A
Total Salaries &
Wages
% of paid sala-
ries
Monthly based
Salary
100% 30% 15% 40% 15%
Hourly based
Wages
100% 100%
Social Security xxxxx
Total Materials
& Supplies
% of Supplies
Food 100% 100%
Office 100% 35% 10% 20% 35%
Total Expenses
Depreciation Usage % of
depreciation
20% 10% 40% 20% 10%
Rent & utilities % of Total rent
& Utilities
20% 20% 60%
Transportation % of Total Dis-
tance Km
100%
G&A % usage of G&A 100%

33
After getting the expenses’ percentages of usage, they must be applied to activities.
Schedule # 6 illustrated in table 17 is created for this purpose.
Table 17: Identifying Activity Drivers & Accumulating Activities' Cost (Indirect Costs)
Identifying Activity Drivers & Accumulating Activities' Cost (Indirect Costs) Schedule # 6
Company X
Cost € Accounting Procurement HR Transportation G&A
Total Salaries & Wages
132,478 39,743 19,872 52,991 - 19,872
Monthly based Salary
103,582 31,075 15,537 41,433 - 15,537
Hourly based Wages - - - - -
Social Security 28,896 8,669 4,334 11,558 - 4,334
Total Materials & Supplies
878 176 50 101 - 551
Food 374 - - - - 374
Office 503 176 50 101 - 176
Total Expenses 32,745 2,620 46 2,711 10,347 17,022
Depreciation 456 91 46 182 91 46
Rent & utilities 12,642 2,528 - 2,528 - 7,585
Transportation 10,255 - - - 10,255 -
G&A 9,392 - - - - 9,392
Phone Calls & Inter-net
1,539
Total Activity Cost 166,100 42,539 19,968 55,803 10,347 37,445
In this schedule indirect costs € of the main office can be obtained from reducing direct
costs identified in schedule # 3 from total costs in income statement in schedule #1. Then
the percentages provided in schedule # 5 is multiplied by the related expense resources’
percentages to get the euro amount of the activity pool from that expense recourse. Now
that we have the total activity costs, the rate per units of cost driver must be calculated.
Formula used in this schedule is (Horngren & al. 2012):
Activity cost = Expense resource % (Schedule #5) x Cost €

34
3.3.5 Computing the rate per unit of cost allocation bases
Cost rate per unit of drivers is calculated at bottom of the schedule # 6 and the result is
shown in table 18. To compute the rate per unit of expense resources to activity pools
(First Drive Allocation) the following formula is used (Horngren & al. 2012):
Rate per Unit = Total Activity cost / Cost Driver Total Units
Total cost drivers are used from schedule # 3 and # 3.1 by which the total activity costs
are divided. As it is shown in the table 18, the rate per each payroll and invoice is 35 €,
each delivery cost 370 €, the total cost of human resources activity is equal to 15 % of the
total salaries and wages paid, 25 € is spent on each traveled kilometers and total G&A is
equal to 29 % of the total internal costs. Total Internal costs is the summation of account-
ing, procurement, human resources and transportation activities’ total costs.
Table 18: Computing the rate per unit of activity cost
3.3.6 Computing indirect costs of cost objects
Schedule # 7 illustrated in table 19 is created to calculate and assign activity pools’ costs
to cost objects. In this schedule indirect cost of operating places is calculated by using the
rates of activities calculated in schedule # 6 in table 18 and number of cost drivers in
schedule # 3 and # 3.1 in tables 8 and 9 respectively. It can be seen that all the 166,100 €
indirect cost is allocated to all cost objects.
Formulas used in this schedule are (Horngren & al. 2012):
Overhead = Activity Cost rate (€ or %) per Unit x Number of Unit Drivers
Activities' Cost
Drivers
Number of
Payrolls &
Invoices
Number of
Deliveries
% of Total
paid sala-
ries &
Wages
Total Dis-
tance Km % of Internal Costs
Total Cost driv-
ers
1,224
54
365,272
414
128,656
Rate per Unit of
Cost Driver
35 370 15 % 25 29 %

35
Total Overhead = Accounting Overhead + Procurement Overhead + Human re-sources Overhead+ G&A overhead
Table 19: Allocating Activities' cost to Cost objects
Allocating Activities' cost to Cost objects Schedule # 7
Company X
Total Place Cost €
Accounting Procurement HR Transportation G&A
Rate 35 € 370 € 15% 25 € 29%
OP #1 9,592 4,437 11,817 2,999 8,395.30 37,241
OP #2 4,796 2,219 6,565 1,350 4,345.08 19,274
OP #3 13,276 4,437 17,945 2,399 11,076.56 49,135
OP #4 2,398 2,219 3,283 1,050 2,604.50 11,553
OP #5 10,079 4,437 12,910 1,799 8,505.90 37,731
OP #6 2,398 2,219 3,283 750 2,517.22 11,166
Total Activity 42,539 19,968 55,803 10,347 37,445 166,100
3.3.7 Adding direct and indirect costs of each cost object:
Table 20 illustrates Schedule # 8 which is to sum up direct and indirect costs to get the
total costs of operating places and to calculate earnings before interest and tax. As rele-
vant information of the incomes of operating places was not available, the club income
and grands for the purpose of calculation is obtained by dividing the total club income and
grands in income statement in schedule # 1 by the total number of children in schedule #
3.1. The result is then multiplied by the number of children in each place. However, the
real figures for total revenue can be used by the end-user. The formula used in this
schedule are (Horngren & al. 2012; Investopedia 2015b):
Total Cost = Direct Cost + Indirect Cost
EBIT = Total revenue – total cost
Table 20: Total Cost & EBIT of Ops
Total Cost & EBIT of OPs Schedule # 8
Company X
Club Income Grands Direct Cost Indirect Cost Total Cost Earnings Before Interest & Taxes
OP #1 61,173 96,915 81,783 37,241 119,024 39,064
OP #2 30,587 48,458 45,902 19,274 65,176 13,869
OP #3 83,604 132,451 122,321 49,135 171,456 44,599
OP #4 15,293 24,229 23,862 11,553 35,415 4,107
OP #5 60,154 95,300 88,471 37,731 126,202 29,252
OP #6 15,293 24,229 23,748 11,166 34,915 4,607
Total 266,104 421,582 386,088 166,100 552,188 135,498
36
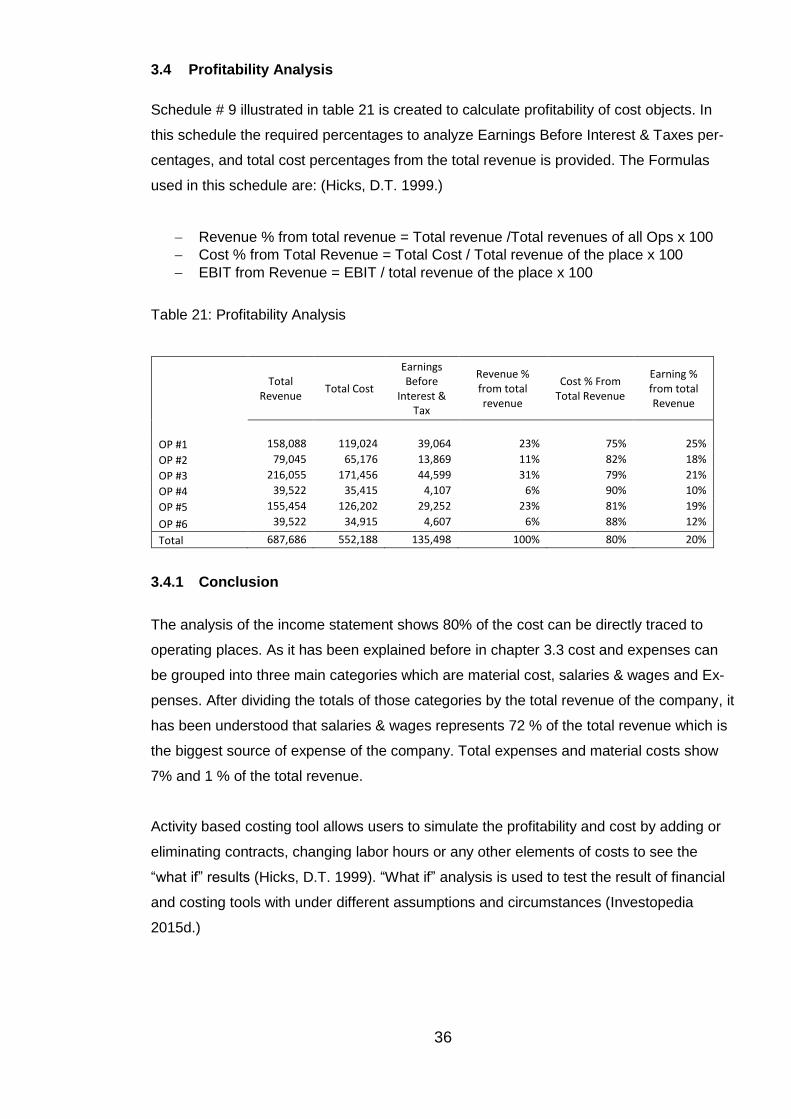
3.4 Profitability Analysis
Schedule # 9 illustrated in table 21 is created to calculate profitability of cost objects. In
this schedule the required percentages to analyze Earnings Before Interest & Taxes per-
centages, and total cost percentages from the total revenue is provided. The Formulas
used in this schedule are: (Hicks, D.T. 1999.)
Revenue % from total revenue = Total revenue /Total revenues of all Ops x 100
Cost % from Total Revenue = Total Cost / Total revenue of the place x 100
EBIT from Revenue = EBIT / total revenue of the place x 100
Table 21: Profitability Analysis
Total Revenue
Total Cost
Earnings Before
Interest & Tax
Revenue % from total revenue
Cost % From Total Revenue
Earning % from total Revenue
OP #1 158,088 119,024 39,064 23% 75% 25%
OP #2 79,045 65,176 13,869 11% 82% 18%
OP #3 216,055 171,456 44,599 31% 79% 21%
OP #4 39,522 35,415 4,107 6% 90% 10%
OP #5 155,454 126,202 29,252 23% 81% 19%
OP #6 39,522 34,915 4,607 6% 88% 12%
Total 687,686 552,188 135,498 100% 80% 20%
3.4.1 Conclusion
The analysis of the income statement shows 80% of the cost can be directly traced to
operating places. As it has been explained before in chapter 3.3 cost and expenses can
be grouped into three main categories which are material cost, salaries & wages and Ex-
penses. After dividing the totals of those categories by the total revenue of the company, it
has been understood that salaries & wages represents 72 % of the total revenue which is
the biggest source of expense of the company. Total expenses and material costs show
7% and 1 % of the total revenue.
Activity based costing tool allows users to simulate the profitability and cost by adding or
eliminating contracts, changing labor hours or any other elements of costs to see the
“what if” results (Hicks, D.T. 1999). “What if” analysis is used to test the result of financial
and costing tools with under different assumptions and circumstances (Investopedia
2015d.)
37
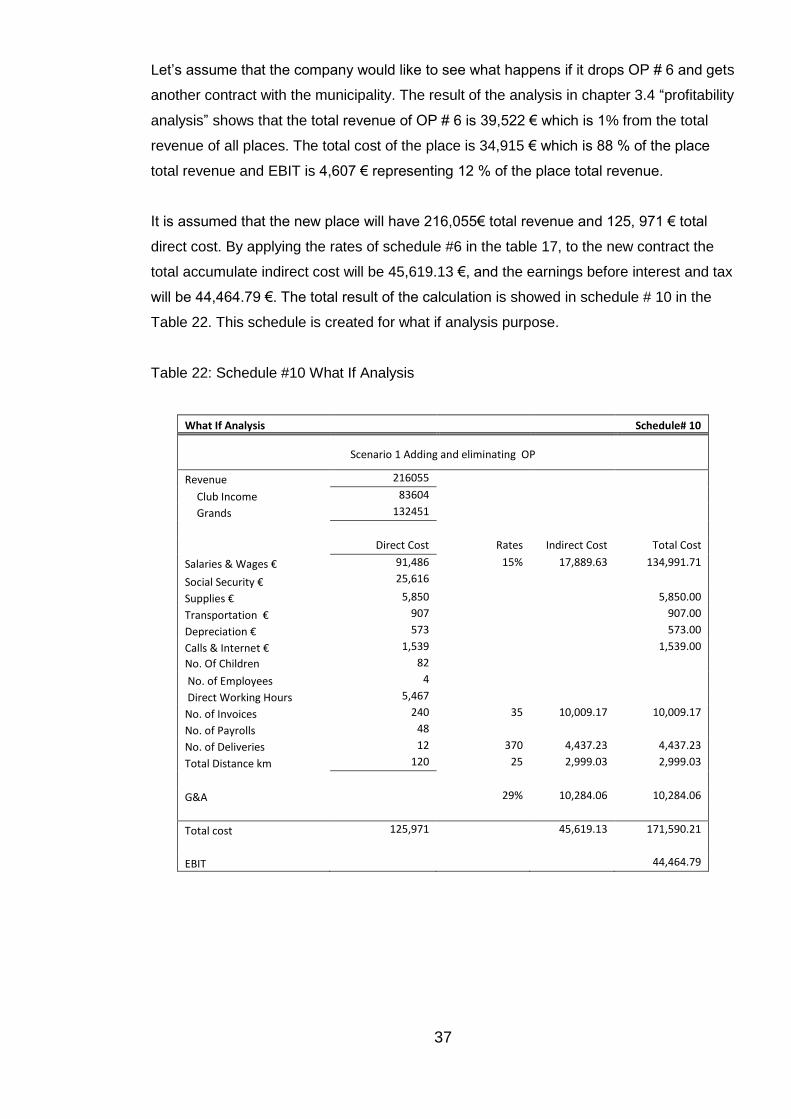
Let’s assume that the company would like to see what happens if it drops OP # 6 and gets
another contract with the municipality. The result of the analysis in chapter 3.4 “profitability
analysis” shows that the total revenue of OP # 6 is 39,522 € which is 1% from the total
revenue of all places. The total cost of the place is 34,915 € which is 88 % of the place
total revenue and EBIT is 4,607 € representing 12 % of the place total revenue.
It is assumed that the new place will have 216,055€ total revenue and 125, 971 € total
direct cost. By applying the rates of schedule #6 in the table 17, to the new contract the
total accumulate indirect cost will be 45,619.13 €, and the earnings before interest and tax
will be 44,464.79 €. The total result of the calculation is showed in schedule # 10 in the
Table 22. This schedule is created for what if analysis purpose.
Table 22: Schedule #10 What If Analysis
What If Analysis Schedule# 10
Scenario 1 Adding and eliminating OP
Revenue 216055
Club Income 83604
Grands 132451
Direct Cost Rates Indirect Cost Total Cost
Salaries & Wages € 91,486 15% 17,889.63 134,991.71
Social Security € 25,616
Supplies € 5,850 5,850.00
Transportation € 907 907.00
Depreciation € 573 573.00
Calls & Internet € 1,539 1,539.00
No. Of Children 82
No. of Employees 4
Direct Working Hours 5,467
No. of Invoices 240 35 10,009.17 10,009.17
No. of Payrolls 48
No. of Deliveries 12 370 4,437.23 4,437.23
Total Distance km 120 25 2,999.03 2,999.03
G&A 29% 10,284.06 10,284.06
Total cost 125,971 45,619.13 171,590.21
EBIT 44,464.79
38
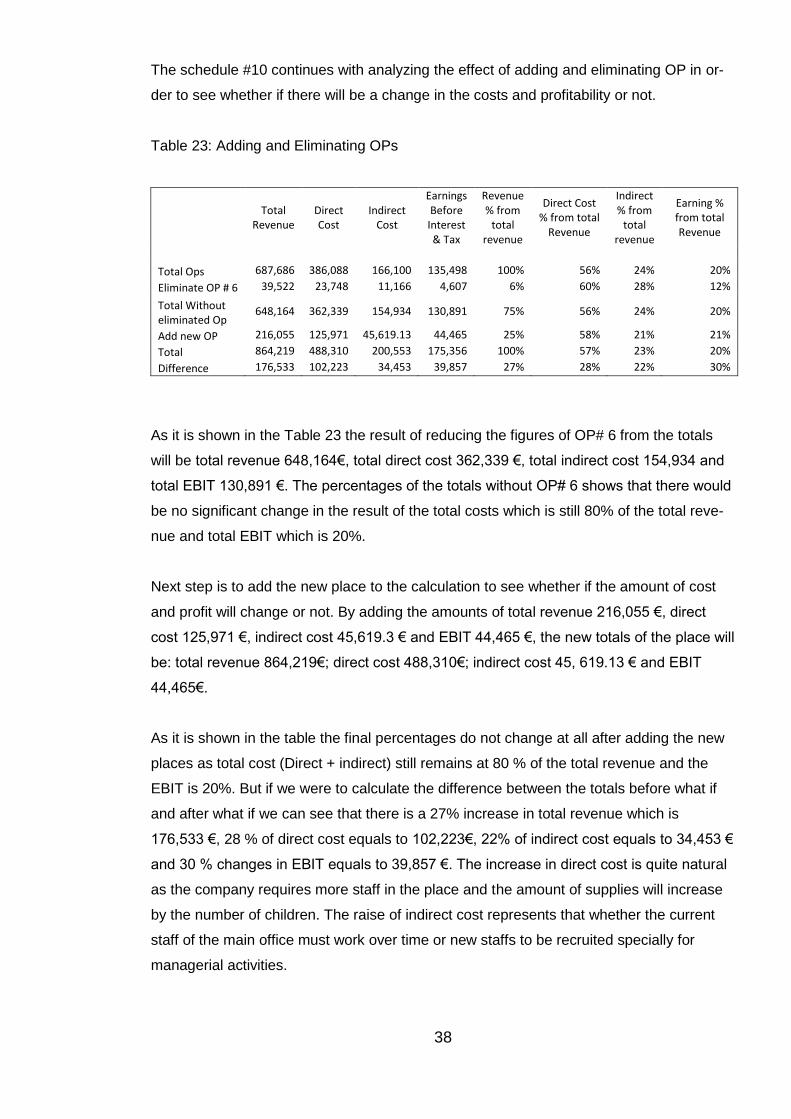
The schedule #10 continues with analyzing the effect of adding and eliminating OP in or-
der to see whether if there will be a change in the costs and profitability or not.
Table 23: Adding and Eliminating OPs
Total Revenue
Direct Cost
Indirect Cost
Earnings Before
Interest & Tax
Revenue % from
total revenue
Direct Cost % from total
Revenue
Indirect % from
total revenue
Earning % from total Revenue
Total Ops 687,686 386,088 166,100 135,498 100% 56% 24% 20%
Eliminate OP # 6 39,522 23,748 11,166 4,607 6% 60% 28% 12%
Total Without eliminated Op
648,164 362,339 154,934 130,891 75% 56% 24% 20%
Add new OP 216,055 125,971 45,619.13 44,465 25% 58% 21% 21%
Total 864,219 488,310 200,553 175,356 100% 57% 23% 20%
Difference 176,533 102,223 34,453 39,857 27% 28% 22% 30%
As it is shown in the Table 23 the result of reducing the figures of OP# 6 from the totals
will be total revenue 648,164€, total direct cost 362,339 €, total indirect cost 154,934 and
total EBIT 130,891 €. The percentages of the totals without OP# 6 shows that there would
be no significant change in the result of the total costs which is still 80% of the total reve-
nue and total EBIT which is 20%.
Next step is to add the new place to the calculation to see whether if the amount of cost
and profit will change or not. By adding the amounts of total revenue 216,055 €, direct
cost 125,971 €, indirect cost 45,619.3 € and EBIT 44,465 €, the new totals of the place will
be: total revenue 864,219€; direct cost 488,310€; indirect cost 45, 619.13 € and EBIT
44,465€.
As it is shown in the table the final percentages do not change at all after adding the new
places as total cost (Direct + indirect) still remains at 80 % of the total revenue and the
EBIT is 20%. But if we were to calculate the difference between the totals before what if
and after what if we can see that there is a 27% increase in total revenue which is
176,533 €, 28 % of direct cost equals to 102,223€, 22% of indirect cost equals to 34,453 €
and 30 % changes in EBIT equals to 39,857 €. The increase in direct cost is quite natural
as the company requires more staff in the place and the amount of supplies will increase
by the number of children. The raise of indirect cost represents that whether the current
staff of the main office must work over time or new staffs to be recruited specially for
managerial activities.
39
From the total results after what if analysis it can be concluded that the company must
revise its salaries & wages expenses if it intends to increase its profitability.
Formulas used in schedule # 10 are (Hicks, D.T. 1999):
Indirect cost = Rate x Direct cost
Total Cost = Direct cost + Indirect cost
G&A = Rate x total internal cost
EBIT = Total Revenue – Total Cost
Total without eliminated OP = Total Ops – Eliminate OP# 6 (In this case)
Total = Total without eliminate OP + Add new OP
Difference = Total – Total OPs
40
4 Summary and personal learning
Creating an accurate cost information system is a fundamental need for organizations to
be competitive in the market. However, it is not an easy job and requires time and invest-
ment to gather and analyze information to form the system. But companies can benefit by
understanding the cost structure so they can make proper decisions about the costs, prof-
itability, pricing and so many other issues. One of the commonly used and accurate cost-
ing system is Activity- Based Costing. As it was evident, the created ABC system tool
helped the case Company to have a better idea of its operating places costing issues.
After going through the process of creating the tool and analyzing the company’s activities
and business process, it is strongly recommended that the company use more tools such
as budgeting, internal accounting, and so on in order to trace the incurred costs of the
business.
Howbeit this tool can be improved even further and many other sheets can be added to
the tool for collecting and analyzing data to provide more accurate results for decision
making. Fields that can be added and improved are salary payment system, social securi-
ty and insurance calculation system, inventory and purchasing system, other legal issues,
calculation system and Activity Based Management system. Despite of Activity Based
Costing Which is just a tool for calculating and allocating overheads to costs objects Activ-
ity based management helps the company to reform its costing system and provides
managers with how to understand the result of the ABC system tool.
However, it is not possible to explain all of the learning and knowledge I gained by doing
this project but I will mention some of the main ones.
Planning: I realized that how it is important to plan a project beforehand and all the possible related issues must be identified and familiarized with to have a good plan.
Timing: It is of fundamental importance to be precise and make a deadline for each step of the project plan.
The importance of costing system: in the beginning creating a costing system looks easy as it is all about organizing information. But how to get information and which one is relevant is important therefore creating criteria for data selection is necessary in creating a tool. Companies may not have everything ready but they must be created by analyzing the whole business.
Cooperating issues: although the case company was very cooperative in the pro-cess of doing this project but I understood what sort of difficulties one can go through if required support is not provided by the personnel and the company in general.
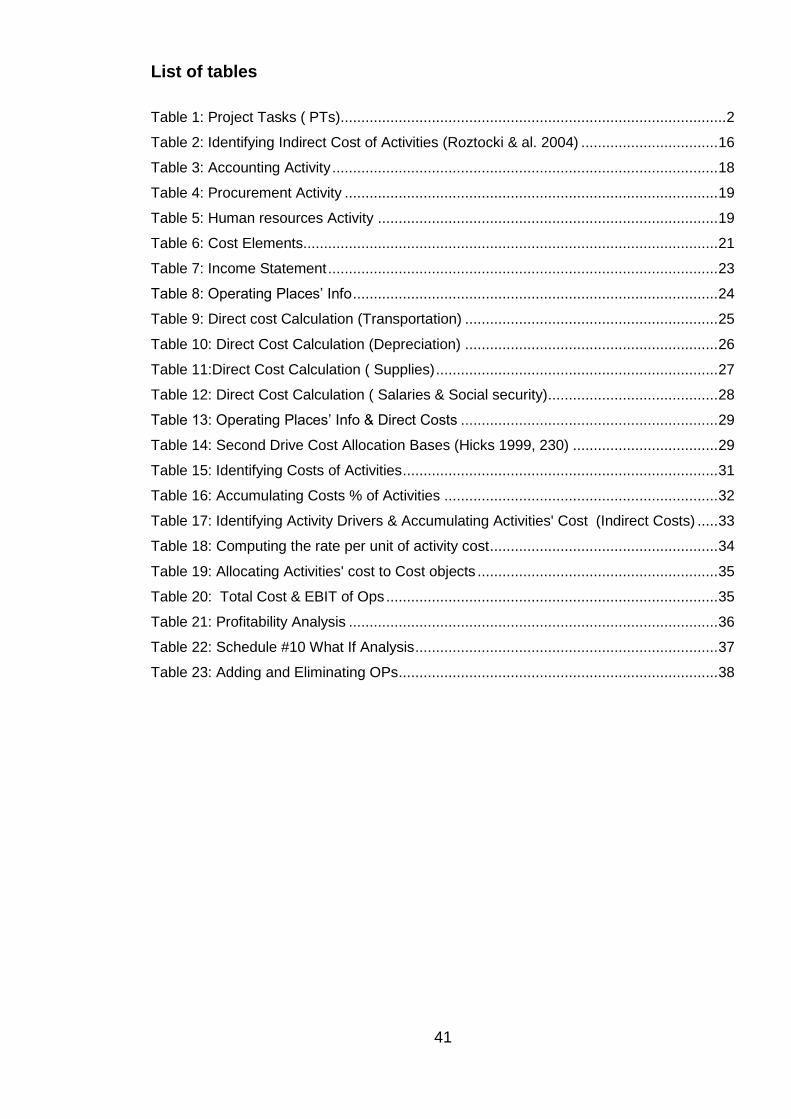
41
List of tables
Table 1: Project Tasks ( PTs)............................................................................................. 2
Table 2: Identifying Indirect Cost of Activities (Roztocki & al. 2004) ................................. 16
Table 3: Accounting Activity ............................................................................................. 18
Table 4: Procurement Activity .......................................................................................... 19
Table 5: Human resources Activity .................................................................................. 19
Table 6: Cost Elements.................................................................................................... 21
Table 7: Income Statement .............................................................................................. 23
Table 8: Operating Places’ Info ........................................................................................ 24
Table 9: Direct cost Calculation (Transportation) ............................................................. 25
Table 10: Direct Cost Calculation (Depreciation) ............................................................. 26
Table 11:Direct Cost Calculation ( Supplies) .................................................................... 27
Table 12: Direct Cost Calculation ( Salaries & Social security)......................................... 28
Table 13: Operating Places’ Info & Direct Costs .............................................................. 29
Table 14: Second Drive Cost Allocation Bases (Hicks 1999, 230) ................................... 29
Table 15: Identifying Costs of Activities ............................................................................ 31
Table 16: Accumulating Costs % of Activities .................................................................. 32
Table 17: Identifying Activity Drivers & Accumulating Activities' Cost (Indirect Costs) ..... 33
Table 18: Computing the rate per unit of activity cost ....................................................... 34
Table 19: Allocating Activities' cost to Cost objects .......................................................... 35
Table 20: Total Cost & EBIT of Ops ................................................................................ 35
Table 21: Profitability Analysis ......................................................................................... 36
Table 22: Schedule #10 What If Analysis ......................................................................... 37
Table 23: Adding and Eliminating OPs ............................................................................. 38
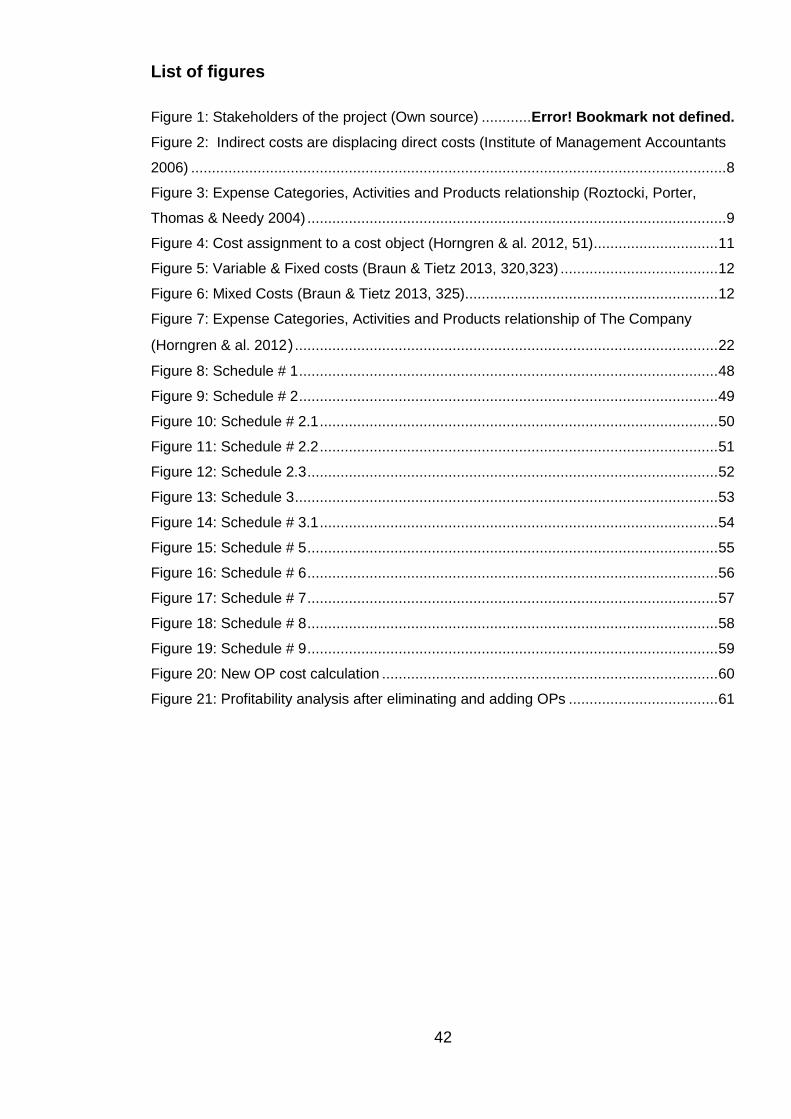
42
List of figures
Figure 1: Stakeholders of the project (Own source) ............ Error! Bookmark not defined.
Figure 2: Indirect costs are displacing direct costs (Institute of Management Accountants
2006) ................................................................................................................................. 8
Figure 3: Expense Categories, Activities and Products relationship (Roztocki, Porter,
Thomas & Needy 2004) ..................................................................................................... 9
Figure 4: Cost assignment to a cost object (Horngren & al. 2012, 51) .............................. 11
Figure 5: Variable & Fixed costs (Braun & Tietz 2013, 320,323) ...................................... 12
Figure 6: Mixed Costs (Braun & Tietz 2013, 325)............................................................. 12
Figure 7: Expense Categories, Activities and Products relationship of The Company
(Horngren & al. 2012) ...................................................................................................... 22
Figure 8: Schedule # 1 ..................................................................................................... 48
Figure 9: Schedule # 2 ..................................................................................................... 49
Figure 10: Schedule # 2.1 ................................................................................................ 50
Figure 11: Schedule # 2.2 ................................................................................................ 51
Figure 12: Schedule 2.3 ................................................................................................... 52
Figure 13: Schedule 3 ...................................................................................................... 53
Figure 14: Schedule # 3.1 ................................................................................................ 54
Figure 15: Schedule # 5 ................................................................................................... 55
Figure 16: Schedule # 6 ................................................................................................... 56
Figure 17: Schedule # 7 ................................................................................................... 57
Figure 18: Schedule # 8 ................................................................................................... 58
Figure 19: Schedule # 9 ................................................................................................... 59
Figure 20: New OP cost calculation ................................................................................. 60
Figure 21: Profitability analysis after eliminating and adding OPs .................................... 61
43
Reference
accountingtools. 2015a, Direct Labour. URL: http://www,accountingtools,com/definition-
direct-labour. Accessed 4 March 2015.
accountingtools. 2015b, Indirect Labour. URL: http://www.accountingtools.com/definition-
indirect-labor. Accessed 4 March 2015.
Arora, M. 2009. Cost and Management Accounting: Theory, Problems and Solutions,
Himalaya Publishing House, Mumbai, IND. ProQuest ebrary. Accessed 27 May 2015.
Ashford C. Chea. 2011. Activity-Based Costing System in the Service Sector: A strategic
Approach for Enhancing Managerial Decision Making and Competitiveness. School of
Business, Kentucky Wesleyan College, 6, 2, pp. 3-10. URL:
http://www,ccsenet,org/journal/index,php/ijbm/article/view/11103/8985. Accessed 27 April
2015.
Bahnub, BJ. 2010. Activity-Based Management for Financial Institutions: Driving Bottom-
Line Results, John Wiley & Sons Inc. NJ, USA. ProQuest ebrary. Accessed 12 May 2015.
Braun, KW. & Tiez WM. 2013. Building Blocks of managerial Accounting, In: Managerial
Accounting, 3rd ed. Pearson Publication. USA.
Drury, C. 2008. MANAGEMENT AND COST ACCOUNTING. 7th ed. Pat Bond. London.
Aamu- ja iltapäivätoiminta. 8a luku (19,12,2003/1136). URL:
http://finlex,fi/fi/laki/ajantasa/1998/19980628#L8a. Accessed 5 May 2015.
Hicks, D, T. 1999. ACTIVITY BASED COSTING: Making it work for small and mid- sized
companies, 2nd ed. USA: John Wiley & Sons, Inc.
Horngren, C., Datar, S. & Rajan, M. 2012. Cost Accounting: A managerial emphasis. 14th
edition. Pearson Education Limited. England.
Horngren,C., Sundem,G. ,Burgstahler,D. & Schatzberg, J. 2014. Introduction to Manage-
ment Accounting. 6th ed. Pearson Education Limited. England.
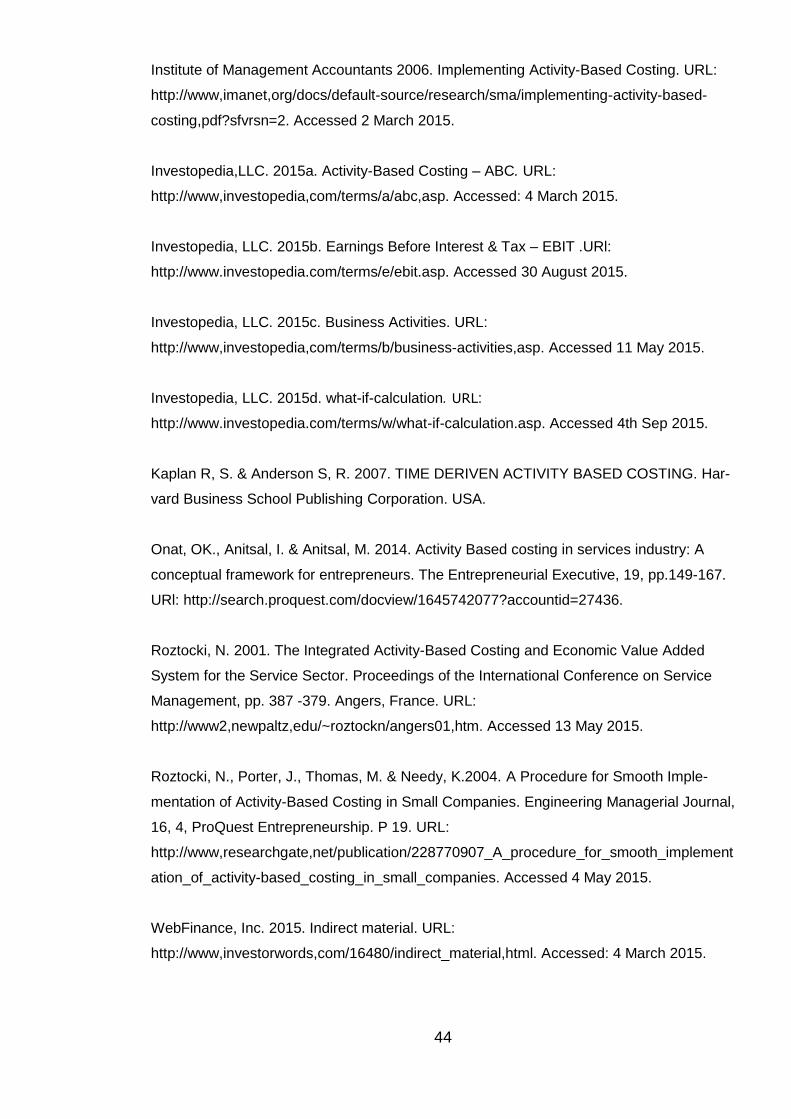
44
Institute of Management Accountants 2006. Implementing Activity-Based Costing. URL:
http://www,imanet,org/docs/default-source/research/sma/implementing-activity-based-
costing,pdf?sfvrsn=2. Accessed 2 March 2015.
Investopedia,LLC. 2015a. Activity-Based Costing – ABC. URL:
http://www,investopedia,com/terms/a/abc,asp. Accessed: 4 March 2015.
Investopedia, LLC. 2015b. Earnings Before Interest & Tax – EBIT .URl:
http://www.investopedia.com/terms/e/ebit.asp. Accessed 30 August 2015.
Investopedia, LLC. 2015c. Business Activities. URL:
http://www,investopedia,com/terms/b/business-activities,asp. Accessed 11 May 2015.
Investopedia, LLC. 2015d. what-if-calculation. URL:
http://www.investopedia.com/terms/w/what-if-calculation.asp. Accessed 4th Sep 2015.
Kaplan R, S. & Anderson S, R. 2007. TIME DERIVEN ACTIVITY BASED COSTING. Har-
vard Business School Publishing Corporation. USA.
Onat, OK., Anitsal, I. & Anitsal, M. 2014. Activity Based costing in services industry: A
conceptual framework for entrepreneurs. The Entrepreneurial Executive, 19, pp.149-167.
URl: http://search.proquest.com/docview/1645742077?accountid=27436.
Roztocki, N. 2001. The Integrated Activity-Based Costing and Economic Value Added
System for the Service Sector. Proceedings of the International Conference on Service
Management, pp. 387 -379. Angers, France. URL:
http://www2,newpaltz,edu/~roztockn/angers01,htm. Accessed 13 May 2015.
Roztocki, N., Porter, J., Thomas, M. & Needy, K.2004. A Procedure for Smooth Imple-
mentation of Activity-Based Costing in Small Companies. Engineering Managerial Journal,
16, 4, ProQuest Entrepreneurship. P 19. URL:
http://www,researchgate,net/publication/228770907_A_procedure_for_smooth_implement
ation_of_activity-based_costing_in_small_companies. Accessed 4 May 2015.
WebFinance, Inc. 2015. Indirect material. URL:
http://www,investorwords,com/16480/indirect_material,html. Accessed: 4 March 2015.

45
Appendix 1
Income Statement Year xxxx
Turnover 687,687
Club Income 266,104
Grands 421,582 Total Material Cost 6,728
Food Supplies 3,744
Craft Supplies 468
Office Supplies 2,516
Total Salaries & wages 497,751
Salaries 389,183
Wages -
Social Security 108,568
Insurances -
Total Expenses 47,711
Depreciation 2,280 Transportation 14,165
Rent & Utilities 12,642
Office Rent 12,279
Cleaning & Sanitation 363
Electricity & Gas -
Building Insurance -
G &A 18,623
Financial service cost 207
Marketing 1,623
R&D 602 Membership fees 1,302
Post costs 95
Taxi 52
Parking
Phone Calls & Internet 10,770
Total Voluntary Personnel costs 3,972
Places Year Total Direct Costs 552,190
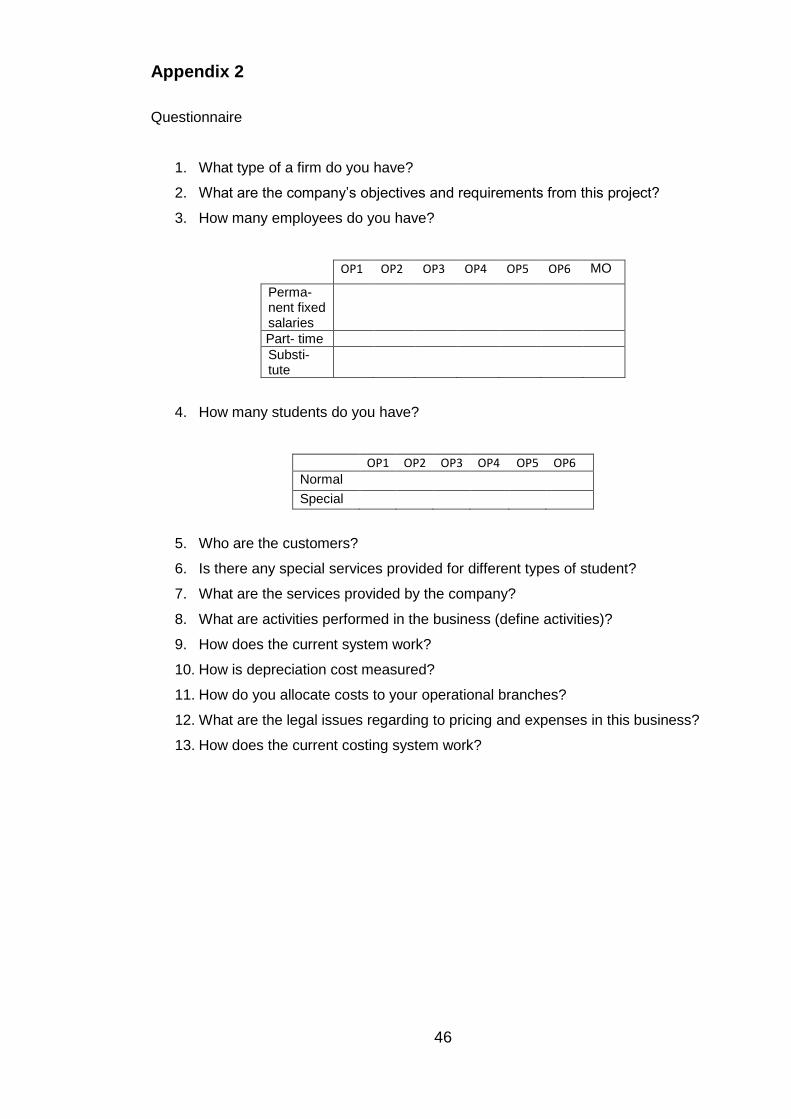
46
Appendix 2
Questionnaire
1. What type of a firm do you have?
2. What are the company’s objectives and requirements from this project?
3. How many employees do you have?
OP1 OP2 OP3 OP4 OP5 OP6 MO
Perma-nent fixed salaries
Part- time
Substi-tute
4. How many students do you have?
OP1 OP2 OP3 OP4 OP5 OP6
Normal
Special
5. Who are the customers?
6. Is there any special services provided for different types of student?
7. What are the services provided by the company?
8. What are activities performed in the business (define activities)?
9. How does the current system work?
10. How is depreciation cost measured?
11. How do you allocate costs to your operational branches?
12. What are the legal issues regarding to pricing and expenses in this business?
13. How does the current costing system work?
47
Appendix 3
User Manual
You must remember to fill in areas in the boxes only. The other areas are locked and not
changeable by the user. The green cells shows that, the income statements’ expense is
fully allocated, and the result of the total of calculation is equal to the expense category.
Each schedule except # 1 has extra lines for future use and three more lines for different
scenarios. However different scenarios calculation schedules are not created which re-
quires to be created in future if they are needed.
Schedules’ list
Schedule Lists
Location
Number
Title
H1
Schedule#1 Income Statement
A50
Schedule# 2 Direct Cost Calculation
H50
Schedule# 2.1 Direct Cost Calculation
A84
Schedule# 2.2 Direct Cost Calculation
H84
Schedule# 2.3 Direct Cost Calculation
A121
Schedule# 3 Operating Places' Info & Direct Costs
H121
Schedule# 3.1 Operating Places' Info & Direct Costs
A151
Schedule# 4 Activities
H151
Schedule# 4.1 Activities
A175
Schedule# 5 Accumulating Costs % of Activities
H175
Schedule# 6
Identifying Activity Drivers & Accumulating Activities'
Cost (Indirect Costs)
A215
Schedule# 7 Allocating Activities' cost to Cost objects
H215
Schedule# 8 Total Cost & EBIT of Ops
A234
Schedule# 9 Profitability analysis
H 234
Schedule# 10 What if analysis
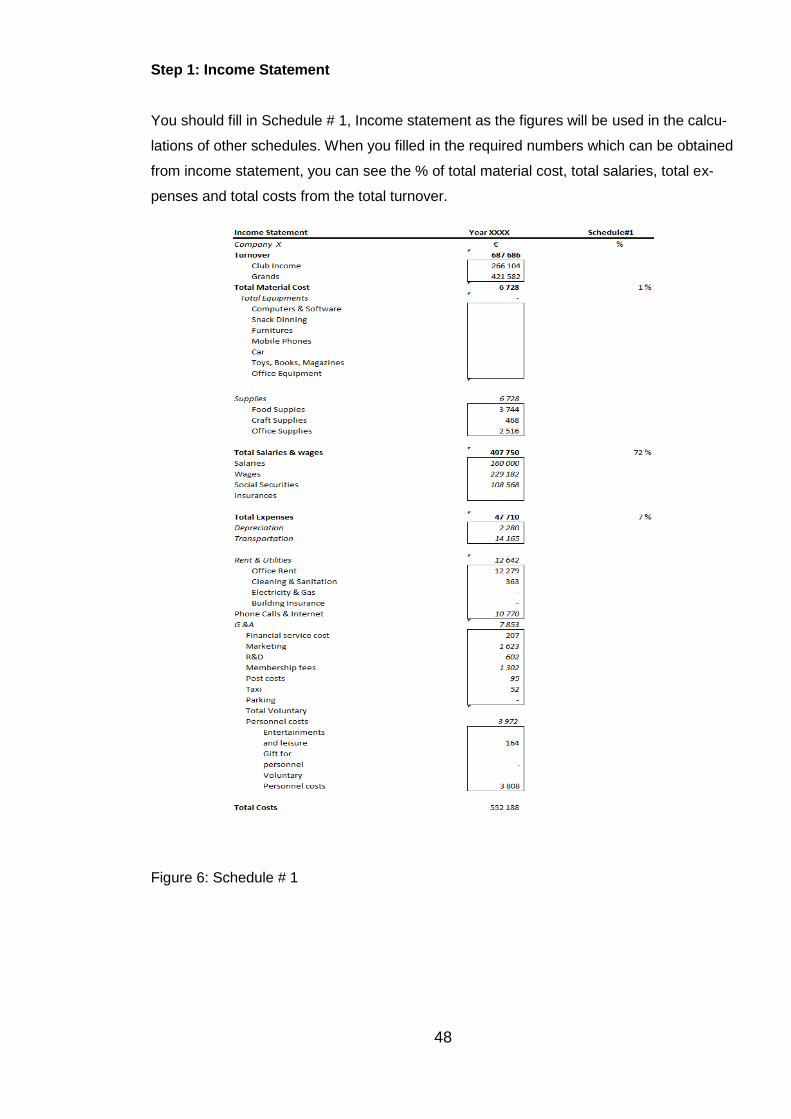
48
Step 1: Income Statement
You should fill in Schedule # 1, Income statement as the figures will be used in the calcu-
lations of other schedules. When you filled in the required numbers which can be obtained
from income statement, you can see the % of total material cost, total salaries, total ex-
penses and total costs from the total turnover.
Figure 6: Schedule # 1
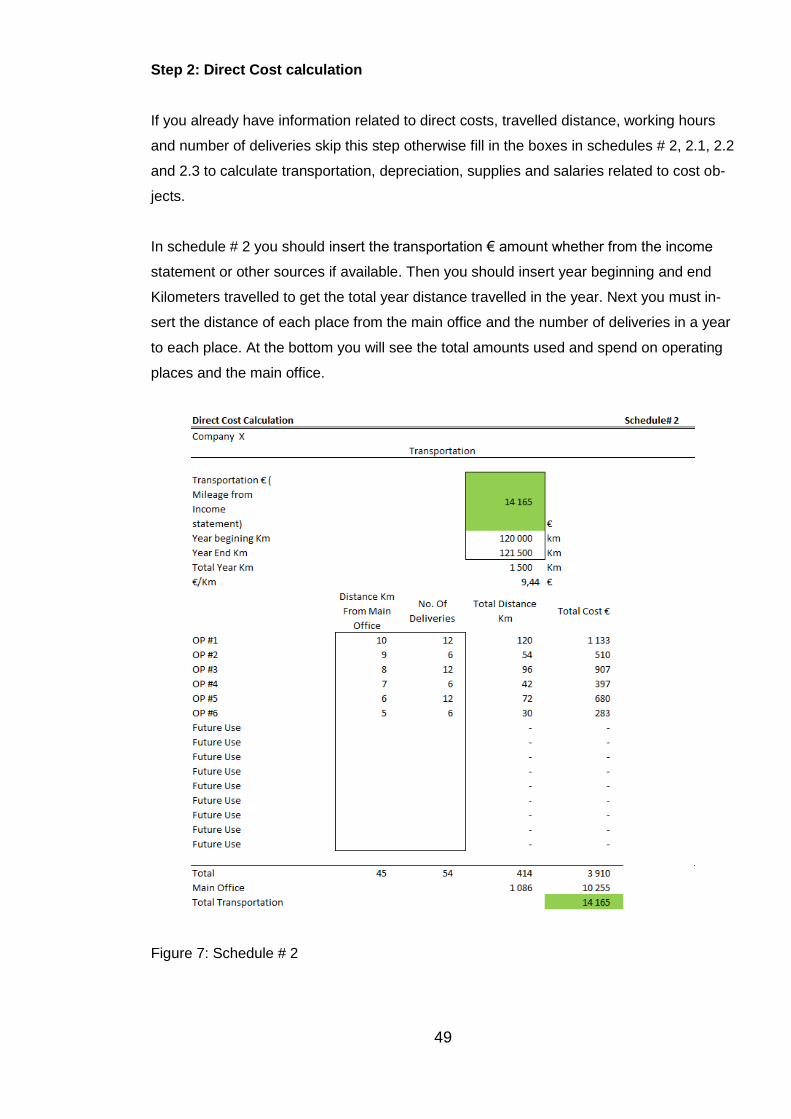
49
Step 2: Direct Cost calculation
If you already have information related to direct costs, travelled distance, working hours
and number of deliveries skip this step otherwise fill in the boxes in schedules # 2, 2.1, 2.2
and 2.3 to calculate transportation, depreciation, supplies and salaries related to cost ob-
jects.
In schedule # 2 you should insert the transportation € amount whether from the income
statement or other sources if available. Then you should insert year beginning and end
Kilometers travelled to get the total year distance travelled in the year. Next you must in-
sert the distance of each place from the main office and the number of deliveries in a year
to each place. At the bottom you will see the total amounts used and spend on operating
places and the main office.
Figure 7: Schedule # 2
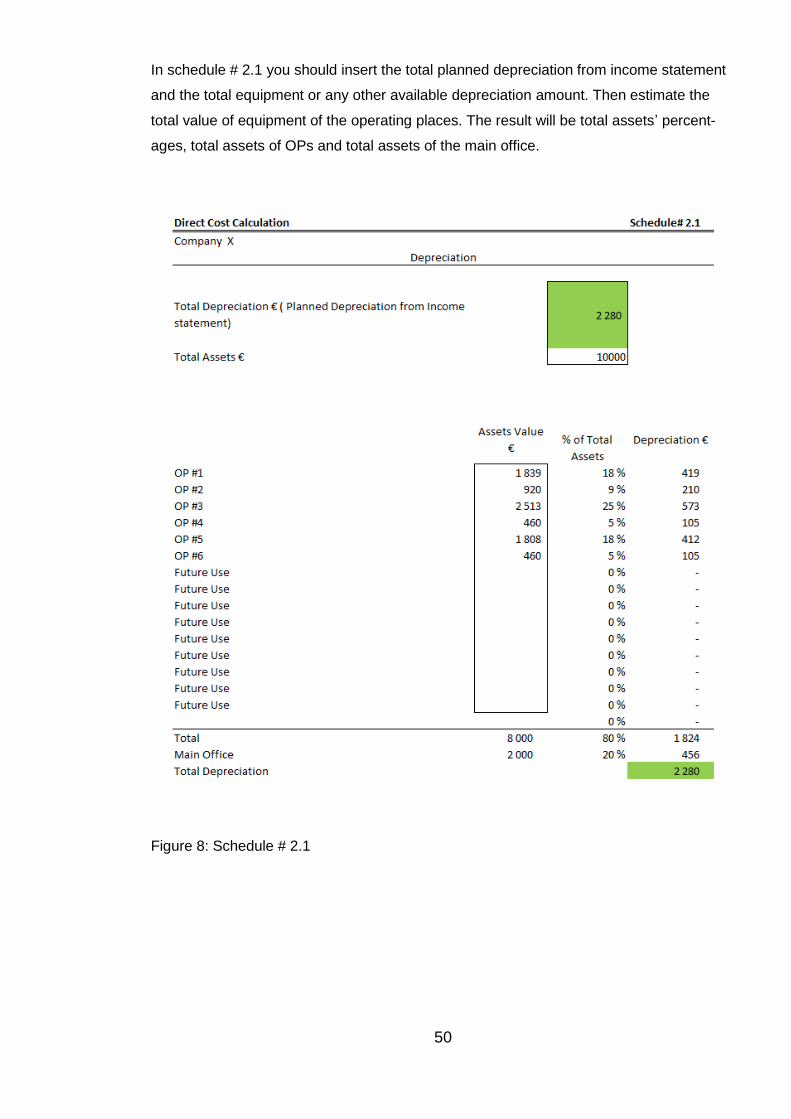
50
In schedule # 2.1 you should insert the total planned depreciation from income statement
and the total equipment or any other available depreciation amount. Then estimate the
total value of equipment of the operating places. The result will be total assets’ percent-
ages, total assets of OPs and total assets of the main office.
Figure 8: Schedule # 2.1
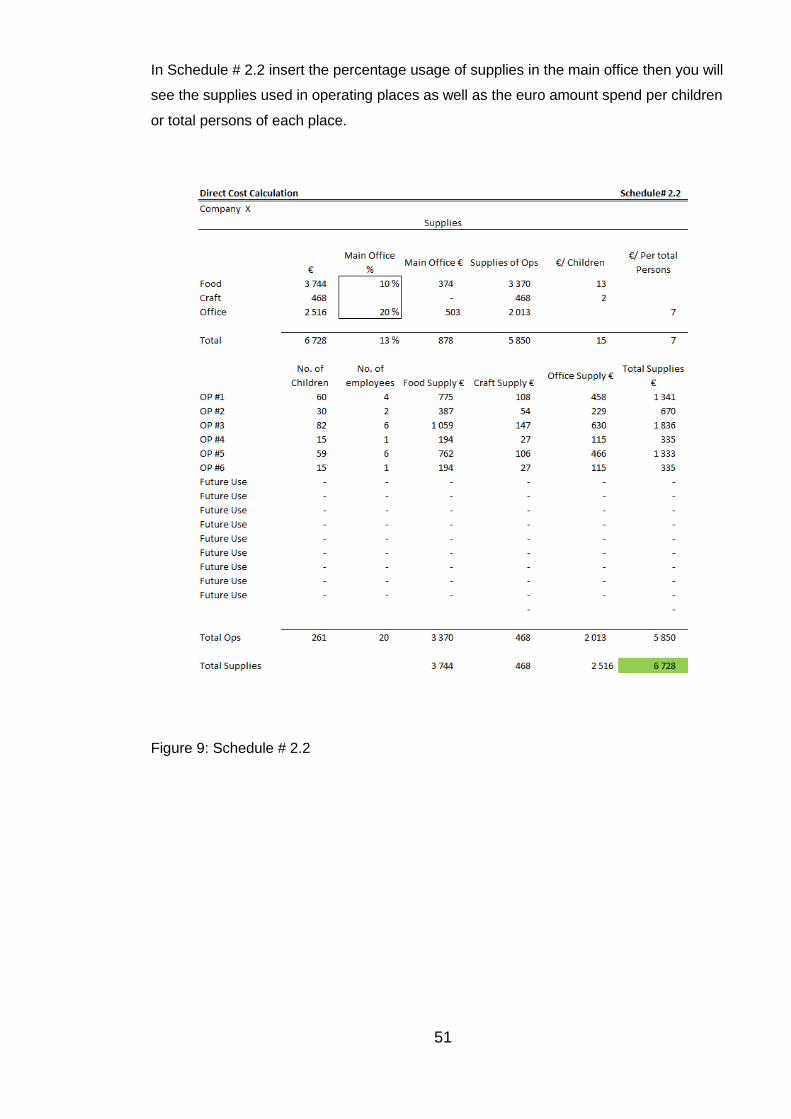
51
In Schedule # 2.2 insert the percentage usage of supplies in the main office then you will
see the supplies used in operating places as well as the euro amount spend per children
or total persons of each place.
Figure 9: Schedule # 2.2
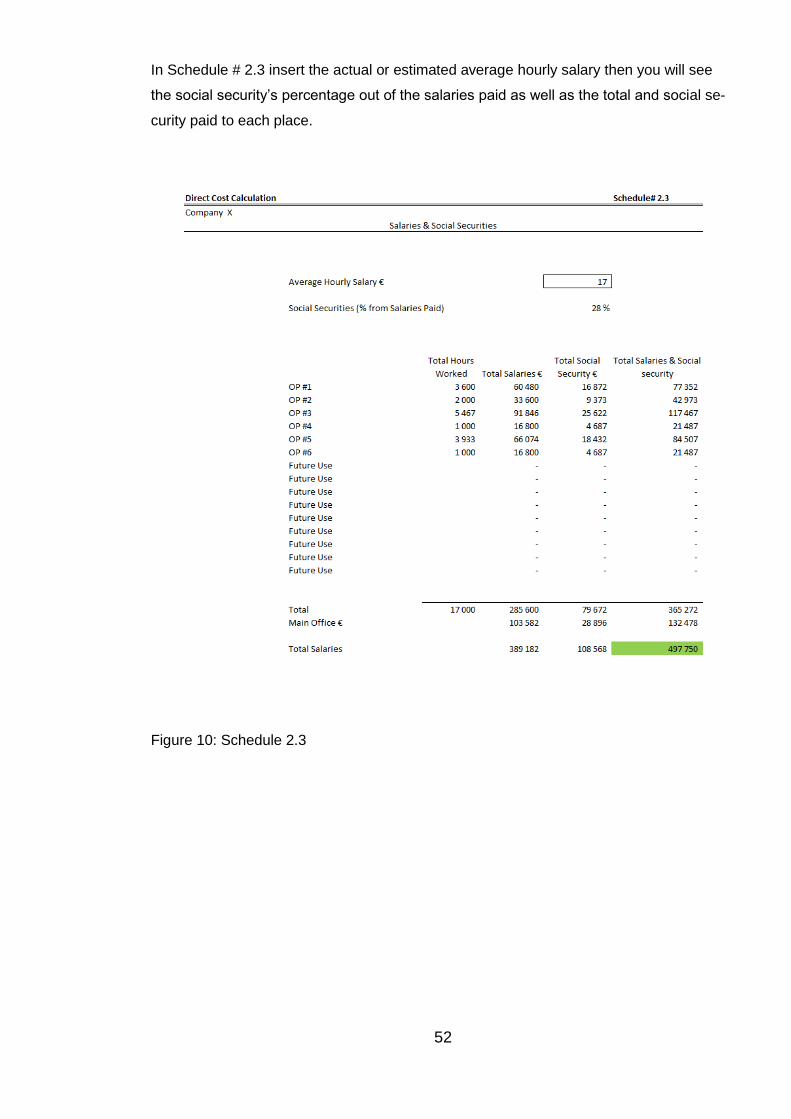
52
In Schedule # 2.3 insert the actual or estimated average hourly salary then you will see
the social security’s percentage out of the salaries paid as well as the total and social se-
curity paid to each place.
Figure 10: Schedule 2.3
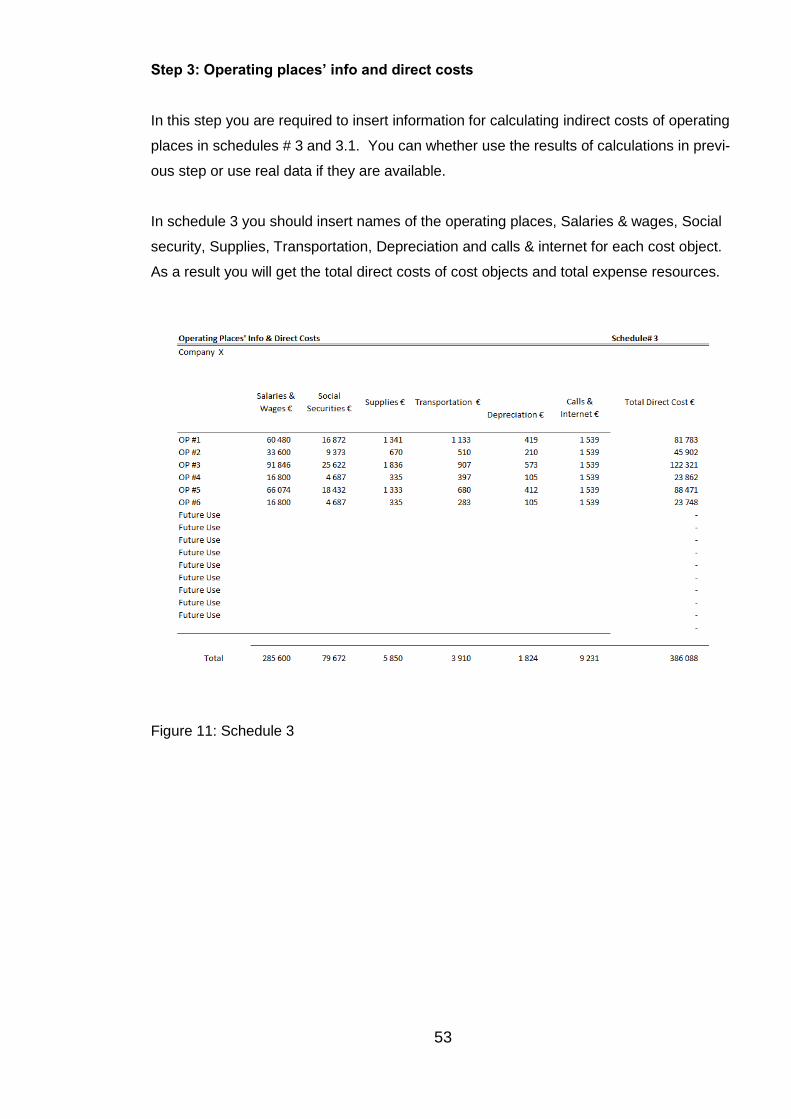
53
Step 3: Operating places’ info and direct costs
In this step you are required to insert information for calculating indirect costs of operating
places in schedules # 3 and 3.1. You can whether use the results of calculations in previ-
ous step or use real data if they are available.
In schedule 3 you should insert names of the operating places, Salaries & wages, Social
security, Supplies, Transportation, Depreciation and calls & internet for each cost object.
As a result you will get the total direct costs of cost objects and total expense resources.
Figure 11: Schedule 3
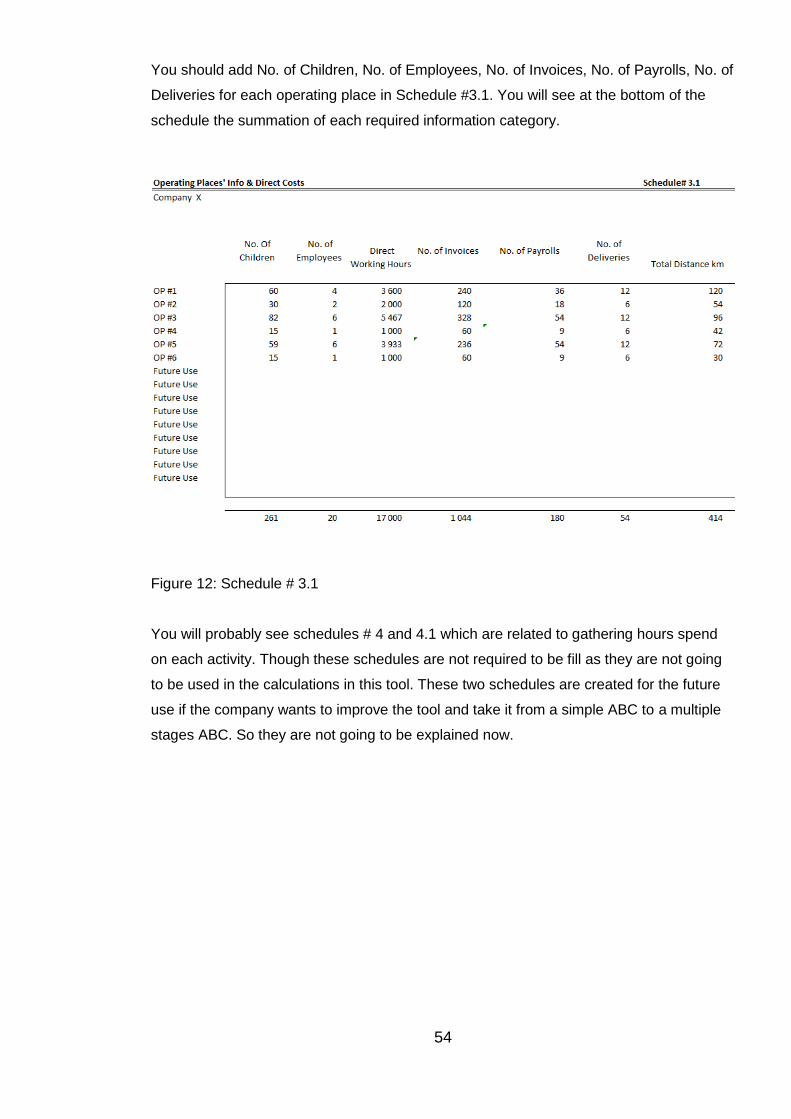
54
You should add No. of Children, No. of Employees, No. of Invoices, No. of Payrolls, No. of
Deliveries for each operating place in Schedule #3.1. You will see at the bottom of the
schedule the summation of each required information category.
Figure 12: Schedule # 3.1
You will probably see schedules # 4 and 4.1 which are related to gathering hours spend
on each activity. Though these schedules are not required to be fill as they are not going
to be used in the calculations in this tool. These two schedules are created for the future
use if the company wants to improve the tool and take it from a simple ABC to a multiple
stages ABC. So they are not going to be explained now.
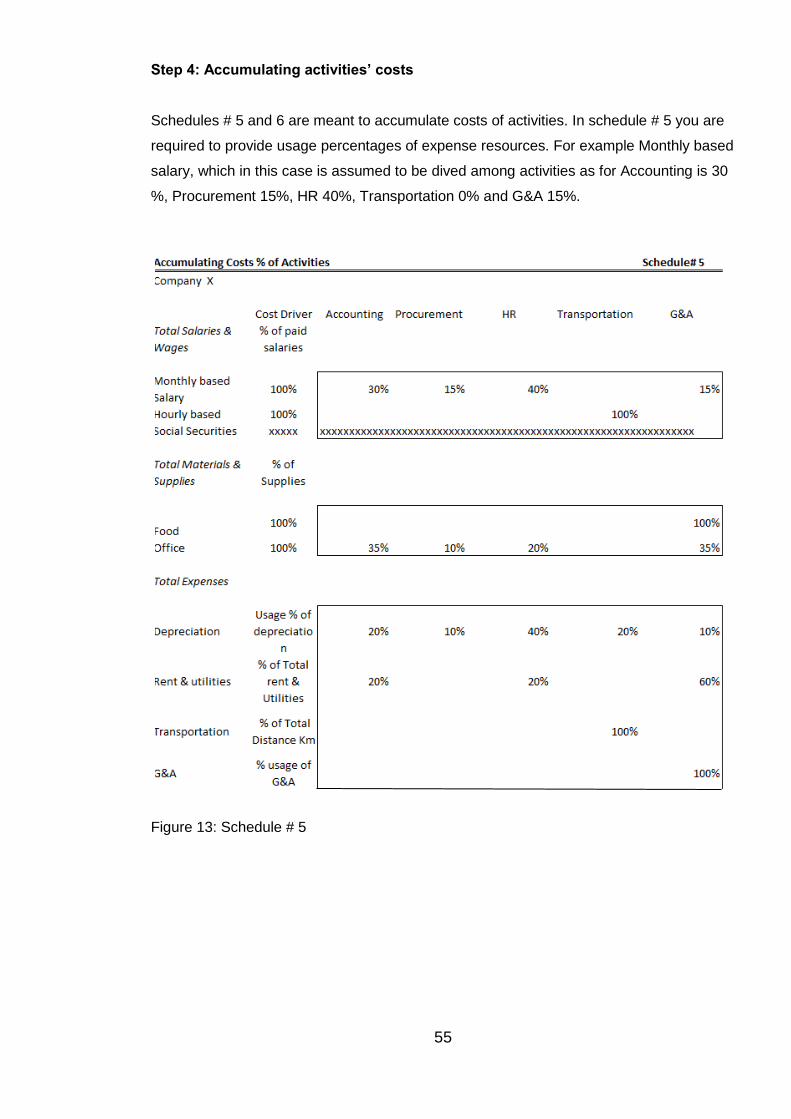
55
Step 4: Accumulating activities’ costs
Schedules # 5 and 6 are meant to accumulate costs of activities. In schedule # 5 you are
required to provide usage percentages of expense resources. For example Monthly based
salary, which in this case is assumed to be dived among activities as for Accounting is 30
%, Procurement 15%, HR 40%, Transportation 0% and G&A 15%.
Figure 13: Schedule # 5

56
Schedule # 6 is to accumulate costs for activities based on the given percentages in
Schedule # 5. This schedule needs you to insert indirect costs. Indirect costs are total
salaries & wages, total materials & supplies and total expenses of the main office. This
costs are currently available in previous schedules if you do not have them available oth-
erwise you can use cost other than those calculated. When you feed the costs into the
schedule, you will see the costs of each activity pool. Using the monthly based salary in
the previous example, you will see that cost of salary for accounting is 31,075 €, for Pro-
curement is 15,537 €, for HR is 41,433 €, for Transportation is 0 € and for G&A is 19,872
€. As it is shown in this schedule there are three categories of costs, Total salaries &
wages, Total Materials & Supplies and Total Depreciation. These categories are calculat-
ed automatically by summing up the sub cost categories under them.
At the bottom of this schedule under the Total activity cost you will see the Activities’ costs
drivers and rate per unit of Cost drivers’ calculation mechanism. This part is calculated
automatically. For example you see that the Activity cost driver for accounting is Number
of payrolls and Invoices, the total cost dividers are 1224 ( in schedule # 3.1) and the rate
per Unit of the Cost driver is 35 €.
Figure 14: Schedule # 6

57
Step 5: Allocating activities’ cost to cost objects
Schedule # 7 is for calculating the costs of activity pools to cost objects. In this schedule
the rates acquired in schedule # 6 is multiplied by the driver costs used from schedule #
3.1. For instance in Accounting activity the rate of 35 € is multiplied by the total of No. of
invoices 240 + No. of payrolls 36 = 9,592 € for OP #1. In the last column the total place
Cost € represent the summation of all activity costs of each place which in our example is
37,241 € for OP #1.
At the bottom of this schedule the summation of total Activity cost is divided among cost
objects. This is provided to ensure that the whole amount of activity pool is allocated to
cost objects. Pay attention if you see “ Error” in total activity it shows that there is a prob-
lem in calculation and the total summation of activities are not equal to the whole cost of
activity calculated in schedule # 6. The problem can be basically in Schedule # 5 as you
may have forgotten to insert a percentage of usage for one of the expense resources.
Figure 15: Schedule # 7
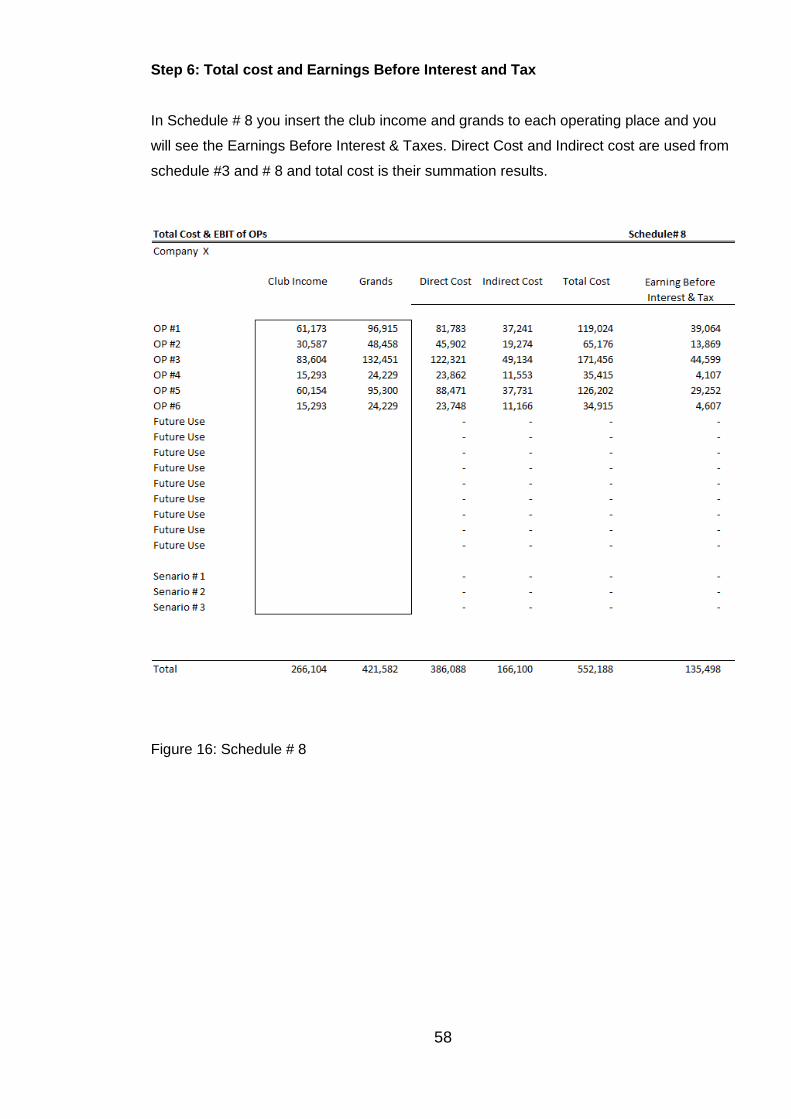
58
Step 6: Total cost and Earnings Before Interest and Tax
In Schedule # 8 you insert the club income and grands to each operating place and you
will see the Earnings Before Interest & Taxes. Direct Cost and Indirect cost are used from
schedule #3 and # 8 and total cost is their summation results.
Figure 16: Schedule # 8

59
Step 7: Profitability Analysis
Schedule # 9 is created to give you an understanding of the profitability of places by
providing certain types of percentages which are revenue % from the total revenue, cost 5
from the total revenue and Earnings % from the total revenue. By using this figures you
will be able to understand that how many percent of cost is spent on how many percent of
children as well as how many percent of earnings is gained from how many percent of
children.
Figure 17: Schedule # 9
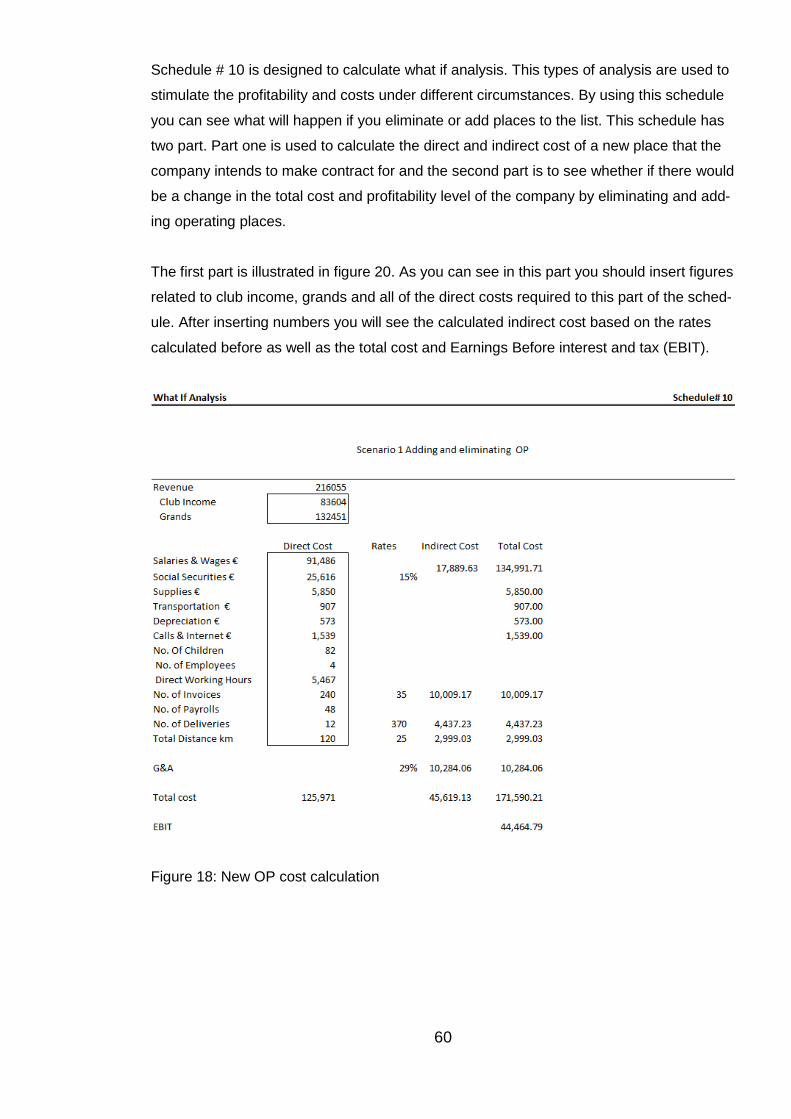
60
Schedule # 10 is designed to calculate what if analysis. This types of analysis are used to
stimulate the profitability and costs under different circumstances. By using this schedule
you can see what will happen if you eliminate or add places to the list. This schedule has
two part. Part one is used to calculate the direct and indirect cost of a new place that the
company intends to make contract for and the second part is to see whether if there would
be a change in the total cost and profitability level of the company by eliminating and add-
ing operating places.
The first part is illustrated in figure 20. As you can see in this part you should insert figures
related to club income, grands and all of the direct costs required to this part of the sched-
ule. After inserting numbers you will see the calculated indirect cost based on the rates
calculated before as well as the total cost and Earnings Before interest and tax (EBIT).
Figure 18: New OP cost calculation
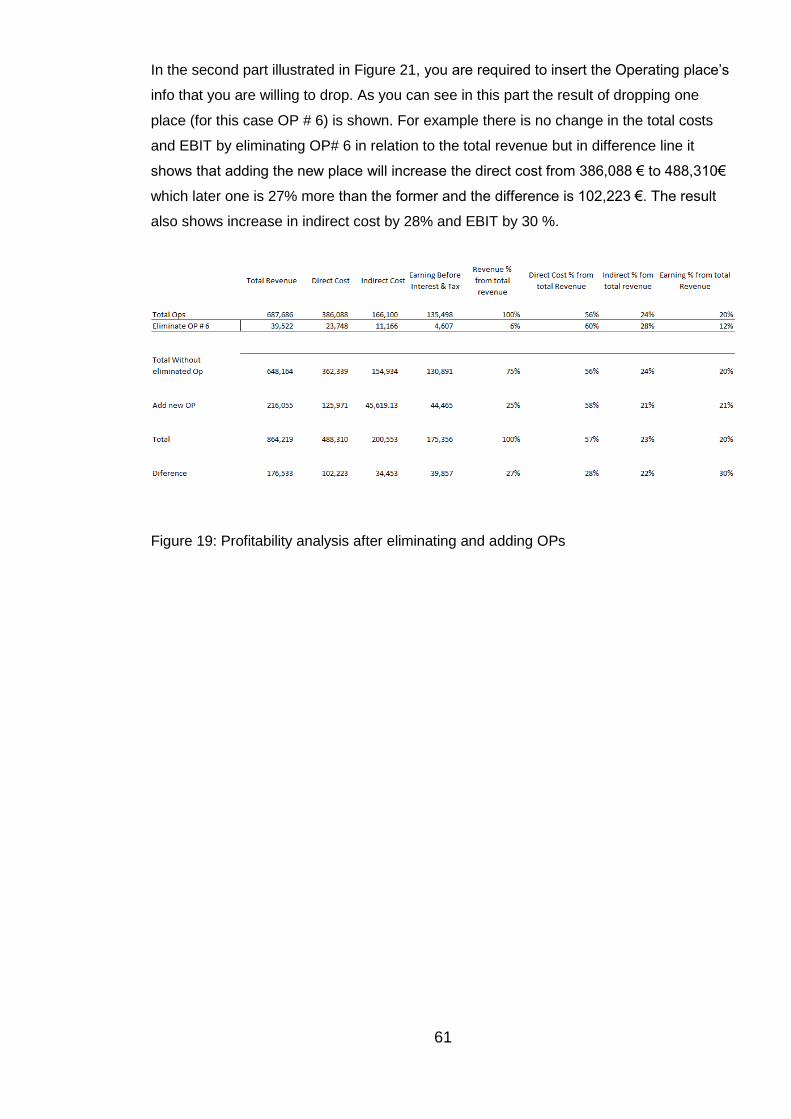
61
In the second part illustrated in Figure 21, you are required to insert the Operating place’s
info that you are willing to drop. As you can see in this part the result of dropping one
place (for this case OP # 6) is shown. For example there is no change in the total costs
and EBIT by eliminating OP# 6 in relation to the total revenue but in difference line it
shows that adding the new place will increase the direct cost from 386,088 € to 488,310€
which later one is 27% more than the former and the difference is 102,223 €. The result
also shows increase in indirect cost by 28% and EBIT by 30 %.
Figure 19: Profitability analysis after eliminating and adding OPs