CREATING A FREE CASH FLOW FOCUSED, DIVERSIFIED GOLD ... · Strong balance sheet with consolidated...
25
CREATING A FREE CASH FLOW FOCUSED, DIVERSIFIED GOLD PRODUCER May 11, 2020 For personal use only
Transcript of CREATING A FREE CASH FLOW FOCUSED, DIVERSIFIED GOLD ... · Strong balance sheet with consolidated...

CREATING A FREE CASH FLOW FOCUSED,
DIVERSIFIED GOLD PRODUCER
May 11, 2020
For
per
sona
l use
onl
y

| ASR:TSX AQG:ASX| ASR:TSX AQG:ASX PAGE 2SSRM:NASDAQ/TSX
Conference Call Participants
Paul Benson
President and CEO
Rodney P. Antal
President and CEO
For
per
sona
l use
onl
y

| ASR:TSX AQG:ASX| ASR:TSX AQG:ASX
▪ Board and management track record of creating value through discovery, project development, and
operations
▪ Expertise across various mining and processing skill sets: open pit, underground, pressure
oxidation, heap leach, flotation
▪ Enhanced capital markets presence and investor relevance
▪ Attractive trading liquidity across three global exchanges
▪ Three significant district scale land packages in USA, Canada, and Turkey
▪ Attractive portfolio of low capital intensity growth opportunities
▪ Track record of resource conversion, successful greenfield and brownfield exploration, and project
construction
▪ Strong balance sheet with consolidated cash(4) and marketable securities of ~US$700M
▪ Balance sheet strength supports growth pipeline and facilitates capital return evaluation
▪ Expected peer leading average annual pro forma free cash flow generation of ~US$450M(1,3) (2020E-
2022E), well ahead of peer group annual average of US$275M(1)
▪ Diversified portfolio of high quality, long-life operating assets across four jurisdictions
▪ Forward-looking 3-year average annual production profile of ~780 koz AuEq(1) at ~$900/oz(1) AISC(2)
(based on aggregate analyst consensus estimates)
PAGE 3SSRM:NASDAQ/TSX
Creating a Free Cash Flow Focused, Diversified Gold Producer
Zero-premium merger of two top-performing gold producers
Diversified
Portfolio
Organic
Growth
Potential
Free Cash
Flow Leader
Experienced
Leadership
Financial
Strength
Market
Presence
For
per
sona
l use
onl
y

| ASR:TSX AQG:ASX| ASR:TSX AQG:ASX
▪ Zero-premium, at-market merger based on TSX closing prices as of May 8, 2020
▪ Implies Alacer shareholders receive 0.3246 SSR Mining shares per Alacer share held
▪ Transaction is approximately neutral to NAVPS based on average of street consensus estimates for
both companies
▪ Joint information circular mailed by each company to its shareholders by June 2020
▪ SSR Mining and Alacer shareholder meetings expected to be held July 2020
▪ Closing expected in third quarter 2020
▪ Customary non-solicitation provisions; right to match
▪ Reciprocal termination fee of US$70M, payable in certain circumstances
▪ Unanimous support and lockup agreements from both Boards of Directors and certain officers
▪ Customary shareholder, regulatory and court approvals
▪ Reciprocal due diligence site visits completed in February/early March 2020 to core operating assets
▪ Michael Anglin as Chairman and Rodney Antal as CEO
▪ Company to continue as SSR Mining Inc. trading on TSX, NASDAQ and planned listing on ASX
▪ Company will be headquartered in Denver with a corporate office in Vancouver
▪ Board with 10 directors: 5 appointed by SSR Mining and 5 appointed by Alacer, including the CEO
▪ SSR Mining and Alacer to merge via Plan of Arrangement
▪ Combined equity value of approximately US$4.0 billion
▪ Pro Forma ownership of 57% SSR Mining and 43% Alacer
PAGE 4SSRM:NASDAQ/TSX
Proposed
Transaction
Proposed
Timing
Leadership
and
Governance
Consideration
Other Terms
and
Conditions
Transaction SummaryF
or p
erso
nal u
se o
nly

| ASR:TSX AQG:ASX| ASR:TSX AQG:ASX
2020 – 2022E ProductionKoz AuEq (100% Basis)
2020 – 2022E Free Cash FlowUS$M (100% Basis)
744 787 809
2020 2021 2022
$317
$477$553
2020 2021 2022
+9%
+74%
Çöpler48%
Marigold
27%
Seabee
14%
Puna
11%
Production by Asset2019A AuEq. (100% Basis)
PAGE 5SSRM:NASDAQ/TSX
Diversified Portfolio of High Quality, Long-Life Assets
Operating assets across four jurisdictions
Çöpler District
Puna Mine
Seabee Gold Mine
Marigold Mine
Pitarrilla
San Luis
Operations
Projects
Ardich
(3)
The figures presented above are based on aggregate analyst consensus estimates.
(1)
For
per
sona
l use
onl
y

| ASR:TSX AQG:ASX| ASR:TSX AQG:ASX PAGE 6SSRM:NASDAQ/TSX
Experienced Leadership
Track record of delivery based on a diverse technical skill set
Mining
Project
Execution
Geology
Processing
Operational
Excellence
▪ Large-scale open pit operations
▪ Narrow-vein underground mining
▪ Pressure-oxidation processing
▪ Heap leach gold extraction
▪ Polymetallic sulfide flotation
▪ Exploration success with multiple
deposit types and mineralization
styles
▪ Çöpler sulfide plant
▪ Chinchillas project extension
▪ Marigold per tonne movement
▪ Seabee mill throughput increase
▪ Çöpler oxides and sulfides
Diverse Operating & Development Skill Set Track Record of Value Creation (5)
0
50
100
150
200
250
May-16 Feb-17 Nov-17 Aug-18 May-19 Feb-20
Sh
are
Price
Pe
rfo
rma
nce
(In
de
xe
d to
10
0)
SSR Mining Alacer Gold GDX GDXJ
+138%
+124%
+15%
+39%
Track record of achieving guidance
For
per
sona
l use
onl
y

| ASR:TSX AQG:ASX| ASR:TSX AQG:ASX
Experienced Leadership
Successful cultures grounded in discipline and integrity
PAGE 7SSRM:NASDAQ/TSX
24
22
19
19
17
17
15
14
13
12
12
9
9
7
Peer 12
Peer 11
Peer 10
Peer 9
Peer 8
Peer 7
Peer 6
Peer 5
Peer 4
Peer 3
Alacer Gold
Peer 2
SSR Mining
Peer 1▪ Top ESG rankings
▪ Focus on shareholder value
▪ Strong health and safety record
▪ Consistent operational execution
▪ Disciplined capital allocation
ISS ESG Ranking (6)Experienced Leadership
For
per
sona
l use
onl
y

| ASR:TSX AQG:ASX| ASR:TSX AQG:ASX
Free Cash Flow Leader
Peer leading free cash flow generation
PAGE 8SSRM:NASDAQ/TSX
2020 – 2022E Average Free Cash Flow (3,7)
US$M | Operating Cash Flow less Capex (100% basis)
$538
$449 $429$391 $378 $376
$281 $262$221
$187 $181 $176$133 $109 $97
Nort
hern
Sta
r
Merg
eC
o
B2G
old
Evolu
tion
Yam
an
a
Cen
terr
a
Sara
ce
n
Ala
ce
r G
old
Cen
tam
in
SS
R M
inin
g
Ala
mos
Equin
ox
Oce
anaG
old
Eld
ora
do
IAM
GO
LD
2020 – 2022E Average Production (1,7)
Koz AuEq (100% basis)
1,215
978 972 970 925
780 776 769647
521 519 510 480 433347
Nort
hern
Sta
r
Cen
terr
a
Yam
an
a
B2G
old
Evolu
tion
Merg
eC
o
IAM
GO
LD
Equin
ox
Sara
ce
n
Cen
tam
in
Oce
anaG
old
Ala
mos
Eld
ora
do
SS
R M
inin
g
Ala
ce
r G
old
The figures presented above (including those of Alacer, SSR Mining and MergeCo) are based on aggregate analyst consolidated consensus estimates.
For
per
sona
l use
onl
y

| ASR:TSX AQG:ASX| ASR:TSX AQG:ASX PAGE 9SSRM:NASDAQ/TSX
Significant Financial Strength
Peer leading balance sheet bolstered by free cash generation
Peer Leading Credit MetricsOver $700M of Cash & Securities
(US$M) SSR Alacer MergeCo
FD Shares
Outstanding126.3 298.5 223.2
Market
Capitalization$2,288 $1,755 $4,043
Debt $230 $262 $492
Cash & Marketable
Securities$468 $239 $707
Net Debt (Cash) ($238) $23 ($215)
2020E EBITDA $289 $328 $618
Net Debt to
EBITDA(0.8x) 0.1x (0.3x)
1.5x
0.9x
0.6x
0.5x
0.3x
0.1x
0.1x
0.0x
0.0x
(0.1x)
(0.3x)
(0.4x)
(0.8x)
(0.8x)
(0.9x)
Equinox
Yamana
Eldorado
OceanaGold
Evolution
Northern Star
Alacer Gold
Saracen
B2Gold
Centerra
MergeCo
Alamos
SSR Mining
Centamin
IAMGOLD
Net Debt to 2020E EBITDA
(9)
(10)
(11)
(8))
(4)
For
per
sona
l use
onl
y

| ASR:TSX AQG:ASX| ASR:TSX AQG:ASX PAGE 10SSRM:NASDAQ/TSX
Robust Organic Pipeline for Growth
Extensive land packages in proven mineral belts
Çöpler District master plan Marigold growth opportunities
Seabee Mineral Resources
extensions and Fisher project targets
Projects for evaluation and Mineral
Resources development
✓ 121,500 hectares across Turkey
✓ Ardich – Potential to Add Production in 2-3
Years
✓ Çöpler Saddle – Future Potential
✓ Mavialtin Porphyry Belt – Early-Stage
Prospects
✓ ~20,000 hectare land package
✓ Doubled land position with the acquisition
of the neighboring Trenton Canyon and
Buffalo Valley properties
✓ Highly prospective for both surface
oxides and deeper high grade sulfides
✓ Over 60,000 hectares incl. Fisher option
✓ Large, continuous land package covers
30 km of shear zone strike length
✓ Highly prospective for greenfield and
brownfield discoveries
✓ Pitarrilla – one of the largest undeveloped
primary silver deposits in the world with
leverage to rising commodity prices
✓ San Luis – high grade, low capital
intensity Au-Ag deposit with robust
project economics
(15)
(12)
(13)
(14)
For
per
sona
l use
onl
y

| ASR:TSX AQG:ASX| ASR:TSX AQG:ASX PAGE 11SSRM:NASDAQ/TSX
Enhanced Capital Markets PresenceAttractive trading liquidity across three global exchanges
Daily Trading Liquidity (US$M)Market Capitalization (US$B)
Increased scale across three
exchanges …
… Improved liquidity attracts
investors
… Potential for increased
coverage from equity research
analysts
$1.8
$2.3
$4.0
Alacer Gold SSR Mining MergeCo
$28.9
$33.7
$10.7
$39.6
MergeCo Peer Average(18)
58%19%
13%
9%1%
United States
Europe
Canada
Asia/Pacific
Other
Overlapping Equity Research Analysts:
BMO Capital Markets
CIBC World Markets
National Bank Financial
RBC Capital Markets
Scotiabank
Non-Overlapping Equity Research Analysts:
Bank of America Merrill Lynch
B. Riley FBR
Canaccord Genuity
Cormark Securities
UBS Investment Research
Macquarie
PI Financial
Stifel GMP
Credit Suisse
Pro forma shareholders
by region
(16)
(17) (19)
(20)
For
per
sona
l use
onl
y

| ASR:TSX AQG:ASX| ASR:TSX AQG:ASX PAGE 12SSRM:NASDAQ/TSX
Creating a Leading Intermediate Gold Producer
Merging of ‘Tier 1’ asset and diversified portfolio with scale and growth
Zero-premium, at-market merger of two top-performing companies
Experienced management team with a track record of creating value
Financial strength with peer leading free cash flow generation
Prospective exploration portfolio in proven mineral belts
Enhanced capital markets presence and investor relevance
For
per
sona
l use
onl
y

| ASR:TSX AQG:ASX| ASR:TSX AQG:ASX PAGE 13SSRM:NASDAQ/TSX
NASDAQ/TSX:SSRM
Paul Benson
President & CEO, Director
W. John DeCooman, Jr.
SVP, Business Development & Strategy
E-Mail: [email protected]
www.ssrmining.com
TSX:ASR, ASX:AQG
Rodney P. Antal
President & CEO, Director
F. Edward Farid
SVP, Business Development & Investor Relations
Lisa Maestas
Director, Investor Relations
E-Mail: [email protected]
www.alacergold.com
Contact InfoF
or p
erso
nal u
se o
nly

APPENDIX
For
per
sona
l use
onl
y

| ASR:TSX AQG:ASX
Goldstrike
Marigold
Other mines in area
Cortez
Phoenix
MARIGOLD
Carlin Trend
Battle Mountain-Eureka Trend
Marigold Mine: Overview
SSRM:NASDAQ/TSX PAGE 15
Turquoise Ridge
Fact Sheet
Location Nevada, United States
Mining Open pit
Processing Run-of-mine heap leach (no crushing)
Material Moved ~200,000 tpd
Operation Start 1989 (in continuous operation)
Current Mine Life Early 2030’s (including Red Dot Mineral Reserve addition)
Land Package ~20,000 hectares
2019A Results
Production 220,227 oz
Cash Costs $811 /oz
AISC $1,034 /oz
(21)
For
per
sona
l use
onl
y

| ASR:TSX AQG:ASX
Çöpler Gold Mine: Overview (100% Basis)
SSRM:NASDAQ/TSX PAGE 16
Fact Sheet Oxide Sulfide Consolidated
Mining Open Pit Open Pit –
Processing Heap LeachPressure
Oxidation–
Capacity ~17,000 tpd ~6,000 tpd –
Operation Start 2011 2018 –
Current Mine Life – – 18 years
Land Package – – 16,573 ha
2020E Guidance
Production 80 – 100 koz 230 – 260 koz 310 – 360 koz
Cash Costs $675 – $725/oz $500 – $550/oz $550 – $600/oz
AISC $775 – $825/oz $650 – $700/oz $735 – $785/oz
Capital (incl.
sustaining capex)– – $82M
Exploration – – $20M
Çöpler Mine
Erzincan Province, Turkey
(22) (23)
Ardich
For
per
sona
l use
onl
y

| ASR:TSX AQG:ASXSSRM:NASDAQ/TSX PAGE 17
Seabee Gold Operation
Amisk Project
Saskatoon
Flin Flon
Fact Sheet
Location Saskatchewan, Canada
Mining Underground
Processing Gravity concentration and cyanide leaching
Mill Throughput Targeting 1,050 tpd
Operation Start 1991 (in continuous operation)
Current Mine Life 2024 (significant extension potential with more infill drilling)
Land Package Over 60,000 hectares including Fisher option
2019A Results
Production 112,137 oz
Cash Costs $464 /oz
AISC $812 /oz
Seabee Gold Operations: Overview
(24)
(15)
For
per
sona
l use
onl
y

| ASR:TSX AQG:ASXSSRM:NASDAQ/TSX PAGE 18
Pirquitas Operation
Jujuy, Argentina
Chinchillas Mine
Jujuy, Argentina
Fact Sheet
Location Jujuy Province, Argentina
Mining Open pit
Processing Flotation plant to produce concentrate
Mill Capacity +5,000 tpd
Operation Start 2018 (Pirquitas processing plant started in 2009)
Current Mine Life +2025
2019A Results
Production 7.7 Moz Ag (24.0 Mlb Pb, 8.4 Mlb Zn)
Cash Costs $10.38 /oz Ag (net of by-products)
AISC $14.06 /oz Ag (net of by-products)
LOM Revenue Mix 72% Ag; 20% Pb; 8% Zn
Puna Operations: Overview
(24)
For
per
sona
l use
onl
y

| ASR:TSX AQG:ASXSSRM:NASDAQ/TSX PAGE 19
DepositTonnes
(kt)
Grade Contained
Au (g/t) Ag (g/t) Cu (%) Pb (%) Zn (%) Au (koz) Ag (koz) Cu (klbs) Pb (klbs) Zn (klbs)
Proven Mineral Reserves
Marigold -- -- -- -- -- -- -- -- -- -- --
Marigold (Leach Pad Inventory) -- -- -- -- -- -- -- -- -- -- --
Seabee 370 9.82 -- -- -- -- 117 -- -- -- --
Chinchillas 807 -- 146.9 -- 0.56% 0.30% -- 3,809 -- 9,895 5,397
Pirquitas -- -- -- -- -- -- -- -- -- -- --
Ҫӧpler -- -- -- -- -- -- -- -- -- -- --
Total Proven 1,177 -- -- -- -- -- 117 3,809 -- 9,895 5,397
Probable Mineral Reserves
Marigold 228,763 0.49 -- -- -- -- 3,610 -- -- -- --
Marigold (Leach Pad Inventory) -- -- -- -- -- -- 277 -- -- -- --
Seabee 1,158 10.29 -- -- -- -- 383 -- -- -- --
Chinchillas 8,700 -- 157.7 -- 1.31% 0.39% -- 44,112 -- 250,557 74,605
Pirquitas 870 -- 63.9 -- -- 1.43% -- 1,789 -- -- 27,525
Ҫӧpler 42,560 2.40 5.7 0.01% -- -- 3,284 7,743 12,929 -- --
Total Probable 282,051 -- -- -- -- -- 7,554 53,644 12,929 250,557 102,129
Proven & Probable Mineral Reserves
Marigold 228,763 0.49 -- -- -- -- 3,610 -- -- -- --
Marigold (Leach Pad Inventory) -- -- -- -- -- -- 277 -- -- -- --
Seabee 1,528 10.17 -- -- -- -- 500 -- -- -- --
Chinchillas 9,507 -- 156.8 -- 1.24% 0.38% -- 47,921 -- 260,452 80,002
Pirquitas 870 -- 63.9 -- -- 1.43% -- 1,789 -- -- 27,525
Ҫӧpler 42,560 2.40 5.7 0.01% -- -- 3,284 7,743 12,929 -- --
Total Proven & Probable 283,228 -- -- -- -- -- 7,671 57,453 12,929 260,452 107,527
Consolidated Mineral Reserves
(26)
(26)
(26)
(26)
(26)
(26)
(25)
(26)
(26)
For
per
sona
l use
onl
y

| ASR:TSX AQG:ASXSSRM:NASDAQ/TSX PAGE 20
DepositTonnes
(kt)
Grade Contained
Au (g/t) Ag (g/t) Cu (%) Pb (%) Zn (%) Au (koz) Ag (koz) Cu (klbs) Pb (klbs) Zn (klbs)
Measured Mineral Resources
Marigold -- -- -- -- -- -- -- -- -- -- --
Marigold (Leach Pad Inventory) -- -- -- -- -- -- -- -- -- -- --
Seabee 493 12.69 -- -- -- -- 201 -- -- -- --
Chinchillas 1,512 -- 126.8 -- 0.54% 0.37% -- 6,165 -- 17,968 12,449
Pirquitas -- -- -- -- -- -- -- -- -- -- --
San Luis -- -- -- -- -- -- -- -- -- -- --
Pitarrilla 12,345 -- 90.1 -- 0.70% 1.22% -- 35,746 -- 189,968 333,125
Amisk -- -- -- -- -- -- -- -- -- -- --
Ҫӧpler -- -- -- -- -- -- -- -- -- -- --
Ardich -- -- -- -- -- -- -- -- -- -- --
Total Measured 14,350 -- -- -- -- -- 201 41,911 -- 207,937 345,574
Indicated Mineral Resources
Marigold 301,760 0.48 -- -- -- -- 4,665 -- -- -- --
Marigold (Leach Pad Inventory) -- -- -- -- -- -- 277 -- -- -- --
Seabee 2,586 10.22 -- -- -- -- 849 -- -- -- --
Chinchillas 23,854 -- 101.7 -- 0.97% 0.63% -- 77,982 -- 509,672 329,299
Pirquitas 3,504 -- 235.6 -- -- 3.71% -- 26,545 -- -- 286,240
San Luis 484 22.40 578.1 -- -- -- 349 9,003 -- -- --
Pitarrilla 152,446 -- 99.9 -- 0.33% 0.88% -- 489,521 -- 1,121,812 2,964,006
Amisk 30,150 0.85 6.2 -- -- -- 827 5,978 -- -- --
Ҫӧpler 81,994 1.97 5.0 0.02% -- -- 5,189 13,263 33,435 -- --
Ardich 15,855 1.60 -- -- -- -- 817 -- -- -- --
Total Indicated 596,778 -- -- -- -- -- 12,157 622,292 33,435 1,631,484 3,579,545
Measured & Indicated Mineral Resources
Marigold 301,760 0.48 -- -- -- -- 4,665 -- -- -- --
Marigold (Leach Pad Inventory) -- -- -- -- -- -- 277 -- -- -- --
Seabee 3,079 10.61 -- -- -- -- 1,050 -- -- -- --
Chinchillas 25,366 -- 103.2 -- 0.94% 0.61% -- 84,147 -- 527,641 341,748
Pirquitas 3,504 -- 235.6 -- -- 3.71% -- 26,545 -- -- 286,240
San Luis 484 22.40 578.1 -- -- -- 349 9,003 -- -- --
Pitarrilla 164,791 -- 99.1 -- 0.36% 0.91% -- 525,267 -- 1,311,780 3,297,130
Amisk 30,150 0.85 6.2 -- -- -- 827 5,978 -- -- --
Ҫӧpler 81,994 1.97 5.0 0.02% -- -- 5,189 13,263 33,435 -- --
Ardich 15,855 1.60 -- -- -- -- 817 -- -- -- --
Total Measured & Indicated 611,128 -- -- -- -- -- 12,358 664,203 33,435 1,839,421 3,925,119
Consolidated Measured & Indicated Resources
(26)
(26)
(26)
(26)
(26)
(26)
(27)
(26)
(26)
For
per
sona
l use
onl
y

| ASR:TSX AQG:ASXSSRM:NASDAQ/TSX PAGE 21
DepositTonnes
(kt)
Grade Contained
Au (g/t) Ag (g/t) Cu (%) Pb (%) Zn (%) Au (koz) Ag (koz) Cu (klbs) Pb (klbs) Zn (klbs)
Inferred Mineral Resources
Marigold 16,194 0.35 -- -- -- -- 182 -- -- -- --
Seabee 2,132 8.50 -- -- -- -- 583 -- -- -- --
Chinchillas 22,172 -- 49.9 -- 0.55% 0.83% -- 35,558 -- 267,724 406,593
Pirquitas 1,080 -- 206.9 -- -- 7.45% -- 7,185 -- -- 177,394
San Luis 20 5.60 272.0 -- -- -- 4 175 -- -- --
Pitarrilla 9,754 -- 85.1 -- 0.27% 0.66% -- 26,675 -- 57,020 142,139
Amisk 28,653 0.64 4.0 -- -- -- 589 3,693 -- -- --
Ҫӧpler 32,980 1.29 8.9 0.08% -- -- 1,365 9,414 57,341 -- --
Ardich 8,819 2.09 -- -- -- -- 594 -- -- -- --
Total Inferred 121,805 -- -- -- -- -- 2,724 82,700 57,341 324,745 726,126
Consolidated Inferred Resources
(28)
For
per
sona
l use
onl
y
| ASR:TSX AQG:ASX| ASR:TSX AQG:ASX PAGE 22SSRM:NASDAQ/TSX
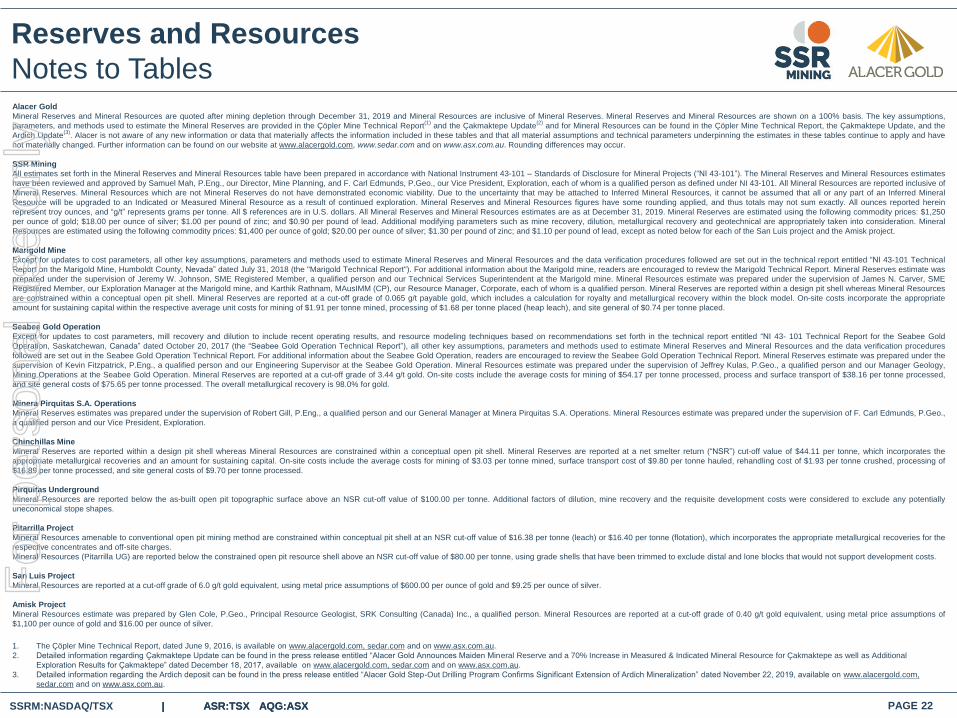
Reserves and Resources
Notes to TablesAlacer Gold
Mineral Reserves and Mineral Resources are quoted after mining depletion through December 31, 2019 and Mineral Resources are inclusive of Mineral Reserves. Mineral Reserves and Mineral Resources are shown on a 100% basis. The key assumptions,
parameters, and methods used to estimate the Mineral Reserves are provided in the Çöpler Mine Technical Report(1)
and the Çakmaktepe Update(2)
and for Mineral Resources can be found in the Çöpler Mine Technical Report, the Çakmaktepe Update, and the
Ardich Update(3)
. Alacer is not aware of any new information or data that materially affects the information included in these tables and that all material assumptions and technical parameters underpinning the estimates in these tables continue to apply and have
not materially changed. Further information can be found on our website at www.alacergold.com, www.sedar.com and on www.asx.com.au. Rounding differences may occur.
SSR Mining
All estimates set forth in the Mineral Reserves and Mineral Resources table have been prepared in accordance with National Instrument 43-101 – Standards of Disclosure for Mineral Projects (“NI 43-101”). The Mineral Reserves and Mineral Resources estimates
have been reviewed and approved by Samuel Mah, P.Eng., our Director, Mine Planning, and F. Carl Edmunds, P.Geo., our Vice President, Exploration, each of whom is a qualified person as defined under NI 43-101. All Mineral Resources are reported inclusive of
Mineral Reserves. Mineral Resources which are not Mineral Reserves do not have demonstrated economic viability. Due to the uncertainty that may be attached to Inferred Mineral Resources, it cannot be assumed that all or any part of an Inferred Mineral
Resource will be upgraded to an Indicated or Measured Mineral Resource as a result of continued exploration. Mineral Reserves and Mineral Resources figures have some rounding applied, and thus totals may not sum exactly. All ounces reported herein
represent troy ounces, and “g/t” represents grams per tonne. All $ references are in U.S. dollars. All Mineral Reserves and Mineral Resources estimates are as at December 31, 2019. Mineral Reserves are estimated using the following commodity prices: $1,250
per ounce of gold; $18.00 per ounce of silver; $1.00 per pound of zinc; and $0.90 per pound of lead. Additional modifying parameters such as mine recovery, dilution, metallurgical recovery and geotechnical are appropriately taken into consideration. Mineral
Resources are estimated using the following commodity prices: $1,400 per ounce of gold; $20.00 per ounce of silver; $1.30 per pound of zinc; and $1.10 per pound of lead, except as noted below for each of the San Luis project and the Amisk project.
Marigold Mine
Except for updates to cost parameters, all other key assumptions, parameters and methods used to estimate Mineral Reserves and Mineral Resources and the data verification procedures followed are set out in the technical report entitled “NI 43-101 Technical
Report on the Marigold Mine, Humboldt County, Nevada” dated July 31, 2018 (the "Marigold Technical Report"). For additional information about the Marigold mine, readers are encouraged to review the Marigold Technical Report. Mineral Reserves estimate was
prepared under the supervision of Jeremy W. Johnson, SME Registered Member, a qualified person and our Technical Services Superintendent at the Marigold mine. Mineral Resources estimate was prepared under the supervision of James N. Carver, SME
Registered Member, our Exploration Manager at the Marigold mine, and Karthik Rathnam, MAusIMM (CP), our Resource Manager, Corporate, each of whom is a qualified person. Mineral Reserves are reported within a design pit shell whereas Mineral Resources
are constrained within a conceptual open pit shell. Mineral Reserves are reported at a cut-off grade of 0.065 g/t payable gold, which includes a calculation for royalty and metallurgical recovery within the block model. On-site costs incorporate the appropriate
amount for sustaining capital within the respective average unit costs for mining of $1.91 per tonne mined, processing of $1.68 per tonne placed (heap leach), and site general of $0.74 per tonne placed.
Seabee Gold Operation
Except for updates to cost parameters, mill recovery and dilution to include recent operating results, and resource modeling techniques based on recommendations set forth in the technical report entitled “NI 43- 101 Technical Report for the Seabee Gold
Operation, Saskatchewan, Canada” dated October 20, 2017 (the “Seabee Gold Operation Technical Report”), all other key assumptions, parameters and methods used to estimate Mineral Reserves and Mineral Resources and the data verification procedures
followed are set out in the Seabee Gold Operation Technical Report. For additional information about the Seabee Gold Operation, readers are encouraged to review the Seabee Gold Operation Technical Report. Mineral Reserves estimate was prepared under the
supervision of Kevin Fitzpatrick, P.Eng., a qualified person and our Engineering Supervisor at the Seabee Gold Operation. Mineral Resources estimate was prepared under the supervision of Jeffrey Kulas, P.Geo., a qualified person and our Manager Geology,
Mining Operations at the Seabee Gold Operation. Mineral Reserves are reported at a cut-off grade of 3.44 g/t gold. On-site costs include the average costs for mining of $54.17 per tonne processed, process and surface transport of $38.16 per tonne processed,
and site general costs of $75.65 per tonne processed. The overall metallurgical recovery is 98.0% for gold.
Minera Pirquitas S.A. Operations
Mineral Reserves estimates was prepared under the supervision of Robert Gill, P.Eng., a qualified person and our General Manager at Minera Pirquitas S.A. Operations. Mineral Resources estimate was prepared under the supervision of F. Carl Edmunds, P.Geo.,
a qualified person and our Vice President, Exploration.
Chinchillas Mine
Mineral Reserves are reported within a design pit shell whereas Mineral Resources are constrained within a conceptual open pit shell. Mineral Reserves are reported at a net smelter return (“NSR”) cut-off value of $44.11 per tonne, which incorporates the
appropriate metallurgical recoveries and an amount for sustaining capital. On-site costs include the average costs for mining of $3.03 per tonne mined, surface transport cost of $9.80 per tonne hauled, rehandling cost of $1.93 per tonne crushed, processing of
$16.89 per tonne processed, and site general costs of $9.70 per tonne processed.
Pirquitas Underground
Mineral Resources are reported below the as-built open pit topographic surface above an NSR cut-off value of $100.00 per tonne. Additional factors of dilution, mine recovery and the requisite development costs were considered to exclude any potentially
uneconomical stope shapes.
Pitarrilla Project
Mineral Resources amenable to conventional open pit mining method are constrained within conceptual pit shell at an NSR cut-off value of $16.38 per tonne (leach) or $16.40 per tonne (flotation), which incorporates the appropriate metallurgical recoveries for the
respective concentrates and off-site charges.
Mineral Resources (Pitarrilla UG) are reported below the constrained open pit resource shell above an NSR cut-off value of $80.00 per tonne, using grade shells that have been trimmed to exclude distal and lone blocks that would not support development costs.
San Luis Project
Mineral Resources are reported at a cut-off grade of 6.0 g/t gold equivalent, using metal price assumptions of $600.00 per ounce of gold and $9.25 per ounce of silver.
Amisk Project
Mineral Resources estimate was prepared by Glen Cole, P.Geo., Principal Resource Geologist, SRK Consulting (Canada) Inc., a qualified person. Mineral Resources are reported at a cut-off grade of 0.40 g/t gold equivalent, using metal price assumptions of
$1,100 per ounce of gold and $16.00 per ounce of silver.
1. The Çöpler Mine Technical Report, dated June 9, 2016, is available on www.alacergold.com, sedar.com and on www.asx.com.au.
2. Detailed information regarding Çakmaktepe Update can be found in the press release entitled “Alacer Gold Announces Maiden Mineral Reserve and a 70% Increase in Measured & Indicated Mineral Resource for Çakmaktepe as well as Additional
Exploration Results for Çakmaktepe” dated December 18, 2017, available on www.alacergold.com, sedar.com and on www.asx.com.au.
3. Detailed information regarding the Ardich deposit can be found in the press release entitled “Alacer Gold Step-Out Drilling Program Confirms Significant Extension of Ardich Mineralization” dated November 22, 2019, available on www.alacergold.com,
sedar.com and on www.asx.com.au.
For
per
sona
l use
onl
y

| ASR:TSX AQG:ASX| ASR:TSX AQG:ASX PAGE 23SSRM:NASDAQ/TSX
Endnotes
1. Based on the aggregate of the “street” consolidated consensus estimates of average annual production over 3 years (2020 to 2022 inclusive) for Alacer and SSR Mining sourced from Capital IQ (www.capitaliq.com)
(“Capital IQ”) as at May 8, 2020. Consolidated consensus estimates are intended to provide an “order of magnitude” indication for illustrative and comparison purposes only, and are not intended to be, and should not be
treated as, a forecast, estimate or guidance made, adopted, confirmed or endorsed by either of Alacer or SSR Mining or the combined entity. The following equity research analysts have contributed to the consensus
figures presented herein: Bank of America Securities, BMO Capital Markets, Canaccord Genuity, CIBC Capital Markets, Cormark Securities Inc., Credit Suisse, Macquarie, National Bank Financial, PI Financial Corp.,
RBC Capital Markets, Scotiabank, Stifel Canada, and UBS AG.
2. All-in Sustaining Costs (“AISC”) is a Non-GAAP Measure with no standardized definition under IFRS. For further information and a detailed reconciliation to IFRS, please see the “Non-GAAP Measures” section of
Alacer’s most recent MD&A. Based on the aggregate of the “street” consensus estimates of AISC over 3 years (2020 to 2022 inclusive) for Alacer and SSR Mining sourced from Capital IQ as at May 8, 2020. Consensus
estimates are intended to provide an “order of magnitude” indication for illustrative and comparison purposes only, and are not intended to be, and should not be treated as, a forecast, estimate or guidance made,
adopted, confirmed or endorsed by either of Alacer or SSR Mining or the combined entity.
3. Based on the aggregate of the “street” consolidated consensus estimates of free cash flow over 3 years (2020 to 2022 inclusive) for Alacer and SSR Mining sourced from Capital IQ as at May 8, 2020. Consensus
estimates are intended to provide an “order of magnitude” indication for illustrative and comparison purposes only, and are not intended to be, and should not be treated as, a forecast, estimate or guidance made,
adopted, confirmed or endorsed by either of Alacer or SSR Mining or the combined entity. Free cash flow is defined as operating cash flow less capex.
4. Consolidated cash is a Non-GAAP Measure and includes cash and cash equivalents, cash that is restricted and shown as a long-term asset in Alacer’s financial statements and attributable cash held by joint venture
partners accounted for using the equity method. For further information, please see the “Non-GAAP Measures” section of Alacer’s most recent MD&A.
5. Source: Capital IQ as at May 8, 2020.
6. Source: ISS rankings as at March 2020. Total ISS ESG Ranking is aggregate score of Governance, Social, and Environmental. Peers from ISS include Alamos Gold, B2Gold, Eldorado Gold, Endeavour Mining, First
Majestic Silver, Fortuna Silver Mines, IAMGOLD, New Gold, OceanaGold, Pan American Silver, SEMAFO, Torex Gold. Combined rating of governance, environmental, and social.
7. Source: Capital IQ; Bloomberg, as at May 8, 2020. Evolution pro forma Red Lake acquisition, Saracen pro forma Kalgoorlie acquisition, and Equinox pro forma Leagold acquisition.
8. Source: Corporate disclosure. Based on the aggregate of the “street” consensus estimates; Capital IQ as at May 8, 2020. Consensus estimates are intended to provide an “order of magnitude” indication for illustrative
and comparison purposes only, and are not intended to be, and should not be treated as, a forecast, estimate or guidance made, adopted, confirmed or endorsed by either of Alacer or SSR Mining or the combined
entity. Cash and debt values as at March 31, 2020; Marketable securities priced as at May 8, 2020.
9. Fully-diluted in-the-money market capitalization as at May 8, 2020.
10. Reflects US$398 million cash balance.
11. Based on the aggregate of the “street” consensus estimates for Alacer and SSR Mining sourced from Capital IQ as at May 8, 2020. Consensus estimates are intended to provide an “order of magnitude” indication for
illustrative and comparison purposes only, and are not intended to be, and should not be treated as, a forecast, estimate or guidance made, adopted, confirmed or endorsed by either of Alacer or SSR Mining or the
combined entity.
12. Please see Alacer’s news release dated November 29, 2019.
13. Please see Alacer’s news release dated September 26, 2019.
14. Please see Alacer’s news release dated February 14, 2020.
15. ~23,000 ha wholly owned; ~38,000 ha option earn-in.
16. SSR Mining will apply to list on the ASX with listing targeted by closing.
17. Source: Capital IQ, Bloomberg as at May 8, 2020. Fully-diluted in-the-money market capitalization as of May 8, 2020.
18. Peers consist of Northern Star, Yamana, Centerra, B2Gold, Evolution, IAMGOLD, Equinox, Saracen, Eldorado, Centamin, OceanaGold, and Alamos.
19. Source: Capital IQ, Bloomberg as at May 8, 2020. Daily trading liquidity averaged over last twelve month across all exchanges.
20. Pro Forma shares based on 0.3246 exchange ratio.
21. Please see SSR Mining news release dated February 20, 2020. Cash costs is a non-GAAP financial measure. Land package includes Valmy, Trenton Canyon, and Buffalo Valley properties. Please see "Cautionary Note
Regarding Non-GAAP Measures” in this presentation.
22. Please see Alacer news release dated January 22, 2020. Cash costs is a non-GAAP financial measure. Please see "Cautionary Note Regarding Non-GAAP Measures” in this presentation.
23. Oxide plant includes production from both Çöpler oxide ore and Çakmaktepe oxide ore.
24. Please see SSR Mining news release dated January 15, 2020. Cash costs is a non-GAAP financial measure. Please see "Cautionary Note Regarding Non-GAAP Measures” in this presentation.
25. As at December 31, 2019. Mineral Reserves are shown on a 100% basis.
26. Includes stockpiles.
27. As at December 31, 2019. Mineral Resources are shown on a 100% basis. Mineral Resources are stated inclusive of Mineral Reserves.
28. As at December 31, 2019. Mineral Resources are shown on a 100% basis.
For
per
sona
l use
onl
y

| ASR:TSX AQG:ASX| ASR:TSX AQG:ASX PAGE 24SSRM:NASDAQ/TSX
Cautionary Statements
Certain statements contained in this document constitute “forward-looking information”, “future oriented financial information” or “financial outlooks” (collectively, “forward looking information”) within the meaning of applicable securities
laws. Forward looking information often relates to statements concerning Alacer’s and SSR Mining’s future outlook and anticipated events or results, Alacer and SSR Mining management expectations with respect to the proposed
business combination (the “Transaction”) and the combined company and in some cases, can be identified by terminology such as “may”, “will”, “could”, “should”, “expect”, “plan”, “anticipate”, “believe”, “intend”, “estimate”, “projects”,
“predict”, potential”, “continue” or other similar expressions concerning matters that are not historical facts.
Forward looking information includes statements concerning, among other things, production, cost, and capital expenditure guidance; the results of any gold reconciliations; matters relating to proposed exploration; communications
with local stakeholders; maintaining community and government relations; negotiations of joint ventures; negotiation and completion of transactions; commodity prices; mineral resources, mineral reserves, realization of mineral
reserves, and the existence or realization of mineral resource estimates; the timing and amount of future production; the timing of studies, announcements, and analysis; the timing of construction and development of proposed mines
and process facilities; capital and operating expenditures; economic conditions; availability of sufficient financing; exploration plans; receipt of regulatory approvals; and any and all other timing, exploration, development, operational,
financial, budgetary, economic, legal, social, regulatory, and political matters that may influence or be influenced by future events or conditions.
This document also contains forward-looking statements regarding the anticipated completion of the Transaction and timing thereof. Forward-looking statements in this document are based on certain key expectations and
assumptions made by Alacer and SSR Mining, including expectations and assumptions concerning the receipt, in a timely manner, of regulatory and stock exchange approvals in respect of the Transaction. Although Alacer and SSR
Mining believe that the expectations and assumptions on which such forward-looking statements are based are reasonable, undue reliance should not be placed on the forward-looking statements because Alacer and SSR Mining can
give no assurance that they will prove to be correct. Forward-looking statements are subject to various risks and uncertainties which could cause actual results and experience to differ materially from the anticipated results or
expectations expressed in this document. The key risks and uncertainties include, but are not limited to governmental and regulatory requirements and actions by governmental authorities, including changes in government policy,
government ownership requirements, changes in environmental, tax and other laws or regulations and the interpretation thereof; developments with respect to the COVID-19 pandemic, including the duration, severity and scope of the
pandemic and potential impacts on mining operations; and other risk factors detailed from time to time in Alacer and SSR Mining reports filed with the Canadian securities regulatory authorities. There are also risks that are inherent in
the nature of the Transaction, including failure to obtain any required regulatory and other approvals (or to do so in a timely manner). The anticipated timeline for completion of the Transaction may change for a number of reasons,
including the inability to secure necessary regulatory, stock exchange or other approvals in the time assumed, developments with respect to the COVID-19 pandemic or the need for additional time to satisfy the conditions to the
completion of the Transaction. As a result of the foregoing, readers should not place undue reliance on the forward looking statements contained in this document concerning the timing of the Transaction.
Such forward-looking information and statements are based on a number of material factors and assumptions, including, but not limited in any manner to, those disclosed in any of Alacer’s or SSR Mining’s other public filings, and
include the inherent speculative nature of exploration results; the ability to explore; communications with local stakeholders; maintaining community and governmental relations; status of negotiations of joint ventures; weather
conditions at Alacer’s and SSR Mining’s operations; commodity prices; the ultimate determination of and realization of mineral reserves; existence or realization of mineral resources; the development approach; availability and receipt
of required approvals, titles, licenses and permits; sufficient working capital to develop and operate the mines and implement development plans; access to adequate services and supplies; foreign currency exchange rates; interest
rates; access to capital markets and associated cost of funds; availability of a qualified workforce; ability to negotiate, finalize, and execute relevant agreements; lack of social opposition to the mines or facilities; lack of legal challenges
with respect to the properties of Alacer and SSR Mining; the timing and amount of future production; the ability to meet production, cost, and capital expenditure targets; timing and ability to produce studies and analyses; capital and
operating expenditures; economic conditions; availability of sufficient financing; the ultimate ability to mine, process, and sell mineral products on economically favorable terms; and any and all other timing, exploration, development,
operational, financial, budgetary, economic, legal, social, geopolitical, regulatory and political factors that may influence future events or conditions. While we consider these factors and assumptions to be reasonable based on
information currently available to us, they may prove to be incorrect.
You should not place undue reliance on forward looking information and statements. Forward looking information and statements are only predictions based on our current expectations and our projections about future events. Actual
results may vary from such forward looking information for a variety of reasons including, but not limited to, risks and uncertainties disclosed in Alacer’s Annual Information Form and SSR Annual Information Form and other public
filings, as well as other unforeseen events or circumstances.
Other than as required by law, Alacer and SSR Mining do not intend, and undertake no obligation to update any forward looking information to reflect, among other things, new information or future events. For additional information
you should refer to Alacer’s public filings available at www.alacergold.com, on SEDAR at www.sedar.com and www.asx.com.au and SSR Mining’s public filings available at www.ssrmining.com, on SEDAR at www.sedar.com and on
EDGAR at www.sec.gov.
Scientific and technical information presented in this document has been prepared in accordance with National Instrument 43-101 (“NI43-101”) standards and the 2012 Edition of the Australasian Code for Reporting of Exploration
Results, Mineral Resources and Ore Reserves (“JORC Code”). The scientific and technical information in this document as it relates to Alacer has been reviewed and approved by Loren Ligocki, Alacer’s Manager, Resource Geology,
who is a Qualified Person pursuant to NI 43-101 and a Competent Person as defined in the JORC Code. The scientific and technical information in this document as it relates to SSR Mining has been reviewed and approved by
Samuel Mah, P.Eng., SSR Mining’s Director, Mine Planning, and F. Carl Edmunds, P.Geo., SSR Mining’s Vice President, Exploration, each of whom is a Qualified Person as defined under NI 43-101.
Alacer and SSR Mining confirm that they are not aware of any new information or data that materially affects the scientific and technical information included in this document, and in the case of Mineral Resources and Mineral
Reserves and exploration results, that all material assumptions or technical parameters underpinning such estimates, production targets and forecast financial information continue to apply and have not materially changed from the
original public disclosure. Alacer and SSR Mining also confirm that the form and content in which such scientific and technical information is presented in this document has not materially changed from the original public disclosure.
This presentation includes certain terms or performance measures commonly used in the mining industry that are not defined under International Financial Reporting Standards ("IFRS"), including free cash flow and EBITDA. Non-
IFRS financial measures do not have any standardized meaning prescribed under IFRS and, therefore, they may not be comparable to similar measures reported by other companies. Each of SSR Mining and Alacer believe that, in
addition to conventional measures prepared in accordance with IFRS, certain investors use this information to evaluate business performance. The data presented is intended to provide additional information and should not be
considered in isolation or as a substitute for measures of performance prepared in accordance with IFRS. These non-IFRS measures should be read in conjunction with each company’s consolidated financial statements. For
additional information, readers should refer to non-IFRS financial measures disclosure in each company’s recent filings with the Canadian securities regulatory authorities on SEDAR at http://www.sedar.com as well as the joint
management information circular that will be delivered to shareholders of both companies.
For
per
sona
l use
onl
y

SSR Mining Inc.
www.ssrmining.com
Email: [email protected]
Alacer Gold Corp.
www.alacergold.com
Email: [email protected]
For
per
sona
l use
onl
y