
CRE DMID Journal
25
Carbapenem-resistant Enterobacteriaceae and the Correlation between Carbapenem and Fluoroquinolone Usage and Resistance in the U.S. Military Health System Emil P. Lesho DO, Robert J. Clifford PhD, Uzo Chukwuma MPH, Yoon I. Kwak MS, Mark Maneval PhD, RPh, Charlotte Neumann BSN, MSc, Suji Xie MS, Lindsey E. Nielsen PhD, Michael D. Julius PMP, Patrick McGann PhD, Paige E. Waterman MD PII: S0732-8893(14)00379-4 DOI: doi: 10.1016/j.diagmicrobio.2014.09.017 Reference: DMB 13690 To appear in: Diagnostic Microbiology and Infectious Disease Received date: 1 May 2014 Revised date: 14 September 2014 Accepted date: 19 September 2014 Please cite this article as: Lesho Emil P., Clifford Robert J., Chukwuma Uzo, Kwak Yoon I., Maneval Mark, Neumann Charlotte, Xie Suji, Nielsen Lindsey E., Julius Michael D., McGann Patrick, Waterman Paige E., Carbapenem-resistant Enterobacteriaceae and the Correlation between Carbapenem and Fluoroquinolone Usage and Resistance in the U.S. Military Health System, Diagnostic Microbiology and Infectious Disease (2014), doi: 10.1016/j.diagmicrobio.2014.09.017 This is a PDF file of an unedited manuscript that has been accepted for publication. As a service to our customers we are providing this early version of the manuscript. The manuscript will undergo copyediting, typesetting, and review of the resulting proof before it is published in its final form. Please note that during the production process errors may be discovered which could affect the content, and all legal disclaimers that apply to the journal pertain.
-
Upload
trinhquynh -
Category
Documents
-
view
232 -
download
1
Transcript of CRE DMID Journal

�������� ����� ��
Carbapenem-resistant Enterobacteriaceae and the Correlation betweenCarbapenem and Fluoroquinolone Usage and Resistance in the U.S. MilitaryHealth System
Emil P. Lesho DO, Robert J. Clifford PhD, Uzo Chukwuma MPH, Yoon I.Kwak MS, Mark Maneval PhD, RPh, Charlotte Neumann BSN, MSc, SujiXie MS, Lindsey E. Nielsen PhD, Michael D. Julius PMP, Patrick McGannPhD, Paige E. Waterman MD
PII: S0732-8893(14)00379-4DOI: doi: 10.1016/j.diagmicrobio.2014.09.017Reference: DMB 13690
To appear in: Diagnostic Microbiology and Infectious Disease
Received date: 1 May 2014Revised date: 14 September 2014Accepted date: 19 September 2014
Please cite this article as: Lesho Emil P., Clifford Robert J., Chukwuma Uzo, KwakYoon I., Maneval Mark, Neumann Charlotte, Xie Suji, Nielsen Lindsey E., Julius MichaelD., McGann Patrick, Waterman Paige E., Carbapenem-resistant Enterobacteriaceae andthe Correlation between Carbapenem and Fluoroquinolone Usage and Resistance in theU.S. Military Health System, Diagnostic Microbiology and Infectious Disease (2014), doi:10.1016/j.diagmicrobio.2014.09.017
This is a PDF file of an unedited manuscript that has been accepted for publication.As a service to our customers we are providing this early version of the manuscript.The manuscript will undergo copyediting, typesetting, and review of the resulting proofbefore it is published in its final form. Please note that during the production processerrors may be discovered which could affect the content, and all legal disclaimers thatapply to the journal pertain.

ACC
EPTE
D M
ANU
SCR
IPT
ACCEPTED MANUSCRIPT1
Carbapenem-resistant Enterobacteriaceae and the Correlation between Carbapenem and
Fluoroquinolone Usage and Resistance in the U.S. Military Health System
Emil P. Lesho, DO1*; Robert J. Clifford, PhD
1*; Uzo Chukwuma, MPH
2*; Yoon I. Kwak, MS
1;
Mark Maneval, PhD, RPh3; Charlotte Neumann, BSN, MSc
2; Suji Xie, MS
3; Lindsey E.
Nielsen, PhD1; Michael D. Julius, PMP
1; Patrick McGann, PhD
1 ; Paige E Waterman, MD
1
*Equal contributors
1 Multidrug-resistant organism Repository & Surveillance Network, Walter Reed Army Institute
of Research, Silver Spring, MD
2 EpiData Center Department, Navy and Marine Corps Public Health Center, Portsmouth VA
3 US Army Pharmacovigilance Center, Falls Church, VA
Corresponding Author:
Emil Lesho
503 Robert Grant Avenue, Silver Spring, MD 20910
Phone (301) 319-9302
Fax (301) 319-9801
DISCLAIMER: The views expressed herein are solely those of the authors and not to be
construed as official or representing those of the U.S. Army or the Department of Defense.
Running Title: Carbapenem Use and Resistance in the U.S. Military Health System
Abstract Word Count: 150
Text Word Count: 2810

ACC
EPTE
D M
ANU
SCR
IPT
ACCEPTED MANUSCRIPT2
Abstract:
Whether carbapenem or fluoroquinolone usage is correlated with carbapenem resistant
Enterobacteriaceae has not been investigated at the level of an entire U.S. nationwide managed
healthcare system. We analyzed 75 million person-years of surveillance and 1,969,315 cultures
from all 266 hospitals in the geographically dispersed U.S. Military Health System. Incidences of
CRE remained under 1 case per 100,000 person-years. Incidences of CRE increased relative to
2005 baseline levels in 3 of 7 subsequent years, then decreased in 2012 (P < 0.05). Incident
proportions of carbapenem resistance differed significantly among years, geographical regions,
and bacterial species. Although use and resistance strongly correlated (R >0.80) for several
‘drug-bug’ combinations, none were significant at the national or facility level. One exception
was that inpatient consumption of fluoroquinolones was significantly correlated (P = .0007) with
carbapenem resistance in E. coli when data from the major referral centers of the Southern and
Northern regions were combined.
Key words: antibiotic use, antibiotic consumption, healthcare network, carbapenem resistance

ACC
EPTE
D M
ANU
SCR
IPT
ACCEPTED MANUSCRIPT3
1.0 Introduction
Enterobacteriaceae are leading causes of community and hospital acquired infections [1, 2].
Antibiotic resistance can rapidly develop and spread in these bacteria through mobile genetic
elements readily shared among unrelated species [1, 2].
Carbapenem-resistant Enterobacteriaceae (CRE) have become an especially worrisome global
public health crisis [1-5]. Infections caused by these bacteria can be associated with a mortality
rate as high as 80% [2, 6, 7]. Carbapenem resistance (CR) often arises through mechanisms that
involve acquisition of multiple drug resistance genes resulting in extremely-drug resistant or
pan-drug resistant infections with few or no treatment options [1, 8].
Carbapenem-resistance is increasing world-wide [1, 2, 5], but the burden of such resistance in
one large and diverse U.S. population, healthcare beneficiaries of the Department of Defense
(DoD), has not been reported. Furthermore, there is conflicting evidence on whether increased
antibiotic consumption, in particular of carbapenems and fluoroquinolones, is correlated with
this increased resistance [9-15]. Of note, correlation between antibiotic consumption and
resistance in Enterobacteriaceae throughout an entire healthcare system in the United States has
not been reported [16].
Previous antibiotic exposure, especially to fluoroquinolones, was correlated with future isolation
of CRE in individual patients in case-control studies [2, 17, 18]. Other studies have not found
that association [12].
Our objectives were to determine the level of CRE in a geographically dispersed national
managed care system, the health system of the DoD, and to determine if total carbapenem or
fluoroquinolone consumption throughout the system was correlated with CR. We also provide
proportions and rates, because the use of only one may not reflect the true burden of resistance or

ACC
EPTE
D M
ANU
SCR
IPT
ACCEPTED MANUSCRIPT4
loss of treatment options, and also because a report format most useful for the clinician treating
empirically (proportions) may not be as useful to the public health professional (rates) [19-23].
2.0 Methods
This study was undertaken as a quality improvement initiative authorized by policy memoranda
09-050, 11-035, 13-016 and IRB protocol number #1812.
2.1 Population & Data Collection
The DoD has a managed care system composed of 266 fixed location medical facilities throughout the
United States and overseas. It is divided into four geographic regions: North, South, West, and Pacific.
The surveillance population, all DoD beneficiaries who were eligible to receive care from January
2005 through December 2012, included patients of all ages and races. There were approximately 9.7
million beneficiaries in 2012 and an average of 9.5 million yearly and the demographic details have
been published previously [24]. The DoD uses electronic health records (EHR) for all clinical
encounters. Methods used for extracting and aggregating microbiology data from EHR have been
previously published [24], as have methods for isolate collection and characterization [25-26].
Briefly, from all positive cultures, only unique/deduplicated isolates, defined as the first
Enterobacteriaceae (E. coli, Enterobacter spp. or Klebsiella spp.) isolate per patient per calendar
year, were culled. From these, those non-susceptible to imipenem, meropenem, and/or doripenem,
based on the prevailing Food and Drug Administration (FDA) and the 2010 Clinical Laboratory
Standards Institute (CLSI) ( M100-S20-U) susceptibility breakpoint defined by a minimum
inhibitory concentration of >/=4 ug/ml, were extracted to calculate incident rates and proportions
of CRE. This breakpoint was used for all the years, because the newest CLSI breakpoints released
in 2012 (M100-S22) could not be universally adopted (across all years and all facilities) for this
study. Workload-tracking and billing location codes were used to determine if the culture
originated from an inpatient or outpatient care area. Correlation tests were performed several

ACC
EPTE
D M
ANU
SCR
IPT
ACCEPTED MANUSCRIPT5
ways: one set of tests used aggregate data from the entire DoD (system level); the second series
of tests used data from U.S. domestic facilities, stratified by geographic region (regional level);
the third set of analyses focused on data from the two busiest and largest referral centers in the
DoD, presumably where the most carbapenems and fluoroquinolones are prescribed and the
resistance occurs (facility level). For system level data, we examined correlations between
antibiotic usage and a) incidence rates, b) incident proportions, and c) absolute numbers of
resistant isolates. These tests were performed for CREs as a whole, as well as for E. coli,
Klebsiella spp. and Enterobacter spp. separately. At the regional and facility levels we measured
correlations between antibiotic usage and incident proportions and between usage and absolute
numbers of CR isolates.
For antibiotic consumption at the major referral facilities, the unit of measure was physician
orders or prescriptions written for each antibiotic. For regional level usage, and usage across the
entire system, doses given and/or for outpatient usage, purchases invoiced were used. In terms of
a defined daily dose (DDD), this unit would approximately equate to a fraction of the defined
daily dose (DDD) depending on the average recommended daily dose based on normal renal
function. For example, for a patient with normal creatinine clearance who received the antibiotic
for a full 24 hr. period, one unit would equate to 1/3 the usual meropenem, DDD, or ¼ the usual
imipenem DDD. Meropenem is usually dosed every eight hours, and imipenem every six.
2.2 Statistics
Statistical tests were performed using the R version 2.14 software package (http://cran.us.r-
project.org/). For ANOVA analysis of U.S. regional data, we used the aov and TukeyHSD
functions. For data collected across the entire military healthcare system (US and overseas
facilities) pairwise comparisons of rates and proportions were performed using Fisher’s exact
test, trends were analyzed using the Chi squared proportion trend test, and usage-resistance

ACC
EPTE
D M
ANU
SCR
IPT
ACCEPTED MANUSCRIPT6
relationships were analyzed using the Pearson correlation test. P values were adjusted for
multiple testing using the Bonferroni correction.
3.0 Results
3.1 Overall Burden of Carbapenem Resistance
During 2005-2012, there were 75,529,012 person-years of surveillance and 1,969,315 bacterial
organisms identified from 1,823,030 clinical cultures. Those organisms included 667,004
Enterobacteriaceae, of which 368 were classified as CRE for an overall incident proportion of
0.487% (95% CI: 0.439-0.540) (Table 1). 77% (284) were isolated in outpatient care areas, and
23% (84) were isolated from inpatient care areas. The mean annual incident rate of CRE for this
period was 0.49 per 100,000 patient years (Table 1).
3.2 Proportions
The proportion of all Enterobacteriaceae that were carbapenem resistant rose from 0.033% in
2005 to 0.052% in 2012 (P = 0.053) (Figure 1). Combining all species and using 2005 as the
reference year, incidence proportions of CRE increased significantly in 3 of 7 subsequent
surveillance years, with the most significant increase occurring in 2010 (P < 0.0001) (Figure 1).
Considering species separately, CR in E. coli also showed a statistically significant increase in 3
of 7 surveillance years compared to the baseline in 2005. CR in Klebsiella spp. (K. pneumoniae
and K. oxytoca) reached a maximum in 2010 (P = 0.035). CR in Enterobacter spp. (E. cloacae
and E. aerogenes) fluctuated the most and showed no significant trend (Figure 1). The lowest
proportion of incident resistance (0.020%) was seen in E. coli in 2005 and the highest (0.243%)
was seen in Enterobacter spp. during 2012. The decrease in the proportion of all CRE from the
peak year of 2010 to 2012 was significant (P = 0.048). Among Enterobacteriaceae, Klebsiella
spp. showed the fastest increase in the proportion resistant to carbapenems, as measured by linear
regression (Online Supplemental Figure 1).
ACC
EPTE
D M
ANU
SCR
IPT
ACCEPTED MANUSCRIPT7
3.3 Rates
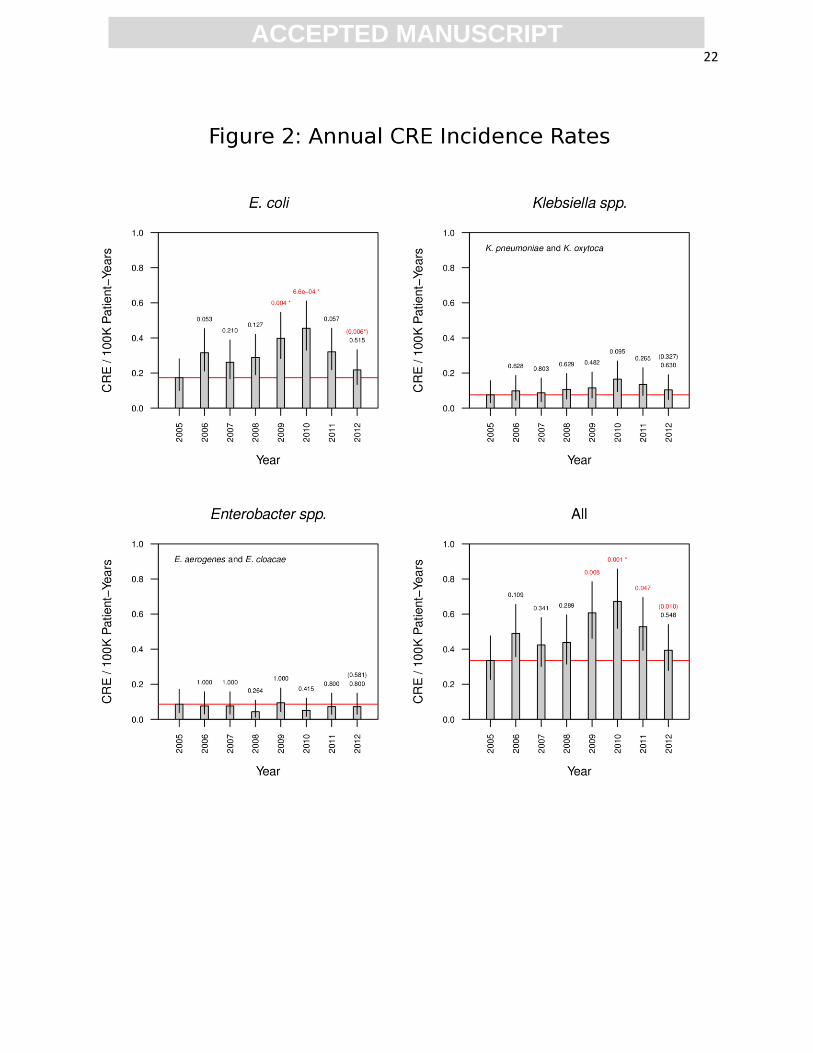
Incidence rates of all CRE combined varied from a low of 0.335 per 100,000 person years in
2005 to a high of 0.672 in 2010 (P = 0.001) (Table 1). Relative to 2005, the reference year, rates
of CR in E. coli were significantly higher in 2009 and 2010 (Figure 2). The lowest rate (0.043)
was seen in Enterobacter spp. in 2008, and the highest rate was seen in E coli (0.455) in 2010. E.
coli had the fastest increase in CR rate from 2005-2012 (Online Supplemental Figure 2).
3.4 Factors affecting the likelihood of CR
To see which variables were associated with the probability that an organism was carbapenem
resistant we performed ANOVA on the regional data set. The analysis was performed two ways:
a) the correlation of year, region and organism to incident proportion were examined
individually; b) all variables were examined together, sequentially controlling for organism, then
region, then year. Region and organism were highly significant factors (P <0.0001). The year of
isolation showed a lesser, though statistically significant association, after controlling for region
and organisms (data not shown).
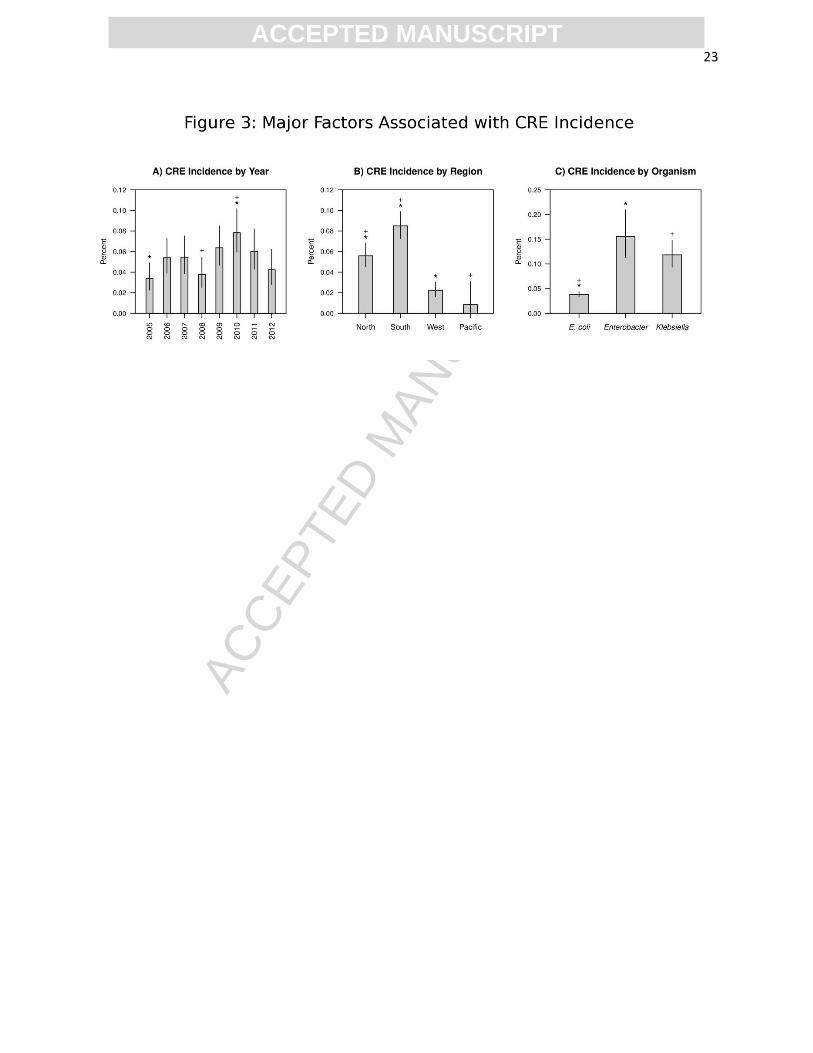
Tukey’s HSD test was used to discover which specific pairs of regions, organisms and years had
significantly different incidence proportions. Examination of CR incident proportion by species
revealed significant differences between E. coli and Enterobacter spp. (P < 0.001) and E. coli and
Klebsiella spp. (P < 0.001) but not between Enterobacter and Klebsiella (P = 0.06) (Figure 3
and other data not shown). When we analyzed the relationship between geographical region and
CR, we found carbapenem resistance proportions differed significantly between every pair of
regions except between West and Pacific (Figure 3). The South had the highest incidence of
resistance; the West and Pacific had the lowest. Examining carbapenem resistance incidence
proportions by year showed that overall CR incidence in 2010 was significantly higher than in

ACC
EPTE
D M
ANU
SCR
IPT
ACCEPTED MANUSCRIPT8
2005 and 2008. No other difference in annual incident proportions was statistically significant
(Figure 3).
We next asked whether differences in regional incident proportions remained significant after
controlling for species differences. CR incidence in Klebsiella varied the least between
geographical regions, and E. coli differed the most (data not shown). A similar analysis
demonstrated statistically significantly yearly variation in E. coli carbapenem resistance
incidence (data not shown).
3.5 Antibiotic consumption:
The earliest year for which system level (enterprise wide) antibiotic usage data were available is
2008 (Supplemental Table 1A-B). Carbapenem consumption ranged from a low of 8,023 units in
2009 to a high of 12,965 units in 2011. Between 2008 and 2012 carbapenem consumption
increased by 32%. Fluoroquinolone consumption ranged from a low of 158,145 units in 2011 to
a high of 245,765 units in 2012. From 2008 to 2012 fluoroquinolone consumption within the
DOD increased by 17%. For the major referral centers in the North and South regions we further
stratified carbapenem and fluoroquinolone usage into inpatient and outpatient doses
(Supplemental Figure 3). Peak consumption in these two facilities occurred slightly before peak
consumption throughout the entire enterprise, with peak carbapenem and fluoroquinolone
consumption occurring between 2010 and 2011. (Supplemental Figure 3 and Supplemental
Tables 1A -B and Supplemental Table 2).
3.6 Correlation between usage and resistance
At the enterprise level, there was no significant correlation between carbapenem usage and the
proportions or rates of resistance for any organism (E. coli, Klebsiella spp., Enterobacter spp.)
(Supplemental Table1C). Likewise, carbapenem consumption was not correlated with
proportions or rates of CRE among all Enterobacteriaceae combined. Similarly,

ACC
EPTE
D M
ANU
SCR
IPT
ACCEPTED MANUSCRIPT9
fluoroquinolone consumption was not correlated with carbapenem resistance in individual
species groups or in all CRE combined (Supplemental Table 1C). At the major referral center of
the South region, use was strongly correlated (R > 0.85) with resistance for certain ‘drug-bug’
combinations. For example, inpatient use of carbapenems correlated with resistance in all
Enterobacteriaceae combined (R = 0.94; P = 0.05), and inpatient use of fluoroquinolones
correlated with carbapenem resistance in E. coli (R = 0.91; P = 0.08) However, no correlation
maintained statistical significance after multiple test correction (Supplemental Table 2).
Antibiotic consumption and incidence proportions of CRE were not strongly correlated at the
major North regional referral center When data from both referral centers were combined,
however, inpatient use of fluoroquinolone was significantly correlated with carbapenem
resistance and remained so after multiple test correction (R = 0.85; P = 0.007) (Supplemental
Table 2).
4.0 Discussion
With nearly 2 million clinical cultures and 75 million person-years of surveillance, our report is
one of the largest to date (Table 2). Proportions and rates of all CRE combined peaked in 2010,
with the increase in overall resistance being driven by increases in resistant E. coli. Carbapenem
and fluoroquinolone usage were correlated with resistance in certain stratified analyses, but the
only statistically significant association was a positive correlation between inpatient
fluoroquinolone use and carbapenem resistance in E. coli isolated at the North and South
regional referral centers. Except for the Meropenem Yearly Susceptibility Test Information
Program (MYSTIC) report (a study limited to 6-10 U.S. hospitals during 1999-2001 which
collected antibiotic consumption data using surveys rather than information drawn from
centralized databases) [9], and a small single center facility [27], we found no other U.S. studies
that observed a correlation between carbapenem resistance with fluoroquinolone or carbapenem

ACC
EPTE
D M
ANU
SCR
IPT
ACCEPTED MANUSCRIPT10
consumption. No other U.S. reports examined consumption-resistance relationships in
Enterobacteriaceae in a nationwide managed care network [16]. The smaller studies that
evaluated the relationship between antimicrobial use and resistance reported varying results [9-
13,15, 27]. Dissimilar results can be explained by different populations, time lag, length of
surveillance, and the definitions of usage [9]. Although DDD is the most widely used measure of
consumption, it represents an assumed average dose per day for primary adult drug indication
and has several limitations [9, 28]. In three Dutch communities, antibiotic usage differed
significantly, but resistance rates in E. coli did not [10]. A study from Taiwan also reported that
increased usage of carbapenems was not associated with an increase in resistance to
carbapenems in Enterobacteriaceae [11]. In addition to being consistent with the above studies,
our data agreed with the MYSTIC report, which showed that proportions of CRE were low
(<1%), and that carbapenem usage was not correlated with resistance to carbapenem [9].
However, data from Europe suggests that total antibiotic consumption is directly correlated with
resistance in carbepenemase producing - K. pneumoniae. For example, Greece has both the
highest usage and percent of carbepenemase producing Klebsiella pneumoniae, while the
Netherlands has the lowest usage rates and percent resistance [14]. Unlike Europe, the U.S. has
no comparable data system for measuring antibiotic consumption and resistance profiles across
states [14, 29].
The lack of a correlation between drug consumption and resistance might be due to the length of
the study period. However, previous studies showed that 5 years of surveillance was adequate,
and a 1 year lag between peak usage and peak resistance was often observed [22].
Proportions and rates in our study were lower than in other U.S. populations and networks [4, 23,
30, 31]. One reason for this observation might be that a lower proportion of our isolates or data
came from long term acute care facilities, known reservoirs of CRE [2, 32, 33]. Although

ACC
EPTE
D M
ANU
SCR
IPT
ACCEPTED MANUSCRIPT11
patients in the military health system are thought to be younger and healthier, the population in
the military is fairly reflective of the age and sex distribution in the general population due to the
presence of retirees and family members who are also eligible for care.[24] Second, the
definition of ‘unique’ isolate in our study is more stringent than the definition used in other
reports [30].
EARSNET reported increasing CRE trends in Greece, Cyprus, Hungary and Italy, but decreasing
trends in Germany and Norway (Table 1) [34]. Previously, the NHSN reported and increasing
trend in CRE among health care associated infections, where 8% of Klebsiella spp. were
carbapenem-resistant in 2007, compared with <1% in 2000 [35]. However, in a later report, the
proportion of carbapenem resistant isolates reported to the NHSN did not change significantly
from 2007-2010 [4]. In a recent report published this August, the rate of CRE detection in a
network of community hospitals in the Southeastern United States increased more than five-fold
from 2008 to 2012 [36].
Our study has several limitations. First, pairwise comparison between yearly data might not be
able to detect short-term variation. Trend analysis is more robust if there are more data points.
However, CRE were uncommon, so the number of cases in most months would be too low for
statistical analysis. Furthermore, the annual data encompasses monthly and seasonal variation.
Therefore, if we detected differences over time in seasonal data, but not annual data, positive
correlations between usage and rate/incidence in some seasons would be cancelled out by
negative correlations between usage and rate/incidence at other times of the year. Second, our
findings may not be generalizable to civilian healthcare systems or other large managed care
networks. However, the DoD population includes patients of all ages and races from primary
care clinics to tertiary teaching and referral centers [24]. Third, it is nearly impossible to get precise
patient-days, patient-years of antibiotic usage, and usage in milligrams for an entire healthcare system,

ACC
EPTE
D M
ANU
SCR
IPT
ACCEPTED MANUSCRIPT12
because even with electronic medical records, manual chart review is required to determine the exact
start and stop times for each antibiotic prescription. However, our goal was not to have a standard for
comparing antibiotic usage across systems or countries. Instead, our goal was to see whether usage
correlated with resistance in a single large, geographically dispersed healthcare system. The increase
in fluoroquinolone consumption between 2011 and 2012 was large and cannot be explained with
certainty. Factors that could have contributed to this increase include increased prescribing of these
agents for preemptive self-treatment of traveler’s diarrhea to Africa and Asia. (During that period
military exercises in those areas increased.) Also during this period bacterial infections not
successfully treated with first line agents were being observed at an increasing frequency. Other
reasons include ease of use (once or twice per day and intravenous to oral conversions) and poor
stewardship of antibiotics. Finally, all DoD hospitals use automated micro-broth susceptibility
analyzers and the results from these instruments are what is entered in the EHR. Therefore the
definitions of resistance are restricted to the 2010 CLSI and the prevailing FDA susceptibility
breakpoints, which are pre-programmed in these analyzers. We could not apply the 2012 CLSI
breakpoints universally in this study. Since updates to susceptibility breakpoints are modified over
time, and at different intervals according to facility and agency, trending the burden of resistance
across years and geographic areas is extremely difficult. A recent study illustrates this difficulty in
that only 5 of 25 hospitals in a surveillance network were able to adopt even the older 2010 CLSI
breakpoints for a surveillance study conducted during a similar period (2008-2012) as this study
[36]. To mitigate this we have developed a computer program that permits users to apply different
sets of susceptibility breakpoints ‘on the fly’ to see how breakpoints from different agencies would
affect their results. This program runs on all computers and is available free of charge. If we
substitute the most recent CLSI 2012 breakpoints for our definition of resistance, the incident
proportions would likely be higher. However, it is not known if that apparent increase reflects an

ACC
EPTE
D M
ANU
SCR
IPT
ACCEPTED MANUSCRIPT13
increase in the true burden as manifested by a reduction in treatment options [20]. A recent study
reported that detection rates of CRE significantly increased when 2010 CLSI breakpoints were
used instead of 2007 CLSI breakpoints (4.1 vs 0.5 per 100, 000 patient days; p<.001). However,
the impact of the newer 2012 breakpoints was not investigated in that study. To estimate the effect
the 2012 breakpoints would have in our study, we analyzed the database in a repository of over
25,000 centrally characterized MDR- ESKAPE pathogens from a growing number of DoD
hospitals, which are representative of the 266 hospitals in this study [37]. All Klebsiella and
Enterobacter spp, along with all E. coli collected during the same time period of this study (2005-
2013) (n=4016) were included in the analysis. Using the 2010 CLSI breakpoints34% (1357) were
classified as carbapemem resistant, whereas 49% (1955) were resistant according to the 2012 CLSI
breakpoints.
In conclusion, numerous factors confound antimicrobial usage-resistance relationships. Our
findings should not be interpreted as a diminishment of the crucial need for antimicrobial
stewardship and thoughtful prescribing. On the contrary, our findings highlight the importance of
using fluoroquinolones judiciously. This study provides a baseline for trending changes in
disease burdens and the interactions between susceptible and resistant bacteria populations,
which is important for quantifying the health economic effects of such programs and efforts [38].
That CRE are still relatively uncommon in this population presents a special opportunity for
early preventive interventions [2, 4]. Surveillance should continue, with the identification of
CRE from a clinical culture prompting an aggressive response to prevent further transmission [2,
4]. Ongoing surveillance and research are needed.
5.0 Acknowledgements
ACC
EPTE
D M
ANU
SCR
IPT
ACCEPTED MANUSCRIPT14
Funding: This work was supported by the US Army Medical Command and the Armed Forces
Health Surveillance Center-Global Emerging Infections Surveillance and Response System, who
had no role in the collection or analysis of data, nor the preparation of the manuscript.
Conflicts: There are no associations that might pose a conflict of interest for any of the authors.
References:
1. Nordmann P, Naas T, Poirel L. Global spread of Carbapenemase-producing
Enterobacteriaceae. Emerg Infect Dis 2011;17:1791-8.
2. Gupta N, Limbago BM, Patel JB, Kallen AJ. Carbapenem-resistant Enterobacteriaceae:
epidemiology and prevention. Clin Infect Dis 2011;53: 60-7.
3. World Health Organization. Antimicrobial resistance: a global threat. Essential Drugs
Monitor Vol. 28, 2000:1.
4. Sievert DM, Ricks P, Edwards JR, et al. Antimicrobial-resistant pathogens associated with
healthcare-associated infections: summary of data reported to the National Healthcare Safety
Network at the Centers for Disease Control and Prevention, 2009-2010. Infect Control Hosp
Epidemiol 2013;34:1-14.
5. Savard P, Perl TM. A call for action: managing the emergence of multidrug-resistant
Enterobacteriaceae in the acute care settings. Curr Opin Infect Dis 2012;25:371-7.
6. Snitkin ES, Zelazny AM, Thomas PJ, et al. Tracking a hospital outbreak of carbapenem-
resistant Klebsiella pneumoniae with whole-genome sequencing. Sci Trans Med 2012;4:148ra16.
7. Tumbarello M, Viale P, Viscoli C, et al. Predictors of mortality in bloodstream infections
caused by Klebsiella pneumoniae carbapenemase-producing K. pneumoniae: importance of
combination therapy. Clin Infect Dis 2012;55:943-50.
8. Magiorakos AP, Suetens C, Monnet DL, Gagliotti C, Heuer OE. The rise of carbapenem
resistance in Europe: just the tip of the iceberg? Antimicrob Resist Infect Control;2:6.
9. Mutnick AH, Rhomberg PR, Sader HS, Jones RN. Antimicrobial usage and resistance trend
relationships from the MYSTIC Programme in North America (1999-2001). J Antimicrob
Chemother 2004;53:290-6.

ACC
EPTE
D M
ANU
SCR
IPT
ACCEPTED MANUSCRIPT15
10. Bruinsma N, Filius PM, De Smet PA, et al. Antibiotic usage and resistance in different
regions of the Dutch community. Microbial Drug Resist 2002;8:209-14.
11. Ho CM, Ho MW, Liu YC, et al. Correlation between carbapenem consumption and
resistance to carbapenems among Enterobacteriaceae isolates collected from patients with intra-
abdominal infections at five medical centers in Taiwan, 2006-2010. Int J Antimicrob Agents
2012;Suppl:S24-8.
12. Mouloudi E, Protonotariou E, Zagorianou A, et al. Bloodstream infections caused by
metallo-beta-lactamase/Klebsiella pneumoniae carbapenemase-producing K. pneumoniae among
intensive care unit patients in Greece: risk factors for infection and impact of type of resistance
on outcomes. Infect Control Hosp Epidemiol 2010;31:1250-6.
13. Manikal VM, Landman D, Saurina G, Oydna E, Lal H, Quale J. Endemic carbapenem-
resistant Acinetobacter species in Brooklyn, New York: citywide prevalence, interinstitutional
spread, and relation to antibiotic usage. Clin Infect Dis 2000;31:101-6.
14. SWAB. NETHMAP 2011: Consumption of antimicrobial agents and antimicrobial
resistance among medically important bacteria in the Netherlands. National Institute for Public
Health and the Environment; Ministry of Health, Welfare and Sport, 2011:1-100.
15. Lee CM, Lai CC, Wang YY, Lee MC, Hsueh PR. Impact of susceptibility profiles of Gram-
negative bacteria before and after the introduction of ertapenem at a medical center in northern
Taiwan from 2004 to 2010. Diagnost Microbiol Infect Dis 2013;75:94-100.
16. Molton JS, Tambyah PA, Ang BS, Ling ML, Fisher DA. The global spread of healthcare-
associated multidrug-resistant bacteria: a perspective from Asia. Clin Infect Dis 2013;56:1310-8.
17. Hussein K, Sprecher H, Mashiach T, Oren I, Kassis I, Finkelstein R. Carbapenem resistance
among Klebsiella pneumoniae isolates: risk factors, molecular characteristics, and susceptibility
patterns. Infect Cont Hosp Epidemiol 2009;30:666-71.
18. Marchaim D, Chopra T, Bhargava A, et al. Recent exposure to antimicrobials and
carbapenem-resistant Enterobacteriaceae: the role of antimicrobial stewardship. Infect Cont Hosp
Epidemiol 2012;33:817-30.
19. Rempel OR, Laupland KB. Surveillance for antimicrobial resistant organisms: potential
sources and magnitude of bias. Epidemiol Infect 2009;137:1665-73.
20. Schwaber MJ, De-Medina T, Carmeli Y. Epidemiological interpretation of antibiotic
resistance studies - what are we missing? Nat Rev Microbiol 2004;2:979-83.
21. Laxminarayan R, Klugman KP. Communicating trends in resistance using a drug resistance
index. BMJ open 2011; 1(2): e000135.

ACC
EPTE
D M
ANU
SCR
IPT
ACCEPTED MANUSCRIPT16
22. Monnet DL, Lopez-Lozano JM, Campillos P, Burgos A, Yague A, Gonzalo N. Making
sense of antimicrobial use and resistance surveillance data: application of ARIMA and transfer
function models. Clin Infect Dis 2001;Suppl 5:29-36.
23. Sanchez GV, Master RN, Clark RB, et al. Klebsiella pneumoniae antimicrobial drug
resistance, United States, 1998-2010. Emerg Infect Dis 2013;19:133-6.
24. Landrum ML, Neumann C, Cook C, et al. Epidemiology of Staphylococcus aureus blood
and skin and soft tissue infections in the US military health system, 2005-2010. JAMA
2012;308:50-9.
25. Waterman P, Kwak Y, Clifford R, et al. A multidrug-resistance surveillance network: 1 year
on. Lancet Infect Dis 2012;12:587-8.
26. Milillo M, Kwak YI, Snesrud E, Waterman PE, Lesho E, McGann P. Rapid and
simultaneous detection of blaKPC and blaNDM by use of multiplex real-time PCR. J Clin
Microbiol 2013;51:1247-9.
27. McLaughlin M, Advincula MR, Malczynski M, Qi C, Bolon M, Scheetz MH. Correlations
of antibiotic use and carbapenem resistance in Enterobacteriaceae. Antimicrob Agents
Chemother. 2013;57:5131-3.
28. WHO Collaborating Centre for Drug Statistics Methodology. Guidelines for ATC
classification and DDD assignment 2013. Oslo; 2012.
29. Bartlett JG, Gilbert DN, Spellberg B. Seven ways to preserve the miracle of antibiotics. Clin
Infect Dis 2013;56:1445-50.
30. Braykov NP, Eber MR, Klein EY, Morgan DJ, Laxminarayan R. Trends in resistance to
carbapenems and third-generation cephalosporins among clinical isolates of Klebsiella
pneumoniae in the United States, 1999-2010. Infect Cont Hosp Epidemiol 2013;34:259-68.
31. Rhomberg PR, Jones RN. Summary trends for the Meropenem Yearly Susceptibility Test
Information Collection Program: a 10-year experience in the United States (1999-2008). Diag
Microbiol Infect Dis 2009;65:414-26.
32. Prabaker K, Lin MY, McNally M, et al. Transfer from high-acuity long-term care facilities
is associated with carriage of Klebsiella pneumoniae carbapenemase-producing
Enterobacteriaceae: a multihospital study. Infect Cont Hosp Epidemiol 2012;33:1193-9.
33. Marquez P, Terashita D, Dassey D, Mascola L. Population-based incidence of carbapenem-
resistant Klebsiella pneumoniae along the continuum of care, Los Angeles County. Infect Cont
Hosp Epidemiol 2013;34: 44-50.

ACC
EPTE
D M
ANU
SCR
IPT
ACCEPTED MANUSCRIPT17
34. European Centre for Disease Prevention and Control. Antimicrobial resistance surveillance
in Europe 2011. Annual Report of the European Antimicrobial Resistance Surveillance Network
(EARS-Net). Stockholm: ECDC; 2012.
35. Centers for Disease Control and Prevention. Guidance for control of infections with
carbapenem-resistant or carbapenemase-producing Enterobacteriaceae in acute care facilities.
MMWR 2009;58:256-60.
36.Thaden JT, Lewis SS, Hazen KC, et al. Rising rates of carbapenem-resistant
Enterobacteriaceae in community hospitals: a mixed-methods review of epidemiology and
microbiology practices in a network of community hospitals in the Southeastern United States.
Infect Cont Hosp Epidemiol. 2014;35:978-83.
37. Lesho EP, Waterman PE, Chukwuma U, et al. The Antimicrobial Resistance Monitoring and
Research (ARMoR) Program: the US Department of Defense response to escalating
antimicrobial resistance. Clin Infect Dis. 2014;59:390-7.
38. Ammerlaan HS, Harbarth S, Buiting AG, et al. Secular trends in nosocomial bloodstream
infections: antibiotic-resistant bacteria increase the total burden of infection. Clin Infect Dis
2013;56:798-805.
Figure Legends:
Figure 1: Incidence proportions. Annual incidence proportions of CRE in the military healthcare
system. The 95% confidence interval is indicated by a vertical line at the top of each histogram
bar. The red horizontal line indicates the incidence proportion for 2005. Numbers above each
bar indicate the unadjusted P-value for the change in proportion from 2005. The number in
parentheses above the 2012 incidence bar indicates the unadjusted P-value for the change in
proportion from 2010 to 2012. An asterisk indicates that a P-value is significant after correction
for multiple comparisons (n=6).

ACC
EPTE
D M
ANU
SCR
IPT
ACCEPTED MANUSCRIPT18
Figure 2: Incidence rates. Annual incidence rates of CRE in the military healthcare system.
Figure 3: Major factors associated with CRE incidence. Incidence proportions of total CRE
plotted by year (A), geographical region (B) and year (C). The 95% confidence interval is
indicated by a vertical line at the top of each histogram bar. Pairs of years, regions and
organisms with significantly different (corrected P <= 0.05) have the same symbol above the
histogram bar (e.g. 2005 compared to 2010 and 2008 compared to 2010).

ACC
EPTE
D M
ANU
SCR
IPT
ACCEPTED MANUSCRIPT19
Table 1: Incidence Rates & Proportions of Carbapenem-resistant Enterobacteriaceae in the U.S.
Department of Defense Health System

ACC
EPTE
D M
ANU
SCR
IPT
ACCEPTED MANUSCRIPT20
Table 2. Resistance Trends in the Largest U.S. and European Studies of Carbapenem-resistant Enterobacteriaceae
Scope & Period Denominator1 Numerator(s) Measurement Result Reference
266 U.S Hospitals (inc. Alaska Hawaii, and Germany) 2005; 2008-2012
1,969,315 667,004 Enterobacteriaceae
Proportion and Rate
Increase in Proportion Stable rates
This study
2,039 U.S. Hospitals 2009-2010 vs.2007-2008
81,131 19,642 Enterobacteriaceae
Proportion Stable Sievert et al. 2013
14 Hospitals in Europe 1998-2007
36,679 10,241 Enterobacteriaceae
Rate Increase Ammerlaan et al. 2013
12 U.S. medical centers 1998-2008
27,289 13,001 Enterobacteriaceae
Rate Stable Rhomberg et al. 2009
287 clinical laboratories in the US 1999-2010
500,000 K. pneumonia isolates
5,558 Carbapenem resistant K. pneumoniae
Proportion Increase Braykov et al. 2013
200 US Hospitals 1998-2010
187,359 Klebsiella spp.
8,056 Carbapenem resistant K. pneumoniae
Proportion Increase Sanchez et al. 2013
28 Countries in Europe 2008-2011
14,549 K pneumoniae 59,326 E. coli
1,323 Carbapenem resistant K. pneumoniae 24 Carbapenem Resistant E. coli
Proportion Increase for K. pneumoniae in 3 countries Increase for E. coli in 13 countries
EARSNET 2011
69 Laboratories in LA, CA 2010-2011
814 case reports of suspected carbapenem resistant K. pneumoniae infections
675 confirmed cases of carbapenem resistant K. pneumoniae infections
Rate Emerging and high in long term acute care settings
Marquez et al. 2013
83 Medical centers in USA, Europe and Latin America 2007-2009
15,948 E. coli and Klebsiella spp
Carbapenem resistant and Carbapenemase producing E. coli and Klebsiella spp
Rate Increase Castanheira et al. 2011
1 Total number of isolates examined for the study

ACC
EPTE
D M
ANU
SCR
IPT
ACCEPTED MANUSCRIPT21
ACC
EPTE
D M
ANU
SCR
IPT
ACCEPTED MANUSCRIPT22
ACC
EPTE
D M
ANU
SCR
IPT
ACCEPTED MANUSCRIPT23

ACC
EPTE
D M
ANU
SCR
IPT
ACCEPTED MANUSCRIPT24
Highlights
In the healthcare system, carbapenem and quinolone use increased.
Incidences of carbapenem resistant Enterobacteriaceae increased, then decreased.
Inpatient consumption of fluoroquinolones correlated with carbapenem resistance.
Incidences of resistance and drug consumption may be too low for correlation.
This is the largest such use/resistance correlation study in the U.S. to date.