
CRC Report No. CM-136-15-1 - crcao.org CM-136... · CRC’s work is limited to research ......
53
COORDINATING RESEARCH COUNCIL, INC. 5755 NORTH POINT PARKWAY ● SUITE 265 ● ALPHARETTA, GA 30022 CRC Report No. CM-136-15-1 INVESTIGATION INTO FILTER PLUGGING DUE TO SULFATE SALT CONTAMINATION OF ETHANOL, GASOLINE, AND GASOLINE-ETHANOL BLENDS January 2018
Transcript of CRC Report No. CM-136-15-1 - crcao.org CM-136... · CRC’s work is limited to research ......
COORDINATING RESEARCH COUNCIL, INC. 5755 NORTH POINT PARKWAY ● SUITE 265 ● ALPHARETTA, GA 30022
CRC Report No. CM-136-15-1
INVESTIGATION INTO FILTER PLUGGING DUE TO
SULFATE SALT CONTAMINATION OF ETHANOL, GASOLINE, AND
GASOLINE-ETHANOL BLENDS
January 2018

The Coordinating Research Council, Inc. (CRC) is a non-
profit corporation supported by the petroleum and
automotive equipment industries. CRC operates through the
committees made up of technical experts from industry and
government who voluntarily participate. The four main areas
of research within CRC are: air pollution (atmospheric and
engineering studies); aviation fuels, lubricants, and
equipment performance; heavy-duty vehicle fuels,
lubricants, and equipment performance (e.g., diesel trucks);
and light-duty vehicle fuels, lubricants, and equipment
performance (e.g., passenger cars). CRC’s function is to
provide the mechanism for joint research conducted by the
two industries that will help in determining the optimum
combination of petroleum products and automotive
equipment. CRC’s work is limited to research that is
mutually beneficial to the two industries involved. The final
results of the research conducted by, or under the auspices
of, CRC are available to the public.
CRC makes no warranty expressed or implied on the
application of information contained in this report. In
formulating and approving reports, the appropriate
committee of the Coordinating Research Council, Inc. has
not investigated or considered patents which may apply to the
subject matter. Prospective users of the report are
responsible for protecting themselves against liability for
infringement of patents.
FINAL REPORT
Investigation into Filter Plugging Due to Sulfate Salt
Contamination of Ethanol, Gasoline, and Gasoline-Ethanol Blends
CRC Project CM-136-15-1
Prepared by:
S. Kent Hoekman and Amber Broch
with assistance from:
Rod Simar and Quaid Ricks
Desert Research Institute
Reno, NV 89512
January 17, 2018

i
Table of Contents 1. Executive Summary .................................................................................................................. 1
2. Introduction and Background ................................................................................................... 4
2.1. Earlier sulfate problems .................................................................................................... 4
2.2. Project objectives .............................................................................................................. 5
3. Literature Research and Reviews.............................................................................................. 5
3.1. Documented field problems .............................................................................................. 6
3.2. Potential sources of sulfates in fuels ................................................................................. 8
3.3. Other studies of sulfates in ethanol-blended fuels .......................................................... 12
4. Laboratory Experimental Program ......................................................................................... 13
4.1. Materials .......................................................................................................................... 13
4.2. Laboratory equipment and procedures ............................................................................ 14
4.2.1. Water measurements by Karl Fischer titration ........................................................ 14
4.2.2. Sulfate measurements by ion Chromatography (IC) ............................................... 16
4.2.3. Filtration process ..................................................................................................... 16
4.2.4. Particle counts in fuel samples ................................................................................ 19
4.3. Experiments using sulfate salts in ethanol ...................................................................... 19
4.3.1. Sulfate solubility in ethanol ..................................................................................... 20
4.3.2. Particle counts in ethanol ......................................................................................... 22
4.4. Experiments using sulfate salts in gasoline ..................................................................... 26
4.4.1. Solubility in gasoline ............................................................................................... 26
4.4.2. Particle count results in gasoline ............................................................................. 28
4.5. Sodium sulfate behavior in gasoline-ethanol blends ....................................................... 31
4.5.1. Preparation of sulfate-spiked ethanol solutions ....................................................... 32
4.5.2. Explanations for high sodium sulfate solubility in spiked ethanol solutions .......... 34
4.5.3. Preparation of gasoline-ethanol blends .................................................................... 35
4.5.4. Particle counts in gasoline-ethanol blends ............................................................... 36
5. Summary and Conclusions ..................................................................................................... 37
6. Recommendations ................................................................................................................... 39
7. References ............................................................................................................................... 39
Appendix I: Sulfate Solubility in Ethanol and Gasoline
Appendix II: Particle Counts of Sulfate Salt Solutions in Ethanol, Gasoline, and Gasoline-Ethanol
Blends

ii
List of Figures
Figure 1. Corn ethanol production in the U.S................................................................................... 4
Figure 2. Sulfate concentrations measured in fuel ethanol during 2004-2005. ................................ 7
Figure 3. Forms of organic sulfur present in corn kernels................................................................ 9
Figure 4. Schematics of dry (left) and wet (right) mill processes for ethanol production .............. 10
Figure 5. Schematic of process water system in a corn ethanol biorefinery. ................................. 11
Figure 6. Solubility of Na2SO4 in E10, E25, and E85 fuels with various water contents. ............. 13
Figure 7. Metrohm Model 831 Karl Fischer Coulometer in DRI laboratory ................................. 15
Figure 8. Karl-Fischer water measurements from repeated analyses of 200-proof ethanol reagent
over a 6-month period. ................................................................................................................... 15
Figure 9. Fuel filtration apparatus installed in laboratory hood ..................................................... 17
Figure 10. Sodium sulfate particles in Erlenmeyer flask................................................................ 17
Figure 11. Collection of undissolved sodium sulfate on filter. ...................................................... 18
Figure 12. Photo of Seta Analytics SA1000 automatic particle counter (APC). ............................ 19
Figure 13. Existent and potential sulfate measurements by IC for 5 sulfate salts in pure ethanol. 21
Figure 14. Solubility of sodium sulfate in gasoline-ethanol blends. .............................................. 21
Figure 15. APC particle counts in baseline ethanol – with and without 2.0 wt.% water ............... 23
Figure 16. APC particle counts in ethanol containing anhydrous salts – avg. of three
measurements. ................................................................................................................................ 24
Figure 17. Photo of collected filtrates from experiments in which sulfate salts were added to
ethanol. ........................................................................................................................................... 24
Figure 18. Effect of temp. and water content on APC particle counts of salt solutions in ethanol 25
Figure 19. Effect of aromatics and detergent additives on existent and potential sulfate
measurements by IC for sodium sulfate and sodium bisulfite in gasoline. .................................... 27
Figure 20. APC particle counts in baseline gasolines (no added salts) before and after filtering
through 0.4 µm Nuclepore filters. .................................................................................................. 29
Figure 21. APC particle counts in gasolines with sodium sulfate - before and after filtering
through 0.4 µm Nuclepore filters. .................................................................................................. 30
Figure 22. APC particle counts in gasolines with sodium bisulfite - before and after filtering
through 0.4 µm Nuclepore filters. .................................................................................................. 31
Figure 23. Ethanol spiked with aqueous stock solution containing 10,000 ppm of Na2SO4. ........ 33
Figure 24. APC particle counts of ethanol spiked with aqueous solutions of Na2SO4. .................. 33
Figure 25. APC particle counts (>4 µm) in gasoline-ethanol blends spiked with Na2SO4. ........... 37

iii
List of Tables
Table 1. Gasoline matrix used in laboratory experiments with sulfate salts .................................. 14
Table 2. Sulfate solubility/filtration experiments conducted in 200-proof ethanol ........................ 20
Table 3. Sulfate solubility/filtration experiments conducted in gasoline ....................................... 26
Table 4. Planned experimental Matrix of Sodium Sulfate Dosed into Gasoline-Ethanol Blends .. 32
Table 5. Sodium Sulfate-Spiked Ethanol Solutions ....................................................................... 34
Table 6. Experimental Matrix of Sodium Sulfate Dosed into Gasoline-Ethanol Blends ............... 36
1
1. Executive Summary
During the early- to mid-2000’s, several reported instances of fuel injector deposit formation and
filter plugging occurred with gasoline-ethanol fuel blends. Investigation of these problems revealed
the presence of fuel-insoluble, inorganic sulfate salts, with sodium sulfate being most frequently
identified. Although a clear understanding of sulfate sources was lacking, there was strong evidence
that most of the sulfate contaminant originated in the ethanol component of the fuel blends. Based
upon information available at the time, ASTM established a maximum limit of 4 ppm (by weight) of
inorganic sulfate as part of the Standard Specifications for Denatured Fuel Ethanol (ASTM D4806).
Following incorporation of this sulfate specification into ASTM D4806, field problems related to
sulfate deposits disappeared.
These earlier field problems occurred primarily with gasoline blends containing 10 vol.% ethanol
(E10). Current interest in using higher ethanol blend gasolines (e.g. E15-E30) has generated concerns
that the earlier field problems with sulfate deposits could recur. Thus, this project was undertaken to
gain a better understanding of sulfate contaminant issues in gasoline-ethanol fuel blends. A
combination of literature review and experimental work was conducted to investigate possible
sources of sulfate contaminants, solubilities of sulfates in ethanol and gasoline, and fuel factors that
may contribute to formation of insoluble sulfate deposits.
A review of ethanol plant operations was conducted to identify possible sources of sulfate in the
final, denatured ethanol product. Based upon literature information and personal conversations with
plant operators, use of bisulfite within the plant’s fermentation scrubber was identified as one
possible source. Non-optimized operation of the scrubber system can result in the presence of
solubilized, reduced forms of inorganic sulfur (SO2, bisulfite, and sulfite), which can distill with the
ethanol. Other sources of volatile sulfur oxides within ethanol plants may also be involved. For
instance, sulfurous acid (H2SO3 - which is chemically equivalent to SO2 in water) is used in the
steeping process in wet mill plants. Subsequently, such “potential sulfate” species can undergo
oxidation to produce insoluble sulfate salts in fuel blends. The presence of such reduced sulfur
species is not detected by the existent sulfate methods as usually employed to comply with the 4 ppm
maximum standard in ASTM D4806.
A series of laboratory experiments was conducted to address three principal questions: (1) What is
the solubility of selected sulfate salts in anhydrous, 200-proof ethanol containing varying amounts of
water? (2) What is the solubility of selected sulfate salts in low- and high-aromatics gasolines
containing various detergent additives? (3) What can be learned about the solubility and filter
plugging potential of sulfate salts when added in low concentrations to gasoline-ethanol blends?
To determine the solubility of sulfate salts in ethanol and gasoline, solid anhydrous salts were
vigorously stirred in the appropriate solution before filtering to remove the undissolved salt. The
filtrates were analyzed by ion chromatography (IC) to measure the concentration of solubilized
sulfate. Solubility/filtration experiments in 200 proof ethanol were conducted with four anhydrous
sulfate salts (ammonium, calcium, potassium, and sodium), along with sodium bisulfite. In
agreement with literature reports, the solubilities of calcium, potassium, and sodium sulfates were
shown to be extremely low (<1 ppm), and unaffected by inclusion of 2 wt.% water in the ethanol.

2
The effect of temperature (5° vs. 25°C) on the solubility of sodium sulfate in ethanol was found to be
negligible. The solubility of ammonium sulfate appeared to be an order of magnitude higher (~10
ppm), although high experimental variability creates some uncertainty about this conclusion.
The solubility of sodium bisulfite in ethanol was much higher than that of the sulfate salts, being at
least 100 ppm at 25 °C. The solubility was slightly lower at 5 °C and slightly higher with addition of
2 wt.% water to the ethanol. As expected, much larger differences between existent and potential
sulfate concentrations were observed in the sodium bisulfite solutions than in any of the sulfate salt
solutions. Upon extended storage at room temperature (1-3 months), filtrate solutions from the
sodium bisulfite experiments became noticeably cloudy, whereas filtrates from all sulfate salt
experiments remained bright and clear. This cloudiness is thought to be due to the gradual oxidation
of soluble bisulfite, to produce insoluble sulfate.
Particle number counts in discrete size ranges were measured in all ethanol/salt solutions using a Seta
Analytics SA1000 automatic particle counter (APC). Although precise quantification of particle
counts was difficult due to high experimental variability, useful semi-quantitative results were
obtained. Before filtration, the ethanol solutions containing each of the five salts examined had
particle counts in excess of 104/mL, although they all appeared clear and bright to the human eye.
Filtration reduced the number of particles by at least an order of magnitude. No substantial
differences were seen among the five salts used, and no significant effects of temperature or water
addition were found.
Solubility/filtration experiments in gasoline were conducted with two salts: sodium sulfate and
sodium bisulfite. Two different non-oxygenated base gasolines were used: one having low aromatics
content (1 vol.%); the other having high aromatics content (40 vol.%). Besides the base gasolines,
samples were prepared containing two different detergent additives: one being a polyether amine
(PEA); the other being a polyisobutyl amine (PIBA). Two additive dosage levels were used: one
corresponding to fuel requirements of “lowest allowable concentration” (LAC); the other
corresponding to the minimum requirements for TOP TIER™ Detergent Gasoline. Results showed
the solubility of both sodium sulfate and sodium bisulfite in gasoline to be extremely low (< 1 ppm),
with no large effects seen for aromatics level, additive type, or additive dosage.
An important observation is that the solubility of sodium bisulfite is at least 2-orders of magnitude
higher in ethanol than in gasoline. This raises the possibility that blending of ethanol contaminated
with solubilized sodium bisulfite into gasoline could result in de-solubilization of the salt, and
formation of deposits in the gasoline-ethanol blend. This situation could be mitigated by limiting
potential sulfate concentrations in ethanol, not just existent sulfate.
A series of experiments was planned in which ethanol containing low levels of sodium sulfate was
used to produce E10, E15, and E30 fuels with various gasoline blendstocks. However, when
preparing the sulfate-dosed ethanol by spiking with small amounts of a concentrated aqueous sulfate
stock solution, the observed solubility of sodium sulfate was much higher than expected based upon
previous solubility experiments using the anhydrous salt. It is hypothesized that this behavior
resulted from conversion of anhydrous sodium sulfate to the hydrated form, sodium sulfate
decahydrate, upon dissolution in water. The solubility of the decahydrate in both ethanol and
3
gasoline was shown to be considerably higher (by at least an order of magnitude) than that of the
anhydrous form.
The large differences in solubility between hydrous and anhydrous forms of sulfate salts, and the
possibility of converting from one form to another, make determination of solubility under real-world
conditions quite difficult, and may contribute to the seemingly inconsistent and sporadic nature of the
sulfate-related field problems originally reported. These complexities may also obscure any smaller
solubility effects due to temperature, ethanol blending ratio, detergent additive, or other fuel factor.
The experimental efforts undertaken in this project to address the topic of sulfates in gasoline-ethanol
fuel blends have proven to be more complex than originally thought. Despite great care taken in
conducting the numerous laboratory experiments of this project, the results are unable to confirm (or
refute) the suitability of the current ASTM sulfate specification for fuel ethanol. For further
examination of this issue, it is recommended that larger-scale experiments be conducted, including
filtration of realistic fuel blends under conditions that better represent real-world situations. A final
recommendation is that monitoring of sulfate concentrations in ethanol for compliance with the
current ASTM D4806 specification should include measurement of both existent and potential
sulfate.

4
2. Introduction and Background
The use of ethanol as a transportation fuel has expanded greatly over the past two decades. Today,
almost all U.S. gasoline contains 10 vol.% ethanol (E10), while small amounts of E15 are also used,
as well as higher concentration ethanol blends such as flex fuel (E85). Nearly all fuel ethanol in the
U.S. is produced by fermentation of corn starch, conducted in approximately 200 corn-ethanol
biorefineries. Collectively, these biorefineries utilize 40-45% of the total U.S. corn crop and produce
about 15 billion gallons/year of ethanol. The corn ethanol production trend over the past 35 years is
shown below in Figure 1.
Figure 1. Corn ethanol production in the U.S.
Ethanol production data from RFA: http://www.ethanolrfa.org/pages/statistics#
Corn use data from USDA-ERS: http://www.ers.usda.gov/topics/crops/corn/background.aspx
2.1. Earlier sulfate problems
During the period of rapid expansion of U.S. ethanol production and use in the early- to mid-2000s,
there were several reported instances of clogging/plugging of filters used in gasoline distribution and
dispensing systems. In addition, sticky deposits were observed in fuel injectors and plugging of fuel
filters in some vehicles. A recent report by NREL provides a more complete discussion of these field
problems.1 It is also understood that while the filter-plugging problems at fuel terminals and retail
stations were a significant nuisance, formation of engine deposits and the resulting vehicle
operational problems were the most significant issue. Although the causes of these problems were
not determined unequivocally, evidence suggested that they were related to high levels of sulfate
contamination in denatured ethanol that was blended into finished gasoline. In some cases, gelatinous
or “gummy” deposits were reported. Other reports hypothesized that molecular complexes between
gasoline detergent additives and sulfates may be involved. Several reported laboratory analyses of
deposits were inconclusive as to the chemical composition of the filter-plugging deposits, although
sulfates in general – and sodium- and ammonium-sulfate in particular – were identified. (See
description of field problems documented below in Section 3.1.)
5
Based on information presented by various fuel producers, suppliers, and users, ASTM modified the
Standard Specification for Denatured Fuel Ethanol (ASTM D48062) in 2005 to include a maximum
specification of 4 ppm (by mass) for “existent sulfate” in denatured fuel ethanol. Along with this new
sulfate specification, the following language regarding the “Significance of Specified Properties” was
added to D4806: “The presence of small amounts of inorganic sulfates in denatured fuel ethanol
under the right conditions can contribute to turbine meter deposits and the premature plugging of fuel
dispensing pump filters in the fuel distribution system. The sulfates also have been shown to cause
fuel injector sticking resulting in engine misfiring and poor driveability in automobiles.”
Following modification of ASTM D4806, field problems in the U.S. involving filter plugging and
injector deposits disappeared. This development reinforced the hypothesis that high levels of sulfate
in denatured alcohol were responsible for the problems. It is also possible that the situation improved
due to increased experience and maturity within the corn-ethanol industry. The observed field
problems coincided with the early stages of a period of rapid increase in ethanol production, as
shown in Figure 1. During this time, many new ethanol biorefineries were coming on-line, and many
others were being expanded or operated more aggressively. While correlation does not imply
causation, it is possible that initial, sub-optimal operation of some biorefineries led to high sulfate
contaminant levels in ethanol. Other factors – including modifications to blending practices and
changes in additive packages – may also have contributed to the disappearance of field problems.
Because implementation of the sulfate specification in ASTM D4806 appeared to solve the problem,
further investigation into the sources of sulfates (and their associated cations) was not conducted, nor
was any formal research program undertaken to define acceptable levels of sulfate salts in denatured
ethanol. However, current interest in using higher ethanol blend gasolines has renewed awareness of
these earlier problems, and raised concerns that they could re-appear. This has also created interest in
developing a more complete mechanistic understanding of how these filter-plugging deposits form.
2.2. Project objectives
While this research project has several objectives, the principal one is to improve understanding of
the formation of sulfate salt deposits in ethanol, and in fuels containing ethanol. Factors thought to be
important in causing the formation of these deposits were investigated, including concentration of
dissolved sulfate, cations associated with the sulfate, water content, ethanol blending ratios,
temperature, gasoline detergent additives, and gasoline aromatics content. Another objective is to
develop a better understanding of how these factors influence filterability of fuel, and to develop
guidance to avoid plugging issues and vehicle performance problems in the field if higher ethanol
blend fuels were to be used in the future. These objectives were met by a combination of two sets of
activities: (1) literature research and review and (2) laboratory experiments. Both of these activity
sets are described below.
3. Literature Research and Reviews
While sulfate salts are highly soluble in water, most are considered insoluble in ethanol and gasoline.
Reported data regarding experimentally measured solubility of sulfate salts in organic solvents is
sparse. One highly cited source of information regarding the solubility of sodium sulfate (Na2SO4) in
ethanol comes from a compilation of data by Stephen and Stephen, who reported a molar solubility
6
of 0.00143% at 20 °C.3 This value translates to a solubility of ~44 ppm (w/w), which seems much too
high (for anhydrous Na2SO4), considering other information sources, including measurements made
as part of the present project. Within the same Stephen and Stephen source, the solubility of Na2SO4
in ethanol at 50 °C is reported as ~35 ppm (w/w) – a lower value than at 20 °C, which does not seem
likely.
The presence of water in ethanol is known to increase the solubility of Na2SO4, although a rather
large amount of water (several percent) is required before the effect is noticeable. Vener and
Thompson reported that with 20% water in ethanol, the solubility of Na2SO4 at 25 °C was only ~20
ppm.4 Another historical compilation of data reports the solubility of Na2SO4 in ethanol containing
28% water to be 0 g/g.5 A more recent source reported the solubility of Na2SO4 in pure methanol at
20 °C to be 170 ppm.6 Other than the recent European information referenced later in this report, we
are not aware of any published studies in which the solubility of Na2SO4 (or other sulfates) has been
investigated in gasoline-ethanol fuel blends.
Literature research and reviews were conducted as part of the present study to gain a better
understanding of reported field problems with sulfates in fuels, to identify potential sources of
sulfates in commercially-produced ethanol, and to investigate other relevant studies pertaining to
sulfates in fuels. Each of these areas is described below in further detail.
3.1. Documented field problems
Prior to establishment of the existent sulfate limit of 4 ppm in ASTM D4806, numerous reported
field problems were attributed to sulfate contamination of ethanol that was blended into gasoline.
During the ASTM ballot procedure that eventually led to this sulfate specification, several
opportunities existed to share information regarding sulfate contamination problems and potential
solutions. The presence of sulfates in fuels was quite surprising, as there are no obvious sources of
such contaminants. However, because sulfate salts are virtually insoluble in ethanol and gasoline, the
formation of harmful, solid deposits would be expected to occur at very low sulfate levels.
Some of the most comprehensive information sharing occurred during an open forum on “Sulfates in
ethanol and their effects in the field,” which was held at the June 2005 meeting of ASTM
Subcommittee D02.A (Gasoline and Oxygenated Fuel).7 During this open forum, five formal
presentations were given by fuel suppliers, automakers, and representatives of the ethanol industry.
These presentations were posted on the ASTM website, and may still be available for viewing and
downloading by ASTM members. The following paragraphs summarize the main points from these
five presentations:
Fuel Supplier A reported fuel filter plugging problems in 2003 at service stations in the St.
Louis, Chicago, and Los Angeles areas. Varying levels of sulfate were measured in several
dozen ethanol shipments. Concentrations ranged from below 1 ppm to over 8 ppm, with a
median value near 2 ppm. In contrast, nearly all gasoline samples (E0) had sulfate levels
below detection limits. Sodium sulfate was determined to be the main constituent on several
filters, and was detected in tank water bottoms. The problems with sulfate contamination
were rather sporadic and unpredictable, and the sources of sulfate were not well understood,
although there seemed to be an inverse correlation between pHe level of the ethanol and
7
sulfate concentrations. [At lower pHe levels (more acidic) higher sulfate concentrations in
ethanol were observed.]
Fuel Supplier B reported intermittent retail fuel filter plugging problems in Chicago,
Milwaukee, and Minnesota in 2003-2004. While initial inspections of filters were
inconclusive as to the cause of plugging, subsequent analyses implicated a combination of
sodium sulfate and ammonium sulfate. Some individual customer complaints about poor
vehicle driveability were shown to be due to fuel injector sticking. Like Fuel Supplier A,
Supplier B also analyzed several dozen samples of ethanol and gasoline (E0). Sulfate levels
in E0 were generally not detectable, while in ethanol they ranged from less than 1 ppm to
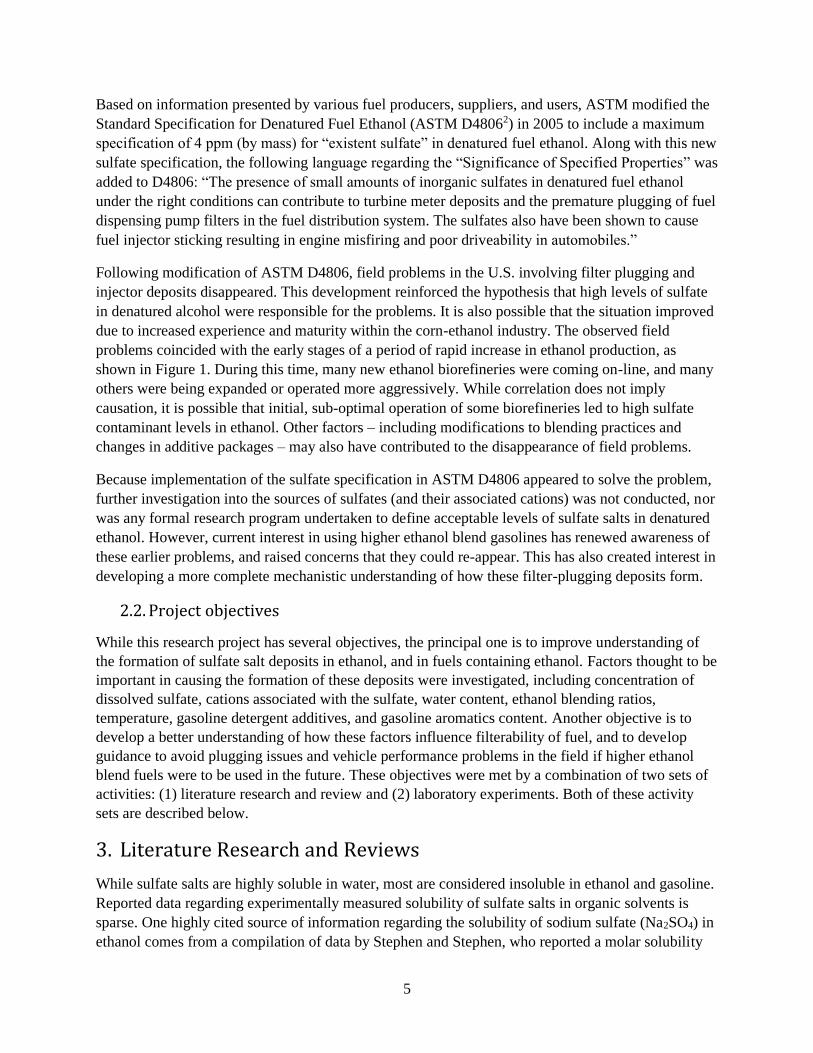
more than 8 ppm, as shown in Figure 2, which comes from a data chart presented by Fuel
Supplier B. It was also thought that gasoline detergent additives could be complexing with
sulfate anions in the ethanol, resulting in deposition of sulfate salts. Fuel Supplier B
developed an internal target specification limit for sulfate in ethanol, which helped to identify
a high sulfate ethanol supplier in the Milwaukee area. Once this problem was corrected,
sulfate levels were reduced significantly, and reported field problems disappeared.
Figure 2. Sulfate concentrations measured in fuel ethanol during 2004-2005.
(Reported by Fuel Supplier B during Open Forum session at the June 2005 meeting of ASTM Subcommittee D02.A)
Automaker A reported on their experiences with fuel injector performance problems, also in
the Milwaukee area during the same time period (2004) as reported by the fuel suppliers.
Injector sticking problems had led to numerous customer complaints involving several
vehicle models and two types of port fuel injectors (PFIs). Inspection of stuck injectors
revealed deposits on internal components, including the valve ball/seat area and the valve
core area. Chemical analyses of these deposits showed the presence of sodium sulfate, and
possibly calcium and ammonium sulfates. It was noted that following Fuel Supplier B’s
change in their Milwaukee ethanol policy, these injector-related service complaints largely
disappeared.

8
Automaker B reported that they had experienced a significant increase in fuel injector
problems in the Phoenix area during the Fall of 2003, after introduction of ethanol-containing
gasoline. Areas outside of Phoenix, which did not require ethanol fuels, did not experience
the same level of problems. In some cases, Automaker B’s injectors were found to be stuck in
the closed position. Increased plugging of fuel filters was also noted, with “gummy” or
“gelatinous” material being found in some cases. Based on their laboratory analyses,
Automaker B believed that sulfate contamination was the primary contributor to these
incidences of fuel injector sticking, filter plugging, and fuel pump failures.
The Ethanol Industry stressed that the reported problems with filter plugging and injector
fouling were very sporadic and difficult to attribute to specific causes. It was noted that
ethanol had been blended into gasoline for over 25 years, without problems, until recently,
and it was not clear what (if anything) had changed over time with ethanol, gasoline, engine
hardware, or other factors that could lead to these reported field problems. It was pointed out
that there were difficulties in analytical procedures for measuring sulfate in ethanol, and that
a need existed to develop an appropriate ASTM test method. The ethanol industry also
emphasized that before considering a specification for sulfate in ethanol, it was necessary to
establish the level at which sulfate contaminants become a problem.
Subsequent to this open forum meeting, a normal ASTM ballot procedure was introduced to add a 1
ppm maximum limit on sulfate to D4806-04. In working through the ballot procedure, a consensus
was reached by the auto, petroleum, and ethanol industries that the near-term sulfate limit should be
4 ppm. It should be mentioned that very little information was available upon which to define a
specific sulfate level that would provide acceptable performance in the field. Based upon sulfate
measurements of many batches of fuel ethanol (such as those shown in Figure 2) it was thought that
4 ppm was an achievable standard that would eliminate the few exceptionally high sulfate levels that
were believed to have caused most of the field problems. Further discussion about these ASTM
actions is provided in a recent NREL report.1
The 4 ppm sulfate specification that was adopted is based on “existent sulfate,” not “potential
sulfate,” Existent sulfate refers to inorganic sulfate anions (SO4-2) actually present in the sample at
the time of analysis, with no oxidation treatment. Potential sulfate refers to total inorganic sulfate
species present after the sample has been reacted with an oxidizing agent. Potential sulfate includes
less highly oxidized forms of sulfur, such as SO2, HSO3, and SO3, which have the potential to oxidize
into sulfate. It is important to note that the ion chromatographic (IC) methods used to characterize
fuel ethanol (D73198and D73289) are only able to quantify sulfate ions (SO4-2). Thus, existent sulfate
is measured directly by IC. To determine potential sulfate, an extra oxidation step involving addition
of hydrogen peroxide is included, such that SO2 and SO3 are converted to SO4 prior to the IC
analysis.
3.2. Potential sources of sulfates in fuels
Total sulfur levels in gasoline have been of concern for many years. EPA’s Tier 2 gasoline
specifications, which began in 2004, limited average gasoline sulfur levels to 30 ppm. Tier 3 gasoline
specifications, which began in 2017, limit average gasoline sulfur levels to 10 ppm. Sulfur-
containing compounds that are naturally present in petroleum product streams are almost entirely
9
organic, such as thiols, organosulfides, and thiophenes. These compounds are stable in the fuels, and
do not readily oxidize to form sulfates. In fact, gasoline analyses that were conducted along with
analyses of the ethanol batches described above demonstrated negligible sulfate levels in petroleum
fuels. Thus, it is reasonable to assume that the dominant sources of sulfates observed in gasoline-
ethanol blends originate from the ethanol component of the blend.
To investigate potential sources of sulfur in corn ethanol, a conventional search of the technical
literature was conducted, utilizing the Web of Science (WOS) searching tools, as well as searching
trade literature and websites. This approach was not very successful in obtaining the type of detailed
information regarding facilities and processes that would be most useful in identifying potential
sources of sulfate in ethanol production plants. Because of this, operators of 18 corn ethanol plants
and 2 service providers to the bio-refinery industry were contacted (by phone) to gain further
information. Taken together, these information sources have provided a much clearer picture of
where sulfur-containing compounds appear within corn ethanol plants, and how sulfate
contamination in gasoline-ethanol blends could result.
Due to concerns about total fuel sulfur levels, ASTM D4806 currently includes a maximum sulfur
specification of 30 ppm for fuel ethanol. This limit may be reduced in the future, when Tier 3
gasoline specifications cap average total sulfur levels at 10 ppm. However, much of the total sulfur in
ethanol occurs in organic form, similar to petroleum fuels, and thus is not believed to contribute
significantly to sulfate formation. A significant source of total sulfur in ethanol can be from natural
gasoline used as denaturant. Another external sulfur source can be corrosion inhibitors, which are
usually added to fuel ethanol.
Corn kernels typically contain about 0.1 wt.% sulfur, mostly in the form of the amino acids cysteine
and methionine, shown in Figure 3.10 This organic sulfur is concentrated by a factor of 2-3 during the
ethanol-production process, but nearly all of it ends up in the distillers dried grains with solubles
(DDGS) fraction, not in the ethanol product stream.
Methionine Cysteine
Figure 3. Forms of organic sulfur present in corn kernels
Corn ethanol in the U.S. is produced in two types of processing plants: wet mill and dry mill plants.11
Rough schematics of these two processes are provide in Figure 4. From a sulfur standpoint, a
significant difference between wet and dry mill plants is the use of sulfurous acid (H2SO3; also
known as aqueous SO2) in the steeping process used in wet milling operations.12,13,14 However, we
are unaware of any identified pathway by which this sulfurous acid would carry over into the final
ethanol product, although such a possibility cannot be ruled out.
Both types of corn ethanol plants use considerable amounts of sulfuric acid (H2SO4) – mainly
employed for two purposes. First, it is used within the fermentation process to maintain proper pH

10
levels for optimum enzymatic performance and to minimize unwanted bacterial growth. If the pH
varies too much from optimum levels, enzymatic activity will decrease, or even stop.11,15 Second,
sulfuric acid is used within the distillation process to prevent occurrence of mineral deposits that
form scale on heat exchangers.10,16 Without use of sulfuric acid, heat exchanger efficiency is reduced
and more frequent cleaning is required. Although considerable amounts of sulfuric acid are used in
these two applications, it is unlikely that these sources contribute significantly to sulfates in the final
ethanol product. This is because sulfates are non-volatile and highly water-soluble, thus they end up
in by-product streams, not in the volatile ethanol product stream. However, these sulfates could be of
concern if excessive levels occur in the DDGS product that is used for animal feed.17,18
Figure 4. Schematics of dry (left) and wet (right) mill processes for ethanol production
A possible cause of sulfate contamination in the ethanol product could result from bisulfite (HSO3-)
treatment within the ethanol plant’s fermentation scrubber system. The primary purpose of this
scrubber is to recover additional ethanol that would otherwise be vented along with the fermentation
by-product, CO2. A schematic of the process water system for a typical corn ethanol plant is shown
in Figure 5, where the location of the scrubber is highlighted with a red oval. Although not shown in
this figure, the aqueous scrubber bottoms are usually routed to the front end cooking process,
although historically, some plants may have routed them to the distillation process.
In addition to ethanol and CO2, small amounts of acetaldehyde and acrolein are also emitted from the
fermentation process. These aldehydes are classified as hazardous air pollutants (HAPs), thus their
emissions must be controlled. According to the sources we spoke with, the need to control these
aldehyde emissions became critical in the mid- to late-2000’s, as larger ethanol plants were being
built and additional EPA emissions regulations were being introduced during this time. The preferred
means of aldehyde control involves the well-known reaction with sodium bisulfite.19 In the case of
acetaldehyde (CH3CHO), reaction with sodium bisulfite (NaHSO3) forms the adduct, 1-
hydroxyethane sulfonic acid salt (CH3CH(OH) SO3- Na+), as shown below in Eq.1. An analogous
reaction occurs with acrolein to produce another sulfonic acid salt.
NaHSO3 + CH3CHO → CH3CH(OH) SO3- Na+ (Eq. 1)

11
Within an ethanol plant, a concentrated aqueous solution of sodium bisulfite is injected near the top
of the fermentation scrubber. The fermentation gas enters the bottom of the scrubber, thus contacting
the bisulfite in a counter-current fashion. Because the organo-sulfonic acid adduct products are water
soluble and have much lower volatility than the original aldehydes, they are removed from the
scrubber in the water bottoms. While sodium bisulfite was originally the reducing agent of choice,
ammonium bisulfite (NH4HSO3) is more commonly used today.
Figure 5. Schematic of process water system in a corn ethanol biorefinery. (Taken from V. Singh, Illinois Water Conference, Oct. 2008.20 Scrubber unit highlighted with red oval.)
To drive Equation 1 to the right, and minimize the amount of aldehydes escaping the scrubber,
excess bisulfite is sometimes used. However, this can lead to problems, particularly at low pH levels.
Under such conditions, excess bisulfite can produce sulfurous acid (H2SO3), which is chemically
equivalent to sulfur dioxide (SO2) in water. At low pH, the equilibrium shown in Equation 2 is
shifted to the right, increasing the concentration of SO2.
H2SO3 ↔ H2O + SO2 (Eq. 2)
Because SO2 is extremely volatile, it can be retained in the ethanol product, even after distillation and
dehydration steps. This creates the opportunity for subsequent oxidation of sulfites to insoluble
sulfates, possibly leading to the types of field problems that have been documented in the past. It has
been pointed out that widespread use of bisulfite scrubber systems in corn ethanol plants began after
the 2004-2006 time period when sulfate salt contaminants in gasoline-ethanol blends led to the field
problems documented above. Nevertheless, the same process by which soluble, potential sulfate
12
species are introduced into fuel ethanol could occur with other sources of SO2/SO3 within the ethanol
plant. This situation is also discussed in a recent report by NREL.1
The existent sulfate level in every batch of denatured fuel ethanol produced in a commercial plant is
measured using ion chromatography to ensure compliance with the 4 ppm specification in ASTM
D4806. However, based on our discussions with technical service providers for the ethanol industry,
we’ve learned that there have been instances in which a product shipment leaves the plant “in spec,”
but arrives at its destination “out of spec.” To help avoid this problem, some ethanol producers now
conduct potential sulfate analyses in addition to the required existent sulfate test. The potential
sulfate test is able to quantify reduced forms of sulfur (SO2, bisulfite and sulfites) that can later
oxidize to sulfates. We have also learned that as a product quality precaution, some ethanol buyers
now impose their own potential sulfate specification on ethanol shipments that they receive.
3.3. Other studies of sulfates in ethanol-blended fuels
Field problems with sulfate contamination in gasoline-ethanol blends have also been of concern in
Europe, particularly in E85 blends. Problems with filter plugging and fuel injector fouling have been
well-documented in Sweden.21 This led to a Swedish voluntary sulfate maximum level in ethanol of
2 ppm in 2010, and a formal E85 standard of 1.7 ppm in 2012. Introduction of this new E85 standard
appeared to reduce the sulfate deposit issues in the FFV fleet.
Analysis of deposits obtained from Swedish field cases indicated the presence of potassium and
calcium cations. In some cases, gasoline detergent additives based on polyisobutylene (PIB)
chemistries appeared to be associated with the deposits. However, no final root causes of these
sulfate deposit problems have been identified.
Other research to address these problems has been coordinated by the E85 Deposit Task Force of the
European Committee for Standardization, CEN/TC 19WG21 (Specification for Unleaded Petrol).
Both laboratory and field experimental programs have been conducted to obtain technical
information upon which to base a sulfate specification in a revised standard for E85 fuel (prEN
15293). Laboratory experiments were conducted by the Process Design Center (PDC) in the
Netherlands to determine the solubility of sodium sulfate in E10, E25, and E85 fuels.22 As shown in
Figure 6, sodium sulfate’s solubility is very low in all three fuels, although it increased noticeably in
E85 having water content above 2 vol.%. In E10 and E25 fuels, the solubility of sodium sulfate was
less than 1 ppm, even when the water content of the ethanol component was as high as 7 vol.%.
The authors of this European report concluded that a fuel ethanol sulfate standard of 4 ppm is
appropriate for E10 fuels, as a 10-fold dilution of this ethanol to produce E10 would reduce the final
sulfate level in the gasoline-ethanol blended fuel to 0.4 ppm (or below). At this level, the sulfate is
expected to remain solubilized in the fuel, and not contribute to deposit formation. However, for E25
fuels, sulfate levels could be as high as 1 ppm, if the ethanol component contained 4 ppm. This level
would exceed the solubility level of sodium sulfate, and thus might be expected to cause deposit
problems. For E85 fuels, it has been suggested that using hydrous ethanol (containing 4 vol.% water)
would be an economical approach to avoiding precipitation of sulfate salts.23

13
Figure 6. Solubility of Na2SO4 in E10, E25, and E85 fuels with various water contents. (Top: expanded scale; Bottom: full scale. Data taken from Reference no. 22.)
4. Laboratory Experimental Program
To further explore issues related to sulfate solubility and formation of filter plugging solids, a
laboratory-based experimental study was conducted at the Desert Research Institute (DRI). The main
goal was to improve understanding of the factors that contribute to the formation of sulfate salts in
ethanol and gasoline-ethanol blends. Specific objectives of this study include the following: (1)
determine solubility of selected sulfate salts in anhydrous, 200-proof ethanol containing varying
amounts of water; (2) determine solubility of selected sulfate salts in low- and high-aromatics
gasoline containing various detergent additives; and (3) examine solubility and formation of solids in
gasoline-ethanol blends that are spiked with low levels of sulfate salts.
4.1. Materials
The gasolines used in this study were supplied (in 1-gallon cans) by one of the CRC member
companies. Five gallons each of a high aromatic (~40 vol.%) and a low aromatic (~1 vol.%) gasoline

14
were provided. These 1-gallon samples were additized with detergent additives of two types:
polyether amine (PEA) and polyisobutyl amine (PIBA). Several additives of each type were supplied
by commercial vendors, but selection of the specific additives used was done by the Fuel Additives
Task Group (FATG) of the American Chemistry Council (ACC), using a ‘blind’ process, so that
neither the vendors nor CRC was aware of the additive’s identities.
The detergent additives were dosed at two concentrations. The low dosage corresponds to the lowest
allowable concentration (LAC) needed to satisfy the gasoline specifications for minimum level of
intake valve deposits; the high dosage corresponds to the minimum concentration meeting TOP
TIER™ Detergent Gasoline requirements. Information about the appropriate dosage levels was
provided by the ACC. One gallon of each gasoline was left unadditized, to provide a baseline fuel for
comparison. As shown in Table 1, the matrix of gasoline fuels consisted of 10 gasolines.
Table 1. Gasoline matrix used in laboratory experiments with sulfate salts
Low Aromatics Gasoline High Aromatics Gasoline
No
Additive
PEA Additive PIBA Additive No
Additive
PEA Additive PIBA Additive
Low
Conc.
High
Conc.
Low
Conc.
High
Conc.
Low
Conc.
High
Conc.
Low
Conc.
High
Conc.
1 2 3 4 5 6 7 8 9 10
Anhydrous, 200-proof ethanol was obtained from Sigma-Aldrich and was additized with a corrosion
inhibitor (at a level of ~50 ppm) provided by a commercial vendor. As with the detergent additives,
the selection of the specific corrosion inhibitor used was made by ACC, using a similar blind
process. Five anhydrous sulfate salts were purchased and used ‘as is’. These are identified below:
Ammonium sulfate [(NH4)2SO4] – VWR BDH9216 (>99.0%)
Calcium sulfate (CaSO4) – Alfa Aesar 40144 (99%)
Potassium sulfate (K2SO4) – VWR 1B1106 (>99%)
Sodium sulfate (Na2SO4) – VWR BDH9302 (>99.0%)
Sodium bisulfite (NaHSO3) – VWR N822
The purity level of sodium bisulfite was not specified. This material is known to be somewhat
unstable with respect to oxidation; therefore, it is likely that some sulfate was also present in the
sodium bisulfite used in this study.
4.2. Laboratory equipment and procedures
4.2.1. Water measurements by Karl Fischer titration
In this project, it was necessary to reliably measure water contents in the ethanol and gasoline
solvents used to dissolve sulfate salts. Due to the tendency of ethanol-containing fuels to absorb
water, it was important to conduct such water measurements on-site, rather than shipping the samples
to outside labs for analysis. The accepted, standard method for water analysis in organic liquids
involves Karl Fischer titration (ASTM E106424). To conduct such analyses, DRI acquired a used
15
Karl Fischer titrator (Metrohm 831 KF Coulometer), and set it up within one of its laboratories. A
photo of this system is provided in Figure 7.
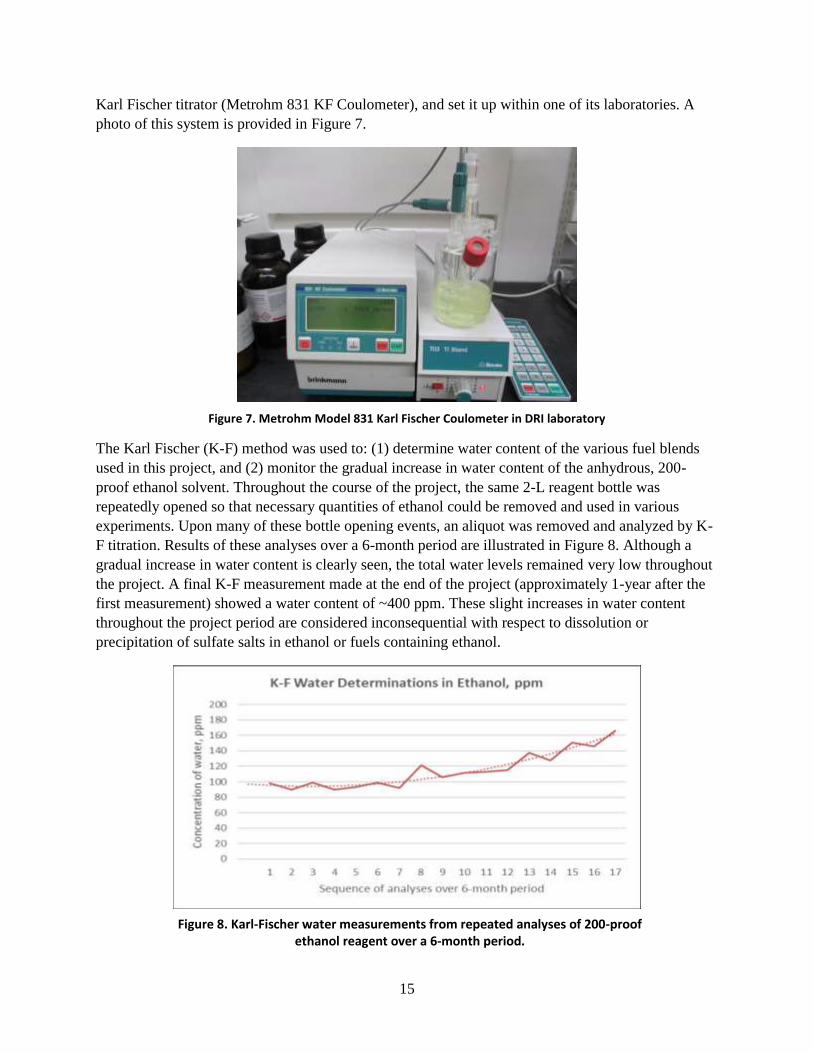
Figure 7. Metrohm Model 831 Karl Fischer Coulometer in DRI laboratory
The Karl Fischer (K-F) method was used to: (1) determine water content of the various fuel blends
used in this project, and (2) monitor the gradual increase in water content of the anhydrous, 200-
proof ethanol solvent. Throughout the course of the project, the same 2-L reagent bottle was
repeatedly opened so that necessary quantities of ethanol could be removed and used in various
experiments. Upon many of these bottle opening events, an aliquot was removed and analyzed by K-
F titration. Results of these analyses over a 6-month period are illustrated in Figure 8. Although a
gradual increase in water content is clearly seen, the total water levels remained very low throughout
the project. A final K-F measurement made at the end of the project (approximately 1-year after the
first measurement) showed a water content of ~400 ppm. These slight increases in water content
throughout the project period are considered inconsequential with respect to dissolution or
precipitation of sulfate salts in ethanol or fuels containing ethanol.
Figure 8. Karl-Fischer water measurements from repeated analyses of 200-proof ethanol reagent over a 6-month period.

16
4.2.2. Sulfate measurements by ion Chromatography (IC)
As specified in ASTM D4806, one of the approved methods for measuring sulfate in ethanol is
ASTM D7328. In this project, ASTM D7328 was used to quantify both existent and potential sulfate
in ethanol, gasoline, and gasoline-ethanol blends. Although the method has been standardized by
ASTM only for use with fuel ethanol, there are no operational difficulties in also applying it to
gasoline and gasoline-ethanol blends.
To determine existent sulfate, a small volume of sample is evaporated to dryness, then reconstituted
to the initial volume with deionized water. A sample of this aqueous solution is then injected into an
ion chromatograph consisting of appropriate ion exchange columns, suppressor, and conductivity
detector. DRI uses a DIONEX ICS-5000+ system for this analysis. Although ASTM D7328 is said to
be applicable over a sulfate concentration range of 0.55-20 ppm, DRI’s application has demonstrated
satisfactory performance over a much wider range, with a minimum detection limit (MDL)
determined to be 0.01 ppm in aqueous solutions (from atmospheric samples collected on filters and
extracted into water). For potential sulfate determination, after the ethanol solution is evaporated to
dryness, it is reconstituted to the original sample volume using a dilute solution of hydrogen peroxide
(~1 wt.%) in water. The hydrogen peroxide serves to oxidize reduced forms of sulfur (such as SO2,
sulfite, and bisulfite) to sulfate, which is then quantified using the same IC method as for existent
sulfate. The difference between the potential and existent sulfate results provides an estimate of the
oxidizable forms of sulfur present in the sample.
4.2.3. Filtration process
To determine the solubility of sulfate salts in ethanol, gasoline, and gasoline-ethanol blends, it was
necessary to conduct a variety of filtration experiments. Due to the flammable nature of these
materials, several precautions were taken to ensure safe laboratory operations. The vacuum-assisted
filtration procedure used was based on ASTM D5452, “Standard Test Method for Particulate
Contamination in Aviation Fuels by Laboratory Filtration.” 25 The most important precautions
involve adequate grounding of the entire filtration apparatus – including the metal filter funnel, the
filtrate receiving flask, and the dry ice-cooled trap located between the filter flask and the house
vacuum system. In addition, during filtration experiments, the laboratory technician wore an
antistatic wrist strap. A photo of the entire filtration apparatus installed in a laboratory hood is shown
in Figure 9.
Initial plans for determining the solubility of various sulfate salts in ethanol called for introducing
known amounts of salts into 250-mL of 200 proof ethanol. After stirring the resultant slurries for 2-
hours to dissolve the salts (using a magnetic stirrer), the solutions were to be rested for 24 hours and
then filtered, using the method described in ASTM D5452. The mass of salts dissolved would then
be calculated by the difference between the initial mass added and the undissolved mass recovered
after filtration.
This approach of determining solubility of sulfate salts by a filter weight difference method proved to
be quite problematic, and led to poor measurement reproducibility. Due to the extremely low
solubility of most sulfate salts, this method relied on measuring small differences between two large
values. For example, if 500 mg of sodium sulfate were added to 250-mL of ethanol, less than 1 mg

17
would be expected to dissolve, with 499 mg remaining undissolved. Given this, it is very difficult to
reliably determine 1 mg as the difference between 500 and 499 mg.
Figure 9. Fuel filtration apparatus installed in laboratory hood
A second problem stems from difficulties in completely transferring materials from one vessel to
another. Solubility experiments were conducted in 500-mL Erlenmeyer flasks, as shown in Figure
10. After stirring about 1 g of sodium sulfate in 250-mL of 200 proof ethanol for two hours, the
solution was allowed to sit at room temperature for 24 hours. Immediately prior to filtering, the
solution was swirled to suspend the solids. However, some solid particles strongly adhered to the
walls of the flask, requiring extensive rinsing to completely remove them from the flask and transfer
them into the filter assembly. Rinsing with hexane caused even greater adhesion of particles to the
walls than did rinsing with ethanol. To completely remove these particles required a large volume
(~200 mL) of rinse solution, which introduced the possibility of dissolving more sulfate salt and
raised further doubts about the validity of the solubility results.
Figure 10. Sodium sulfate particles in Erlenmeyer flask. (Left) Sodium sulfate in 250-mL of 200-proof ethanol. (Right) Some particles remain
in the flask even after extensive rinsing with ethanol (right).

18
A third problem related to complete capture of all the undissolved sulfate salt on the filter for
weighing. This proved to be quite challenging, as the wet filters were difficult to handle, and once
dry, the powdery sulfate salts were difficult to keep on the filter. These problems were encountered
when using either Nuclepore membrane or Teflon membrane filters. As shown in Figure 11, some
sulfate ends up on the metal screen or outer rim of the filter apparatus. Failure to capture this material
results in incorrect filter weights, and hence, invalid solubility results.
Figure 11. Collection of undissolved sodium sulfate on filter. (Left) Particles spill over the sides of the filter upon removal of the filter funnel. (Middle) Removing the filter
is difficult, as light particles “float off” and spill. (Right) Particles remain on base of filtration unit after removal of the filter.
sults .
Four preliminary filtration experiments were conducted using 1.0 g of sodium sulfate in 200-proof
ethanol. Despite careful efforts to capture all undissolved salts by filtration, the highest recovery
obtained was 97.1%. If all the remainder had truly dissolved, this would imply a solubility of
approximately 94 ppm, which based on literature information, is too high by at least an order of
magnitude.
Because of these filtration problems, it was decided to base all sulfate solubility results on direct
measurement of dissolved sulfate in filtrate solutions using the IC method described in ASTM
D7328. This also simplified the filtration experiments, as there was no longer any need to thoroughly
rinse the sample flasks or completely recover undissolved sulfate salts on filters. Furthermore, the
filtrate sample could be recovered and prepared for IC analysis without disassembling the filtration
apparatus, thus avoiding potential contamination with the powdery sulfate salts collected on the filter.
With this change in methodology, we also changed the filter type to a smaller pore size. Rather than
the 0.8 µm pore size called for in ASTM D5452 for filtering fuels, we used 0.4 µm Nuclepore filters,
to ensure more complete removal of small particles, thereby improving reliability of the solubility
determinations. Filtration of the salt solutions was done using 47 mm Whatman Nuclepore track-
etched polycarbonate AOX filters, having a pore size of 0.4 µm (Whatman Product ID 111137).
These filters were chosen because they are chemically inert, and can tolerate a wide variety of
solvents (including ethanol and gasoline). Finally, Nuclepore filters have sharply defined pore sizes,
as opposed to fibrous filters, thus providing a cleaner size cut of particles that can pass through the

19
filter. With a pore size as small as 0.4 µm, it was thought that almost all undissolved salt particles
would be removed by filtration, leaving a filtrate solution with only dissolved sulfate, and thus allow
for accurate determination of solubility, based on IC analysis of the filtrate.
4.2.4. Particle counts in fuel samples
In an effort to better understand the solubilization/precipitation of sulfate salts in ethanol, gasoline,
and gasoline-ethanol blends, all experimental samples (both before and after filtration) underwent
particle counting using a Seta Analytics SA1000 automatic particle counter (APC) instrument
(Stanhope-Seta Company, UK). The APC method used was based on ASTM D7619, “Standard Test
Method for Sizing and Counting Particles in Light and Middle Distillate Fuels, by Automatic Particle
Counter.” 26 A photo of this APC instrument is shown in Figure 12. For each sample analyzed, the
instrument provides triplicate measurements (and averages) of particle counts in six size band ranges:
>4, >6, >14, >21, >38, and >70 µm.
Figure 12. Photo of Seta Analytics SA1000 automatic particle counter (APC).
This APC instrument operates with a built-in, microprocessor-controlled routine that pumps 10-mL
of sample into a measurement cell where it is exposed to a laser light. Particles in the sample obscure
this light and cast shadows on a calibrated sensor, which determines the size and number of the
particles. In a single analysis routine, the APC instrument pumps and analyzes 3 separate 10-mL
samples, and provides average particle count numbers for each size range. Including sample volume
used for rinsing before and after each measurement, a total sample size of 80-mL is required for each
analysis. Consistent sample handling techniques – including agitation of the sample during the
analysis procedure – are necessary to obtain repeatable results, especially for samples that contain
large numbers of particles.
4.3. Experiments using sulfate salts in ethanol
An initial set of experiments was conducted to investigate the solubility of sulfate salts in 200-proof
ethanol, with and without addition of 2.0 wt.% water. In addition, particle counts were measured on

20
all samples, both before and after filtration. The five anhydrous salts identified in Section 4.1 were
used: ammonium sulfate, calcium sulfate, potassium sulfate, sodium sulfate, and sodium bisulfite.
In each solubility/filtration experiment, approximately 1 g of salt was added to 250 mL of ethanol in
a 500 mL Erlenmeyer flask. After stirring for 2 hours (using a magnetic stirring bar), the slurries
were allowed to stand overnight at either room temperature (25 °C) or in a refrigerator (5 °C). In all
cases, the undissolved salts quickly dropped to the bottom of the flask once stirring was stopped, and
the solutions above the solids appeared clear and bright. The following day, an aliquot of the clear
solution above the solids was decanted and retained for particle count measurements using the APC
instrument. The remaining slurry samples were gently swirled to free the particles that had
agglomerated upon standing, and were vacuum filtered through a 0.4 µm Nuclepore filter as
described above. All samples filtered very quickly (<20 sec.) and all filtrate samples were clear and
bright. The filtrates were analyzed by IC for both existent and potential sulfate. In addition, particle
counts were determined for each filtrate sample. The total matrix of experiments in which solid
sulfate salts were introduced into ethanol is shown below in Table 2.
Table 2. Sulfate solubility/filtration experiments conducted in 200-proof ethanol (Number shown indicates replicate experiments)
Room Temp. Storage, 25°C) Refrigerator Storage, (5°C) Total No. of Expt’s Sulfate Salt 0.0 wt.%
Water 2.0 wt.%
Water 0.0 wt.%
Water 2.0 wt.%
Water
None (Baseline) 1 1 0 0 2
Ammonium Sulfate 2 1 0 0 3
Calcium Sulfate 1 1 0 0 2
Potassium Sulfate 1 1 0 0 2
Sodium Bisulfite 3 3 3 0 9
Sodium Sulfate 3 3 3 0 9
Total No. of Experiments 27
4.3.1. Sulfate solubility in ethanol
The filtrates obtained from the solubility/filtration experiments described above were analyzed for
existent and potential sulfate concentrations using the IC method described in ASTM D7328. The
numerical results are provided in Appendix Table I-1, and are summarized graphically in Figure 13.
All results are expressed as solubility in units of ppm, or µg sulfate/g ethanol. Baseline results of
ethanol without any added salt are not included in Figure 13, as these samples had undetectable
levels of sulfate, which cannot be shown on the logarithmic scale.
The results displayed in Figure 13 confirm that calcium sulfate, potassium sulfate, and sodium sulfate
all have extremely low solubility in ethanol – whether or not 2.0 wt.% water was included. In
agreement with literature reports, inclusion of this small amount of water had no discernable effect
on the sulfate solubilities. The solubility of ammonium sulfate was noticeably higher than that of
calcium-, potassium-, or sodium sulfate – by approximately an order of magnitude. The apparent
decrease in solubility of ammonium sulfate with addition of water is not significant when considering
the high variability within these measurements. The solubility of sodium bisulfite in ethanol is clearly
higher than that of any other salt used here. Addition of 2.0 wt.% water appeared to increase the
21
solubility of sodium bisulfite slightly (at 25 °C), although the high experimental variability makes
this conclusion uncertain.
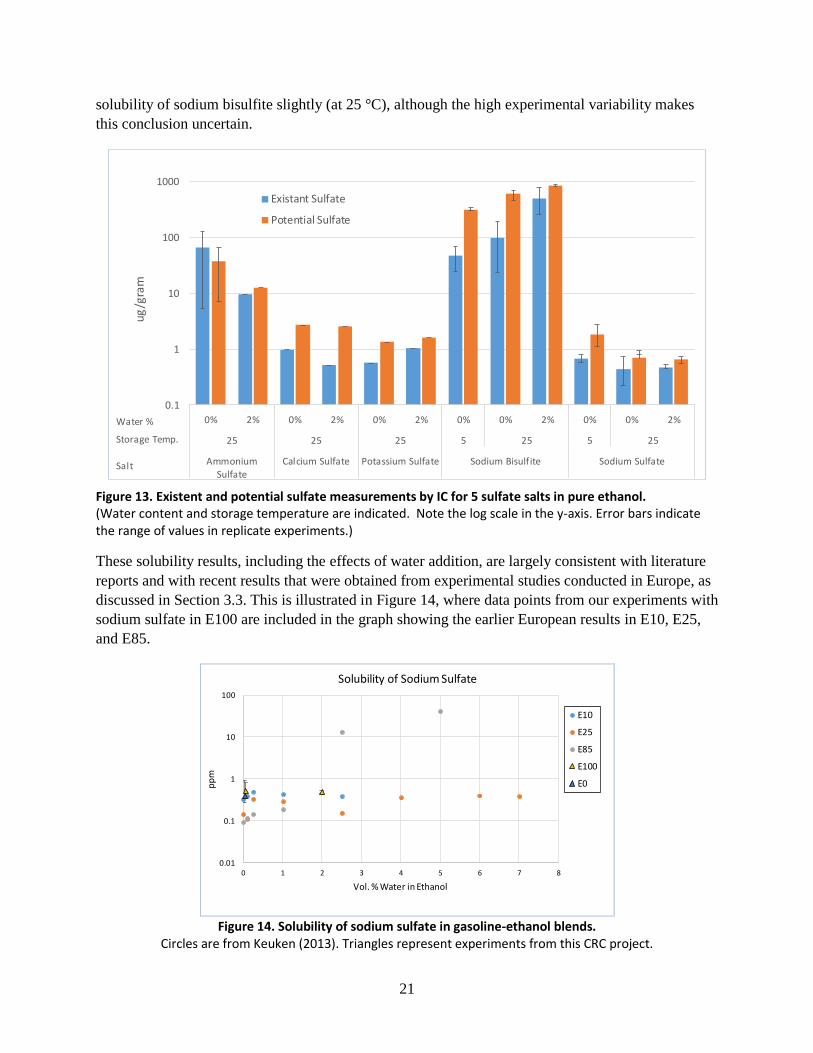
Figure 13. Existent and potential sulfate measurements by IC for 5 sulfate salts in pure ethanol. (Water content and storage temperature are indicated. Note the log scale in the y-axis. Error bars indicate the range of values in replicate experiments.)
These solubility results, including the effects of water addition, are largely consistent with literature
reports and with recent results that were obtained from experimental studies conducted in Europe, as
discussed in Section 3.3. This is illustrated in Figure 14, where data points from our experiments with
sodium sulfate in E100 are included in the graph showing the earlier European results in E10, E25,
and E85.
Figure 14. Solubility of sodium sulfate in gasoline-ethanol blends.
Circles are from Keuken (2013). Triangles represent experiments from this CRC project.
0.1
1
10
100
1000
0% 2% 0% 2% 0% 2% 0% 0% 2% 0% 0% 2%
25 25 25 5 25 5 25
Ammonium
Sulfate
Calcium Sulfate Potassium Sulfate Sodium Bisulfite Sodium Sulfate
ug
/gra
m
Existant Sulfate
Potential Sulfate
Water %
Storage Temp.
Salt
0.01
0.1
1
10
100
0 1 2 3 4 5 6 7 8
pp
m
Vol. % Water in Ethanol
Solubility of Sodium Sulfate
E10
E25
E85
E100
E0
22
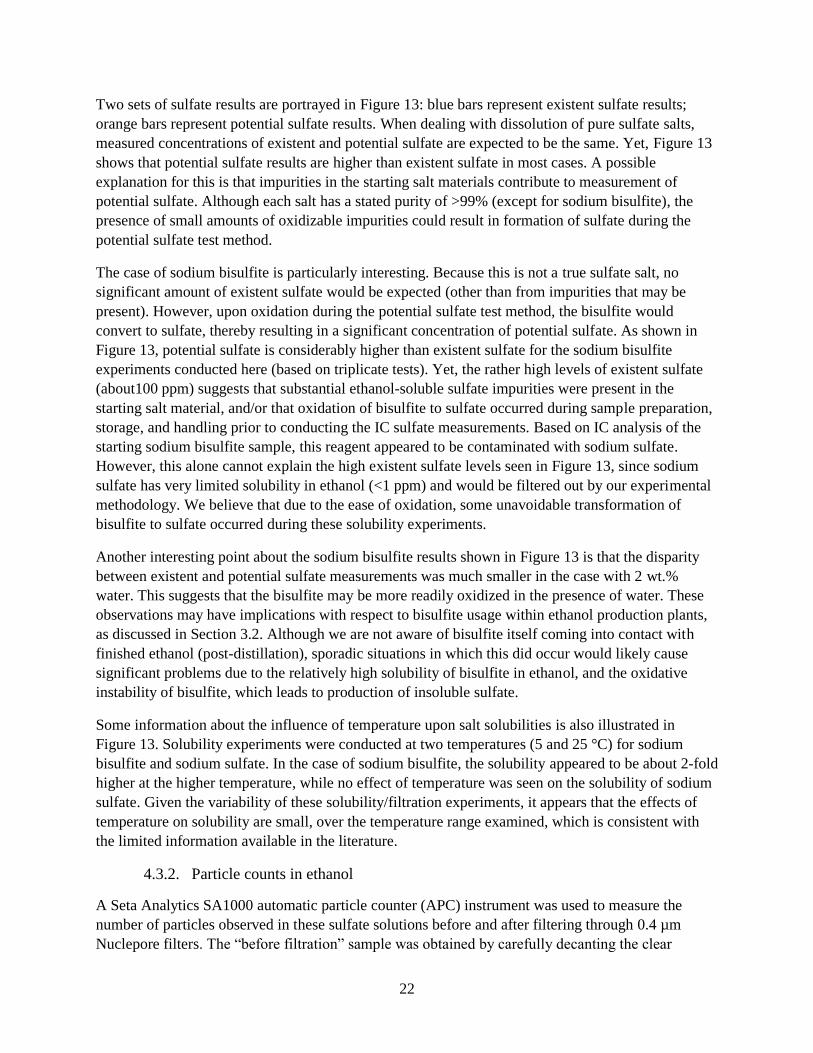
Two sets of sulfate results are portrayed in Figure 13: blue bars represent existent sulfate results;
orange bars represent potential sulfate results. When dealing with dissolution of pure sulfate salts,
measured concentrations of existent and potential sulfate are expected to be the same. Yet, Figure 13
shows that potential sulfate results are higher than existent sulfate in most cases. A possible
explanation for this is that impurities in the starting salt materials contribute to measurement of
potential sulfate. Although each salt has a stated purity of >99% (except for sodium bisulfite), the
presence of small amounts of oxidizable impurities could result in formation of sulfate during the
potential sulfate test method.
The case of sodium bisulfite is particularly interesting. Because this is not a true sulfate salt, no
significant amount of existent sulfate would be expected (other than from impurities that may be
present). However, upon oxidation during the potential sulfate test method, the bisulfite would
convert to sulfate, thereby resulting in a significant concentration of potential sulfate. As shown in
Figure 13, potential sulfate is considerably higher than existent sulfate for the sodium bisulfite
experiments conducted here (based on triplicate tests). Yet, the rather high levels of existent sulfate
(about100 ppm) suggests that substantial ethanol-soluble sulfate impurities were present in the
starting salt material, and/or that oxidation of bisulfite to sulfate occurred during sample preparation,
storage, and handling prior to conducting the IC sulfate measurements. Based on IC analysis of the
starting sodium bisulfite sample, this reagent appeared to be contaminated with sodium sulfate.
However, this alone cannot explain the high existent sulfate levels seen in Figure 13, since sodium
sulfate has very limited solubility in ethanol (<1 ppm) and would be filtered out by our experimental
methodology. We believe that due to the ease of oxidation, some unavoidable transformation of
bisulfite to sulfate occurred during these solubility experiments.
Another interesting point about the sodium bisulfite results shown in Figure 13 is that the disparity
between existent and potential sulfate measurements was much smaller in the case with 2 wt.%
water. This suggests that the bisulfite may be more readily oxidized in the presence of water. These
observations may have implications with respect to bisulfite usage within ethanol production plants,
as discussed in Section 3.2. Although we are not aware of bisulfite itself coming into contact with
finished ethanol (post-distillation), sporadic situations in which this did occur would likely cause
significant problems due to the relatively high solubility of bisulfite in ethanol, and the oxidative
instability of bisulfite, which leads to production of insoluble sulfate.
Some information about the influence of temperature upon salt solubilities is also illustrated in
Figure 13. Solubility experiments were conducted at two temperatures (5 and 25 °C) for sodium
bisulfite and sodium sulfate. In the case of sodium bisulfite, the solubility appeared to be about 2-fold
higher at the higher temperature, while no effect of temperature was seen on the solubility of sodium
sulfate. Given the variability of these solubility/filtration experiments, it appears that the effects of
temperature on solubility are small, over the temperature range examined, which is consistent with
the limited information available in the literature.
4.3.2. Particle counts in ethanol
A Seta Analytics SA1000 automatic particle counter (APC) instrument was used to measure the
number of particles observed in these sulfate solutions before and after filtering through 0.4 µm
Nuclepore filters. The “before filtration” sample was obtained by carefully decanting the clear
23
solution above the undissolved salts remaining in the Erlenmeyer flask after the slurry had sat
overnight. The “after filtration” sample was obtained from filtrate in the vacuum filter flask, after the
entire slurry had been filtered. The APC instrument was configured to conduct analyses of three
sequential aliquots drawn from each sample. Appendix Table II-1 provides average particle count
results from the three aliquots of each ethanol-based experiment.
Particle counts were also measured in the 200-proof baseline ethanol (additized with corrosion
inhibitor) that was used in these experiments. The baseline ethanol was filtered using the same
methodology as with the sulfate salts, thus “before filtration” and “after filtration” particle counts
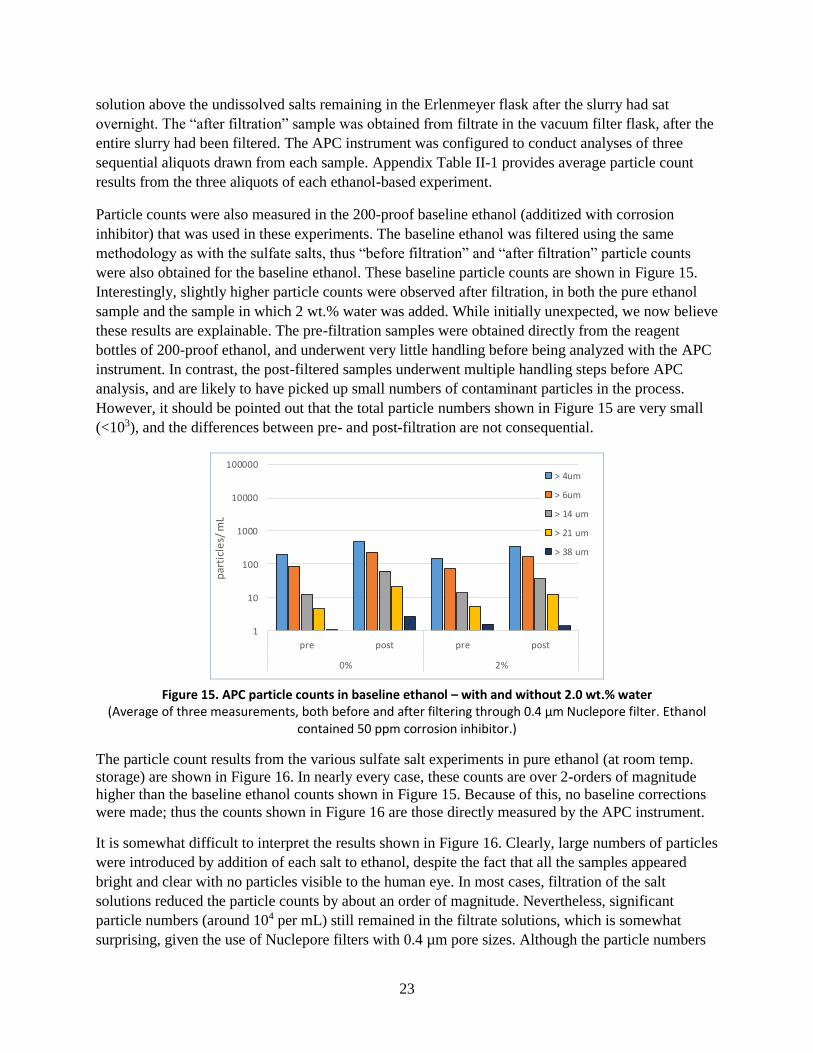
were also obtained for the baseline ethanol. These baseline particle counts are shown in Figure 15.
Interestingly, slightly higher particle counts were observed after filtration, in both the pure ethanol
sample and the sample in which 2 wt.% water was added. While initially unexpected, we now believe
these results are explainable. The pre-filtration samples were obtained directly from the reagent
bottles of 200-proof ethanol, and underwent very little handling before being analyzed with the APC
instrument. In contrast, the post-filtered samples underwent multiple handling steps before APC
analysis, and are likely to have picked up small numbers of contaminant particles in the process.
However, it should be pointed out that the total particle numbers shown in Figure 15 are very small
(<103), and the differences between pre- and post-filtration are not consequential.
Figure 15. APC particle counts in baseline ethanol – with and without 2.0 wt.% water (Average of three measurements, both before and after filtering through 0.4 µm Nuclepore filter. Ethanol
contained 50 ppm corrosion inhibitor.)
The particle count results from the various sulfate salt experiments in pure ethanol (at room temp.
storage) are shown in Figure 16. In nearly every case, these counts are over 2-orders of magnitude
higher than the baseline ethanol counts shown in Figure 15. Because of this, no baseline corrections
were made; thus the counts shown in Figure 16 are those directly measured by the APC instrument.
It is somewhat difficult to interpret the results shown in Figure 16. Clearly, large numbers of particles
were introduced by addition of each salt to ethanol, despite the fact that all the samples appeared
bright and clear with no particles visible to the human eye. In most cases, filtration of the salt
solutions reduced the particle counts by about an order of magnitude. Nevertheless, significant
particle numbers (around 104 per mL) still remained in the filtrate solutions, which is somewhat
surprising, given the use of Nuclepore filters with 0.4 µm pore sizes. Although the particle numbers
1
10
100
1000
10000
100000
pre post pre post
0% 2%
par
ticl
es/
mL
> 4um
> 6um
> 14 um
> 21 um
> 38 um

24
were high, their cumulative mass is very low, as evidenced by the extremely low sulfate solubilities
for most of the salts, as shown in Figure 13.
Figure 16. APC particle counts in ethanol containing anhydrous salts – avg. of three measurements. (All samples prepared at room temp. using anhydrous ethanol with 50 ppm corrosion inhibitor. Measurements were made before (pre) and after (post) filtering through 0.4 µm Nuclepore filters.)
While sodium bisulfite had much higher solubility than the other salts tested, no clear differences in
particle numbers are seen for any of the salts included in Figure 16. However, it is of note that upon
sitting in the laboratory for several months (in closed, glass bottles), the ethanol filtrate solutions
containing sodium bisulfite became noticeably cloudy, whereas none of the other ethanol solutions
did. A photo illustrating the cloudiness of the filtrates from sodium bisulfite experiments compared to
all other salt filtration experiments is shown in Figure 17. We believe this resulted from gradual
oxidation of the dissolved bisulfite to sulfate, which is insoluble and precipitated as white-colored,
fine particles.
Figure 17. Photo of collected filtrates from experiments in which sulfate salts were added to ethanol.
Samples were stored on a laboratory benchtop in the glass bottles shown for 1-3 months. Note cloudiness of
filtrates from experiments using sodium bisulfite.
1
10
100
1000
10000
100000
pre post pre post pre post pre post pre post
Ammonium Sulfate Calcium Sulfate Potassium Sulfate Sodium Bisulf ite Sodium Sulfate
par
ticl
es/
mL
> 4um
> 6um
> 14 um
> 21 um
> 38 um
25
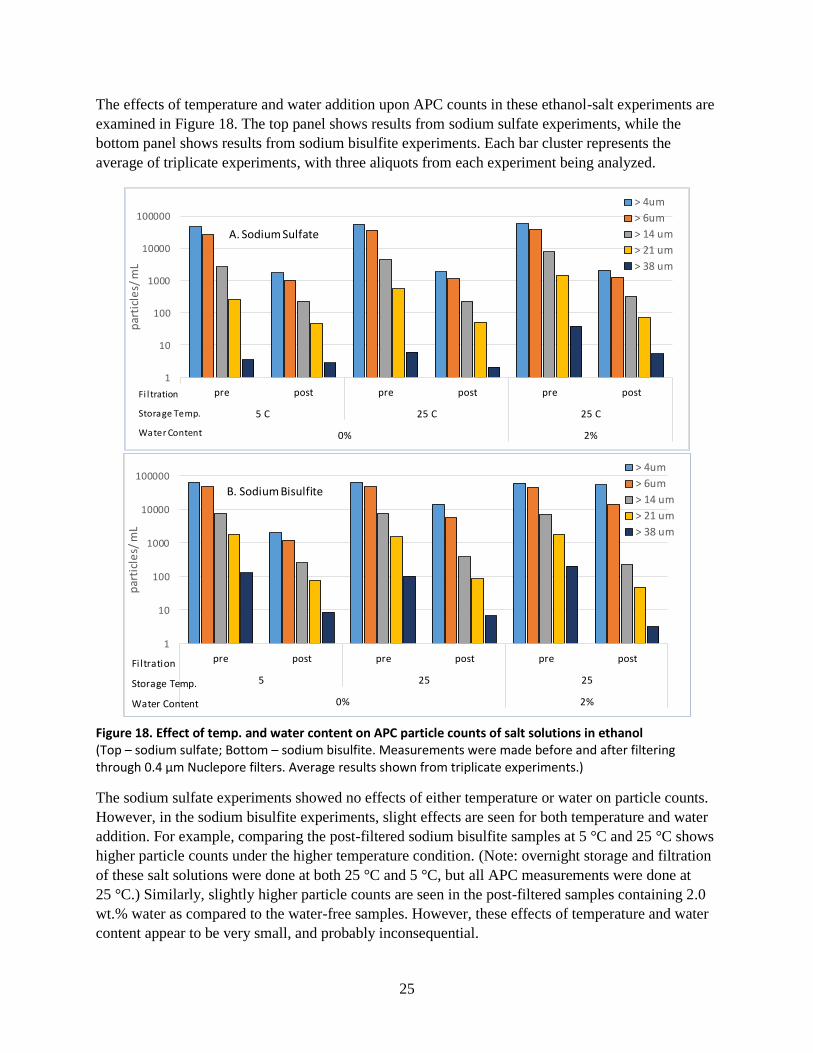
The effects of temperature and water addition upon APC counts in these ethanol-salt experiments are
examined in Figure 18. The top panel shows results from sodium sulfate experiments, while the
bottom panel shows results from sodium bisulfite experiments. Each bar cluster represents the
average of triplicate experiments, with three aliquots from each experiment being analyzed.
Figure 18. Effect of temp. and water content on APC particle counts of salt solutions in ethanol (Top – sodium sulfate; Bottom – sodium bisulfite. Measurements were made before and after filtering through 0.4 µm Nuclepore filters. Average results shown from triplicate experiments.)
The sodium sulfate experiments showed no effects of either temperature or water on particle counts.
However, in the sodium bisulfite experiments, slight effects are seen for both temperature and water
addition. For example, comparing the post-filtered sodium bisulfite samples at 5 °C and 25 °C shows
higher particle counts under the higher temperature condition. (Note: overnight storage and filtration
of these salt solutions were done at both 25 °C and 5 °C, but all APC measurements were done at
25 °C.) Similarly, slightly higher particle counts are seen in the post-filtered samples containing 2.0
wt.% water as compared to the water-free samples. However, these effects of temperature and water
content appear to be very small, and probably inconsequential.
1
10
100
1000
10000
100000
pre post pre post pre post
5 C 25 C 25 C
0% 2%
par
ticl
es/
mL
> 4um
> 6um
> 14 um
> 21 um
> 38 um
Fi l tration
Storage Temp.
Water Content
A. Sodium Sulfate
1
10
100
1000
10000
100000
pre post pre post pre post
5 25 25
0% 2%
par
ticl
es/
mL
> 4um
> 6um
> 14 um
> 21 um
> 38 um
B. Sodium Bisulfite
Filtration
Storage Temp.
Water Content
26
Based upon the information obtained from this entire set of experiments with ethanol, it is concluded
that sodium bisulfite behaves somewhat differently from the other salts – both with respect to
solubility and particle counts. Sodium sulfate appears to behave very similarly to calcium sulfate and
potassium sulfate, and thus may be a good representative of all these salts. Ammonium sulfate
appears to have intermediate behavior – at least in terms of solubility.
4.4. Experiments using sulfate salts in gasoline
A second set of laboratory experiments was conducted to investigate the solubility of two sulfate
salts in gasoline: sodium sulfate and sodium bisulfite. Based upon the results described above in
Section 4.3, the effects of temperature and water addition are quite small, so these parameters were
not varied in the second set of experiments. (All experiments were conducted at room temperature,
with no water added.) However, the effects of gasoline aromatic content and detergent additives were
investigated. Two base gasolines were used: one with low aromatics (1 vol.%); the other with high
aromatics (40 vol.%). Also, two detergent additives were used: one being a polyether amine (PEA);
the other a polyisobutyl amine (PIBA). Each additive was dosed at low and high levels,
corresponding to LAC and minimum TOP TIER™ Detergent Gasoline requirements. The complete
experimental matrix of 42 samples is shown in Table 3.
Table 3. Sulfate solubility/filtration experiments conducted in gasoline (Number shown indicates replicate experiments)
Sulfate Salt
Composition of Gasoline Total
No. of
Expt’s
Low Aromatics High Aromatics
No
Additive
PEA Additive PIBA Additive No
Additive
PEA Additive PIBA Additive
Low
Conc.
High
Conc.
Low
Conc.
High
Conc.
Low
Conc.
High
Conc.
Low
Conc.
High
Conc.
None
(baseline) 1 1 1 1 1 1 1 1 1 1 10
Na2SO4 2 2 2 2 2 1 1 1 1 1 15
NaHSO3 2 2 2 2 2 1 2 1 1 2 17
Total No. of Experiments 42
To determine the solubility of sodium sulfate and sodium bisulfite, the same experimental
methodology was used as described above for the ethanol experiments. This involved stirring excess
amounts of the anhydrous salts in 250-mL of the appropriate gasoline sample for two hours, followed
by filtration through a 0.4 µm Nuclepore filter. In all cases, the gasoline samples appeared clear and
bright – both before and after filtering. Filtrates from the high aromatics gasoline were pale yellow
color; those from the low aromatics gasoline were colorless. No differences in ease of filtration were
observed among this set of experiments. As with the previous ethanol experiments, all samples were
readily filtered within 20-sec.
4.4.1. Solubility in gasoline
The filtrates obtained from the gasoline solubility/filtration experiments with sodium sulfate and
sodium bisulfite were analyzed for existent and potential sulfate by IC. In the sample work-up
procedure prior to IC analysis, the gasolines were blown down to dryness under N2, with the residue

27
then being taken up in water. Due to the presence of gasoline heavy ends and/or detergent additives,
these aqueous solutions were quite cloudy with insoluble materials. However, this did not cause any
apparent difficulty in the resulting IC analyses. (Note: Sulfate analyses were not conducted on the
baseline gasoline samples that contained no salt.) The complete set of sulfate results are given in
Appendix Table I-2. Average results of replicate experiments are shown in Figure 19, where sodium
sulfate solubilities are represented in blue and sodium bisulfite solubilities are represented in orange.
Note that most of the solubility results in the high aromatics gasoline are based on single
determinations, while the results in the low aromatics gasoline are averages of duplicate experiments,
with the range of values indicated by the error bars.
Figure 19. Effect of aromatics and detergent additives on existent and potential sulfate measurements by IC for sodium sulfate and sodium bisulfite in gasoline.
(Error bars indicate the range of values in duplicate experiments.)
Focusing first on the sodium sulfate experiments, very similar solubility results were obtained from
all samples, regardless of aromatics level, additive type, or additive dosage. As was the case in the
ethanol experiments (Figure 13), sodium sulfate exhibited very low solubility in gasoline – certainly
<1 ppm. In fact, the solubilities (based on existent sulfate measurements) were all less than 0.5 ppm,
except possibly in the low aromatics gasoline with a high concentration of PEA. However, this
particular result was the average of two experiments that differed substantially, as seen by the large
error bars.
The sodium bisulfite results are quite different, suggesting that the additive type and level may have
small effects on solubility. Without any detergent additive present, the solubility of sodium bisulfite
in gasoline is very low (<0.5 ppm). This contrasts sharply with the much higher solubility of sodium
bisulfite in ethanol (~100 ppm; see Figure 13). The data in Figure 19 suggest that sodium bisulfite
becomes slightly more soluble upon addition of either PEA or PIBA detergent additives. In the low
aromatics gasoline experiments (which all had duplicates), this increasing solubility appears to be on
the order of 2-4 fold. A similar, or larger increase may occur in the high aromatics gasoline, but this
is difficult to confirm based on the few measurements made here. The differences in sodium bisulfite
solubilities among the different additive types and dosages are small and inconsistent. Additional
0
0.5
1
1.5
2
2.5
3
3.5
4
4.5
None PEA Low PEA High PIBA Low PIBA High None PEA Low PEA High PIBA Low PIBA High
High Aromatics Low Aromatics
Sulf
ate
, ug
/ g
ram
Existent Sodium Sulfate
Potential Sodium Sulfate
Existent Sodium Bisulfite
Potential Sodium Bisulfite

28
replicate experiments would be necessary to determine with confidence whether real differences exist
among additive type and dosage.
Another interesting observation is that the existent and potential sulfate results shown in Figure 19
are nearly identical in each of these gasoline samples – for both the sodium sulfate and the sodium
bisulfite samples. This is in contrast to the ethanol experiments shown in Figure 13, where the
potential sulfate levels were much higher than existent sulfate for the sodium bisulfite samples. These
results are consistent with sodium bisulfite itself having very low solubility in gasoline, but higher
solubility in ethanol.
Overall, these sulfate results show that both sodium sulfate and sodium bisulfite have very low
solubility in gasoline. The addition of detergent additives does not seem to influence the solubility of
sodium sulfate, but does slightly increase the solubility of sodium bisulfite, with the effect being
larger – though somewhat inconsistent – in the high aromatics gasoline. The most significant
conclusion is that sodium bisulfite has much lower solubility in gasoline than in ethanol. This raises
the question of whether the blending of ethanol containing high levels of sodium bisulfite with
gasoline would de-solubilize the salt, resulting in formation of deposits in the blended fuel.
4.4.2. Particle count results in gasoline
Particle counts of “before” and “after” gasoline filtration samples were obtained using the APC
instrument and procedures as described above for the ethanol experiments. Numerical results from all
the APC measurements of gasoline samples are provided in Appendix Table II-2. Figure 20
graphically summarizes particle counts from the 10 baseline gasoline samples: 5 with low aromatics
and 5 with high aromatics. Close inspection of these results reveals several interesting features. First,
although these gasoline samples appeared to be clear and bright, they all contained over 103
particles/ml, before filtration. These numbers are roughly an order of magnitude higher than the
baseline numbers measured in the 200-proof ethanol (see Figure 15). A second observation is that
filtration of the low aromatics gasolines noticeably reduced the particle counts in every case, while
filtration of the high aromatics gasolines resulted in little, if any, reduction in particle counts. Third,
addition of the two detergents (PEA and PIBA) to the low aromatics gasoline resulted in increased
particle counts in the post-filtration samples, although these increases were small and inconsistent
with additive dosage. In contrast, addition of the detergents to the high aromatics gasoline had very
little impact on particle counts.
Particle count results for the gasoline solubility/filtration experiments with sodium sulfate are
depicted in Figure 21. Clearly, addition of sodium sulfate increased the number of particles in the
pre-filtration samples – by about an order of magnitude over the baseline levels shown in Figure 20.
However, filtration was effective in reducing the particle counts substantially in every case, although
the reductions were larger in the low aromatics gasoline (top panel of Figure 21) than in the high
aromatics gasoline (bottom panel of Figure 21).
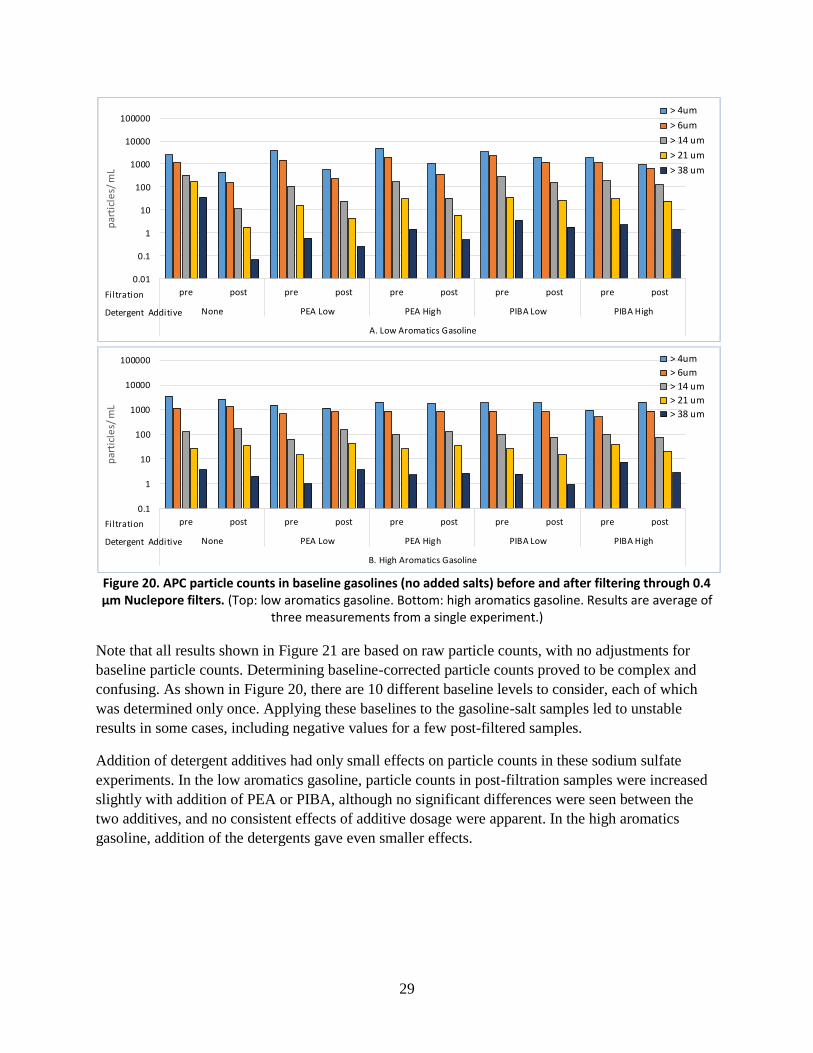
29
Figure 20. APC particle counts in baseline gasolines (no added salts) before and after filtering through 0.4 µm Nuclepore filters. (Top: low aromatics gasoline. Bottom: high aromatics gasoline. Results are average of
three measurements from a single experiment.)
Note that all results shown in Figure 21 are based on raw particle counts, with no adjustments for
baseline particle counts. Determining baseline-corrected particle counts proved to be complex and
confusing. As shown in Figure 20, there are 10 different baseline levels to consider, each of which
was determined only once. Applying these baselines to the gasoline-salt samples led to unstable
results in some cases, including negative values for a few post-filtered samples.
Addition of detergent additives had only small effects on particle counts in these sodium sulfate
experiments. In the low aromatics gasoline, particle counts in post-filtration samples were increased
slightly with addition of PEA or PIBA, although no significant differences were seen between the
two additives, and no consistent effects of additive dosage were apparent. In the high aromatics
gasoline, addition of the detergents gave even smaller effects.
0.01
0.1
1
10
100
1000
10000
100000
pre post pre post pre post pre post pre post
None PEA Low PEA High PIBA Low PIBA High
A. Low Aromatics Gasoline
par
ticl
es/
mL
> 4um
> 6um
> 14 um
> 21 um
> 38 um
Filtration
Detergent Additive
0.1
1
10
100
1000
10000
100000
pre post pre post pre post pre post pre post
None PEA Low PEA High PIBA Low PIBA High
B. High Aromatics Gasoline
par
ticl
es/
mL
> 4um
> 6um
> 14 um
> 21 um
> 38 um
Filtration
Detergent Additive

30
Figure 21. APC particle counts in gasolines with sodium sulfate - before and after filtering through 0.4 µm
Nuclepore filters. (Top: Low aromatics gasoline. Bottom: High aromatics gasoline. Raw counts are presented – not background corrected. Results are average of 3 measurements from a single experiment.)
Particle count results for the gasoline solubility/filtration experiments with sodium bisulfite are
depicted in Figure 22. Overall, these results are quite similar to the sodium sulfate results discussed
above, although the particle counts are somewhat higher in the case of sodium bisulfite, particularly
in the high aromatics gasoline. One noticeable difference is that in the high aromatics gasoline, the
pre-filtration particle counts are higher with sodium bisulfite as compared to sodium sulfate. The
effects of detergent additives in the sodium bisulfite experiments are similar to those seen with
sodium sulfate. In both cases, addition of detergents slightly increased post-filtration particle counts
in the low aromatics gasoline, but not in the high aromatics gasoline.
Based on the information obtained from this entire set of experiments with gasoline, we conclude
that sodium sulfate and sodium bisulfite behave similarly – both with respect to solubility and
particle counts. This is in contrast to the ethanol experiments, where these two salts differed
dramatically in their solubility behavior. The addition of detergent additives appears to have small
effects with respect to solubility and particle counts in low aromatics gasoline, but not in high
aromatics gasoline. Differences between detergent additive types (PEA and PIBA) and dosage levels
do not appear to be significant.
1
10
100
1000
10000
100000
pre post pre post pre post pre post pre post
None PEA Low PEA High PIBA Low PIBA High
A. Sodium Sulfate, Low Aromatics Gasoline
par
ticl
es/
mL
> 4um
> 6um
> 14 um
> 21 um
> 38 um
Filtration
Detergent Additive
0.1
1
10
100
1000
10000
100000
pre post pre post pre post pre post pre post
None PEA Low PEA High PIBA Low PIBA High
B. Sodium Sulfate, High Aromatics Gasoline
par
ticl
es/
mL
> 4um
> 6um
> 14 um
> 21 um
> 38 um
Filtration
Detergent Additive

31
Figure 22. APC particle counts in gasolines with sodium bisulfite - before and after filtering through 0.4 µm Nuclepore filters. (Top - Low aromatics gasoline; bottom - high aromatics gasoline. Raw counts are presented – not background corrected. Results are average of 3 measurements from a single experiment.)
4.5. Sodium sulfate behavior in gasoline-ethanol blends
To investigate the formation of sulfate deposits under more realistic conditions, a series of gasoline-
ethanol blends, spiked with low levels of sodium sulfate, were prepared. It was originally planned to
produce E10, E15, and E30 blends, in which the ethanol component of the blend contained 0, 2, 4,
and 8 ppm of sodium sulfate. These concentrations were selected to encompass a range from one-half
to twice the current sulfate standard for fuel ethanol. The sulfate-spiked solutions would then be
added to gasolines (both low and high aromatics) with and without inclusion of the PEA detergent
additive. To observe particle behaviors in these fuel blends, the APC instrument was planned to be
used to determine the particle count profile of each sample. The entire planned experimental matrix
of samples is shown in Table 4.
0.1
1
10
100
1000
10000
100000
pre post pre post pre post pre post pre post
None PEA Low PEA High PIBA Low PIBA High
A. Sodium Bisulfite, Low Aromatics Gasoline
par
ticl
es/
mL
> 4um
> 6um
> 14 um
> 21 um
> 38 um
Filtration
Detergent Additive
0.1
1
10
100
1000
10000
100000
pre post pre post pre post pre post pre post
None PEA Low PEA High PIBA Low PIBA High
B. Sodium Bisulfite, High Aromatics Gasoline
par
ticl
es/
mL
> 4um
> 6um
> 14 um
> 21 um
> 38 um
Filtration
Detergent Additive
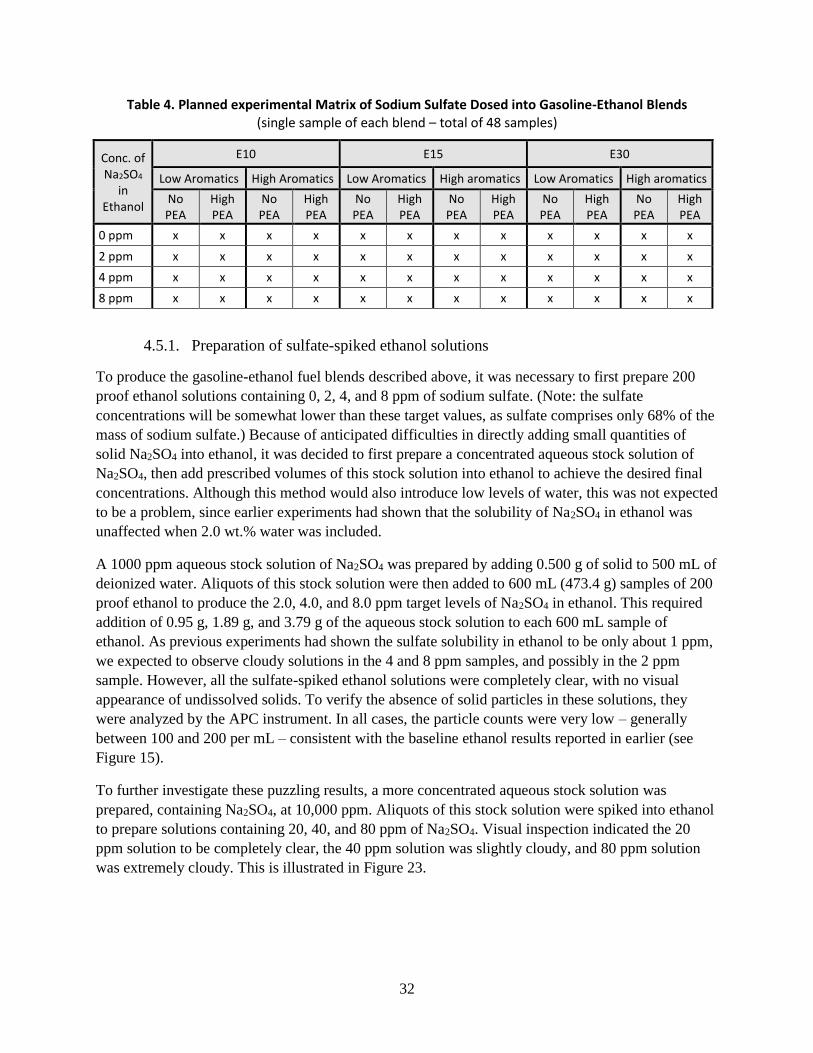
32
Table 4. Planned experimental Matrix of Sodium Sulfate Dosed into Gasoline-Ethanol Blends (single sample of each blend – total of 48 samples)
Conc. of Na2SO4
in Ethanol
E10 E15 E30
Low Aromatics High Aromatics Low Aromatics High aromatics Low Aromatics High aromatics
No PEA
High PEA
No PEA
High PEA
No PEA
High PEA
No PEA
High PEA
No PEA
High PEA
No PEA
High PEA
0 ppm x x x x x x x x x x x x
2 ppm x x x x x x x x x x x x
4 ppm x x x x x x x x x x x x
8 ppm x x x x x x x x x x x x
4.5.1. Preparation of sulfate-spiked ethanol solutions
To produce the gasoline-ethanol fuel blends described above, it was necessary to first prepare 200
proof ethanol solutions containing 0, 2, 4, and 8 ppm of sodium sulfate. (Note: the sulfate
concentrations will be somewhat lower than these target values, as sulfate comprises only 68% of the
mass of sodium sulfate.) Because of anticipated difficulties in directly adding small quantities of
solid Na2SO4 into ethanol, it was decided to first prepare a concentrated aqueous stock solution of
Na2SO4, then add prescribed volumes of this stock solution into ethanol to achieve the desired final
concentrations. Although this method would also introduce low levels of water, this was not expected
to be a problem, since earlier experiments had shown that the solubility of Na2SO4 in ethanol was
unaffected when 2.0 wt.% water was included.
A 1000 ppm aqueous stock solution of Na2SO4 was prepared by adding 0.500 g of solid to 500 mL of
deionized water. Aliquots of this stock solution were then added to 600 mL (473.4 g) samples of 200
proof ethanol to produce the 2.0, 4.0, and 8.0 ppm target levels of Na2SO4 in ethanol. This required
addition of 0.95 g, 1.89 g, and 3.79 g of the aqueous stock solution to each 600 mL sample of
ethanol. As previous experiments had shown the sulfate solubility in ethanol to be only about 1 ppm,
we expected to observe cloudy solutions in the 4 and 8 ppm samples, and possibly in the 2 ppm
sample. However, all the sulfate-spiked ethanol solutions were completely clear, with no visual
appearance of undissolved solids. To verify the absence of solid particles in these solutions, they
were analyzed by the APC instrument. In all cases, the particle counts were very low – generally
between 100 and 200 per mL – consistent with the baseline ethanol results reported in earlier (see
Figure 15).
To further investigate these puzzling results, a more concentrated aqueous stock solution was
prepared, containing Na2SO4, at 10,000 ppm. Aliquots of this stock solution were spiked into ethanol
to prepare solutions containing 20, 40, and 80 ppm of Na2SO4. Visual inspection indicated the 20
ppm solution to be completely clear, the 40 ppm solution was slightly cloudy, and 80 ppm solution
was extremely cloudy. This is illustrated in Figure 23.

33
Figure 23. Ethanol spiked with aqueous stock solution containing 10,000 ppm of Na2SO4. (From left to right, solutions contain 20, 40, and 80 ppm Na2SO4.)
APC measurements showed much greater particle counts in these three higher concentration
solutions, as compared to the solutions containing 2, 4, and 8 ppm Na2SO4. APC results from both
the low and high concentration solutions are shown graphically in Figure 24, where they are
presented using a logarithmic scale. Clearly, a dramatic change in particle counts occurred between
the 8 ppm and 20 ppm samples; yet, both of these samples appeared clear and bright, with no
insoluble material being visible to the human eye. At 40 ppm, the solution was slightly cloudy,
suggesting that particles formed from precipitation of Na2SO4 in ethanol become visible to the
human eye only when they exceed about 104/mL. These results also suggest that when added to
ethanol in the form of an aqueous solution, the solubility of sodium sulfate is at least an order of
magnitude higher than when added in solid, anhydrous form.
Figure 24. APC particle counts of ethanol spiked with aqueous solutions of Na2SO4. (The 2, 4, and 8 ppm solutions were prepared using a 1000 ppm aqueous Na2SO4 stock solution; the 20, 40,
and 80 ppm solutions were prepared using a 10,000 ppm aqueous Na2SO4 stock solution. Average of triplicate measurements.)
1
10
100
1000
10000
100000
0 ppm 2 ppm 4 ppm 8 ppm 20 ppm 40 ppm 80 ppm
APC Particle counts of Na2SO4 in Ethanol
>4 um >6 um >14 um >21 um >38 um
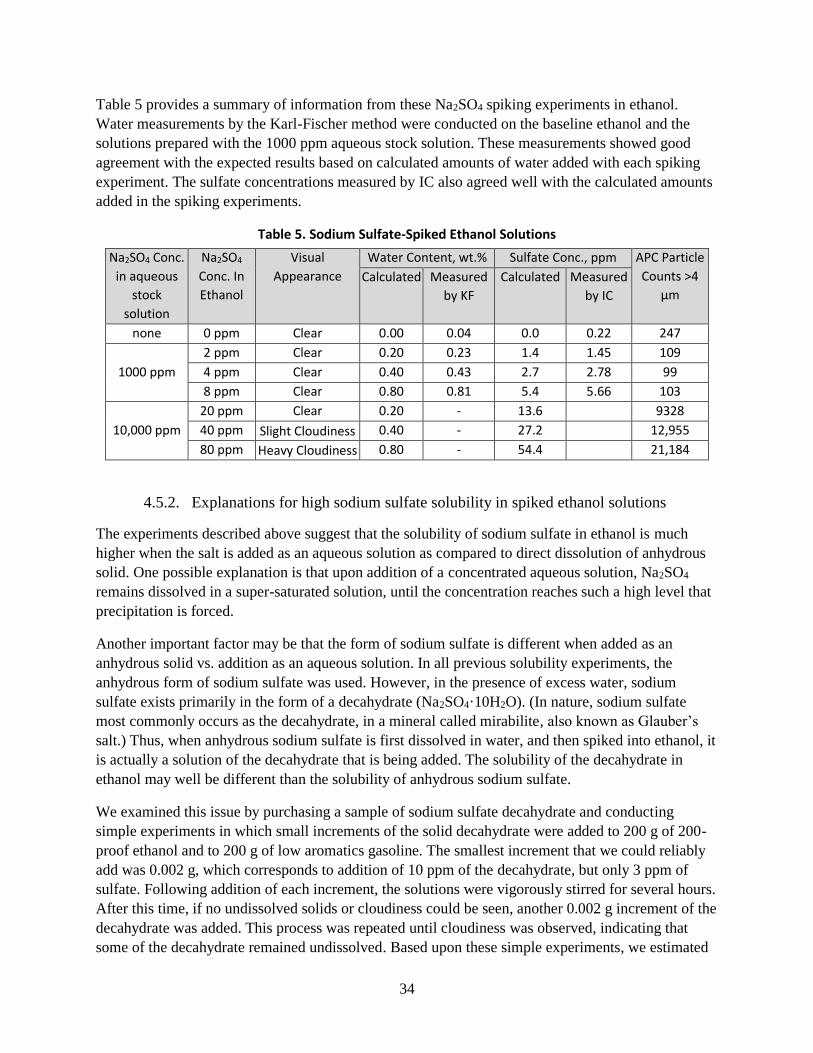
34
Table 5 provides a summary of information from these Na2SO4 spiking experiments in ethanol.
Water measurements by the Karl-Fischer method were conducted on the baseline ethanol and the
solutions prepared with the 1000 ppm aqueous stock solution. These measurements showed good
agreement with the expected results based on calculated amounts of water added with each spiking
experiment. The sulfate concentrations measured by IC also agreed well with the calculated amounts
added in the spiking experiments.
Table 5. Sodium Sulfate-Spiked Ethanol Solutions
Na2SO4 Conc.
in aqueous
stock
solution
Na2SO4
Conc. In
Ethanol
Visual
Appearance
Water Content, wt.% Sulfate Conc., ppm APC Particle
Counts >4
µm
Calculated Measured
by KF
Calculated Measured
by IC
none 0 ppm Clear 0.00 0.04 0.0 0.22 247
1000 ppm
2 ppm Clear 0.20 0.23 1.4 1.45 109
4 ppm Clear 0.40 0.43 2.7 2.78 99
8 ppm Clear 0.80 0.81 5.4 5.66 103
10,000 ppm
20 ppm Clear 0.20 - 13.6 9328
40 ppm Slight Cloudiness 0.40 - 27.2 12,955
80 ppm Heavy Cloudiness 0.80 - 54.4 21,184
4.5.2. Explanations for high sodium sulfate solubility in spiked ethanol solutions
The experiments described above suggest that the solubility of sodium sulfate in ethanol is much
higher when the salt is added as an aqueous solution as compared to direct dissolution of anhydrous
solid. One possible explanation is that upon addition of a concentrated aqueous solution, Na2SO4
remains dissolved in a super-saturated solution, until the concentration reaches such a high level that
precipitation is forced.
Another important factor may be that the form of sodium sulfate is different when added as an
anhydrous solid vs. addition as an aqueous solution. In all previous solubility experiments, the
anhydrous form of sodium sulfate was used. However, in the presence of excess water, sodium
sulfate exists primarily in the form of a decahydrate (Na2SO4·10H2O). (In nature, sodium sulfate
most commonly occurs as the decahydrate, in a mineral called mirabilite, also known as Glauber’s
salt.) Thus, when anhydrous sodium sulfate is first dissolved in water, and then spiked into ethanol, it
is actually a solution of the decahydrate that is being added. The solubility of the decahydrate in
ethanol may well be different than the solubility of anhydrous sodium sulfate.
We examined this issue by purchasing a sample of sodium sulfate decahydrate and conducting
simple experiments in which small increments of the solid decahydrate were added to 200 g of 200-
proof ethanol and to 200 g of low aromatics gasoline. The smallest increment that we could reliably
add was 0.002 g, which corresponds to addition of 10 ppm of the decahydrate, but only 3 ppm of
sulfate. Following addition of each increment, the solutions were vigorously stirred for several hours.
After this time, if no undissolved solids or cloudiness could be seen, another 0.002 g increment of the
decahydrate was added. This process was repeated until cloudiness was observed, indicating that
some of the decahydrate remained undissolved. Based upon these simple experiments, we estimated

35
that the solubility of the decahydrate in both ethanol and gasoline (at room temperature) is
approximately 20-30 ppm, expressed on a sulfate basis. Clearly, this is much higher than the
measured solubilities of anhydrous sodium sulfate in ethanol and gasoline. These observations cause
us to question whether some of the higher ethanol solubilities of sodium sulfate reported in the
literature were derived from using hydrated forms of the salt. In addition, the high sulfate levels
reported in some marketplace gasoline-ethanol blends (such as those shown in Figure 2) may have
been due to hydrated forms of sulfate salts, as the fuels probably would have appeared cloudy if they
had contained such high levels of anhydrous sulfate.
In solution, conversion between anhydrous salts and hydrated forms is possible. This conversion
influences the precipitation/crystallization process, and the apparent solubility of the salt. These
effects are dependent upon the solvent in which the salt is placed, as well as the temperature of the
system. Nordhoff and Ulrich investigated solvent-induced phase transformation of several salt
hydrates, including sodium sulfate decahydrate.27 They showed that when added to anhydrous
methanol, hydrated salts lost some of their water of hydration and converted to their anhydrous
pseudopolymorphs. (The term “pseudopolymorph” is used in referring to an anhydrous salt and its
various hydrated forms.) This raises the possibility of a fully dissolved hydrated salt in a given fuel
blend becoming dehydrated (and insoluble) when mixed with another fuel having lower water
content. These authors also pointed out the difficulties of experimentally determining the solubilities
of salts in such metastable situations.
More recently, Toro et al. investigated the solubility of sodium sulfate in a mixed solvent of water
and ethanol.28 Ethanol concentrations were varied over a range of 0-50%; temperatures of 25 °C and
35°C were used. In saturated solutions, the composition of the precipitated/crystallized salt varied
with temperature. At 25 °C, the precipitated salt was sodium sulfate decahydrate; at 35 °C, the
precipitated salt was anhydrous sodium sulfate. This literature information further confirms that
determining the solubilities of sulfate salts in mixed solvents is quite difficult, and helps explain the
complex nature of the field problems with marketplace gasoline-ethanol fuel blends.
4.5.3. Preparation of gasoline-ethanol blends
The observation that sodium sulfate’s solubility in ethanol appears to depend upon the method of
addition introduces complexities into the experimental plan that was originally laid out. In actual
field situations, water is often present, perhaps resulting in sodium sulfate (and other sulfates) being
present in hydrated form, or allowing for interconversion among different pseudopolymorphs. It is
also possible that these complexities contribute to the apparent inconsistencies and sporadic nature of
the field problems as originally reported upon blending of ethanol with gasoline in the early-mid
2000’s.
To address the situation of sodium sulfate’s higher solubility when added to ethanol as an aqueous
solution, the experimental matrix was modified from the original plans shown in Table 4. Due to
limitations of time, materials, personnel, and funding, we decided to examine E10, E15, and E30
blends using only a single low aromatics gasoline (without detergent additive) and a single high
aromatics gasoline (containing PEA detergent additive). However, the concentration range of sodium
sulfate in these gasoline-ethanol blends was expanded beyond the original plan to include much
higher levels of sodium sulfate. The entire experimental matrix is shown in Table 6.

36
Table 6. Experimental Matrix of Sodium Sulfate Dosed into Gasoline-Ethanol Blends
Conc. of Na2SO4 in Ethanol
Added Water
Content in EtOH, wt.%
E10 E15 E30
Low Aromatics
High Aromatics
Low Aromatics
High Aromatics
Low Aromatics
High Aromatics
No PEA High PEA No PEA High PEA No PEA High PEA
0 ppm 0.00 x x x
2 ppm 0.16 x x x x x x
4 ppm 0.32 x x x
8 ppm 0.63 x x x
12 ppm 0.95 x x x
16 ppm 1.26 x x x x x x
24 ppm 1.89 x x x x x x
32 ppm 2.52 x x x x x x
All the sulfate-dosed ethanol solutions used to produce these fuel blends were prepared by spiking
200-proof ethanol with an aqueous solution of 1000 ppm sodium sulfate. The amount of water that
was added to each ethanol solution by this spiking method is also shown in Table 6. Blends
containing the high aromatics gasoline were pale yellow in color; those containing low aromatics
gasoline were colorless. All blends appeared clear and bright, with no cloudiness or particulate
matter being seen, even at the highest concentration sample containing 32 ppm of Na2SO4.
4.5.4. Particle counts in gasoline-ethanol blends
Particle counts were measured for each of the gasoline-ethanol blends shown in Table 6 using the
APC instrument and procedures as described previously. Numerical results are provided in Appendix
Table II-3, with graphical summaries being shown in Figure 25. All the fuel blends were observed to
have similar, relatively low numbers of particles, with no clear effects seen for ethanol blending
ratio, aromatics content, or sulfate content. These results confirm that the hydrated form of sodium
sulfate has very different solubility behavior compared to the anhydrous form.
Earlier experiments in which an aqueous solution of Na2SO4 was added to ethanol to produce a range
of concentrations from 2 to 80 ppm (shown in Figure 24), revealed a sharp jump in particle numbers
between the 8 ppm and 20 ppm samples. A similar increase in particle numbers with increasing
sulfate concentration is not seen in the results of Figure 25. One key difference is that the samples
shown in Figure 24 were produced using two different aqueous stock solutions of Na2SO4: samples
with concentrations up to 8 ppm were prepared with a 1000 ppm stock solution, while those with
concentration of 20 ppm and higher were prepared with a 10,000 ppm stock solution. In contrast, all
samples shown in Figure 24 were prepared using the 1000 ppm stock solution. Consequently, the
samples containing sodium sulfate at levels of 12 ppm and above all had higher water contents than
any of the samples shown in Figure 24.
To investigate whether the additional amount of water included in the gasoline-ethanol fuel blends
may be responsible for the apparent complete dissolution of sodium sulfate even at these higher
concentrations, additional samples of the 24 ppm and 32 ppm E10 blends shown in Table 6 were
prepared using the 10,000 ppm aqueous stock solution rather than the 1000 ppm stock solution.

37
Although these solutions also appeared clear and bright, the APC particle counts were about 2-3
times higher than in the blends prepared using the 1000 ppm stock solution. These results further
illustrate the complex nature of sulfate solubilities in multi-component solutions, and the important
roles that water and order of addition can play.
Figure 25. APC particle counts (>4 µm) in gasoline-ethanol blends spiked with Na2SO4. (Numbers along x-axis indicate concentration (ppm) of Na2SO4 in the ethanol blend component. Orange bars are low aromatics blends; blue bars are high aromatics blends. An aqueous solution of 1000 ppm Na2SO4 was used to dose each ethanol solution at the indicated sulfate concentration.)
5. Summary and Conclusions
Through a combination of literature reviews and experimental work, issues related to inorganic
sulfate contamination in gasoline-ethanol fuel blends were examined. Information collected during
the mid-2000’s (when documented field problems were experienced with sulfate-contaminated fuels)
indicated that the non-oxygenated gasoline components being used contained negligible levels of
inorganic sulfate. Therefore, the contamination observed in marketplace fuels at that time was
thought to originate from the ethanol blending component.
A possible cause of sulfate contamination in fuel ethanol arises from improper operation of bisulfite
scrubber systems used to control air emissions of aldehydes from ethanol production plants. Use of
excessive bisulfite can lead to contamination of the ethanol product with sulfurous acid (H2SO3), also
known as aqueous SO2. Other sources of SO2 or bisulfite within ethanol plants could be contributing
factors. These ethanol-soluble, but volatile forms of potential sulfate can be distilled with the ethanol,
thereby being present in the final fuel ethanol product. Subsequent oxidation to sulfate during fuel
transport, storage and use could contribute to the deposit formation and filter plugging problems that
were observed in the past. Importantly, the current ASTM sulfate specification may not be fully
protective against these sulfate field problems, as it is based on measurement of existent sulfate, but
does not include forms of potential sulfate such as sulfurous acid.
The solubilities of anhydrous calcium, potassium, and sodium sulfate salts in 200-proof ethanol are
very low (<1 ppm) and are not significantly affected by addition of small amounts of water (2 wt.%)
to the ethanol. Ammonium sulfate appears to be slightly more soluble in ethanol (~10 ppm), while
sodium bisulfite has much greater solubility (>100 ppm). In non-oxygenated gasoline, sodium sulfate
1
10
100
1000
10000
0 2 4 8 12 16 20 24 28 32 0 2 4 8 12 16 24 32 0 2 4 8 12 16 24 32 0 2 4 8 12 16 24 32 0 2 4 8 12 16 24 32 0 2 4 8 12 16 24 32 0 2 4 8 12 16 24 32
No Detergent No Detergent High PEA None High PEA No Detergent High PEA
- Low Aromatics High Aromatics Low Aromatics High Aromatics Low Aromatics High Aromatics
E100 E10 E15 E30
Part
icle
Cou
nt,
No.
/mL
Sulfate Conc. (ppm)

38
and sodium bisulfite were both shown to have negligible solubility (~1 ppm). The solubility of
sodium sulfate in gasoline was not affected by aromatics content, type of detergent additive used, or
concentration of detergent additive. Additive type and concentration may have slight effects on the
solubility of sodium bisulfite in gasoline, although additional work is necessary to confirm this.
We are not aware of any evidence that sodium bisulfite is a common contaminant in fuel ethanol.
However, should this occur, it would likely contribute to fuel filter plugging and deposit problems
due to two different mechanisms: (1) solubilized sodium bisulfite in neat ethanol would de-solubilize
upon blending the ethanol into gasoline, and (2) bisulfite in the blended fuel would gradually oxidize
to form insoluble sulfate.
Particle number counts determined using a Seta Analytics SA1000 automatic particle counter (APC)
were of moderate use in assessing inorganic sulfate contamination issues, as high experimental
variability limited quantitative reliability of the measurements. Solutions of both ethanol and gasoline
having excess amounts of sulfate salts were found to contain large numbers of particles >4 µm in size
(typically 104-105 particles/mL), although these solutions appeared clear and bright to the human eye.
Filtration of these sulfate-containing solutions through 0.4 µm Nuclepore filters reduced the number
of particles by about an order of magnitude. [As a point of reference, the base ethanol and gasoline
samples that were used (without any added sulfate salts) contained 102-103 particles/mL.] Changes in
the many experimental parameters that were examined (e.g., addition of 2 wt.% water to ethanol,
high vs. low aromatics content of gasoline, type and dosage of detergent additive) had minimal
effects on particle number counts.
Finally, the behavior of sodium sulfate at low concentrations was investigated in E10, E15, and E30
fuel blends. To produce ethanol blending components containing low levels of sulfate (2-32 ppm),
appropriate amounts of a concentrated aqueous stock solution of sodium sulfate were spiked into the
ethanol. This led to the surprising observation that the solubility of sodium sulfate in ethanol is much
higher when the salt is added in its hydrated form, as opposed to its anhydrous form. Simple
experiments were conducted to confirm that sodium sulfate decahydrate is more soluble in both
ethanol and gasoline (by at least an order of magnitude) as compared to its anhydrous form.
These extreme differences in solubility between hydrous and anhydrous forms of sulfate salts, and
the possibility of converting from one form to the other, greatly complicate efforts to ascertain sulfate
solubilities and deposit formation under real-world field conditions. Also, the major effect of hydrous
vs. anhydrous sulfate likely obscures any minor effects that may exist due to temperature, aromatics
content, detergent type, etc. Such complexities may also help explain the apparent inconsistencies
and sporadic nature of the field problems that were investigated in the early-mid 2000’s.
Based upon the work conducted in this project, we are unable to confirm the suitability of the
existing 4 ppm sulfate specification for fuel ethanol. However, it should be pointed out that a 4 ppm
level of anhydrous sulfate exceeds the solubility limit in neat ethanol. Using ethanol containing 4
ppm sulfate to produce E10 would dilute the sulfate to a level that is likely to be completely soluble.
This may not be the case if the ethanol were used to produce E20 or E30 fuel blends. However, a
more significant concern with increasing ethanol content may be exacerbation of water
contamination issues in marketplace fuels. As shown in this work, the manner in which sulfate salts

39
are exposed to water greatly affects their solubility in fuel blends, and likely their propensity to cause
filter plugging deposits.
6. Recommendations
The topic of inorganic sulfate in gasoline-ethanol blends has proven to be more complex than
originally thought. Despite great care taken in the laboratory, the extremely low solubilities of the
anhydrous sulfate materials, and their conversion to hydrated pseudopolymorphs in the presence of
water, make accurate determination of sulfate solubilities very challenging. Consequently, this work
is unable to confirm or refute the suitability of the current ASTM 4 ppm max. sulfate specification
for fuel ethanol. To examine this issue further, it is recommended that additional testing conditions
be used, that would be more representative of actual field situations. For example, continuous
filtration tests could be conducted to assess filter-plugging tendencies of different fuel blends. Such
tests could be performed using a range of fuel blends and sulfate levels, both with and without
exposures to water bottoms.
It is also recommended that any further experiments be conducted on a larger scale than was used in
this project. Conducting small, laboratory bench top experiments requires extremely small quantities
of sulfate salts, which are difficult to handle and measure with high precision. For example,
producing a 1-L fuel sample containing 1 ppm of sulfate requires addition of 0.0011g of anhydrous
sodium sulfate. Scaling this up to 1 barrel of fuel would increase the required amount of sodium
sulfate to 0.176g, which would be much easier to handle.
A final recommendation is that when monitoring the concentration of inorganic sulfate in fuel
ethanol for compliance with the ASTM D4806 standard, both existent and potential sulfate should be
measured. This would provide protection against the possibility of unacceptably high levels of
oxidizable forms of inorganic sulfur being present, which could contribute to enhanced levels of
sulfate resulting from subsequent oxidation throughout the fuel distribution and storage system.
7. References 1. McCormick R.L., T.L. Alleman, and J. Yanowitz; Sulfate Salts in Gasoline and Ethanol Fuels -
Historical Perspective and Analysis of Available Data. NREL/TP-5400-69001, 1-36. 2017.
2. ASTM International; ASTM D4806. Standard Specification for Denatured Fuel Ethanol for Blending
with Gasolines for Use as Automotive Spark-Ignition Engine Fuel. Designation: D4806 - 15, 1-8. 2015.
3. Solubilities of Inorganic and Organic Compounds - Vol. 1: Binary Systems. Stephen, H and Stephen, T,
Pergamon Press, 1963.
4. Vener, R. E. and A. R. Thompson; Solubility and Density Isotherms: Sodium Sulfate-Ethyl Alcohol-
Water. Industrial and Engineering Chemistry, 42, (1), 171-174. 1950.
5. Seidell, A.; Solubilities of Inorganic and Organic Compounds. 2nd Ed., Van Nostrand Company, 1919.
6. Okorafor, O. C.; Solubility and Density Isotherms for the Sodium Sulfate-Water-Methanol System.
J.Chem.Eng.Data, 44, 488-490. 1999.
7. Minutes of ASTM D02.A0 Gasoline and Oxygenated Fuel; Open Forum on Sulfates. 2005.
40
8. ASTM International; ASTM D7319. Test Method for Determination of Existent and Potential Sulfate
and Inorganic Chloride in Fuel Ethanol and Butanol by Direct Injection Suppressed Ion
Chromatography. 2013.
9. ASTM International; ASTM D7328. Standard Test Method for Determination of Existent and Potential
Inorgainc Sulfate and Total Inorganic Chloride in Fuel Ethanol by Ion Chromatography Using Aqueous
Sample Injection. D7328-13, 1-8. 2013.
10. Zhang, Y.; Sulfur Concentration in Distiller's Dried Grains with Soluble (DDGS) and Its Impact on
Palatability and Pig Performance. NPB #08-093, 1-38. National Corn-to-Ethanol Research Center, 2010.
11. Walker, G.M.; Bioethanol: Science and technology of fuel alcohol. 1-114. 2010 Graeme M. Walker &
Ventus Publishing ApS, 2010.
12. Clifford, C.M.; How corn is processed to make ethanol. Penn State University, https://www.e-
education.psu.edu/egee439/node/673. 2015.
13. AMG Inc.; Corn Milling: wet vs. dry. http://blog.amg-eng.com/corn-wet-milling-vs-dry-milling/. 2013.
14. Rendleman, C.M. and H. Shapouri; New Technologies in Ethanol Production. AER-842, 1-33. Office of
Energy Policy and New Uses, USDA, 2007.
15. Onuki, S.; Bioethanol: Industrial production process and recent studies. Iowa State, 1-12.
www.public.iastate.edu/~tge/courses/ce521/sonuki.pdf. 2006.
16. U.S.Water Services; Reducing Sulfur in Distillation to Improve Production and Meet Final Product
Specifications. http://www.ethanolfinalfilter.com/sulfate-whitepaper/. 2014.
17. U.S.Grains Council; Chapter 12. Sulfur Concerns and Benefits in DDGS. Third Edition, U.S. Grains
Council DDGS User Handbookl: A Guide to Distiller's Dried Grains With Solubles (DDGS). 2012.
18. Oates, K., B. DeBorba, and J. Roher; Determination of Anions in Dried Distillers Grains with Solubles.
Application Note 1044, 1-5. Thermo Fisher Scientific, Sunnvale, CA, 2012.
19. Clark, J.; Simple addition to aldehydes and ketones. Chemguide: Helping you to understand Chemistry,
http://www.chemguide.co.uk/organicprops/carbonyls/addition.html. 2015.
20. Singh, V.; Water Use in Bioethanol Production. Illinois Water Conference, Illinois Water Conference
http://web.extension.illinois.edu/iwrc/pdf/presentations/Vijay%20Singh.pdf. 2008.
21. E85 Deposit Group of CEN/TC 19/WG21. N327, http://cen.iso.org/livelink/livelink/open/centc19wg21.
2016.
22. Keuken, H.; PDC Memo to CEN/TC 19/WG 21/EFTF: Sulfate and Water in E10, E25, and E85. 2013.
23. Roelant, R., E. van der Pol, and H. Keuken; Economic evaluation of possible measures to prevent sulfate
deposit issues in E85. Process Design Center B.V., 2016.
24. ASTM International; ASTM E1064. Standard Test Method for Water in Organic Liquids by
Coulometric Karl Fischer Titration. E1064-12, 1-5. 2012.
25. ASTM International; ASTM D5452. Standard Test Method for Particulate Contamination in Aviation
Fuels by Laboratory Filtration. Designations D5452-12, 423/97, 1-11. 2015.
26. ASTM International; ASTM D7619. Standard Test Method for Sizing and Counting Particles in Light
and Middle Distillate Fuels, by Automatic Particle Counter. D7619-12b, 1-10. 2012.
27. Nordhoff, S. and J. Ulrich; Solvent-Induced Phase Transormations of Hydrates. J.Thermal Analysis and Calorimetry, 57, 181-192. 1999.
28. Ojeda Toro, J. C., I. Dobrosz-Gómez, and M. Á. Gómez García; Sodium Sulfate Solubility in (Water + Ethanol) Mixed Solvents in the Presence of Hydrochloric Acid: Experimental Measurements and
Modeling. Fluid Phase Equilibria, 384, 106-113. 2014.

41
Appendix I
Sulfate Solubility in Ethanol and Gasoline
Determined by ion chromatographic measurements of filtrate solutions
Table I-1: Sulfate solubility in ethanol
Table I-2: Sulfate solubility in gasoline

42
Table I-1: Sulfate Solubility in Ethanol
Sulfate concentration in filtrate determined by ion chromatography (IC) using ASTM D7328
Sulfate Salt
Water
Content,
wt.%
Temp.,
°C
Rep.
No.
Sulfate Conc. in Filtrate, ppm
Existent Potential
Ammonium
Sulfate
0.0 25 1 127.24 68.73
0.0 25 2 5.35 7.39
2.0 25 1 9.64 12.84
Calcium Sulfate 0.0 25 1 1.00 2.75
2.0 25 1 0.52 2.56
Potassium
Sulfate
0.0 25 1 0.57 1.36
2.0 25 1 1.04 1.63
Sodium Sulfate
0.0 25 1 0.36 0.84
0.0 25 2 0.74 0.98
0.0 25 3 - 0.79
0.0 5 1 0.62 1.74
0.0 5 2 0.60 1.12
0.0 5 3 0.80 2.75
2.0 25 1 0.46 0.56
2.0 25 2 0.45 0.71
2.0 25 3 0.52 0.73
Sodium Bisulfite
0.0 25 1 194.33 651.68
0.0 25 2 24.13 721.18
0.0 25 3 76.67 470.38
0.0 5 1 49.41 342.83
0.0 5 2 70.52 301.02
0.0 5 3 25.34 317.40
2.0 25 1 782.26 880.16
2.0 25 2 493.00 895.99
2.0 25 3 259.06 826.73
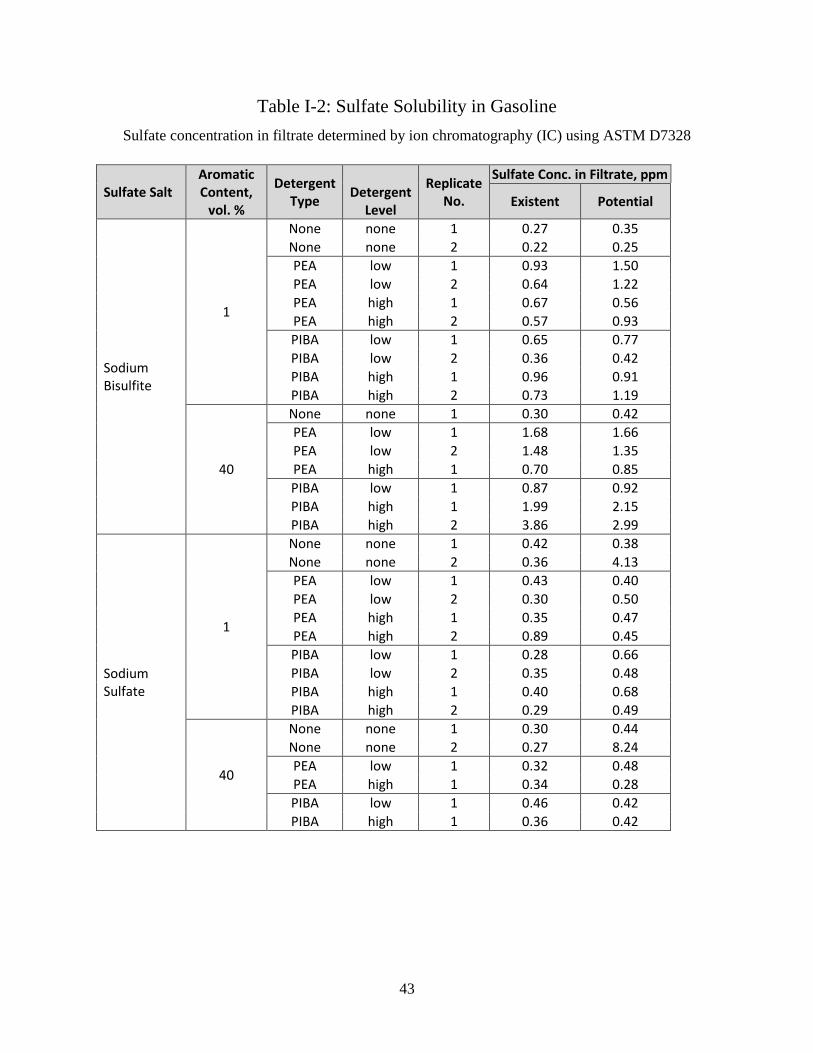
43
Table I-2: Sulfate Solubility in Gasoline
Sulfate concentration in filtrate determined by ion chromatography (IC) using ASTM D7328
Sulfate Salt Aromatic Content,
vol. %
Detergent Type
Detergent Level
Replicate No.
Sulfate Conc. in Filtrate, ppm
Existent Potential
Sodium Bisulfite
1
None none 1 0.27 0.35 None none 2 0.22 0.25 PEA low 1 0.93 1.50 PEA low 2 0.64 1.22 PEA high 1 0.67 0.56 PEA high 2 0.57 0.93 PIBA low 1 0.65 0.77 PIBA low 2 0.36 0.42 PIBA high 1 0.96 0.91 PIBA high 2 0.73 1.19
40
None none 1 0.30 0.42 PEA low 1 1.68 1.66 PEA low 2 1.48 1.35 PEA high 1 0.70 0.85 PIBA low 1 0.87 0.92 PIBA high 1 1.99 2.15 PIBA high 2 3.86 2.99
Sodium Sulfate
1
None none 1 0.42 0.38 None none 2 0.36 4.13 PEA low 1 0.43 0.40 PEA low 2 0.30 0.50 PEA high 1 0.35 0.47 PEA high 2 0.89 0.45 PIBA low 1 0.28 0.66 PIBA low 2 0.35 0.48 PIBA high 1 0.40 0.68 PIBA high 2 0.29 0.49
40
None none 1 0.30 0.44 None none 2 0.27 8.24 PEA low 1 0.32 0.48 PEA high 1 0.34 0.28 PIBA low 1 0.46 0.42 PIBA high 1 0.36 0.42
44
Appendix II
Particle Counts of Sulfate Salt Solutions in Ethanol, Gasoline, and
Gasoline-Ethanol Blends
Table II-1: Particle counts of sulfate salts in ethanol solutions
Table II-2: Particle counts of sulfate salts in gasoline solutions
Table II-3: Particle counts of sodium sulfate in gasoline-ethanol blends

45
Table II-1: Particle Counts of Sulfate Salts in Ethanol Solutions
Sulfate Salt
Water
Content,
wt. %
Temp.,
°C
APC Particle Counts/mL
Pre-Filter Post-Filter
>4 µm >6 µm >14 µm >21 µm >38 µm >4 µm >6 µm >14 µm >21 µm >38 µm
none
0.0 25 136 87 33 15 3 2173 1095 210 59 7
0.0 25 196 89 12 4 1 462 234 61 21 3
2.0 25 145 72 14 5 2 327 166 37 12 1
Ammonium
Sulfate
0.0 25 69379 55749 15244 3710 134 21461 15800 3450 700 31
2.0 25 26053 19479 6252 2272 165 1761 1006 164 44 5
Calcium Sulfate 0.0 25 51142 50143 40724 29684 10558 14544 11862 4386 779 7
2.0 25 65201 64048 53180 41102 16949 17618 14357 4623 803 19
Potassium
Sulfate
0.0 25 48783 39569 17567 8508 793 3583 1848 477 123 3
2.0 25 58730 51614 26055 13720 2379 6355 3410 814 264 13
Sodium
Bisulfite
0.0 25 61781 45286 6920 1530 181 34483 13945 617 144 12
0.0 25 67516 52755 9380 1769 67 3646 1556 241 53 4
0.0 25 62636 46271 6359 1126 62 4038 1992 278 60 4
0.0 5 63618 47009 7563 1884 139 903 603 162 48 4
0.0 5 64286 47242 7012 1636 153 3537 2051 366 121 17
0.0 5 64573 48801 8400 1900 81 1627 1015 236 60 4
2.0 25 61033 46205 7956 1995 233 52500 17851 350 69 4
2.0 25 61851 46354 7823 1974 216 59110 13763 178 42 3
2.0 25 61171 43872 6108 1409 145 49178 12153 151 30 2
Sodium Sulfate
0.0 25 38556 18397 1601 167 2 1391 906 187 40 2
0.0 25 66649 46769 7535 1090 14 2035 1252 273 64 2
0.0 25 63335 41291 4577 404 3 1959 1193 236 47 2
0.0 5 40768 21170 1925 201 2 1822 1119 265 55 3
0.0 5 54646 30882 3292 325 6 2033 1083 238 50 3
0.0 5 47203 26667 2626 241 3 1504 806 188 34 2
2.0 25 59209 44611 10627 2425 76 2780 1636 279 60 6
2.0 25 57133 37195 4897 605 10 1493 957 288 48 3
2.0 25 55443 37623 7269 1429 30 1814 1291 422 98 7
46
Table II-2: Particle Counts of Sulfate Salts in Gasoline
Sulfate Salt
Arom., Vol. %
Detergent Type
Detergent Level
APC Particle Counts/mL
Pre-Filter Post-Filter
>4 µm >6 µm >14 µm >21 µm
>38 µm
>4 µm >6 µm >14 µm >21 µm
>38 µm
None
1
None none 2449 1171 346 168 36 448 158 12 2 0
PIBA low 3511 2259 288 36 4 2003 1170 155 27 2
PIBA high 1899 1182 189 31 2 943 679 123 24 1
PEA low 3892 1488 108 16 1 561 230 25 4 0
PEA high 4797 1979 169 31 1 1004 370 33 6 1
40
None none 3478 1189 122 28 4 2666 1297 165 34 2
PIBA low 1807 858 92 26 2 1912 792 78 15 1
PIBA high 936 507 98 39 7 1999 853 78 19 3
PEA low 1479 671 65 14 1 1179 798 153 41 4
PEA high 2011 862 96 25 2 1776 864 128 34 3
Sodium Bisulfite
1
None none 38461 22917 1628 132 3 1463 829 118 20 1
None none 70141 49293 4671 329 2 1845 1272 250 43 1
PIBA low 50214 27923 1820 206 4 12110 9678 2509 593 34
PIBA low 58049 35863 2567 267 21 4780 3105 544 95 5
PIBA high 48836 27695 2236 224 2 5219 3281 635 130 6
PIBA high 61131 36566 2700 226 2 4820 3013 746 217 14
PEA low 69879 53437 9256 1186 7 7706 4139 477 67 2
PEA low 68141 52078 9798 1256 7 8203 4878 886 147 3
PEA high 70812 57662 13780 2196 14 15452 10949 2749 861 41
PEA high 70170 55775 11800 1721 14 9839 6020 954 218 11
40
None none 50143 25555 1104 73 2 3229 1942 292 38 2
PIBA low 32032 16858 781 54 2 2545 1634 139 19 1
PIBA high 55933 34294 2282 132 1 3457 2170 367 73 4
PEA low 64927 39444 2386 153 1 3957 2278 220 29 1
PEA high 53712 29775 1547 90 2 4663 2984 516 124 9
Sodium Sulfate
1
None none 65193 42571 3043 222 17 617 394 108 19 1
None none 36770 21172 1772 132 2 1542 1027 224 51 4
PIBA low 52439 26559 776 26 1 1416 716 105 25 3
PIBA low 71250 47407 3314 157 2 2094 1007 101 18 1
PIBA high 67713 38134 973 40 2 2634 1331 130 23 2
PIBA high 59439 29826 816 45 2 1843 1030 193 26 1
PEA low 52733 29931 2905 389 8 1656 1287 398 43 1
PEA low 61697 37190 2737 208 3 4997 4008 741 101 2
PEA high 22985 8083 415 21 0 1347 868 259 55 5
PEA high 35845 16419 951 63 3 1377 755 133 26 2
40
None none 13305 4147 278 36 1 1818 1256 251 27 1
None none 7824 2748 107 10 0 2184 1452 315 66 3
PIBA low 7810 2332 61 8 1 1375 756 85 15 2
PIBA high 6795 2319 74 8 1 2412 1181 127 21 2
PEA low 10752 4565 250 33 2 4229 2382 210 26 1
PEA high 5153 2207 115 21 2 1926 1096 104 15 1
47
Table II-3: Particle Counts of Sodium Sulfate in Gasoline-Ethanol Blends
Fuel Blend
Arom., Vol. %
Detergent Type
Conc. of Na2SO4 in
EtOH, ppm >4 µm >6 µm >14 µm >21 µm >38 µm
E100 None None
0 1714 739 100 20 1
2 1125 546 106 24 2
4 803 276 86 26 2
8 669 293 64 17 2
12 736 322 63 17 2
16 603 272 61 17 2
20 2827 1120 198 45 4
24 2310 1086 210 54 6
28 2630 1151 205 50 5
32 911 440 107 29 3
E10
1 None
2 2132 868 46 5 0
16 2513 1076 71 6 0
24 2048 799 61 10 1
32 2658 1570 188 27 1
40 PEA
0 1713 709 54 6 0
2 1712 729 52 5 0
4 1622 645 44 5 0
8 1433 572 44 5 0
12 1375 556 40 6 0
16 1369 541 34 3 0
24 5066 2288 245 32 1
32 1306 740 173 37 1
E15
1 None
2 3917 1885 148 14 1
16 4433 2163 157 18 1
24 3138 1636 127 16 1
32 2857 1548 161 24 1
40 PEA
0 1372 565 43 5 0
2 1208 542 45 5 0
4 1296 597 56 7 0
8 1835 825 73 6 0
12 1280 534 44 5 0
16 1261 527 47 6 0
24 1990 987 149 23 1
32 1782 914 150 23 1
E30
1 None
2 2968 1415 169 28 2
16 2517 1200 141 20 1
24 4150 2134 226 35 2
32 3977 2087 231 36 2
40 PEA
0 1531 679 73 10 1
2 1500 748 109 19 1
4 1134 585 88 14 1
8 1394 685 97 16 1
12 1427 712 110 20 2
16 1468 733 109 20 1
24 2480 1211 176 31 1
32 2448 1165 168 30 1