Crash Testing and Evaluation of F-Shape Barriers on Slopes
86
Technical Report Documentation Page 1. Report No. FHWA/TX-08/0-5210-3 2. Government Accession No. 3. Recipient's Catalog No. 5. Report Date September 2007 Published: March 2008 4. Title and Subtitle CRASH TESTING AND EVALUATION OF F-SHAPE BARRIERS ON SLOPES 6. Performing Organization Code 7. Author(s) Nauman M. Sheikh, Roger P. Bligh, and Wanda L. Menges 8. Performing Organization Report No. Report 0-5210-3 10. Work Unit No. (TRAIS) 9. Performing Organization Name and Address Texas Transportation Institute The Texas A&M University System College Station, Texas 77843-3135 11. Contract or Grant No. Project 0-5210 13. Type of Report and Period Covered Technical Report: September 2004 – August 2007 12. Sponsoring Agency Name and Address Texas Department of Transportation Research and Technology Implementation Office P.O. Box 5080 Austin, Texas 78763-5080 14. Sponsoring Agency Code 15. Supplementary Notes Project performed in cooperation with the Texas Department of Transportation and the Federal Highway Administration. Project Title: Roadside Crash Testing Program for Design Guidance and Standard Detail Development URL: http://tti.tamu.edu/documents/0-5210-3.pdf 16. Abstract The TxDOT Roadway Design Manual currently suggests that concrete barrier not be placed on slopes steeper than 10H:1V. This suggestion has limited the placement of concrete barriers to narrow, flat, paved medians or at the edge of the shoulder. Based on the results of full-scale crash testing, researchers determined that TxDOT’s cast-in-place permanent F-shape barrier and the precast free-standing X-bolt F-shape barrier are suitable for placement on roadside and median foreslopes of 6H:1V or less. Additionally, these barriers are suitable to be placed at any lateral offset from the roadway edge, and for any width of depressed V-ditch median as long as the barrier is placed at its center. Further, similar or better performance would be expected for barrier placement on more gentle (e.g., 8H:1V) slopes. Increasing the maximum slope on which median barriers can be placed will allow many installations to be placed further from the travelway, which in turn will most likely lead to a reduction in barrier impact frequency and severity. 17. Key Words Median Barriers, Portable Concrete Barriers, F-Shape Barriers, Roadside Slopes, Crash Testing, Roadside Safety, Finite Element Analysis, Simulation 18. Distribution Statement No restrictions. This document is available to the public through NTIS: National Technical Information Service Springfield, Virginia 22161 http://www.ntis.gov 19. Security Classif.(of this report) Unclassified 20. Security Classif.(of this page) Unclassified 21. No. of Pages 86 22. Price Form DOT F 1700.7 (8-72) Reproduction of completed page authorized
-
Upload
nguyenminh -
Category
Documents
-
view
218 -
download
0
Transcript of Crash Testing and Evaluation of F-Shape Barriers on Slopes

Technical Report Documentation Page 1. Report No. FHWA/TX-08/0-5210-3
2. Government Accession No.
3. Recipient's Catalog No. 5. Report Date September 2007 Published: March 2008
4. Title and Subtitle CRASH TESTING AND EVALUATION OF F-SHAPE BARRIERS ON SLOPES
6. Performing Organization Code
7. Author(s) Nauman M. Sheikh, Roger P. Bligh, and Wanda L. Menges
8. Performing Organization Report No. Report 0-5210-3 10. Work Unit No. (TRAIS)
9. Performing Organization Name and Address Texas Transportation Institute The Texas A&M University System College Station, Texas 77843-3135
11. Contract or Grant No. Project 0-5210 13. Type of Report and Period Covered Technical Report: September 2004 – August 2007
12. Sponsoring Agency Name and Address Texas Department of Transportation Research and Technology Implementation Office P.O. Box 5080 Austin, Texas 78763-5080
14. Sponsoring Agency Code
15. Supplementary Notes Project performed in cooperation with the Texas Department of Transportation and the Federal Highway Administration. Project Title: Roadside Crash Testing Program for Design Guidance and Standard Detail Development URL: http://tti.tamu.edu/documents/0-5210-3.pdf 16. Abstract
The TxDOT Roadway Design Manual currently suggests that concrete barrier not be placed on slopes steeper than 10H:1V. This suggestion has limited the placement of concrete barriers to narrow, flat, paved medians or at the edge of the shoulder.
Based on the results of full-scale crash testing, researchers determined that TxDOT’s cast-in-place
permanent F-shape barrier and the precast free-standing X-bolt F-shape barrier are suitable for placement on roadside and median foreslopes of 6H:1V or less. Additionally, these barriers are suitable to be placed at any lateral offset from the roadway edge, and for any width of depressed V-ditch median as long as the barrier is placed at its center. Further, similar or better performance would be expected for barrier placement on more gentle (e.g., 8H:1V) slopes.
Increasing the maximum slope on which median barriers can be placed will allow many installations
to be placed further from the travelway, which in turn will most likely lead to a reduction in barrier impact frequency and severity.
17. Key Words Median Barriers, Portable Concrete Barriers, F-Shape Barriers, Roadside Slopes, Crash Testing, Roadside Safety, Finite Element Analysis, Simulation
18. Distribution Statement No restrictions. This document is available to the public through NTIS: National Technical Information Service Springfield, Virginia 22161 http://www.ntis.gov
19. Security Classif.(of this report) Unclassified
20. Security Classif.(of this page) Unclassified
21. No. of Pages
86
22. Price
Form DOT F 1700.7 (8-72) Reproduction of completed page authorized

CRASH TESTING AND EVALUATION OF F-SHAPE BARRIERS ON SLOPES
by
Nauman M. Sheikh Associate Transportation Researcher
Texas Transportation Institute
Roger P. Bligh, Ph.D., P.E. Research Engineer
Texas Transportation Institute
and
Wanda L. Menges Research Specialist
Texas Transportation Institute
Report 0-5210-3 Project 0-5210
Project Title: Roadside Crash Testing Program for Design Guidance and Standard Detail Development
Performed in cooperation with the Texas Department of Transportation
and the Federal Highway Administration
September 2007 Published: March 2008
TEXAS TRANSPORTATION INSTITUTE The Texas A&M University System College Station, Texas 77843-3135


v
DISCLAIMER
The contents of this report reflect the views of the authors, who are responsible for the facts and the accuracy of the data, and the opinions, findings, and conclusions presented herein. The contents do not necessarily reflect the official view or policies of the Texas Department of Transportation (TxDOT), Federal Highway Administration (FHWA), The Texas A&M University System, or the Texas Transportation Institute. This report does not constitute a standard, specification, or regulation, and its contents are not intended for construction, bidding, or permit purposes. In addition, the above listed agencies assume no liability for its contents or use thereof. The names of specific products or manufacturers listed herein do not imply endorsement of those products or manufacturers. The engineer in charge of the project was Roger P. Bligh, P.E. (Texas, #78550).
vi
ACKNOWLEDGMENTS
This research project was conducted under a cooperative program between the Texas Transportation Institute, the Texas Department of Transportation, and the Federal Highway Administration. The TxDOT project director for this research was Rory Meza, P.E. (DES). Bobby Dye (DES) and Mark Bloschock, P.E. (BRG) served on the project advisory committee and helped guide this research. The authors acknowledge and appreciate their assistance.

vii
TABLE OF CONTENTS
Page LIST OF FIGURES ..................................................................................................................... viii LIST OF TABLES.......................................................................................................................... x CHAPTER 1. INTRODUCTION ................................................................................................... 1
INTRODUCTION ...................................................................................................................... 1 BACKGROUND ........................................................................................................................ 1 OBJECTIVES/SCOPE OF RESEARCH ................................................................................... 2
CHAPTER 2. RESEARCH APPROACH ...................................................................................... 3 CHAPTER 3. CRASH TEST PROCEDURES .............................................................................. 5
TEST FACILITY........................................................................................................................ 5 CRASH TEST CONDITIONS ................................................................................................... 5 EVALUATION CRITERIA ....................................................................................................... 6
CHAPTER 4. CRASH TEST RESULTS ....................................................................................... 7 TEST NO. 452106-3 (Permanent F-Shape Barrier on Slope) .................................................... 7
Test Installation....................................................................................................................... 7 Test Vehicle ............................................................................................................................ 7 Weather Conditions ................................................................................................................ 7 Test Description .................................................................................................................... 15 Damage to Test Installation .................................................................................................. 15 Vehicle Damage.................................................................................................................... 15 Occupant Risk Factors .......................................................................................................... 20 Assessment of Test Results................................................................................................... 20 Discussion............................................................................................................................. 23
TEST NO. 452106-4 (Free-Standing, Precast F-Shape Barrier on 6H:1V Slope) ................... 24 Test Installation..................................................................................................................... 24 Test Vehicle .......................................................................................................................... 24 Weather Conditions .............................................................................................................. 24 Test Description .................................................................................................................... 32 Damage to Test Installation .................................................................................................. 32 Vehicle Damage.................................................................................................................... 32 Occupant Risk Factors .......................................................................................................... 37 Assessment of Test Results................................................................................................... 37
CHAPTER 5. SUMMARY AND CONCLUSIONS.................................................................... 41 CHAPTER 6. IMPLEMENTATION STATEMENT................................................................... 45 REFERENCES ............................................................................................................................. 47 APPENDIX A. CRASH TEST AND DATA ANALYSIS PROCEDURES ............................... 49
ELECTRONIC INSTRUMENTATION AND DATA PROCESSING ................................... 49 ANTHROPOMORPHIC DUMMY INSTRUMENTATION................................................... 50 PHOTOGRAPHIC INSTRUMENTATION AND DATA PROCESSING ............................. 50 TEST VEHICLE PROPULSION AND GUIDANCE.............................................................. 50
APPENDIX B. TEST VEHICLE PROPERTIES AND INFORMATION .................................. 51 APPENDIX C. SEQUENTIAL PHOTOGRAPHS ...................................................................... 57 APPENDIX D. VEHICLE ANGULAR DISPLACEMENTS AND ACCELERATIONS.......... 63
viii
LIST OF FIGURES Figure Page Figure 1. Height of Vehicle Bumper Relative to Local Terrain Elevation.................................. 3 Figure 2. Details of the Permanent F-Shape Barrier.................................................................... 8 Figure 3. Details of Rebar Placement of the Permanent F-Shape Barrier. .................................. 9 Figure 4. Cross Section of the Permanent F-Shape Barrier. ...................................................... 10 Figure 5. Details of Rebar for the Permanent F-Shape Barrier.................................................. 11 Figure 6. Permanent F-Shape Barrier on 6V:1H Slope before Test No. 452106-3. .................. 12 Figure 7. Vehicle/Installation Geometrics for Test No. 452106-3. ........................................... 13 Figure 8. Vehicle before Test No. 452106-3. ............................................................................ 14 Figure 9. After Impact Trajectory Path for Test No. 452106-3. ................................................ 16 Figure 10. Installation after Test No. 452106-3........................................................................... 17 Figure 11. Vehicle after Test No. 452106-3. ............................................................................... 18 Figure 12. Interior of Vehicle for Test No. 452106-3.................................................................. 19 Figure 13. Summary of Results for NCHRP Report 350 Test 3-11
on the Permanent F-Shape Barrier on 6H:1V Slope................................................... 21 Figure 14. Details of Free-Standing, Precast F-Shape Barrier..................................................... 25 Figure 15. Details of Rebar Placement in Free-Standing, Precast F-Shape Barrier. ................... 26 Figure 16. Cross Section of Free-Standing, Precast F-Shape Barrier.......................................... 27 Figure 17. Cross Section of Free-Standing, Precast F-Shape Barrier.......................................... 28 Figure 18. Free-Standing, Precast F-Shape Barrier on 6H:1V Slope
before Test No. 452106-4. ......................................................................................... 29 Figure 19. Vehicle/Installation Geometrics for Test No. 452106-4. ........................................... 30 Figure 20. Vehicle before Test No. 452106-4. ............................................................................ 31 Figure 21. After Impact Trajectory Path for Test No. 452106-4. ................................................ 33 Figure 22. Installation after Test No. 452106-4........................................................................... 34 Figure 23. Vehicle after Test No. 452106-4. ............................................................................... 35 Figure 24. Interior of Vehicle for Test No. 452106-4.................................................................. 36 Figure 25. Summary of Results for NCHRP Report 350 Test 3-11
on the Precast Free-standing F-Shape on Slope......................................................... 38 Figure 26. Vehicle Properties for Test No. 452106-3.................................................................. 51 Figure 27. Vehicle Properties for Test No. 452106-4.................................................................. 54 Figure 28. Sequential Photographs for Test No. 452106-3 (Rear View)..................................... 57 Figure 29. Sequential Photographs for Test No. 452106-3 (Overhead and Frontal Views)........ 58 Figure 30. Sequential Photographs for Test No. 452106-4 (Overhead and Frontal Views)........ 60 Figure 31. Sequential Photographs for Test No. 452106-4 (Rear View)..................................... 62 Figure 32. Vehicle Angular Displacements for Test 452106-3. .................................................. 63 Figure 33. Vehicle Longitudinal Accelerometer Trace for Test 452106-3
(Accelerometer Located at Center of Gravity)........................................................... 64 Figure 34. Vehicle Lateral Accelerometer Trace for Test 452106-3
(Accelerometer Located at Center of Gravity)........................................................... 65 Figure 35. Vehicle Vertical Accelerometer Trace for Test 452106-3
(Accelerometer Located at Center of Gravity)........................................................... 66

ix
LIST OF FIGURES (CONTINUED) Figure Page Figure 36. Vehicle Longitudinal Accelerometer Trace for Test 452106-3
(Accelerometer Located over Rear Axle). ................................................................. 67 Figure 37. Vehicle Lateral Accelerometer Trace for Test 452106-3
(Accelerometer Located over Rear Axle). ................................................................. 68 Figure 38. Vehicle Vertical Accelerometer Trace for Test 452106-3
(Accelerometer Located over Rear Axle). ................................................................. 69 Figure 39. Vehicle Angular Displacements for Test ................................................................... 70 Figure 40. Vehicle Longitudinal Accelerometer Trace for Test 452106-4
(Accelerometer Located at Center of Gravity). ......................................................... 71 Figure 41. Vehicle Lateral Accelerometer Trace for Test 452106-4
(Accelerometer Located at Center of Gravity). ......................................................... 72 Figure 42. Vehicle Vertical Accelerometer Trace for Test 452106-4
(Accelerometer Located at Center of Gravity). ......................................................... 73 Figure 43. Vehicle Longitudinal Accelerometer Trace for Test 452106-4
(Accelerometer Located over Rear Axle).................................................................. 74 Figure 44. Vehicle Lateral Accelerometer Trace for Test 452106-4
(Accelerometer Located over Rear Axle).................................................................. 75 Figure 45. Vehicle Vertical Accelerometer Trace for Test 452106-4
(Accelerometer Located over Rear Axle).................................................................. 76

x
LIST OF TABLES Table Page Table 1. Performance Evaluation Summary for NCHRP Report 350 Test 3-11
on the Permanent F-Shape Barrier on Slope.................................................................. 42 Table 2. Performance Evaluation Summary for NCHRP Report 350 Test 3-11
on the Pre-cast Free-standing F-Shape Barrier on Slope. .............................................. 43 Table 3. Exterior Crush Measurements for Test No. 452106-3................................................... 52 Table 4. Occupant Compartment Measurements for Test No. 452106-3. ................................... 53 Table 5. Exterior Crush Measurements for Test No. 452106-4................................................... 55 Table 6. Occupant Compartment Measurements for Test No. 452106-4. ................................... 56

1
CHAPTER 1. INTRODUCTION INTRODUCTION Roadside safety devices perform the important function of preventing serious injury to motorists during roadside encroachments. To maintain the desired level of safety for the motoring public, these safety appurtenances must be designed to accommodate a variety of site conditions, placement locations, and a changing vehicle fleet. As changes are made or in-service problems are encountered, there is a need to assess the compliance of the specific safety device with current vehicle testing criteria, and modify the device or develop a new device with enhanced performance and maintenance characteristics. BACKGROUND
In general, it is desirable to design median slopes as flat as possible. This design enhances a motorist’s ability to regain control of an errant vehicle and/or bring it to a safe stop. However, even in the absence of steep slopes and fixed objects, median barriers are often warranted to reduce severe cross-over crashes. When a median barrier is deemed appropriate based on roadway characteristics and operating conditions, the American Association of Highway and Transportation Officials (AASHTO) Roadside Design Guide (RDG) and the Texas Department of Transportation (TxDOT) Roadway Design Manual (RDM) currently suggest that concrete barrier should not be placed on slopes steeper than 10H:1V (1,2). This suggestion has limited the placement of concrete barriers to relatively narrow, flat, paved medians or at the edge of the shoulder. When placed at the edge of the shoulder, the recovery area for traffic adjacent to the barrier is significantly reduced, and the frequency of barrier crashes can be significantly higher than a case in which the barrier is offset to the center of the median.
Concrete barriers that were recently installed in the Austin, Texas area in medians with slopes greater than 10H:1V have successfully contained and redirected vehicles and appear to be functioning well. This recent success prompted a desire to investigate whether impact performance of median barriers can be maintained when the barriers are placed on cross slopes greater than 10H:1V. Increasing the maximum slope on which median barriers can be placed will allow many installations to be placed further from the travelway, which in turn can lead to a reduction in barrier impact frequency and severity.
In a previous part of this research, Texas Transportation Institute (TTI) researchers conducted full-scale vehicular impact simulations for several impact scenarios associated with placement of concrete barrier on typical depressed median configurations (3). Simulation results indicated that the F-shape concrete barrier has a reasonable probability of acceptable impact performance when placed in the center of a depressed median with slopes as steep as 6H:1V. It was noted, however, that the finite element pickup truck model used in the simulation analyses had not been thoroughly validated for encroachments across median slopes and ditches. Since vehicle response is critical to the assessment of the performance of barriers placed on slopes, the

2
research team recommended that one or more full-scale crash tests be conducted to verify impact performance. OBJECTIVES/SCOPE OF RESEARCH
The objective of this research was to determine the maximum slope on which concrete median barrier can be placed and still maintain its crashworthiness. TxDOT indicated a desirable median cross slope of 6H:1V. Previously conducted finite element impact simulations indicated that an F-shape concrete median barrier has a reasonable probability of acceptable impact performance when placed in the center of a depressed median with slopes as steep as 6H:1V(3).
Under this part of the research, researchers performed full-scale crash tests to verify the
impact performance of concrete median barrier placed on a 6H:1V cross slope. The full-scale vehicle crash testing was conducted following the guidelines contained in the National Cooperative Highway Research Program (NCHRP) Report 350 (4). The critical barrier placement was selected based on vehicle dynamics modeling and finite element simulations conducted in a previous part of this research.
Chapter 2 of this report presents a brief summary of the previously conducted simulation analyses and some discussion on the approach adopted for verifying impact performance of concrete median barrier on a 6H:1V slope. Chapter 3 summarizes the test methodologies followed for the evaluation of impact performance. The results of the full-scale crash tests are presented in Chapter 4. A summary of findings and conclusions is presented in Chapter 5. Chapter 6 presents implementation recommendations.

3
CHAPTER 2. RESEARCH APPROACH
In a previous part of this research, researchers conducted an analysis using full-scale finite element simulations of vehicular impacts into F-shaped concrete barriers placed on 6H:1V cross-slopes (3). Consideration was given to vehicles traversing a median foreslope prior to striking a barrier placed in the center of a depressed V-ditch median.
Given that median width can vary, it was important to determine the lateral offset position(s) of the barrier most likely to result in vehicle override and/or overturn. It can be inferred from a successful impact at this critical offset location(s) that the impact performance of the barrier at other offsets would also be acceptable. Toward this objective, an initial simulation was performed to determine the encroachment trajectory of the vehicle as it travels freely across an infinite 6H:1V slope in absence of a barrier. This simulation also included a 6-ft shoulder with a 20H:1V cross-slope. The simulation was conducted with a 4409-lb pickup truck departing the travelway at a speed of 62 mi/h and an angle of 25 degrees. The pickup truck was considered to be a more critical design vehicle than the 1800-lb passenger car in terms of potential for overturn, barrier override, and occupant compartment deformation. Researchers used the results of this simulation to obtain the height of the vehicle’s bumper (impact side corner) with respect to the local ground elevation as a function of the vehicle’s lateral movement down the 6H:1V slope (see Figure 1).
Figure 1. Height of Vehicle Bumper Relative to Local Terrain Elevation.
Nominal bumper height as a function of vehicle's lateral movement
24.00
26.00
28.00
30.00
32.00
34.00
0.00 5.00 10.00 15.00 20.00 25.00
Lateral position of the bumper (ft)
Nom
inal
bum
per h
eigh
t (in
)
Case 1 Barrier at 13.25 ft
Case 2 Barrier at 23.5 ft

4
From this bumper trajectory plot, researchers identifiedtwo locations for further analyses:
Case 1: point of maximum nominal bumper height above the local terrain elevation (i.e., 7.25 ft offset from shoulder edge, 13.25 ft from roadway edge) and, Case 2: just beyond the point of minimum nominal bumper height at which the vehicle suspension has been compressed to its greatest extent and is beginning to rebound (i.e., 17.5 ft offset from shoulder edge, 23.5 ft from roadway edge).
Researchers theorized that positioning the barrier at a location where the vehicle
suspension is rebounding (Case 2) might give the vehicle more of a tendency to climb up the face of the barrier, thus increasing the potential for greater vehicle instability as it interacts with the F-shape barrier.
Having defined the critical barrier locations for placement on a 6H:1V downslope, finite element impact simulations were performed for Case 1 and Case 2. Since the strength of the F-shape barrier was not in question, the concrete median barrier was assumed to be rigid in the impact simulations. The vehicle exhibited less stable response in Case 1 than in Case 2. However, in both cases, the results of the simulations indicated a reasonable probability of acceptable impact performance.
Even though simulation results indicated a reasonable probability of acceptable impact performance, it was noted that the finite element pickup truck model used in the simulation analyses had not been rigorously validated for encroachments across median slopes and ditches. Vehicle response is critical in assessing the barrier performance under such placement scenarios. Therefore, it was recommended at the conclusion of the simulation effort that one or more full-scale crash tests be conducted to verify impact performance of F-shape barrier on a 6H:1V slope.
During development of the full-scale crash testing plan, TxDOT indicated the desire to
use both permanent and free-standing concrete barrier designs for this application. Permanent and free-standing barriers usually give rise to different impact performance considerations. A permanent concrete barrier is generally expected to induce greater occupant compartment deformation (OCD) by virtue of its rigidity. A free-standing barrier, on the other hand, deflects laterally during impact. This movement reduces the resultant impact forces on the impacting vehicle, which in turn results in reduced OCD.
Another consideration is vehicle stability. The deflection that occurs during an impact
with a free-standing concrete median barrier increases the effective impact angle between the vehicle and the downstream barrier segments. This tends to induce greater vehicle climb and instability in comparison to a similar impact into a rigid, permanent concrete median barrier that does not deflect.
Keeping in mind the above mentioned considerations, both types of barriers (permanent
and free-standing) were crash tested. Case 1 was selected as the most likely to induce vehicle instability or override.

5
CHAPTER 3. CRASH TEST PROCEDURES TEST FACILITY The Texas Transportation Institute Proving Ground is a 2000-acre complex of research and training facilities located 10 mi northwest of the main campus of Texas A&M University. The site, formerly an Air Force base, has large expanses of concrete runways and parking aprons well suited for experimental research and testing in the areas of vehicle performance and handling, vehicle-roadway interaction, durability and efficacy of highway pavements, and safety evaluation of roadside safety hardware. The site selected for construction and testing of the barriers on slopes evaluated under this project is along an out-of-service apron. The apron consists of an unreinforced jointed-concrete pavement in 12.5 ft × 15 ft blocks nominally 8-12 inches deep. The apron is over 50 years old, and the joints have some displacement but are otherwise flat and level. CRASH TEST CONDITIONS
NCHRP Report 350 recommends two tests for TL-3 evaluation of longitudinal barriers:
NCHRP Report 350 test designation 3-10: This test involves an 1808-lb passenger car impacting the critical impact point (CIP) in the length of need (LON) of the longitudinal barrier at a nominal speed and angle of 62 mi/h and 20 degrees, respectively. The purpose of this test is to evaluate the overall performance of the LON section in general and occupant risk in particular.
NCHRP Report 350 test designation 3-11: This test involves a 4409-lb pickup truck impacting the CIP in the LON of the longitudinal barrier at a nominal speed and angle of 62 mi/h and 25 degrees, respectively. The test is intended to evaluate the strength of the section for containing and redirecting the pickup truck.
The tests reported herein correspond to NCHRP Report 350 test designation 3-11. The pickup truck test is considered to be the critical test in the evaluation of the barrier on slope in terms of vehicle stability, barrier override, and occupant compartment deformation. A rigid barrier with F-shape profile has demonstrated acceptable performance when impacted by a small car under test 3-10 impact conditions (5). Due to the small deflection expected for the precast F-shape concrete median barrier (CMB) with cross-bolt connection when subjected to test 3-10, the behavior is expected to be similar to that obtained in the rigid barrier test.
The critical impact point for the barrier for test designation 3-11 was chosen according to guidelines contained in NCHRP Report 350. For the test with permanent barrier installation, the target impact point was at the one-third point of the installation length from the upstream end. The impact point for the free-standing precast barrier was 3.9 ft upstream of a joint between segments.

6
All crash test, data analysis, and evaluation and reporting procedures followed under this project were in accordance with guidelines presented in NCHRP Report 350. Appendix A presents brief descriptions of these procedures. EVALUATION CRITERIA Researchers evaluated the crash tests performed in accordance with NCHRP Report 350. As stated in NCHRP Report 350, “Safety performance of a highway appurtenance cannot be measured directly but can be judged on the basis of three factors: structural adequacy, occupant risk, and vehicle trajectory after collision.” Accordingly, researchers used the safety evaluation criteria from Table 5.1 of NCHRP Report 350 to evaluate the crash tests reported herein.
7
CHAPTER 4. CRASH TEST RESULTS TEST NO. 452106-3 (Permanent F-Shape Barrier on Slope) Test Installation
A 120-ft long ditch with 6H:1V foreslope was cut adjacent to the edge of a concrete apron. A 75 ft long × 4 ft wide × 0.5 ft thick concrete pad was constructed at the bottom of the 6H:1V slope. The concrete pad serves as a level surface for construction of the barrier and as a mowing strip on both sides of the barrier. Reinforcement of the pad consisted of a single layer of 6 inches × 6 inches – W6×W6 welded wire fabric.
A 75-ft long section of permanent F-shape concrete barrier (TxDOT standard CBS(1)-04)
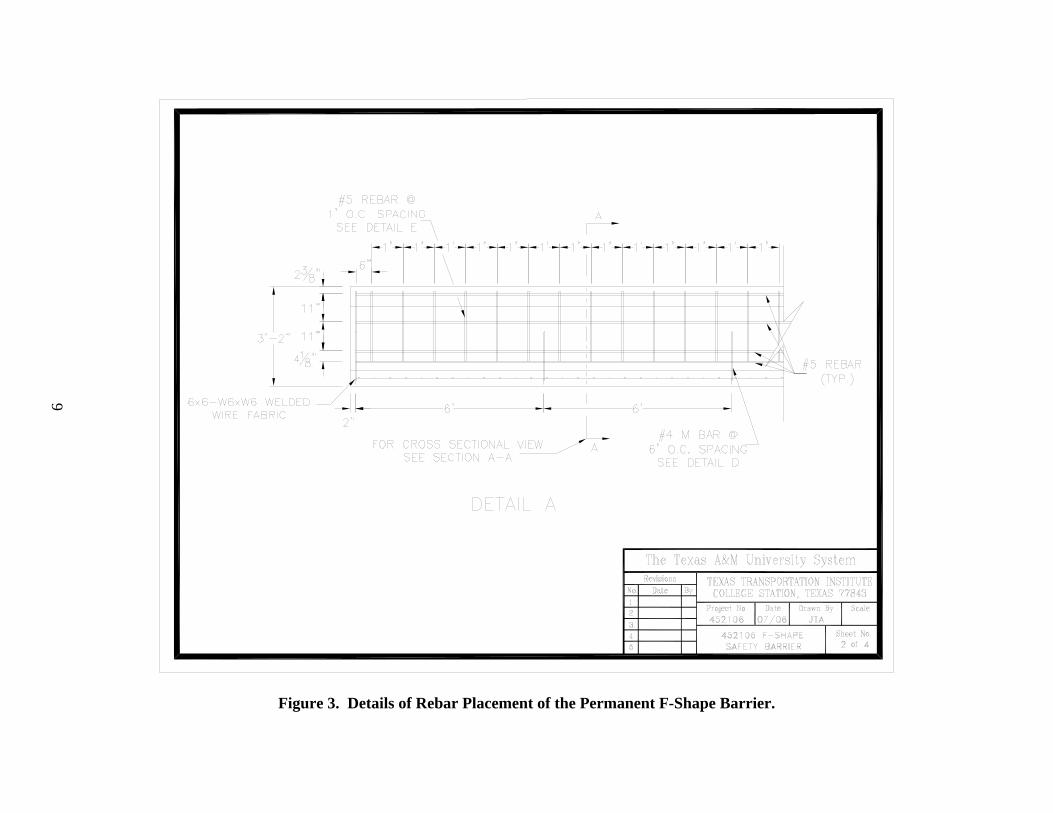
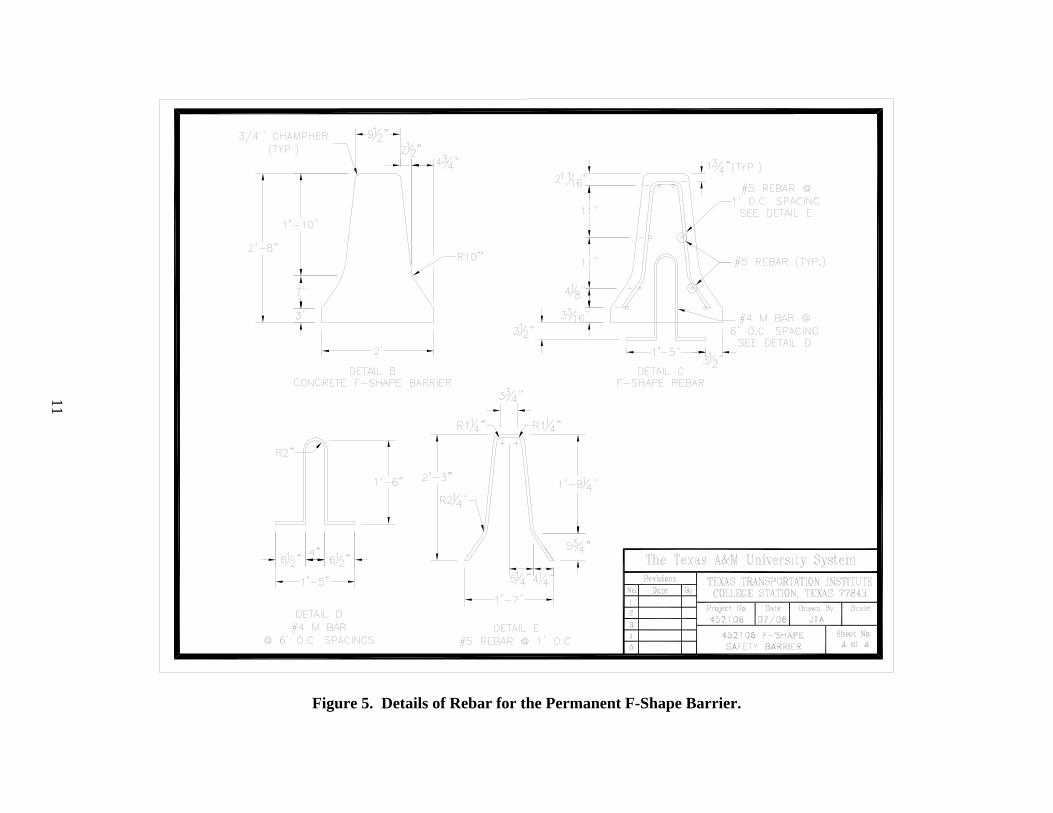
was cast-in-place on top of the concrete pad. Inverted U-shaped #4 bars spaced on 6-ft centers were used to secure the F-shape barrier to the concrete pad. The lateral offset between the slope breakpoint and the toe of the F-shape barrier was 13.25 ft. The F-shape barrier was 32 inches tall, 2 ft wide at the base, and 9.5 inches wide at the top. The barrier was reinforced with #5 rebar stirrups spaced 12 inches on center and 8 #5 longitudinal rebars distributed throughout the cross section. TxDOT standard drawing CBS(1)-04 can be consulted for additional barrier design details.
These and other details of the test article are shown in Figures 2 through 5. Figure 6
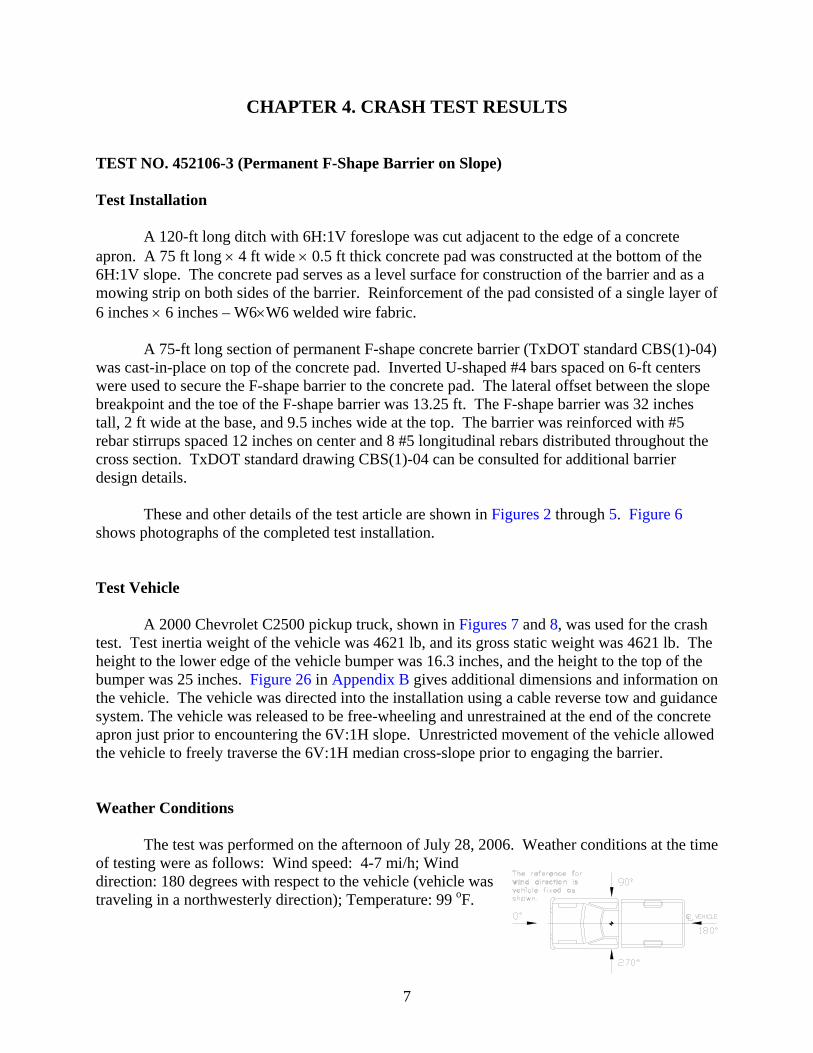
shows photographs of the completed test installation. Test Vehicle A 2000 Chevrolet C2500 pickup truck, shown in Figures 7 and 8, was used for the crash test. Test inertia weight of the vehicle was 4621 lb, and its gross static weight was 4621 lb. The height to the lower edge of the vehicle bumper was 16.3 inches, and the height to the top of the bumper was 25 inches. Figure 26 in Appendix B gives additional dimensions and information on the vehicle. The vehicle was directed into the installation using a cable reverse tow and guidance system. The vehicle was released to be free-wheeling and unrestrained at the end of the concrete apron just prior to encountering the 6V:1H slope. Unrestricted movement of the vehicle allowed the vehicle to freely traverse the 6V:1H median cross-slope prior to engaging the barrier. Weather Conditions The test was performed on the afternoon of July 28, 2006. Weather conditions at the time of testing were as follows: Wind speed: 4-7 mi/h; Wind direction: 180 degrees with respect to the vehicle (vehicle was traveling in a northwesterly direction); Temperature: 99 oF.

8
Figure 2. Details of the Permanent F-Shape Barrier.
9
Figure 3. Details of Rebar Placement of the Permanent F-Shape Barrier.

10
Figure 4. Cross Section of the Permanent F-Shape Barrier.
11
Figure 5. Details of Rebar for the Permanent F-Shape Barrier.

12
Figure 6. Permanent F-Shape Barrier on 6V:1H Slope before Test No. 452106-3.

13
Figure 7. Vehicle/Installation Geometrics for Test No. 452106-3.

14
Figure 8. Vehicle before Test No. 452106-3.

15
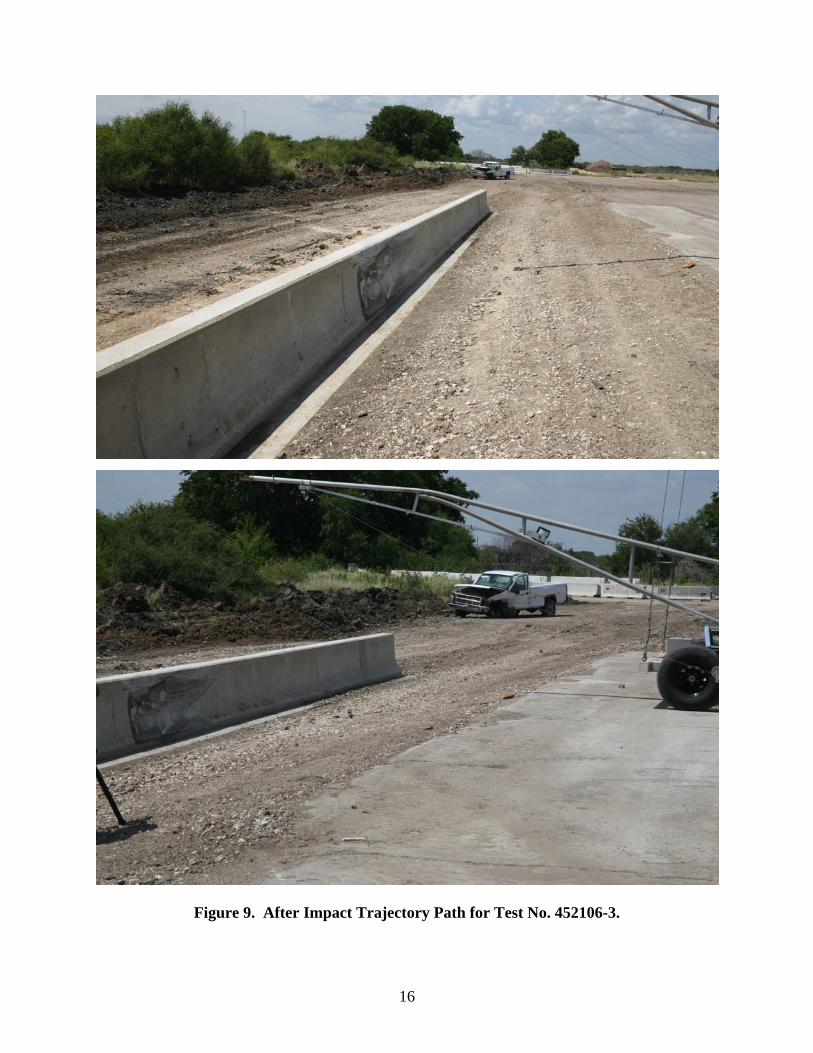
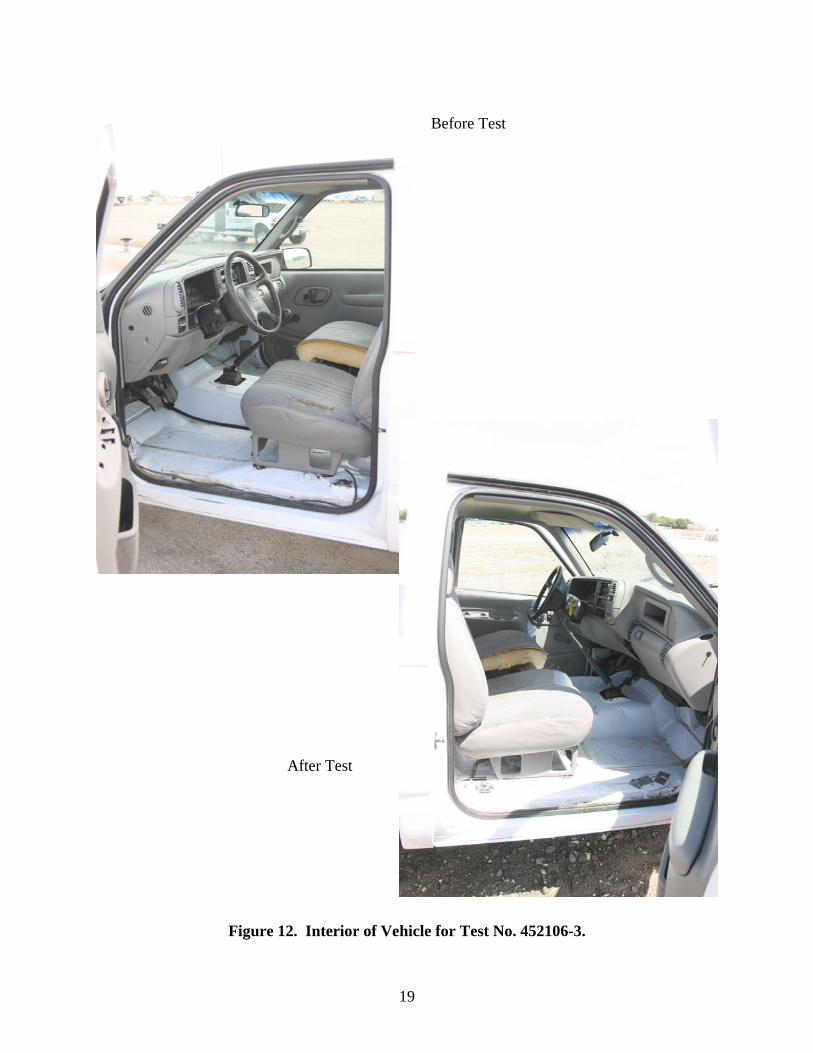
Test Description The 2000 Chevrolet C2500 pickup truck, traveling at an impact speed of 62.9 mi/h, impacted the permanent F-shape concrete barrier 25.8 ft from the upstream end of the barrier installation with the left front corner of the bumper at an impact angle of 24.7 degrees. The bumper started to deform upon impact. At 0.012 s after impact, the hood of the vehicle started to deform. The vehicle began redirecting at 0.079 s. At 0.206 s, the vehicle was traveling parallel to the barrier at a speed of 46.9 mi/h. At 0.508 s, the vehicle lost contact with the barrier while traveling at an exit speed of 45.9 mi/h and an exit angle of 11 degrees. Brakes on the vehicle were applied at 1.97 s after impact, and the vehicle came to rest 153 ft downstream of impact and 14 ft toward the “field” side of the barrier. Figures 28 and 29 in Appendix C show sequential photographs of the test period. Damage to Test Installation The barrier sustained only cosmetic damage, as shown in Figures 9 and 10. Tire marks marred the traffic face of the barrier. There were no cracks in the barrier and no measurable deflection of the barrier. Length of contact of the vehicle with the barrier was 11.5 ft. Vehicle Damage Damage to the vehicle is shown in Figure 11. Structural damage included deformed upper and lower A-arms and deformed frame rail. In addition, the front bumper, hood, grill, left front quarter panel, left side door, left rear exterior bed and rear bumper were damaged. The inner wheel rim separated from the outer rim on the left front wheel, and the tire was deflated. The left rear tire was deflated, and the wheel rim was deformed. The windshield sustained stress cracks. Maximum exterior crush to the frontal plane at the left front corner at bumper height was 21.6 inches. The seam in the floor pan on the left side separated, and the maximum occupant compartment deformation was 5.4 inches in the lateral area across the floor pan from kick panel to kick panel. Photographs of the interior of the vehicle are shown in Figure 12. Exterior crush measurements and occupant compartment deformation are given in Appendix B, Tables 3 and 4.
16
Figure 9. After Impact Trajectory Path for Test No. 452106-3.

17
Figure 10. Installation after Test No. 452106-3.

18
Figure 11. Vehicle after Test No. 452106-3.
19
Before Test After Test
Figure 12. Interior of Vehicle for Test No. 452106-3.

20
Occupant Risk Factors Researchers digitized data from the triaxial accelerometer, located at the vehicle center of gravity to compute occupant impact velocity and ridedown accelerations. Only the occupant impact velocity and ridedown accelerations in the longitudinal axis are required from these data for evaluation of criterion L in NCHRP Report 350. In the longitudinal direction, occupant impact velocity was 18 ft/s at 0.096 s; maximum 0.010-s ridedown acceleration was -5.5 g’s from 0.096 to 0.106 s; and the maximum 0.050-s average was -8.7 g’s between 0.026 and 0.076 s. In the lateral direction, the occupant impact velocity was 26.9 ft/s at 0.096 s; the highest 0.010-s occupant ridedown acceleration was 8.5 g’s from 0.220 to 0.230 s; and the maximum 0.050-s average was 13.2 g’s between 0.040 and 0.090 s. Figure 13 presents these data and other pertinent information from the test. Figures 32 through 38 in Appendix D present vehicle angular displacements and accelerations versus time traces. Assessment of Test Results An assessment of the test based on the applicable NCHRP Report 350 safety evaluation criteria is provided below.
Structural Adequacy A. Test article should contain and redirect the vehicle; the vehicle should not
penetrate, underride, or override the installation although controlled lateral deflection of the test article is acceptable.
Result: The F-shape barrier on 6H:1V slope contained and redirected the pickup
truck. The vehicle did not penetrate, underride, or override the installation. No deflection of the barrier occurred. (PASS)
Occupant Risk
D. Detached elements, fragments, or other debris from the test article should not penetrate or show potential for penetrating the occupant compartment, or present an undue hazard to other traffic, pedestrians, or personnel in a work zone. Deformation of, or intrusions into, the occupant compartment that could cause serious injuries should not be permitted.
Result: No detached elements, fragments, or other debris were present to penetrate
or show potential for penetrating the occupant compartment, or present hazard to others in the area. Maximum occupant compartment deformation was 5.4 inches. (PASS)
F. The vehicle should remain upright during and after collision although
moderate roll, pitching, and yawing are acceptable. Result: The pickup truck remained upright during and after the collision event.
(PASS)

21
0.000 s 0.049 s 0.196 s 0.417 s
General Information Test Agency............................... Test No. .................................... Date ........................................... Test Article Type........................................... Name ......................................... Installation Length (ft) ................ Material or Key Elements .......... Soil Type and Condition............. Test Vehicle Type........................................... Designation................................ Model ......................................... Mass (lb) Curb........................................ Test Inertial............................. Dummy ................................... Gross Static............................
Texas Transportation Institute 452106-3 07-28-2006 Median Barrier Permanent F-Shape Barrier on 6H:1V Slope 120 Reinforced Concrete F-Shape Barrier at Bottom of 6H:1V Slope Concrete Pad on Standard Soil, Dry Production 2000P 2000 Chevrolet C2500 Pickup Truck 4753 4620 No dummy 4620
Impact Conditions Speed (mi/h).............................. Angle (deg)................................Exit Conditions Speed (mi/h).............................. Angle (deg)................................Occupant Risk Values Impact Velocity (ft/s) Longitudinal............................ Lateral .................................... THIV (mi/h) ................................ Ridedown Accelerations (g’s) Longitudinal............................ Lateral .................................... PHD (g’s)................................... ASI ...........................................Max. 0.050-s Average (g’s) Longitudinal............................ Lateral .................................... Vertical ...................................
62.9 24.7 45.9 11.0 18.0 8.2 34.3 -5.5 8.5 8.6 1.63 -8.7 13.2 -2.9
Test Article Deflections (ft) Dynamic ........................................... Permanent........................................ Working Width .................................. Vehicle Damage Exterior VDS............................................... CDC .............................................. Maximum Exterior Vehicle Crush (inch)................... Interior OCDI ............................................. Maximum Occupant Compartment Deformation (inch) ..................... Post-Impact Behavior (during 1.0 sec after impact) Max. Yaw Angle (deg)................... Max. Pitch Angle (deg).................. Max. Roll Angle (deg) ...................
0.00 0.00 1.84 11LFQ5 11FLDEW4 21.6 LF1114000 5.4 34 -10 13
Figure 13. Summary of Results for NCHRP Report 350 Test 3-11 on the Permanent F-Shape Barrier on 6H:1V Slope.

22
Vehicle Trajectory K. After collision, it is preferable that the vehicle’s trajectory not intrude into
adjacent traffic lanes. Result: The vehicle came to rest 153 ft downstream of impact and 14 ft toward the
“field” side of the barrier. (PASS) L. The occupant impact velocity in the longitudinal direction should not exceed
12 m/s and the occupant ridedown acceleration in the longitudinal direction should not exceed 20 g’s.
Result: Longitudinal occupant impact velocity was 18 ft/s, and longitudinal
ridedown acceleration was -5.5 g’s. (PASS) M. The exit angle from the test article preferably should be less than 60 percent
of the test impact angle, measured at time of vehicle loss of contact with the test device.
Result: Exit angle at loss of contact with the barrier was 11 degrees, which was
44 percent of the impact angle. (PASS)
The following supplemental evaluation factors and terminology, as presented in the Federal Highway Administration (FHWA) memo entitled “ACTION: Identifying Acceptable Highway Safety Features,” were used for visual assessment of test results. (6) Factors underlined below pertain to the results of the crash test reported herein.
Passenger Compartment Intrusion 1. Windshield Intrusion
a. No windshield contact e. Complete intrusion into b. Windshield contact, no damage passenger compartment c. Windshield contact, no intrusion f. Partial intrusion into d. Device embedded in windshield, no
significant intrusion passenger compartment
2. Body Panel Intrusion yes or no
Loss of Vehicle Control 1. Physical loss of control 3. Perceived threat to other vehicles 2. Loss of windshield visibility 4. Debris on pavement
Physical Threat to Workers or Other Vehicles
1. Harmful debris that could injure workers or others in the area 2. Harmful debris that could injure occupants in other vehicles
No debris was present.

23
Vehicle and Device Condition 1. Vehicle Damage
a. None d. Major dents to grill and body panels b. Minor scrapes, scratches or dents e. Major structural damage c. Significant cosmetic dents
2. Windshield Damage a. None e. Shattered, remained intact but b. Minor chip or crack (stress cracks) partially dislodged c. Broken, no interference with visibility f. Large portion removed d. Broken or shattered, visibility
restricted but remained intact g. Completely removed
3. Device Damage a. None d. Substantial, replacement parts b. Superficial needed for repair c. Substantial, but can be straightened e. Cannot be repaired
Discussion The critical lateral barrier offset for evaluating vehicle stability was determined through simulation analysis to be 13.25 ft from the edge of the roadway. At this point, the vehicle bumper was determined to be at its maximum height with respect to the local terrain. This lateral offset distance included a 6 ft shoulder that was modeled in the simulation analysis. Inadvertently, the lateral offset of the barrier in the crash test did not account for the 6 ft shoulder width. Consequently, the barrier that was tested was 6 ft farther from the slope break point than desired. Since the barrier was offset beyond the point of maximum bumper height in reference to the local terrain, it can be argued that Test 452106-4 did not adequately evaluate the concern of vehicular instability. However, it can also be argued that the tested barrier location was more critical in terms of vehicle occupant compartment deformation. After reaching its point of maximum elevation, the vehicle began to nose down into the barrier, thus imparting greater impact forces than if the barrier was placed at the location corresponding to maximum vehicle height. The increased impact forces will result in an increase in occupant compartment deformation. Since TxDOT desired to use both permanent and free-standing barriers for this application, and since it is known that an impact with a free-standing barrier results in greater roll and vehicle instability compared to a permanent barrier, researchers decided to perform the next test with the free-standing F-shape barrier. In this test, the laterally offset of the barrier was 7.25 ft from the slope breakpoint, which corresponds to the point of maximum bumper height of the vehicle in reference to its local terrain. This test should provide a critical evaluation of vehicular stability for both permanent and free-standing barriers on the 6H:1V slope, given that vehicular stability generally improves with the use of a permanent barrier compared to a free-standing barrier of similar shape. Details of the crash test with the free-standing F-shaped concrete barrier are presented in the following section.

TEST NO. 452106-4 (Free-Standing, Precast F-Shape Barrier on 6H:1V Slope) Test Installation
A 120 ft long × 4 ft wide × 0.5 ft thick concrete pad was constructed at the bottom of a
ditch with a 6H:1V cross slope and back slope. The concrete pad serves as a level surface for construction of the barrier and as a mowing strip on both sides of the barrier. Reinforcement of the pad consisted of a single layer of 6 inches × 6 inches – W6×W6 welded wire fabric.
Four 30-ft long segments of precast F-shape concrete median barrier with X-bolt
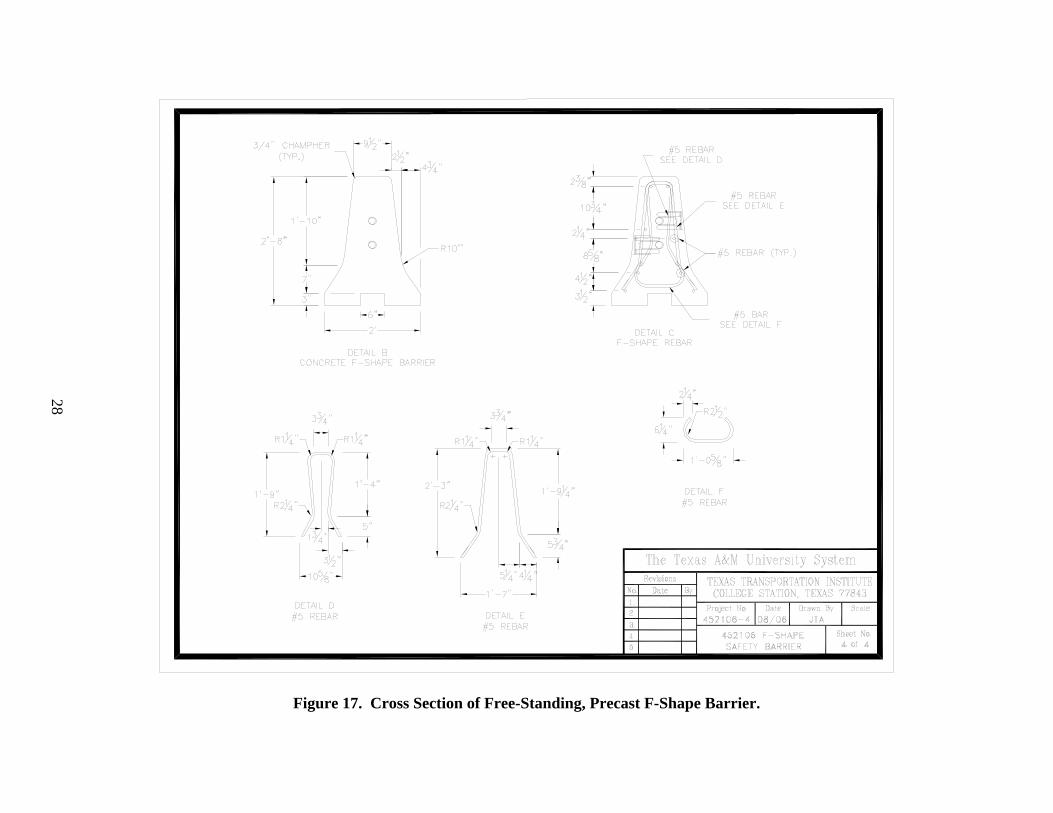
connections were placed in the center of the concrete pad, placing the toe of the F-shape barrier 7.25 ft from the break point of the 6H:1V slope. Each barrier segment was 32 inches tall, 2 ft wide at the base, and 9.5 inches wide at the top, and were reinforced using #5 rebar stirrups and longitudinal bars as specified in the TxDOT standard CBS(1)-04. Adjacent barrier segments were connected to one another using a cross-bolted connection consisting of two 0.875 inch diameter SAE Grade 5 threaded rods. TxDOT standard detail sheet CBS(2)-04 can be consulted for more details on the barrier and connection.
Details of the test article are shown in Figures 14 through 17. Figure 18 shows photographs of the completed test installation. Test Vehicle A 1996 Chevrolet C2500 pickup truck, shown in Figures 19 and 20, was used for the crash test. Test inertia weight of the vehicle was 4586 lb, and its gross static weight was 4586 lb. The height to the lower edge of the vehicle bumper was 16.3 inches, and it was 25 inches to the upper edge of the bumper. Figure 27 in Appendix B gives additional dimensions and information on the vehicle. The vehicle was released to be free-wheeling and unrestrained at the end of the concrete apron just prior to encountering the 6V:1H slope. Unrestricted movement of the vehicle allowed the vehicle to freely traverse the 6V:1H median cross-slope prior to engaging the barrier. Weather Conditions The test was performed on the morning of August 25, 2006. Weather conditions at the time of testing were as follows: Wind speed: 5-8 mi/h; Wind direction: 200 degrees with respect to the vehicle (vehicle was traveling in a northwesterly direction); Temperature: 88 oF, Relative humidity: 67 percent.
24

25
Figure 14. Details of Free-Standing, Precast F-Shape Barrier.

26
Figure 15. Details of Rebar Placement in Free-Standing, Precast F-Shape Barrier.

27
Figure 16. Cross Section of Free-Standing, Precast F-Shape Barrier.
28
Figure 17. Cross Section of Free-Standing, Precast F-Shape Barrier.

29
Figure 18. Free-Standing, Precast F-Shape Barrier on 6H:1V Slope before Test No. 452106-4.

30
Figure 19. Vehicle/Installation Geometrics for Test No. 452106-4.

31
Figure 20. Vehicle before Test No. 452106-4.

32
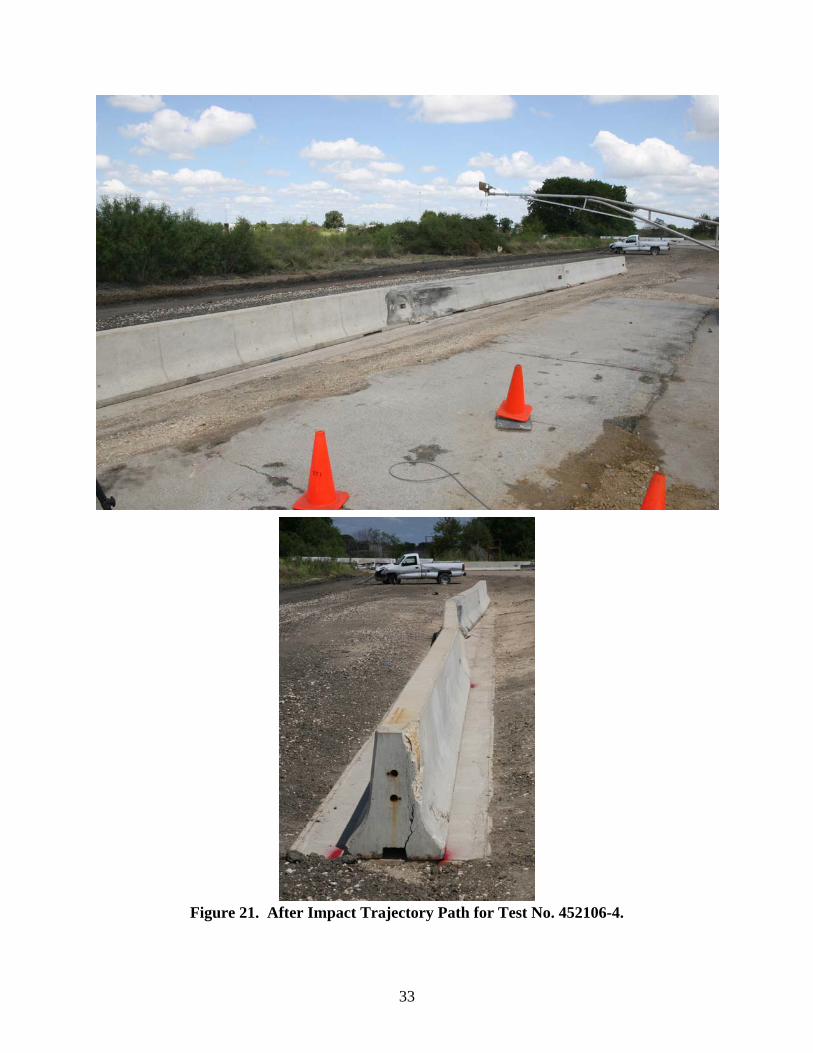
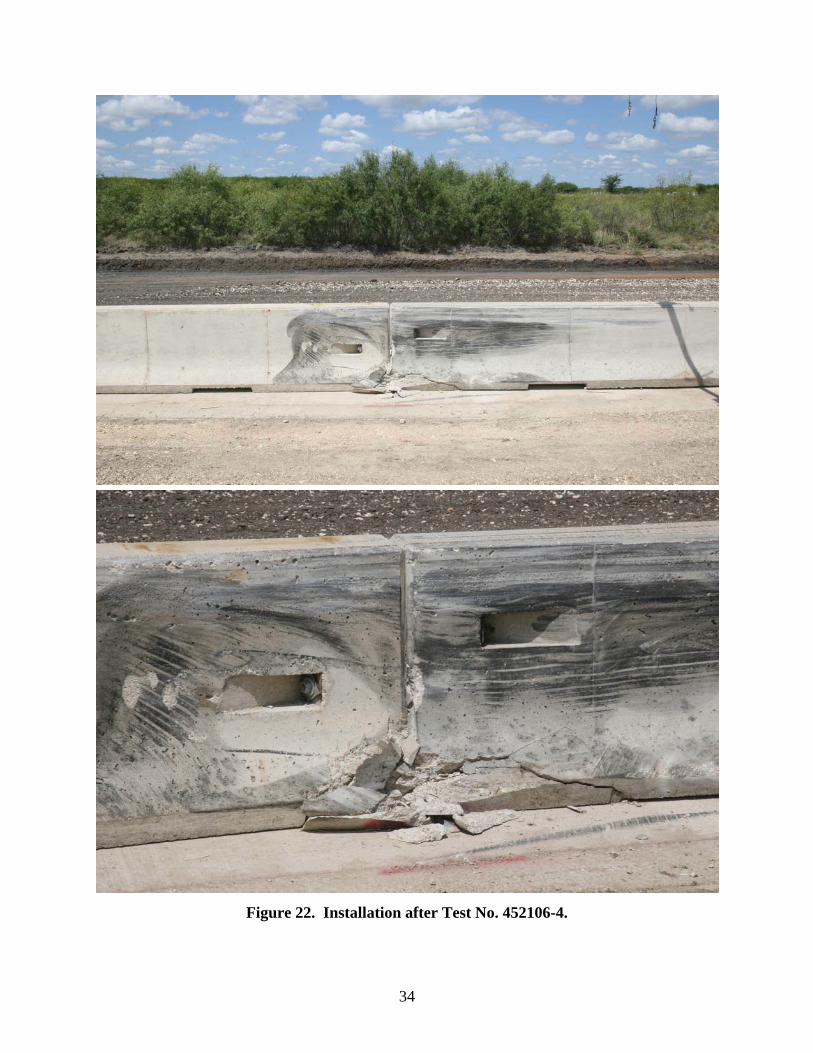
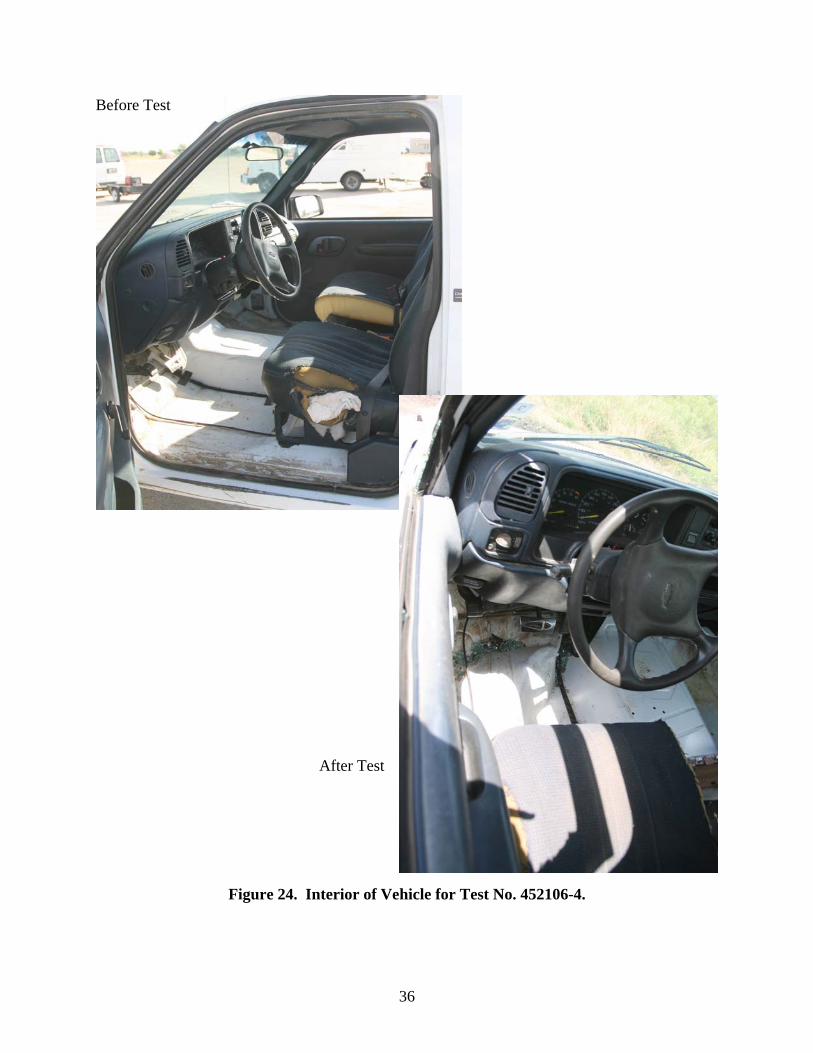
Test Description The 1996 Chevrolet C2500 pickup truck, traveling at a speed of 62.6 mi/h, impacted the precast F-shape concrete median barrier on a 6H:1V slope 3.9 ft upstream of the joint between segments 2 and 3 at an impact angle of 26.9 degrees. Shortly after impact, the left front tire began to ride up on the face of the barrier. At 0.040 s after impact, the third segment began to move toward the field side, and at 0.044 s, the vehicle began to redirect. The second segment began to move toward the field side at 0.048 s, and the last barrier on the downstream end began to move at 0.068 s. At 0.205 s, the vehicle was traveling parallel to the barrier at a speed of 45.7 mi/h. The rear of the vehicle contacted the barrier at 0.212 s. The vehicle continued traveling parallel with the barrier and exited the barrier at 0.744 s. Exit speed and angle were not obtainable from the overhead camera. Figures 30 and 31 in Appendix C show sequential photographs of the test period. Damage to Test Installation Damage to the F-shape barrier is shown in Figures 21 and 22. The upstream end of segment 1 was pushed toward the traffic side 1.6 inches. No movement was noted at the joint between segment 1 and 2, but the lower rear corner of segment 2 at the joint was spalled. The barrier was pushed toward the field side 13.4 inches at the joint between segments 2 and 3, and both segments were spalled on the traffic side of the barriers at this joint. The barrier was pushed toward the field side 0.6 inch at the joint between segments 3 and 4; the lower corners on the field side of both segments were spalled, as were the top corners on the field side of segment 4 and the top corner of the traffic side of segment 4. The downstream end of segment 4 was pushed toward the traffic side 2.8 inches. Length of contact of the vehicle with the barrier was 44 ft. Maximum dynamic deflection during the test was 1.15 ft, and maximum permanent deflection was 1.12 ft. Vehicle Damage The vehicle sustained damage to the left side, as shown in Figure 23. Structural damage was imparted to the left upper and lower A-arms, left tie rod, sway bar and left frame rail. Also damaged were the front bumper, hood, grill, radiator and fan, left front quarter panel, left door and glass, left rear exterior bed, and rear bumper. The inner wheel rim separated from the outer wheel rim on the left front and the tire was deflated. The left rear wheel rim was deformed, and the tire was deflated. Maximum exterior crush to the vehicle was 22 inches in the side plane at the left front corner at bumper height. Maximum occupant compartment deformation was 5 inches in the floor pan to instrument panel area on the left side. Photographs of the interior of the vehicle are shown in Figure 24. Exterior crush measurements and occupant compartment deformation are presented in Appendix B, Tables 5 and 6.
33
Figure 21. After Impact Trajectory Path for Test No. 452106-4.
34
Figure 22. Installation after Test No. 452106-4.

35
Figure 23. Vehicle after Test No. 452106-4.
36
Before Test After Test
Figure 24. Interior of Vehicle for Test No. 452106-4.
37
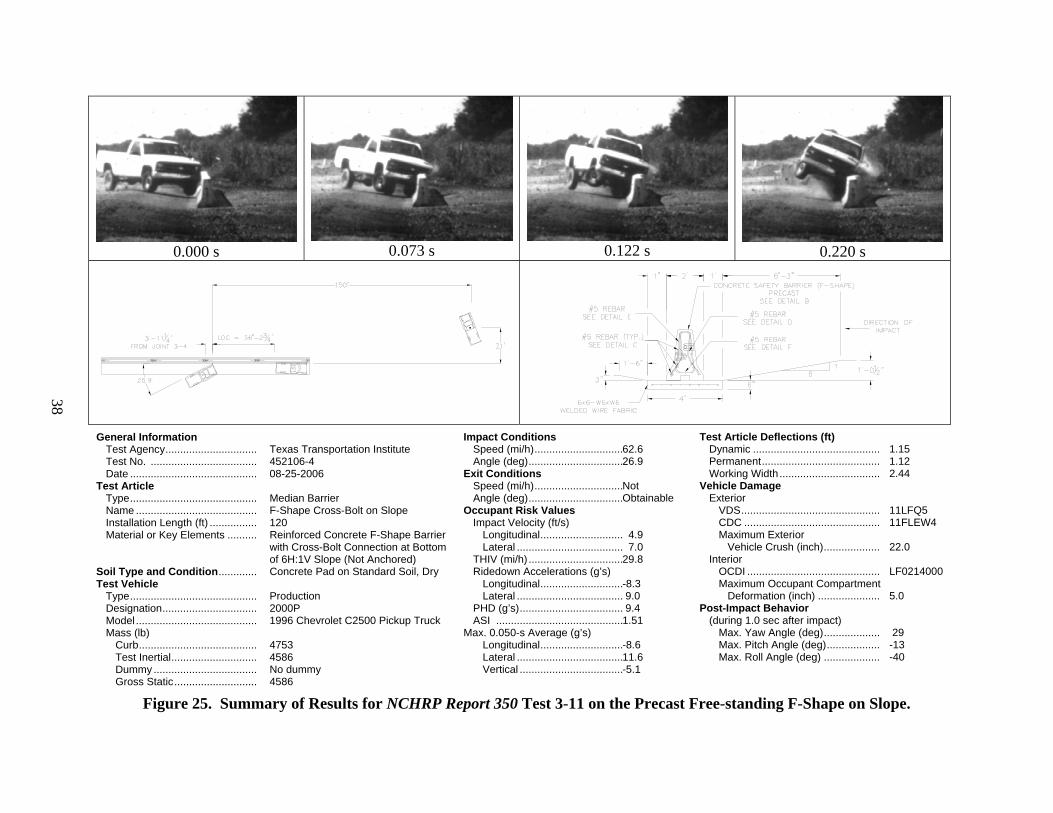
Occupant Risk Factors Researchers digitized data from the triaxial accelerometer, located at the vehicle center of gravity to compute occupant impact velocity and ridedown accelerations. Only the occupant impact velocity and ridedown accelerations in the longitudinal axis are required from these data for evaluation of criterion L in NCHRP Report 350. In the longitudinal direction, occupant impact velocity was 16.1 ft/s at 0.102 s; maximum 0.010-s ridedown acceleration was -8.3 g’s from 0.678 to 0.688 s; and the maximum 0.050-s average was -8.6 g’s between 0.042 and 0.092 s. In the lateral direction, the occupant impact velocity was 23.0 ft/s at 0.102 s; the highest 0.010-s occupant ridedown acceleration was 9.0 g’s from 0.228 to 0.238 s; and the maximum 0.050-s average was 11.6 g’s between 0.030 and 0.080 s. Figure 25 presents these data and other pertinent information from the test. Figures 39 through 45 in Appendix D present vehicle angular displacements and accelerations versus time traces. Assessment of Test Results An assessment of the test based on the applicable NCHRP Report 350 safety evaluation criteria is provided below.
Structural Adequacy B. Test article should contain and redirect the vehicle; the vehicle should not
penetrate, underride, or override the installation although controlled lateral deflection of the test article is acceptable.
Result: The precast F-shape concrete median barrier on 6H:1V slope contained
and redirected the pickup truck. The vehicle did not penetrate, underride, or override the installation. Maximum dynamic deflection during the test was 1.15 ft. (PASS)
Occupant Risk
D. Detached elements, fragments, or other debris from the test article should not penetrate or show potential for penetrating the occupant compartment, or present an undue hazard to other traffic, pedestrians, or personnel in a work zone. Deformation of, or intrusions into, the occupant compartment that could cause serious injuries should not be permitted.
Result: No detached elements, fragments, or other debris were present to penetrate
or to show potential for penetrating the occupant compartment, or to present hazard to others in the area. Maximum occupant compartment deformation was 5 inches in the floor pan to instrument panel area on the left side. (PASS)
38
0.000 s 0.073 s 0.122 s 0.220 s
General Information Test Agency............................... Test No. .................................... Date ........................................... Test Article Type........................................... Name ......................................... Installation Length (ft) ................ Material or Key Elements .......... Soil Type and Condition............. Test Vehicle Type........................................... Designation................................ Model ......................................... Mass (lb) Curb........................................ Test Inertial............................. Dummy ................................... Gross Static............................
Texas Transportation Institute 452106-4 08-25-2006 Median Barrier F-Shape Cross-Bolt on Slope 120 Reinforced Concrete F-Shape Barrier with Cross-Bolt Connection at Bottom of 6H:1V Slope (Not Anchored) Concrete Pad on Standard Soil, Dry Production 2000P 1996 Chevrolet C2500 Pickup Truck 4753 4586 No dummy 4586
Impact Conditions Speed (mi/h).............................. Angle (deg)................................Exit Conditions Speed (mi/h).............................. Angle (deg)................................Occupant Risk Values Impact Velocity (ft/s) Longitudinal............................ Lateral .................................... THIV (mi/h) ................................ Ridedown Accelerations (g’s) Longitudinal............................ Lateral .................................... PHD (g’s)................................... ASI ...........................................Max. 0.050-s Average (g’s) Longitudinal............................ Lateral .................................... Vertical ...................................
62.6 26.9 Not Obtainable 4.9 7.0 29.8 -8.3 9.0 9.4 1.51 -8.6 11.6 -5.1
Test Article Deflections (ft) Dynamic ........................................... Permanent........................................ Working Width .................................. Vehicle Damage Exterior VDS............................................... CDC .............................................. Maximum Exterior Vehicle Crush (inch)................... Interior OCDI ............................................. Maximum Occupant Compartment Deformation (inch) ..................... Post-Impact Behavior (during 1.0 sec after impact) Max. Yaw Angle (deg)................... Max. Pitch Angle (deg).................. Max. Roll Angle (deg) ...................
1.15 1.12 2.44 11LFQ5 11FLEW4 22.0 LF0214000 5.0 29 -13 -40
Figure 25. Summary of Results for NCHRP Report 350 Test 3-11 on the Precast Free-standing F-Shape on Slope.

39
F. The vehicle should remain upright during and after collision although moderate roll, pitching, and yawing are acceptable.
Result: The pickup truck remained upright during and after the collision event.
(PASS) Vehicle Trajectory
K. After collision, it is preferable that the vehicle’s trajectory not intrude into adjacent traffic lanes.
Result: The vehicle came to rest 150 ft downstream of impact and 21 ft toward the
“field” side of the barrier. (PASS) L. The occupant impact velocity in the longitudinal direction should not exceed
12 m/s and the occupant ridedown acceleration in the longitudinal direction should not exceed 20 g’s.
Result: Longitudinal occupant impact velocity was 16.1 ft/s, and longitudinal
ridedown acceleration was -8.3 g’s. (PASS) M. The exit angle from the test article preferably should be less than 60 percent
of the test impact angle, measured at time of vehicle loss of contact with the test device.
Result: Exit angle at loss of contact was not obtainable; however, the vehicle was
traveling parallel with the barrier as it exited. (PASS)
The following supplemental evaluation factors and terminology, as presented in the FHWA memo entitled “ACTION: Identifying Acceptable Highway Safety Features,” were used for visual assessment of test results. (6) Factors underlined below pertain to the results of the crash test reported herein.
Passenger Compartment Intrusion 1. Windshield Intrusion
a. No windshield contact e. Complete intrusion into b. Windshield contact, no damage passenger compartment c. Windshield contact, no intrusion f. Partial intrusion into d. Device embedded in windshield, no
significant intrusion passenger compartment
2. Body Panel Intrusion yes or no
Loss of Vehicle Control 1. Physical loss of control 3. Perceived threat to other vehicles 2. Loss of windshield visibility 4. Debris on pavement
40
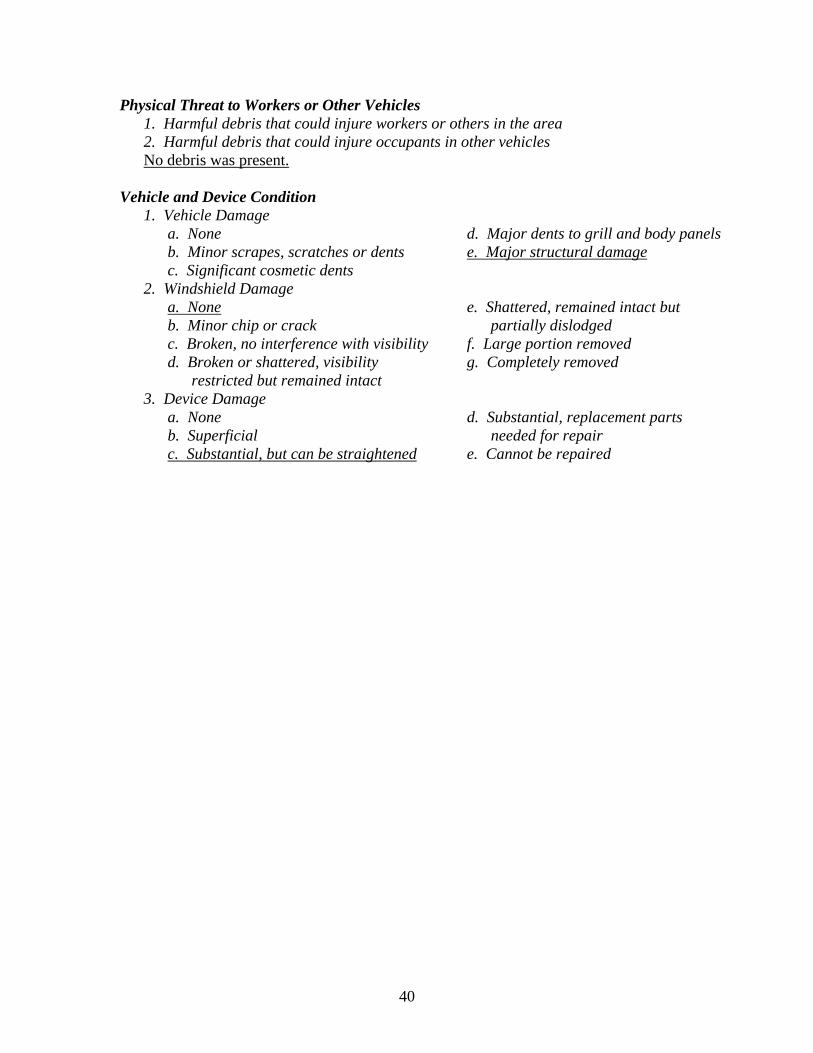
Physical Threat to Workers or Other Vehicles 1. Harmful debris that could injure workers or others in the area 2. Harmful debris that could injure occupants in other vehicles
No debris was present.
Vehicle and Device Condition 1. Vehicle Damage
a. None d. Major dents to grill and body panels b. Minor scrapes, scratches or dents e. Major structural damage c. Significant cosmetic dents
2. Windshield Damage a. None e. Shattered, remained intact but b. Minor chip or crack partially dislodged c. Broken, no interference with visibility f. Large portion removed d. Broken or shattered, visibility
restricted but remained intact g. Completely removed
3. Device Damage a. None d. Substantial, replacement parts b. Superficial needed for repair c. Substantial, but can be straightened e. Cannot be repaired
41
CHAPTER 5. SUMMARY AND CONCLUSIONS
TxDOT desires to use its permanent and free-standing F-shape concrete median barriers on roadside and median cross-slopes greater than the current recommended maximum of 10H:1V. In an earlier part of this research, a TTI research team conducted full scale vehicular finite element simulation analysis to evaluate several impact scenarios associated with placement of concrete barrier on typical depressed median configurations. The results of this analysis indicated a reasonable probability of acceptable performance of the F-shape concrete barrier for slopes as steep as 6H:1V. However, since the finite element pickup truck model used in the analyses had not been thoroughly validated for encroachments across median slopes and ditches, it was recommended that full-scale crash tests be performed to verify impact performance.
Researchers performed two full-scale crash tests in this part of the research for evaluating the TxDOT permanent and free-standing barriers on 6H:1V cross-slopes. These tests were performed with a pickup truck because it is considered to be a more critical design vehicle than the small passenger car in terms of stability, potential for barrier override, and occupant compartment deformation. Using results of the simulation analyses, the critical lateral barrier offset from the breakpoint of the roadside cross-slope was determined to be 7.25 ft. At this offset, the vehicle body was determined to be at its maximum height with respect to the local terrain, which is expected to maximize the potential for vehicle instability and barrier override.
TxDOT’s permanent cast-in-place F-shape barrier was evaluated in the first crash test
(Test 452106-3). As summarized in Table 1, the barrier performed acceptably for NCHRP Report 350 test 3-11. However, the lateral offset of the barrier in the crash test was inadvertently 6 ft more than the critical lateral offset. Consequently, the vehicle was losing height when it impacted the barrier and, therefore, may not have adequately evaluated the concern of vehicle instability. However, the researchers believe that the tested barrier location was more critical in terms of vehicle occupant compartment deformation. After reaching its point of maximum elevation, the vehicle began to nose down into the barrier, thus imparting greater impact forces than if the barrier was placed at the location corresponding to maximum vehicle height. The increased impact forces will result in an increase in occupant compartment deformation.
Compared to a permanent barrier, a free-standing barrier generally results in greater
vehicular instability as it deflects laterally and allows greater vehicle climb and roll during impact. The second test (Test 452106-4), which was conducted with a free-standing barrier was, therefore, considered to be a worse case evaluation of vehicular stability for both types of barriers when placed at the critical lateral offset from the slope breakpoint.
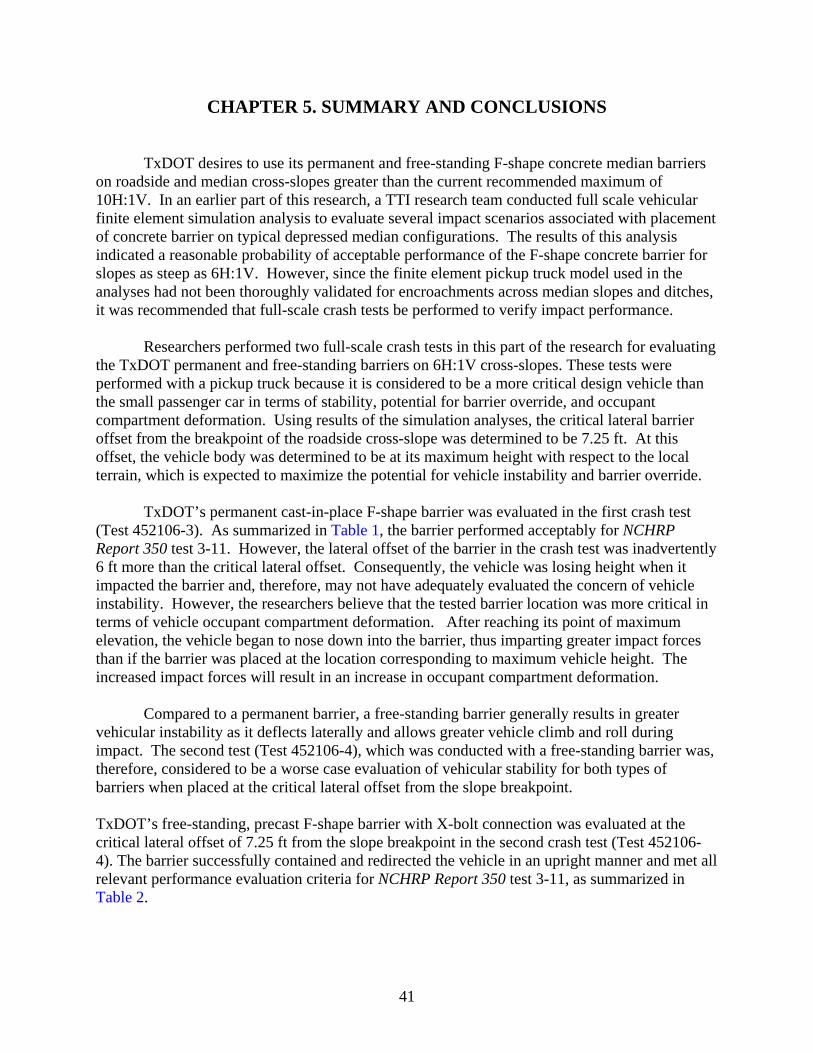
TxDOT’s free-standing, precast F-shape barrier with X-bolt connection was evaluated at the critical lateral offset of 7.25 ft from the slope breakpoint in the second crash test (Test 452106-4). The barrier successfully contained and redirected the vehicle in an upright manner and met all relevant performance evaluation criteria for NCHRP Report 350 test 3-11, as summarized in Table 2.

42
Table 1. Performance Evaluation Summary for NCHRP Report 350 Test 3-11
on the Permanent F-Shape Barrier on Slope. Test Agency: Texas Transportation Institute Test No.: 452106-3 Test Date: 07-28-2006
NCHRP Report 350 3-11 Evaluation Criteria Test Results Assessment Structural Adequacy A. Test article should contain and redirect the vehicle; the
vehicle should not penetrate, underride, or override the installation, although controlled lateral deflection of the test article is acceptable.
The pinned F-shape barrier on slope contained and redirected the pickup truck. The vehicle did not penetrate, underride, or override the installation. No deflection of the barrier occurred.
Pass
Occupant Risk D. Detached elements, fragments, or other debris from the test
article should not penetrate or show potential for penetrating the occupant compartment, or present an undue hazard to other traffic, pedestrians, or personnel in a work zone. Deformations of, or intrusions into, the occupant compartment that could cause serious injuries should not be permitted.
No deflection of the barrier occurred. No detached elements, fragments, or other debris were present to penetrate or show potential for penetrating the occupant compartment or present hazard to others in the area. Maximum occupant compartment deformation was 5.4 inches.
Pass
F. The vehicle should remain upright during and after collision although moderate roll, pitching, and yawing are acceptable.
The pickup truck remained upright during and after the collision event. Pass
Vehicle Trajectory K. After collision, it is preferable that the vehicle’s trajectory
not intrude into adjacent traffic lanes. The vehicle came to rest 153 ft downstream of impact and 14 ft toward the “field” side of the barrier. Pass*
L. The occupant impact velocity in the longitudinal direction should not exceed 12 m/s and the occupant ridedown acceleration in the longitudinal direction should not exceed 20 g’s.
Longitudinal occupant impact velocity was 18 ft/s, and longitudinal ridedown acceleration was -5.5 g’s. Pass
M. The exit angle from the test article preferably should be less than 60 percent of test impact angle, measured at time of vehicle loss of contact with test device.
Exit angle at loss of contact with the barrier was 11 degrees, which was 44 percent of the impact angle.
Pass*
*Criterion K and M are preferable, not required.
43
Table 2. Performance Evaluation Summary for NCHRP Report 350 Test 3-11
on the Pre-cast Free-standing F-Shape Barrier on Slope. Test Agency: Texas Transportation Institute Test No.: 452106-4 Test Date: 08-25-2006
NCHRP Report 350 3-11 Evaluation Criteria Test Results Assessment Structural Adequacy A. Test article should contain and redirect the vehicle; the
vehicle should not penetrate, underride, or override the installation, although controlled lateral deflection of the test article is acceptable.
The F-shape barrier on slope contained and redirected the pickup truck. The vehicle did not penetrate, underride, or override the installation. Maximum dynamic deflection during the test was 1.15 ft.
Pass
Occupant Risk D. Detached elements, fragments, or other debris from the test
article should not penetrate or show potential for penetrating the occupant compartment, or present an undue hazard to other traffic, pedestrians, or personnel in a work zone. Deformations of, or intrusions into, the occupant compartment that could cause serious injuries should not be permitted.
No detached elements, fragments, or other debris were present to penetrate or to show potential for penetrating the occupant compartment or to present hazard to others in the area. Maximum occupant compartment deformation was 5 inches in the floor pan to instrument panel area on the left side.
Pass
F. The vehicle should remain upright during and after collision although moderate roll, pitching, and yawing are acceptable.
The pickup truck remained upright during and after the collision event. Pass
Vehicle Trajectory K. After collision, it is preferable that the vehicle’s trajectory
not intrude into adjacent traffic lanes. The vehicle came to rest 150 ft downstream of impact and 21 ft toward the “field” side of the barrier. Pass*
L. The occupant impact velocity in the longitudinal direction should not exceed 12 m/s and the occupant ridedown acceleration in the longitudinal direction should not exceed 20 g’s.
Longitudinal occupant impact velocity was 16.1 ft/s, and longitudinal ridedown acceleration was -8.3 g’s. Pass
M. The exit angle from the test article preferably should be less than 60 percent of test impact angle, measured at time of vehicle loss of contact with test device.
Exit angle at loss of contact was not obtainable; however, the vehicle was traveling parallel with the barrier as it exited.
Pass*
*Criterion K and M are preferable, not required.
44
It can be thus concluded that TxDOT’s permanent and free-standing F-shape concrete barriers perform adequately on roadside and median cross-slopes of 6H:1V or flatter. Since their performance was successfully evaluated for the critical lateral offset, the barriers should perform adequately for any lateral offset of the barrier from the roadway edge; and for any width of depressed V-ditch median as long as the barrier is placed at its center. Similar or better performance would be expected for similar barrier placements on more gentle (e.g., 8H:1V) slopes.

45
CHAPTER 6. IMPLEMENTATION STATEMENT
The TxDOT Roadway Design Manual currently suggests that concrete barrier should not
be placed on slopes steeper than 10H:1V. This suggestion has limited the placement of concrete barriers to narrow, flat, paved medians or at the edge of the shoulder.
Based on finite element analysis in the previous part of this research and the crash testing
results reported herein, the TxDOT cast-in-place permanent F-shape barrier and the precast free-standing F-shape barrier are considered suitable for placement on roadside and median foreslopes of 6H:1V or less. Additionally, these barriers are suitable to be placed at any lateral offset of the barrier from the roadway edge and for any width of depressed V-ditch median as long as the barrier is placed at its center. Similar or better performance would be expected for placements on more gentle (e.g., 8H:1V) slopes.
Increasing the maximum slope on which concrete median barriers can be placed will
allow installations to be placed further from the travelway, which in turn should lead to a reduction in barrier impact frequency and severity.
Statewide implementation of this research can be achieved through TxDOT’s Design
Division by modification of language in the TxDOT Roadway Design Manual. The maximum allowable cross-slope in the area between the roadway and the barrier can be modified from 10H:1V to 6H:1V.

47
REFERENCES 1. American Association of State Highway and Transportation Officials (2002). Roadside
Design Guide, AASHTO, Washington, D.C. 2. Texas Department of Transportation (2005). Roadway Design Manual, Texas Department of
Transportation, Austin, Texas. 3. N. M. Sheikh and R. P. Bligh, “Analysis of the Impact Performance of Concrete Median
Barrier Placed on or Adjacent to Slopes,” Technical Report 0-5210-1, Texas Transportation Institute, The Texas A&M University System, College Station, Texas, May 2006.
4. H. E. Ross, Jr., D. L. Sicking, R. A. Zimmer and J. D. Michie. Recommended Procedures for
the Safety Performance Evaluation of Highway Features, National Cooperative Highway Research Program Report 350, Transportation Research Board, National Research Council, Washington, D.C., 1993.
5. C.E. Buth, T.J. Hirsch, and W.L. Menges, Testing of New Bridge Rail and Transition
Designs, Volume VII: Appendix F, 32-inch (813 mm) F-Shape Bridge Railing, FHWA Report FHWA-RD-93-064, Federal Highway Administration, McLean, Virginia, June 1997.
6. Federal Highway Administration Memorandum from the Director, Office of Engineering,
entitled: “ACTION: Identifying Acceptable Highway Safety Features,” dated July 25, 1997.


49
APPENDIX A. CRASH TEST AND DATA ANALYSIS PROCEDURES The crash test and data analysis procedures were in accordance with guidelines presented in NCHRP Report 350. Brief descriptions of these procedures are presented as follows. ELECTRONIC INSTRUMENTATION AND DATA PROCESSING The test vehicle was instrumented with three solid-state angular rate transducers to measure roll, pitch, and yaw rates; a triaxial accelerometer near the vehicle center of gravity (c.g.) to measure longitudinal, lateral, and vertical acceleration levels; and a backup biaxial accelerometer in the rear of the vehicle to measure longitudinal and lateral acceleration levels. These accelerometers were ENDEVCO® Model 2262CA, piezoresistive accelerometers with a +100 g range. The accelerometers are strain gage type with a linear millivolt output proportional to acceleration. Angular rate transducers are solid state, gas flow units designed for high-“g” service. Signal conditioners and amplifiers in the test vehicle increase the low-level signals to a +2.5 volt maximum level. The signal conditioners also provide the capability of a resistive calibration (R-cal) or shunt calibration for the accelerometers and a precision voltage calibration for the rate transducers. The electronic signals from the accelerometers and rate transducers are transmitted to a base station by means of a 15-channel, constant bandwidth, Inter-Range Instrumentation Group (I.R.I.G.), FM/FM telemetry link for recording and for display. Calibration signals from the test vehicle are recorded before the test and immediately afterwards. A crystal-controlled time reference signal is simultaneously recorded with the data. Wooden dowels actuate pressure-sensitive switches on the bumper of the impacting vehicle prior to impact by wooden dowels to indicate the elapsed time over a known distance to provide a measurement of impact velocity. The initial contact also produces an “event” mark on the data record to establish the instant of contact with the installation. The multiplex of data channels, transmitted on one radio frequency, is received and demultiplexed onto a TEAC® instrumentation data recorder. After the test, the data are played back from the TEAC® recorder and digitized. A proprietary software program (WinDigit) converts the analog data from each transducer into engineering units using the R-cal and pre-zero values at 10,000 samples per second per channel. WinDigit also provides Society of Automotive Engineers (SAE) J211 class 180 phaseless digital filtering and vehicle impact velocity. All accelerometers are calibrated annually according to the SAE J211 4.6.1 by means of an ENDEVCO® 2901, precision primary vibration standard. This device and its support instruments are returned to the factory annually for a National Institute of Standards Technology (NIST) traceable calibration. The subsystems of each data channel are also evaluated annually, using instruments with current NIST traceability, and the results are factored into the accuracy of the total data channel, per SAE J211. Calibrations and evaluations are made any time data are suspect.

50
The Test Risk Assessment Program (TRAP) uses the data from WinDigit to compute occupant/compartment impact velocities, time of occupant/compartment impact after vehicle impact, and the highest 10-millisecond (ms) average ridedown acceleration. WinDigit calculates change in vehicle velocity at the end of a given impulse period. In addition, WinDigit computes maximum average accelerations over 50-ms intervals in each of the three directions. For reporting purposes, the data from the vehicle-mounted accelerometers are filtered with a 60-Hz digital filter, and acceleration versus time curves for the longitudinal, lateral, and vertical directions are plotted using TRAP. TRAP uses the data from the yaw, pitch, and roll rate transducers to compute angular displacement in degrees at 0.0001-s intervals and then plots yaw, pitch, and roll versus time. These displacements are in reference to the vehicle-fixed coordinate system, with the initial position and orientation of the vehicle-fixed coordinate systems being initial impact. ANTHROPOMORPHIC DUMMY INSTRUMENTATION Use of a dummy in the 2000P vehicle is optional according to NCHRP Report 350, and there was no dummy used in the tests with the 2000P vehicle. PHOTOGRAPHIC INSTRUMENTATION AND DATA PROCESSING Photographic coverage of the test included three high-speed cameras: one overhead with a field-of-view perpendicular to the ground and directly over the impact point; one placed behind the installation at an angle; and a third placed to have a field-of-view parallel to and aligned with the installation at the downstream end. A flash bulb activated by pressure-sensitive tape switches was positioned on the impacting vehicle to indicate the instant of contact with the installation and was visible from each camera. The films from these high-speed cameras were analyzed on a computer-linked Motion Analyzer to observe phenomena occurring during the collision and to obtain time-event, displacement, and angular data. A DV-format video camera and still cameras were used to record and document conditions of the test vehicle and installation before and after the test. TEST VEHICLE PROPULSION AND GUIDANCE The test vehicle was towed into the test installation using a steel cable guidance and reverse tow system. A steel cable for guiding the test vehicle was tensioned along the path, anchored at each end, and threaded through an attachment to the front wheel of the test vehicle. An additional steel cable was connected to the test vehicle, passed around a pulley near the impact point, through a pulley on the tow vehicle, and then anchored to the ground such that the tow vehicle moved away from the test site. A 2-to-1 speed ratio between the test and tow vehicle existed with this system. Just prior to impact with the installation, the test vehicle was released to be free-wheeling and unrestrained. The vehicle remained free-wheeling, i.e., no steering or braking inputs, until the vehicle cleared the immediate area of the test site, at which time the vehicle’s brakes were activated to bring it to a safe and controlled stop.

51
APPENDIX B. TEST VEHICLE PROPERTIES AND INFORMATION Date: 07-28-2006 Test No.: 452106-3 VIN No.: 1GCGC24ROYR192344 Year: 2000 Make: Chevrolet Model: C2500 Tire Inflation Pressure: 50/80 psi Odometer: 185035 Tire Size: 245/75R16 Describe any damage to the vehicle prior to test:
Geometry (mm) A 1880 E 1310 J 1038 N 1590 R 750 B 810 F 5470 K 635 O 1610 S 900 C 3350 G 1465.6 L 70 P 725 T 1460 D 1820 H M 415 Q 440 U 3360
Mass (kg) Curb Test Inertial Gross Static M1 1216 1179 M2 940 917 MTotal 2156 2096
Mass Distribution (kg): LF: 589 RF: 590 LR: 439 RR: 478
Figure 26. Vehicle Properties for Test No. 452106-3.
• Denotes accelerometer location. NOTES: Engine Type: V-8 Engine CID: 5.7 liter Transmission Type: Auto x Manual Optional Equipment: Dummy Data: Type: No dummy Mass: Seat Position:

52
>
Table 3. Exterior Crush Measurements for Test No. 452106-3.
VEHICLE CRUSH MEASUREMENT SHEET1 Complete When Applicable
End Damage Side Damage Undeformed end width ________
Corner shift: A1 ________
A2 ________
End shift at frame (CDC)
(check one)
< 4 inches ________
4 inches ________
Bowing: B1 _____ X1 _____
B2 _____ X2 _____
Bowing constant
X1 + X2 2 = ______
Note: Measure C1 to C6 from driver to passenger side in front or rear impacts – rear to front in side impacts.
Direct Damage Specific Impact Number
Plane* of C-Measurements
Width** (CDC)
Max*** Crush
Field L**
C1 C2 C3 C4 C5 C6 ±D
1 Front plane at bumper ht 900 550 700 550 450 380 240 160 20 -380
2 Side plane at bumper ht 900 500 1400 150 185 -- -- 370 500 +1730
1Table taken from National Accident Sampling System (NASS). *Identify the plane at which the C-measurements are taken (e.g., at bumper, above bumper, at sill, above sill, at beltline, etc.) or label adjustments (e.g., free space). Free space value is defined as the distance between the baseline and the original body contour taken at the individual C locations. This may include the following: bumper lead, bumper taper, side protrusion, side taper, etc. Record the value for each C-measurement and maximum crush. **Measure and document on the vehicle diagram the beginning or end of the direct damage width and field L (e.g., side damage with respect to undamaged axle). ***Measure and document on the vehicle diagram the location of the maximum crush. Note: Use as many lines/columns as necessary to describe each damage profile.

53
Table 4. Occupant Compartment Measurements for Test No. 452106-3.
T R U C K
OOccccuuppaanntt CCoommppaarrttmmeenntt DDeeffoorrmmaattiioonn
BEFORE AFTER(mm) (mm)
A1 870 829
A2 938 930
A3 933 945
B1 1074 978
B2 944 935
B3 1061 1058
C1 1368 1265
C2 ---- ----
C3 1371 1371
D1 326 196
D2 160 179
D3 308 334
E1 1584 1576
E2 1588 1592
F 1465 1460
G 1465 1450
H 1060 1037
I 1055 1055
J* 1522 1386*Lateral area across the cab from driver’s side kickpanel to passenger’s side kickpanel.

54
Date: 08-25-2006 Test No.: 452106-4 VIN No.: 1GCGC24RXTZ203827 Year: 1996 Make: Chevrolet Model: C2500 Tire Inflation Pressure: Odometer: 225423 Tire Size: 245/75R16 Describe any damage to the vehicle prior to test:
Geometry (mm) A 1880 E 1310 J 1038 N 1590 R 750 B 810 F 5470 K 635 O 1610 S 900 C 3350 G 1464.0 L 70 P 725 T 1460 D 1820 H M 415 Q 440 U 3360
Mass (kg) Curb Test Inertial Gross Static M1 1228 1171 M2 928 909 MTotal 2156 2080
Mass Distribution (kg): LF: 589 RF: 582 LR: 426 RR: 483
Figure 27. Vehicle Properties for Test No. 452106-4.
• Denotes accelerometer location. NOTES: Engine Type: V-8 Engine CID: 5.7 liter Transmission Type: x Auto Manual Optional Equipment: 8-lug Dummy Data: Type: No dummy Mass: Seat Position:

55
>
Table 5. Exterior Crush Measurements for Test No. 452106-4.
VEHICLE CRUSH MEASUREMENT SHEET1 Complete When Applicable
End Damage Side Damage Undeformed end width ________
Corner shift: A1 ________
A2 ________
End shift at frame (CDC)
(check one)
< 4 inches ________
4 inches ________
Bowing: B1 _____ X1 _____
B2 _____ X2 _____
Bowing constant
X1 + X2 2 = ______
Note: Measure C1 to C6 from driver to passenger side in front or rear impacts – rear to front in side impacts.
Direct Damage Specific Impact Number
Plane* of C-Measurements
Width** (CDC)
Max*** Crush
Field L**
C1 C2 C3 C4 C5 C6 ±D
1 Front plane at bumper ht 920 480 660 480 350 220 125 65 0 -330
2 Side plane at bumper ht 920 560 1480 0 85 --- --- 315 560 +1770
1Table taken from National Accident Sampling System (NASS). *Identify the plane at which the C-measurements are taken (e.g., at bumper, above bumper, at sill, above sill, at beltline, etc.) or label adjustments (e.g., free space). Free space value is defined as the distance between the baseline and the original body contour taken at the individual C locations. This may include the following: bumper lead, bumper taper, side protrusion, side taper, etc. Record the value for each C-measurement and maximum crush. **Measure and document on the vehicle diagram the beginning or end of the direct damage width and field L (e.g., side damage with respect to undamaged axle). ***Measure and document on the vehicle diagram the location of the maximum crush. Note: Use as many lines/columns as necessary to describe each damage profile.

56
Table 6. Occupant Compartment Measurements for Test No. 452106-4.
T R U C K
OOccccuuppaanntt CCoommppaarrttmmeenntt DDeeffoorrmmaattiioonn
BEFORE AFTER(mm) (mm)
A1 873 858
A2 942 942
A3 906 920
B1 1075 970
B2 954 923
B3 1074 1050
C1 1369 1310
C2 ---- ----
C3 1368 1368
D1 328 200
D2 160 151
D3 310 325
E1 1587 1580
E2 1585 1590
F 1460 1460
G 1460 1460
H 1060 1060
I 1060 1060
J* 1525 1465*Lateral area across the cab from driver’s side kickpanel to passenger’s side kickpanel.

57
APPENDIX C. SEQUENTIAL PHOTOGRAPHS
0.000 s 0.196 s
0.024 s 0.294 s
0.049 s 0.417 s
0.098 s 0.540 s Figure 28. Sequential Photographs for Test No. 452106-3
(Rear View).

58
0.000 s
0.024 s
0.049 s
0.098 s
Figure 29. Sequential Photographs for Test No. 452106-3 (Overhead and Frontal Views).

59
0.196s
0.294 s
0.417 s
0.540 s
Figure 29. Sequential Photographs for Test No. 452106-3 (Overhead and Frontal Views) (continued).

60
0.000 s
0.049 s
0.073 s
0.098 s
Figure 30. Sequential Photographs for Test No. 452106-4 (Overhead and Frontal Views).

61
0.122 s
0.171 s
0.220 s
0.268 s
Figure 30. Sequential Photographs for Test No. 452106-4 (Overhead and Frontal Views) (continued).

62
0.000 s 0.122 s
0.049 s 0.171 s
0.073 s 0.220 s
0.098 s 0.269 s Figure 31. Sequential Photographs for Test No. 452106-4
(Rear View).

63
APPE
ND
IX D
. VE
HIC
LE
AN
GU
LA
R D
ISPLA
CE
ME
NT
S A
ND
AC
CE
LE
RA
TIO
NS
Roll, Pitch, and Yaw Angles
0 0.1 0.2 0.3 0.4 0.5 0.6 0.7 0.8 0.9 1.0-20
-10
0
10
20
30
40
50
60
Time (s)
Ang
les
(deg
rees
)Test Number: 452106-3Test Date: July 28, 2006Test Article: Permanent F-Shape Barrier on 6V:1H SlopeTest Vehicle: 2000 Chevrolet C2500 PickupInertial Mass: 4620 lbImpact Speed: 62.9 mi/hImpact Angle: 24.7 degrees
Roll Pitch Yaw
Figure 32. Vehicle Angular Displacements for Test 452106-3.
Axes are vehicle-fixed. Sequence for determining orientation:
1. Yaw. 2. Pitch. 3. Roll.

64
X Acceleration at CG
0 0.1 0.2 0.3 0.4 0.5 0.6 0.7 0.8 0.9 1.0-30
-20
-10
0
10
20
Time (s)
Long
itudi
nal A
ccel
erat
ion
(g's
)
Test Number: 452106-3Test Date: July 28, 2006Test Article: Permanent F-Shape Barrier on 6V:1H SlopeTest Vehicle: 2000 Chevrolet C2500 PickupInertial Mass: 4620 lbImpact Speed: 62.9 mi/hImpact Angle: 24.7 degrees
Time of OIV (0.0962 sec) SAE Class 60 Filter
Figure 33. Vehicle Longitudinal Accelerometer Trace for Test 452106-3 (Accelerometer Located at Center of Gravity).

65
Y Acceleration at CG
0 0.1 0.2 0.3 0.4 0.5 0.6 0.7 0.8 0.9 1.0-20
-10
0
10
20
30
40
50
Time (s)
Late
ral A
ccel
erat
ion
(g's
)Test Number: 452106-3Test Date: July 28, 2006Test Article: Permanent F-Shape Barrier on 6V:1H SlopeTest Vehicle: 2000 Chevrolet C2500 PickupInertial Mass: 4620 lbImpact Speed: 62.9 mi/hImpact Angle: 24.7 degrees
Time of OIV (0.0962 sec) SAE Class 60 Filter
Figure 34. Vehicle Lateral Accelerometer Trace for Test 452106-3 (Accelerometer Located at Center of Gravity).

66
Z Acceleration at CG
0 0.1 0.2 0.3 0.4 0.5 0.6 0.7 0.8 0.9 1.0-20
-10
0
10
20
Time (s)
Vert
ical
Acc
eler
atio
n (g
's)
Test Number: 452106-3Test Date: July 28, 2006Test Article: Permanent F-Shape Barrier on 6V:1H SlopeTest Vehicle: 2000 Chevrolet C2500 PickupInertial Mass: 4620 lbImpact Speed: 62.9 mi/hImpact Angle: 24.7 degrees
SAE Class 60 Filter
Figure 35. Vehicle Vertical Accelerometer Trace for Test 452106-3 (Accelerometer Located at Center of Gravity).
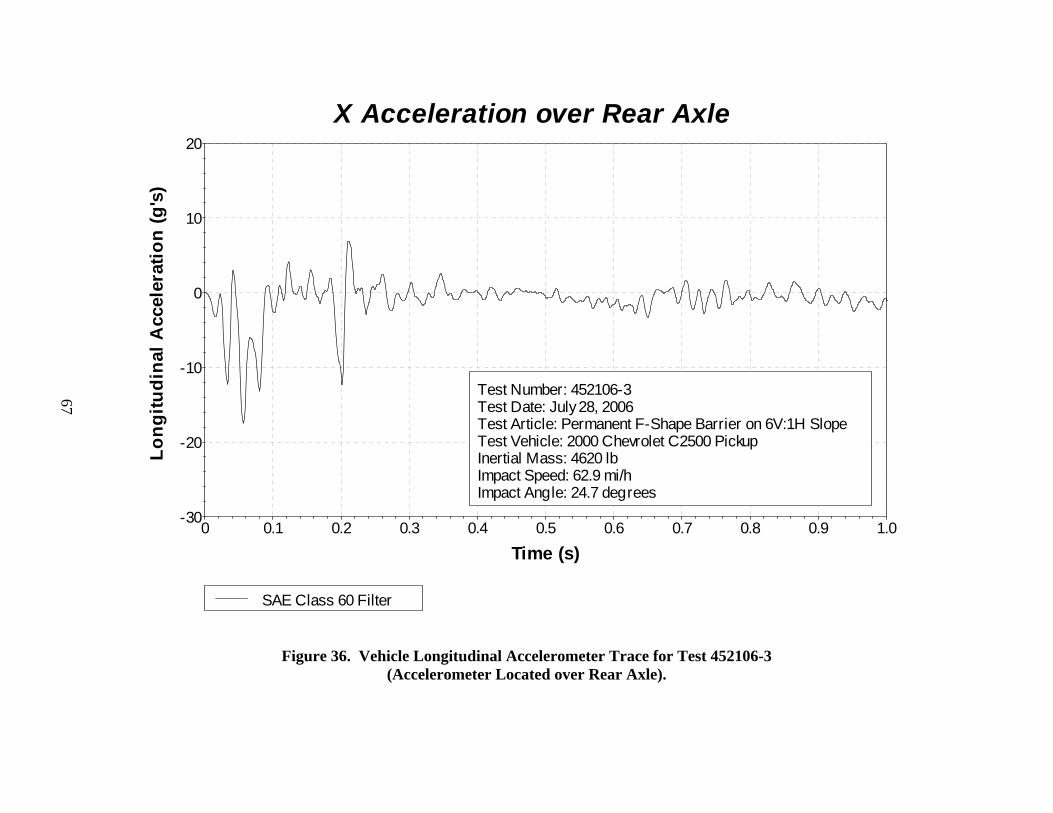
67
X Acceleration over Rear Axle
0 0.1 0.2 0.3 0.4 0.5 0.6 0.7 0.8 0.9 1.0-30
-20
-10
0
10
20
Time (s)
Long
itudi
nal A
ccel
erat
ion
(g's
)
Test Number: 452106-3Test Date: July 28, 2006Test Article: Permanent F-Shape Barrier on 6V:1H SlopeTest Vehicle: 2000 Chevrolet C2500 PickupInertial Mass: 4620 lbImpact Speed: 62.9 mi/hImpact Angle: 24.7 degrees
SAE Class 60 Filter
Figure 36. Vehicle Longitudinal Accelerometer Trace for Test 452106-3 (Accelerometer Located over Rear Axle).
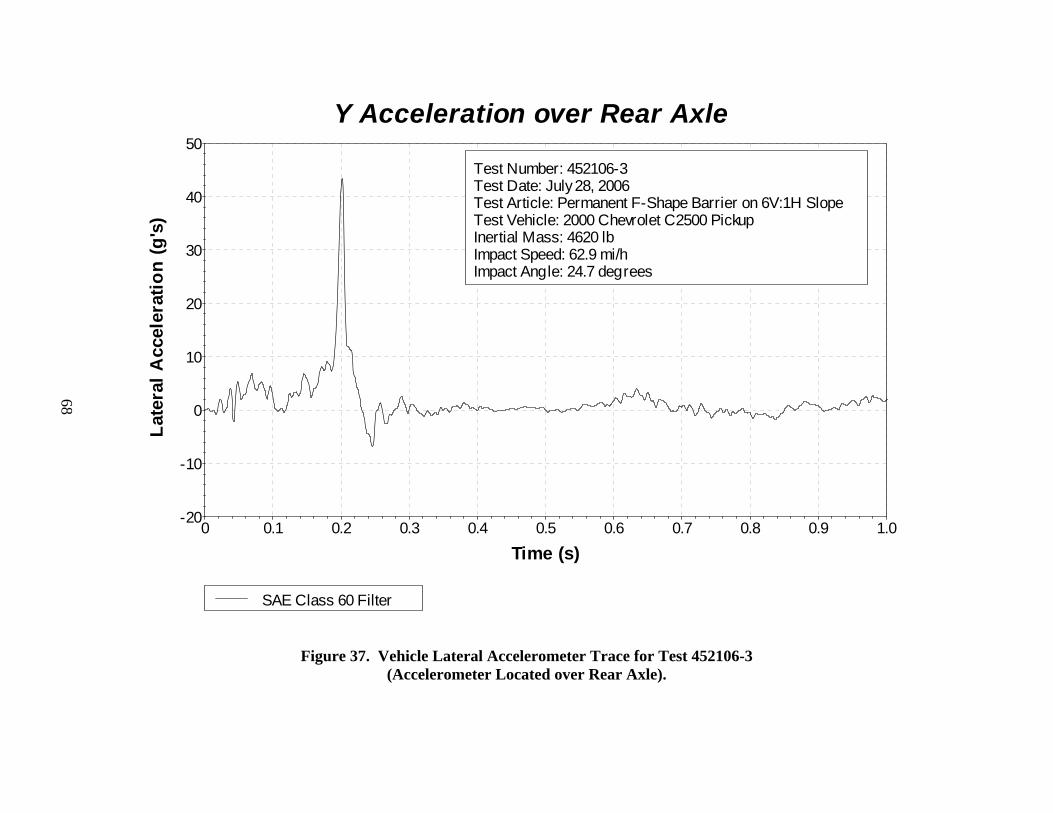
68
Y Acceleration over Rear Axle
0 0.1 0.2 0.3 0.4 0.5 0.6 0.7 0.8 0.9 1.0-20
-10
0
10
20
30
40
50
Time (s)
Late
ral A
ccel
erat
ion
(g's
)Test Number: 452106-3Test Date: July 28, 2006Test Article: Permanent F-Shape Barrier on 6V:1H SlopeTest Vehicle: 2000 Chevrolet C2500 PickupInertial Mass: 4620 lbImpact Speed: 62.9 mi/hImpact Angle: 24.7 degrees
SAE Class 60 Filter
Figure 37. Vehicle Lateral Accelerometer Trace for Test 452106-3 (Accelerometer Located over Rear Axle).
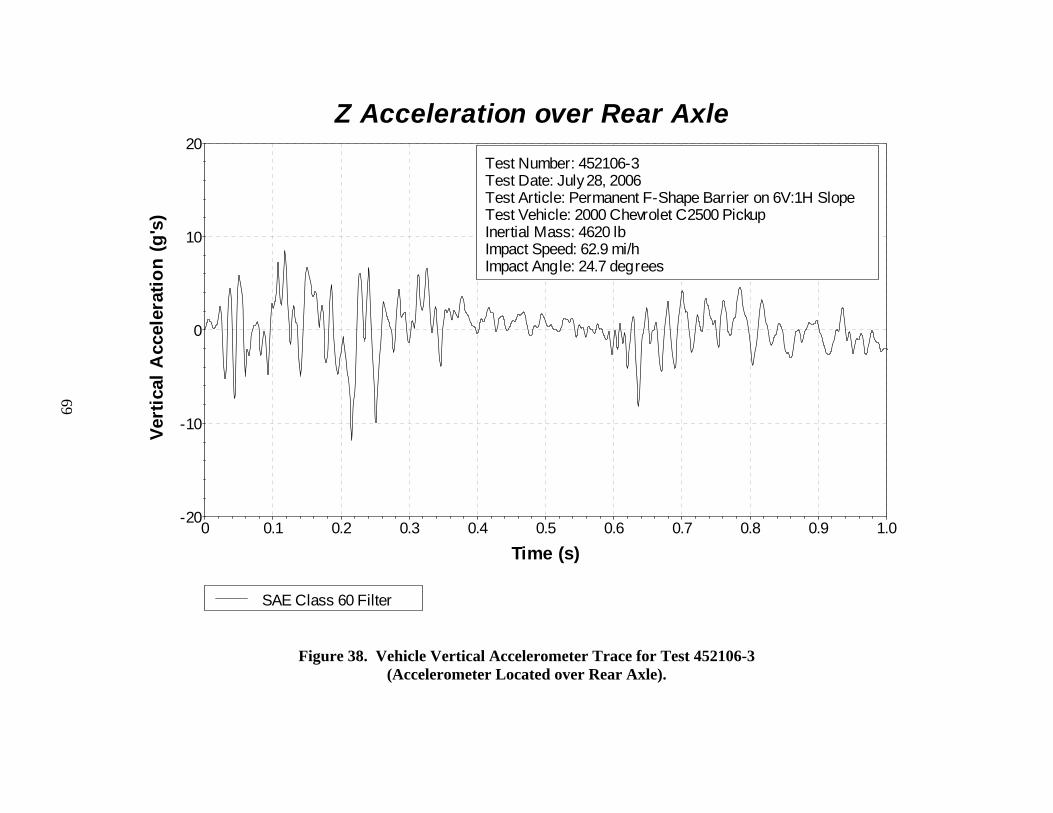
69
Z Acceleration over Rear Axle
0 0.1 0.2 0.3 0.4 0.5 0.6 0.7 0.8 0.9 1.0-20
-10
0
10
20
Time (s)
Vert
ical
Acc
eler
atio
n (g
's)
Test Number: 452106-3Test Date: July 28, 2006Test Article: Permanent F-Shape Barrier on 6V:1H SlopeTest Vehicle: 2000 Chevrolet C2500 PickupInertial Mass: 4620 lbImpact Speed: 62.9 mi/hImpact Angle: 24.7 degrees
SAE Class 60 Filter
Figure 38. Vehicle Vertical Accelerometer Trace for Test 452106-3 (Accelerometer Located over Rear Axle).
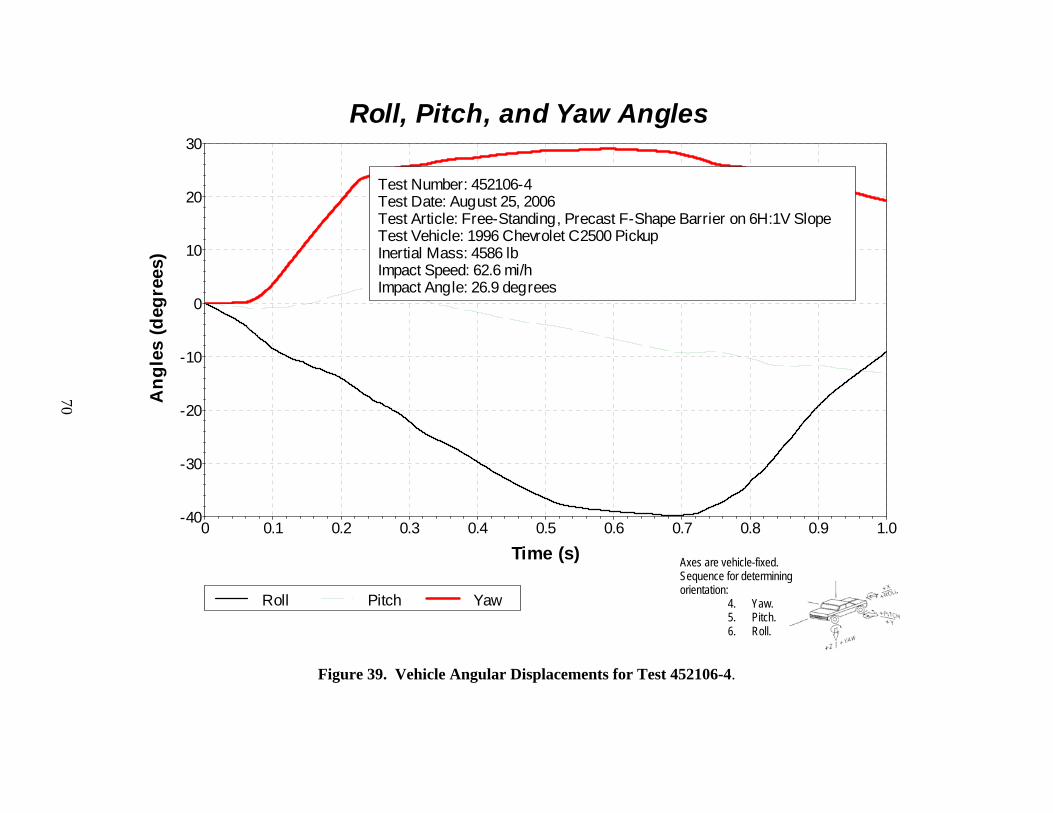
70
Roll, Pitch, and Yaw Angles
0 0.1 0.2 0.3 0.4 0.5 0.6 0.7 0.8 0.9 1.0-40
-30
-20
-10
0
10
20
30
Time (s)
Ang
les
(deg
rees
)Test Number: 452106-4Test Date: August 25, 2006Test Article: Free-Standing, Precast F-Shape Barrier on 6H:1V SlopeTest Vehicle: 1996 Chevrolet C2500 PickupInertial Mass: 4586 lbImpact Speed: 62.6 mi/hImpact Angle: 26.9 degrees
Roll Pitch Yaw
Figure 39. Vehicle Angular Displacements for Test 452106-4.
Axes are vehicle-fixed. Sequence for determining orientation:
4. Yaw. 5. Pitch. 6. Roll.

71
X Acceleration at CG
0 0.1 0.2 0.3 0.4 0.5 0.6 0.7 0.8 0.9 1.0-30
-20
-10
0
10
Time (s)
Long
itudi
nal A
ccel
erat
ion
(g's
)
Test Number: 452106-4Test Date: August 25, 2006Test Article: Free-Standing, Precast F-Shape Barrier on 6H:1V SlopeTest Vehicle: 1996 Chevrolet C2500 PickupInertial Mass: 4586 lbImpact Speed: 62.6 mi/hImpact Angle: 26.9 degrees
Time of OIV (0.1017 sec) SAE Class 60 Filter
Figure 40. Vehicle Longitudinal Accelerometer Trace for Test 452106-4 (Accelerometer Located at Center of Gravity).

72
Y Acceleration at CG
0 0.1 0.2 0.3 0.4 0.5 0.6 0.7 0.8 0.9 1.0-10
0
10
20
30
Time (s)
Late
ral A
ccel
erat
ion
(g's
)Test Number: 452106-4Test Date: August 25, 2006Test Article: Free-Standing, Precast F-Shape Barrier on 6H:1V SlopeTest Vehicle: 1996 Chevrolet C2500 PickupInertial Mass: 4586 lbImpact Speed: 62.6 mi/hImpact Angle: 26.9 degrees
Time of OIV (0.1017 sec) SAE Class 60 Filter
Figure 41. Vehicle Lateral Accelerometer Trace for Test 452106-4 (Accelerometer Located at Center of Gravity).

73
Z Acceleration at CG
0 0.1 0.2 0.3 0.4 0.5 0.6 0.7 0.8 0.9 1.0-40
-30
-20
-10
0
10
20
Time (s)
Vert
ical
Acc
eler
atio
n (g
's)
Test Number: 452106-4Test Date: August 25, 2006Test Article: Free-Standing, Precast F-Shape Barrier on 6H:1V SlopeTest Vehicle: 1996 Chevrolet C2500 PickupInertial Mass: 4586 lbImpact Speed: 62.6 mi/hImpact Angle: 26.9 degrees
SAE Class 60 Filter
Figure 42. Vehicle Vertical Accelerometer Trace for Test 452106-4 (Accelerometer Located at Center of Gravity).

74
X Acceleration over Rear Axle
0 0.1 0.2 0.3 0.4 0.5 0.6 0.7 0.8 0.9 1.0-30
-20
-10
0
10
Time (s)
Long
itudi
nal A
ccel
erat
ion
(g's
)
Test Number: 452106-4Test Date: August 25, 2006Test Article: Free-Standing, Precast F-Shape Barrier on 6H:1V SlopeTest Vehicle: 1996 Chevrolet C2500 PickupInertial Mass: 4586 lbImpact Speed: 62.6 mi/hImpact Angle: 26.9 degrees
SAE Class 60 Filter
Figure 43. Vehicle Longitudinal Accelerometer Trace for Test 452106-4 (Accelerometer Located over Rear Axle).
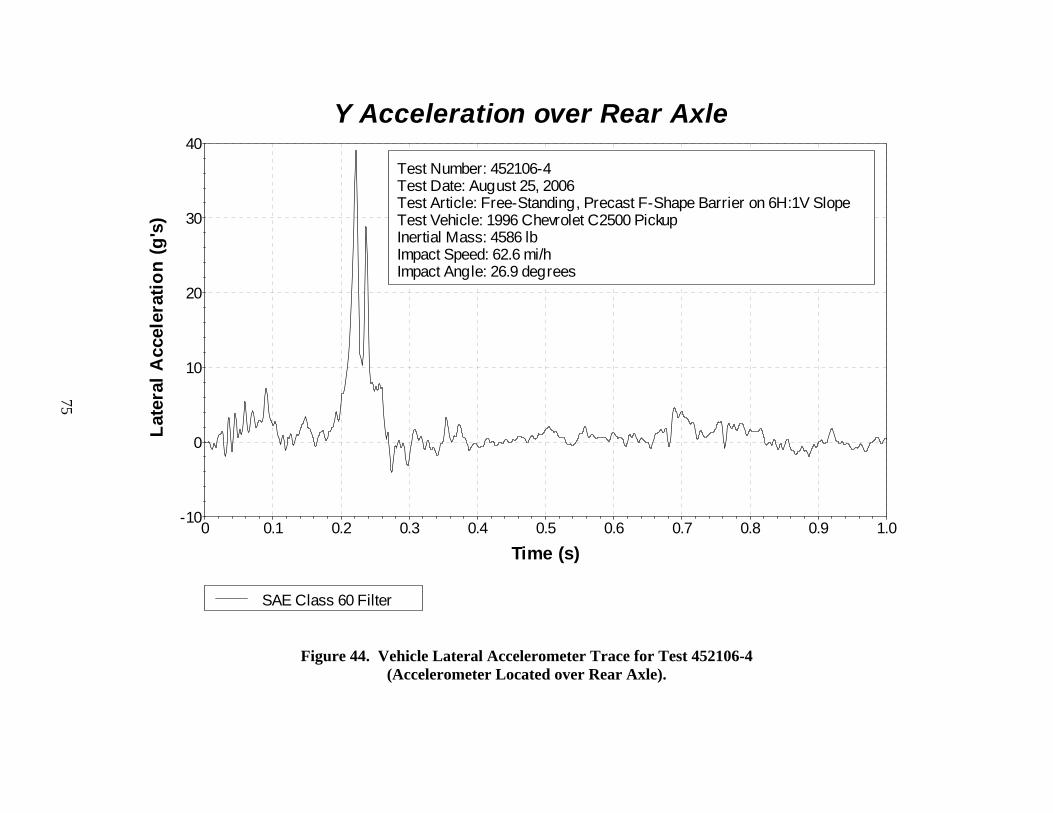
75
Y Acceleration over Rear Axle
0 0.1 0.2 0.3 0.4 0.5 0.6 0.7 0.8 0.9 1.0-10
0
10
20
30
40
Time (s)
Late
ral A
ccel
erat
ion
(g's
)Test Number: 452106-4Test Date: August 25, 2006Test Article: Free-Standing, Precast F-Shape Barrier on 6H:1V SlopeTest Vehicle: 1996 Chevrolet C2500 PickupInertial Mass: 4586 lbImpact Speed: 62.6 mi/hImpact Angle: 26.9 degrees
SAE Class 60 Filter
Figure 44. Vehicle Lateral Accelerometer Trace for Test 452106-4 (Accelerometer Located over Rear Axle).

76
Z Acceleration over Rear Axle
0 0.1 0.2 0.3 0.4 0.5 0.6 0.7 0.8 0.9 1.0-40
-30
-20
-10
0
10
20
Time (s)
Vert
ical
Acc
eler
atio
n (g
's)
Test Number: 452106-4Test Date: August 25, 2006Test Article: Free-Standing, Precast F-Shape Barrier on 6H:1V SlopeTest Vehicle: 1996 Chevrolet C2500 PickupInertial Mass: 4586 lbImpact Speed: 62.6 mi/hImpact Angle: 26.9 degrees
SAE Class 60 Filter
Figure 45. Vehicle Vertical Accelerometer Trace for Test 452106-4 (Accelerometer Located over Rear Axle).


![arXiv:1907.12647v1 [cs.CV] 15 Jul 2019 · (e.g., concrete barriers, metal crash barriers, rumble strips) play an important role in preventing or mitigating vehicle crashes. Accurate](https://static.fdocuments.us/doc/165x107/5f5a06f8adc2aa22602be5fe/arxiv190712647v1-cscv-15-jul-2019-eg-concrete-barriers-metal-crash-barriers.jpg)