Crane Loads & Wharf Structure Design: Putting the Two · PDF file1of 77 Arun Bhimani, S.E....
79
1 of 77 Arun Bhimani, S.E. President Liftech Consultants Inc. Crane Loads & Wharf Structure Design: Putting the Two Together AAPA Facilities Engineering Seminar January 2006 – Jacksonville, Florida Erik Soderberg, S.E. Principal Liftech Consultants Inc. www.liftech.net
Transcript of Crane Loads & Wharf Structure Design: Putting the Two · PDF file1of 77 Arun Bhimani, S.E....

1 of 77
Arun Bhimani, S.E.PresidentLiftech Consultants Inc.
Crane Loads & Wharf Structure Design:Putting the Two TogetherAAPA Facilities Engineering SeminarJanuary 2006 – Jacksonville, Florida
Erik Soderberg, S.E.PrincipalLiftech Consultants Inc.www.liftech.net

2 of 77
Crane Size Growth:1st Container Crane & Jumbo Crane
3 of 77
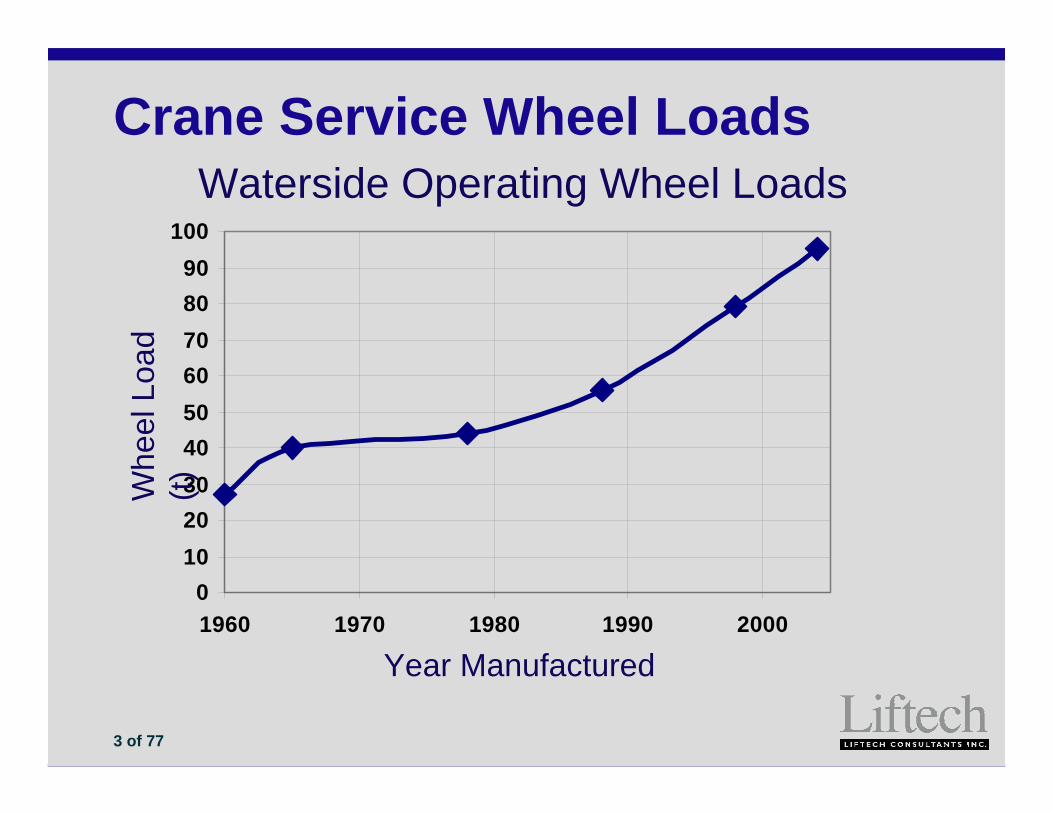
Crane Service Wheel LoadsWaterside Operating Wheel Loads
Year Manufactured
Whe
el L
oad
(t)
0102030405060708090
100
1960 1970 1980 1990 2000
4 of 77
Crane LoadsCrane loads increasingConsequences of misapplication more severeCodes becoming more complexChance of engineering errors increasing
5 of 77
Presentation OutlineThe Problem – Overview Wharf Designer’s PerspectiveCrane Designer’s PerspectivePutting the Two TogetherQ&A and Feedback

6 of 77
The Problem – Overview
Crane Purchaser
WharfDesigner
CraneSupplier
PortConsultant
7 of 77
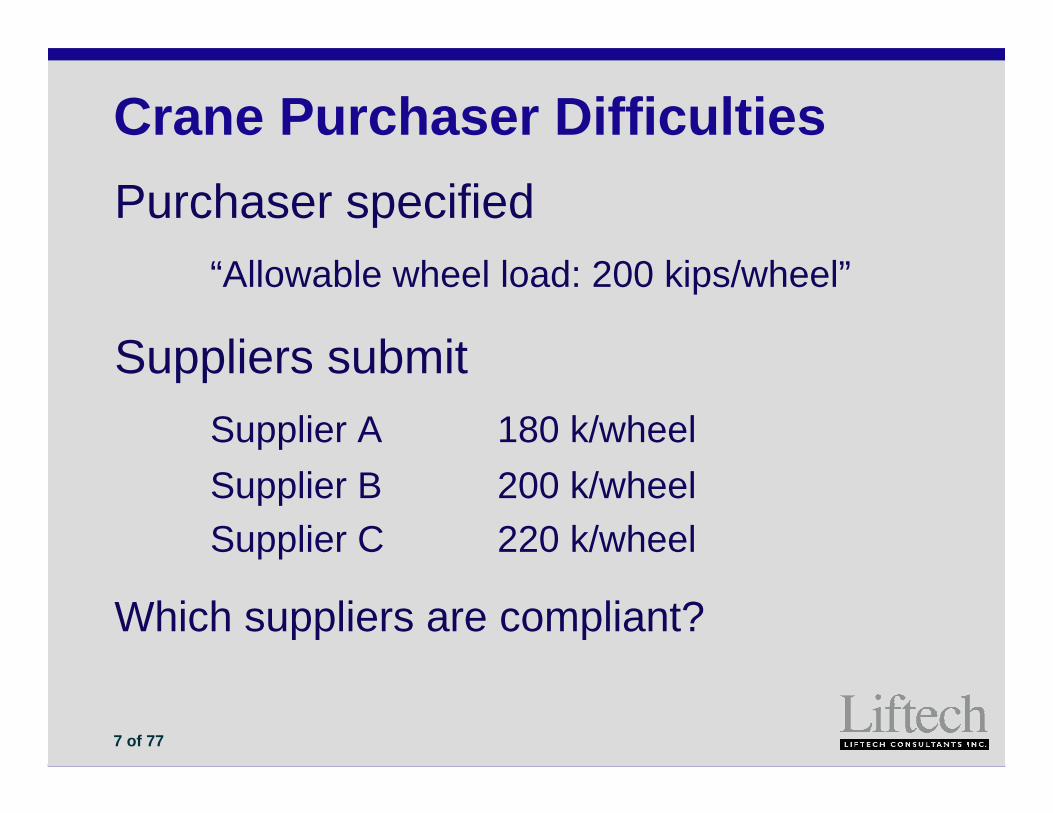
Crane Purchaser DifficultiesPurchaser specified
“Allowable wheel load: 200 kips/wheel”
Suppliers submitSupplier A 180 k/wheelSupplier B 200 k/wheelSupplier C 220 k/wheel
Which suppliers are compliant?

8 of 77
Crane Supplier DifficultyPurchaser specified
Allowable wheel load: 200 kips/wheel
In some cases, linear load (kips/ft)
Not definedOperating or out-of-service?
Service or factored?
Wind profile?
Increase for storm condition?

9 of 77
Wharf Designer DifficultyClient provides limited crane load data
No loading pattern
No basis given – Service or factored?
Same loads given for landside and waterside
No details of wind or seismic criteria

10 of 77
Wharf Designer PerspectiveCodes and Design Principle
Crane Girder Design
Design for Tie-down Loads
Crane Stop Design
Seismic Design Considerations

11 of 77
Codes and Design Principle

12 of 77
Crane FEM, DIN, BS, AISC …, Liftech
Wharf StructuresACI 318 Building Code and Commentary ASCE 7-05 Minimum Design Loads for Buildings and
Other StructuresAISC Steel Construction
Manual
Design Codes & Standards

13 of 77
Required Strength ≤ Design Strength
Required Strength = ∑ Service Loads * Load Factors
Design Strength = Material Strength * Strength Reduction Factor Ф
Design Principle - Wharf Structure DesignLoad Resistance Factored Design (LRFD)

14 of 77
0.900.90Ten
Concrete Ф Factors
0.70/.65
0.75/.70
Comp
0.750.85
ShearLoad FactorsACI 318
1.6*1.61.2from 2002
1.31.71.4to 2001WLD
* 1.3 if directionality factor is not included
Load Factors & Ф Factors
15 of 77
Generally use service loads
Factor of safety typically 2.0
Design Principle – Soil CapacityAllowable Stress Design
16 of 77
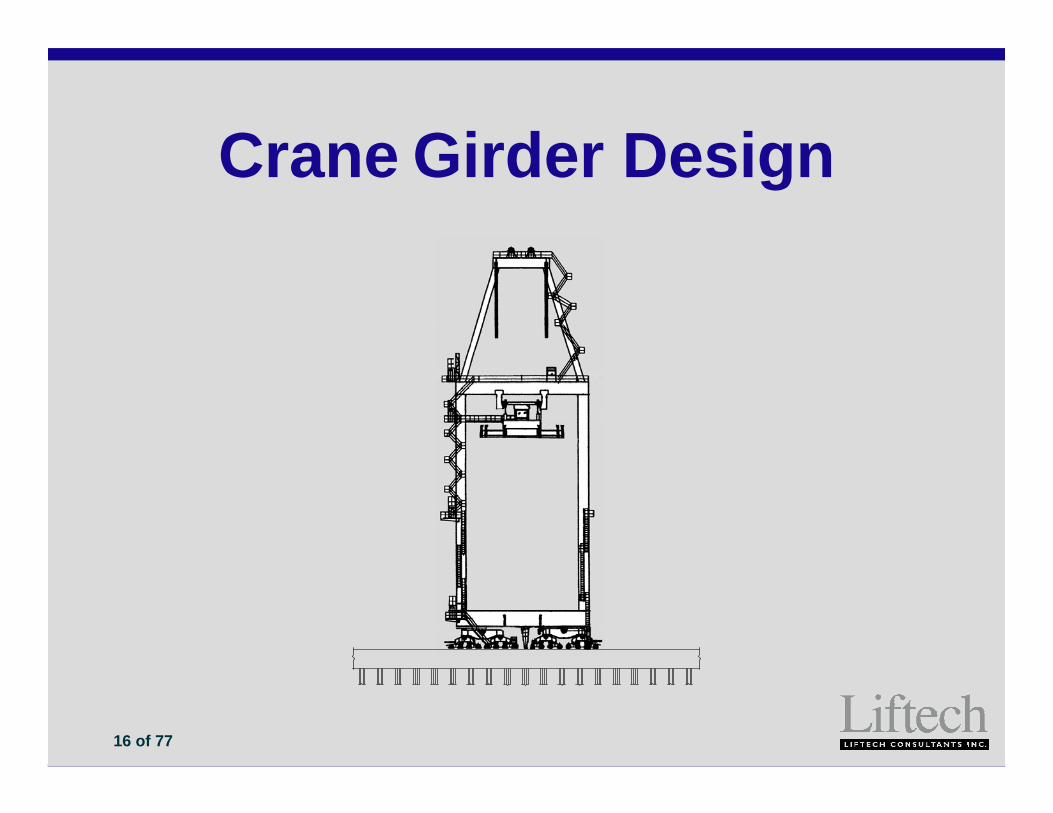
Crane Girder Design

17 of 77
Required Crane Geometry DataSill BeamTie-downs
Stowage pin
Bumper
(n-1) S
C craneLn = number of wheels per cornerS = average wheel spacing
18 of 77
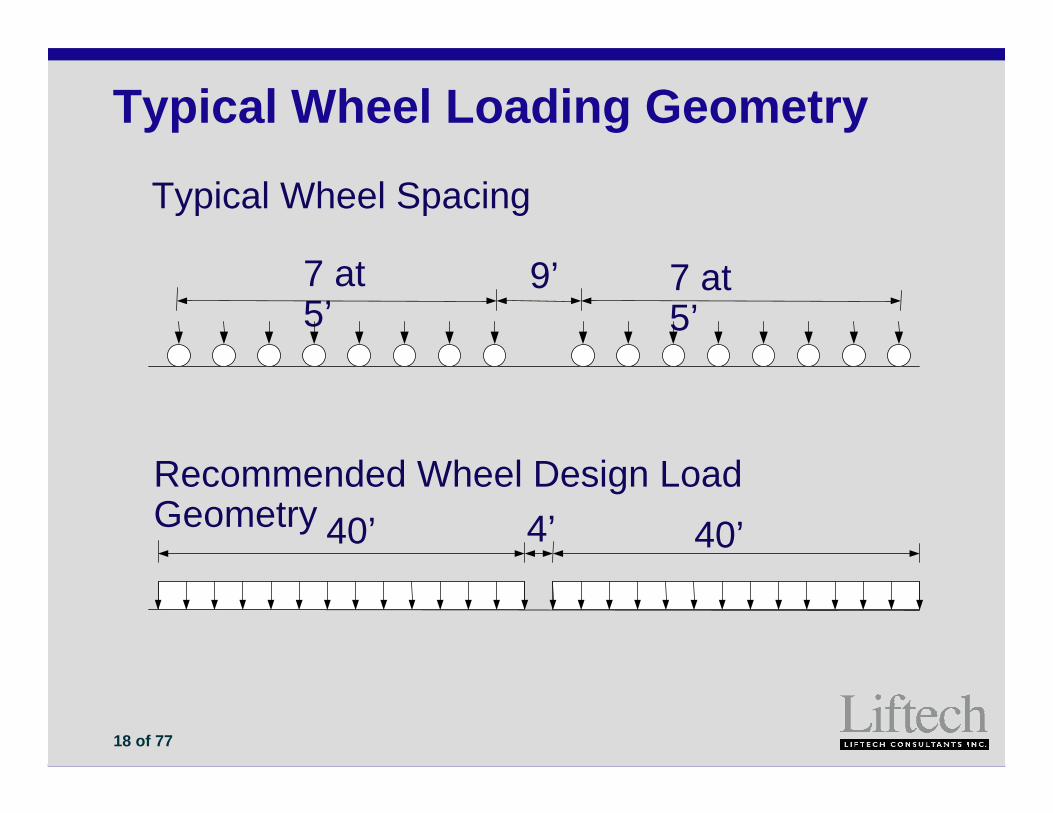
Typical Wheel Loading Geometry
7 at 5’
9’ 7 at 5’
40’ 4’ 40’
Typical Wheel Spacing
Recommended Wheel Design Load Geometry

19 of 77
Wharf LoadsD – Wharf structure self weightL – Wharf live load, includes containers and yard equipment (does not control)
Crane Loads (ASCE 7-05)D – Weight of crane excluding lifted loadL – Lifted load or rated capacity
Dead Loads and Live Loads

20 of 77
ACI Load Factors – Crane Loading
Load FactorsACI 318
1.301.61.2from 20021.451.71.4to 2001
CompositeLDYear
Some designers treat crane dead load as live load and use the 1.6 factor. This results in 23% overdesign; 1.6 / 1.3 = 1.23.

21 of 77
Example Combination Table: Service Wheel LoadsMode Operating Stowed
WOP1 WOP2 WOP3 WOP4 WS1 Dead Load DL 1.0 1.0 1.0 1.0 1.0 Trolley Load TL 1.0 1.0 1.0 1.0 1.0 Lift System LS 1.0 1.0 1.0 1.0 Lifted Load LL 1.0 1.0 1.0 Impact IMP 0.5 Gantry Lateral LATG 1.0 Op. Wind Load WLO 1.0 1.0 Stall Torque Load STL 1.0 Collision Load COLL 1.0 Storm Wind Load WLS 1.0 Earthquake Load EQ
50 x S 70 x S Allowable Wheel Loads (tons/wheel)
LS WS 65 x S 90 x S
S = Average spacing, in meters, between the wheels at each corner.Example: S = 1.5 m, Allowable LS Operating = 50 t/m * 1.5 m = 75 t/wheel

22 of 77
Example Combination Table: Factored Wheel LoadsMode Operating Stowed
WOP1 WOP2 WOP3 WOP4 WS1 Dead Load DL 1.2 1.2 1.0 1.0 1.2 Trolley Load TL 1.2 1.2 1.0 1.0 1.2 Lift System LS 1.2 1.2 1.0 1.2 Lifted Load LL 1.6 1.6 1.0 Impact IMP 0.8 Gantry Lateral LATG 0.8 Stall Torque Load STL 1.0 Collision Load COLL 1.0 Storm Wind Load WLS 1.6 Earthquake Load EQ
60 x S 80 x S Allowable Wheel Loads (tons/wheel)
LS WS 75 x S 100 x S
S = Average spacing, in meters, between the wheels at each corner.Example: S = 1.5 m, Allowable WS Storm = 100 t/m * 1.5 m = 150 t/wheel

23 of 77
Design for Tie-down Loads

24 of 77
Multiple Tie-downs at a Corner
Uneven tie-down forces

25 of 77
Causes of Uneven Distribution Some reasons why forces are not evenly distributed:
Crane deflection
Contruction tolerances
Wharf pins not centered
Links not perfectly straight due to friction
Undeflected Shape
Deflected Shape
26 of 77
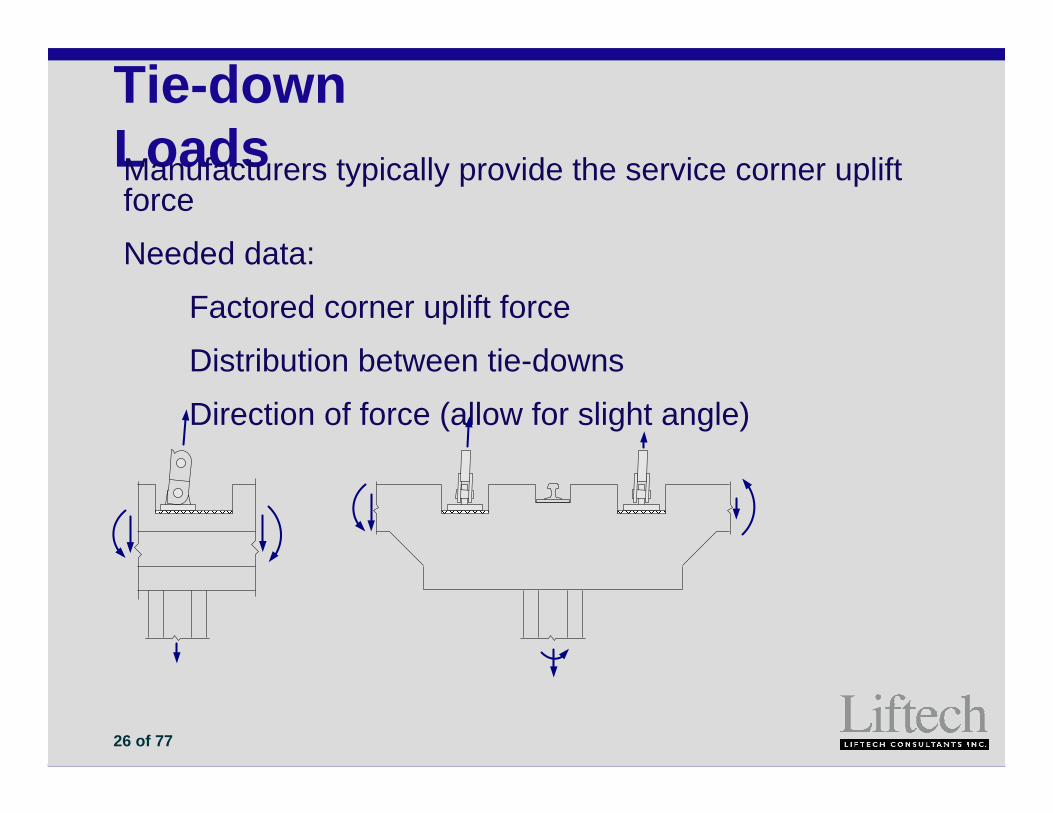
Tie-down LoadsManufacturers typically provide the service corner uplift force
Needed data:
Factored corner uplift force
Distribution between tie-downs
Direction of force (allow for slight angle)

27 of 77
Crane Stop Design

28 of 77
0
1 0
2 0
3 0
4 0
5 0
6 0
7 0
-1 4 9 1 4 1 9 2 4
Bumper Load Provided by Manufacturer
Rated Bumper ReactionBumpers sized for collision at maximum gantry speed
Does not address runaway crane
H
Displacement
HV slow
V gantry
V runaway crane
Displacementmetering pin
gas
oil

29 of 77
H= maximum load that can develop, i.e. the load at which the crane tips.
D = crane weight
H = approximately 0.25 x D per stop
Recommended Crane Stop Design Load
H
D
DH
Tipping Force
Stability Stool
30 of 77
The mass of typical jumbo A-frame cranes can be ignored
For certain wharves and cranes, a time-history analysis may be necessary
Large, short duration wheel loads can be ignored
Localized rail damage may occur
The crane may derail
Wharf Seismic Design – Crane Loading

31 of 77
Crane Designer PerspectiveBasic LoadsStorm Wind LoadLoad Combinations and FactorsTie-down Loads

32 of 77
Basic Loads

33 of 77
Dead and Live Loads
DL: Crane structure weightTL: Trolley structure weightLS: Lift System Weight
LL: Rated container load
Dead Loads Live Loads
Crane
Rated Load
Lift System
Trolley

34 of 77
Inertial LoadsIMP: Vertical impact due to hoist
acceleration
LATT: Lateral due to trolley acceleration
LATG: Lateral due to gantry acceleration

35 of 77
Overload
COLL: Crane Collision
SNAG: Snagging headblock
STALL: Stalling hoist motors
Normally do not control

36 of 77
Environmental Loads
WLO: Wind load operating (In-Service)
WLS* : Wind load storm (Out-of-Service)
EQ: Earthquake load
*Often a major source of discrepancies

37 of 77
Wind Load, Storm

38 of 77
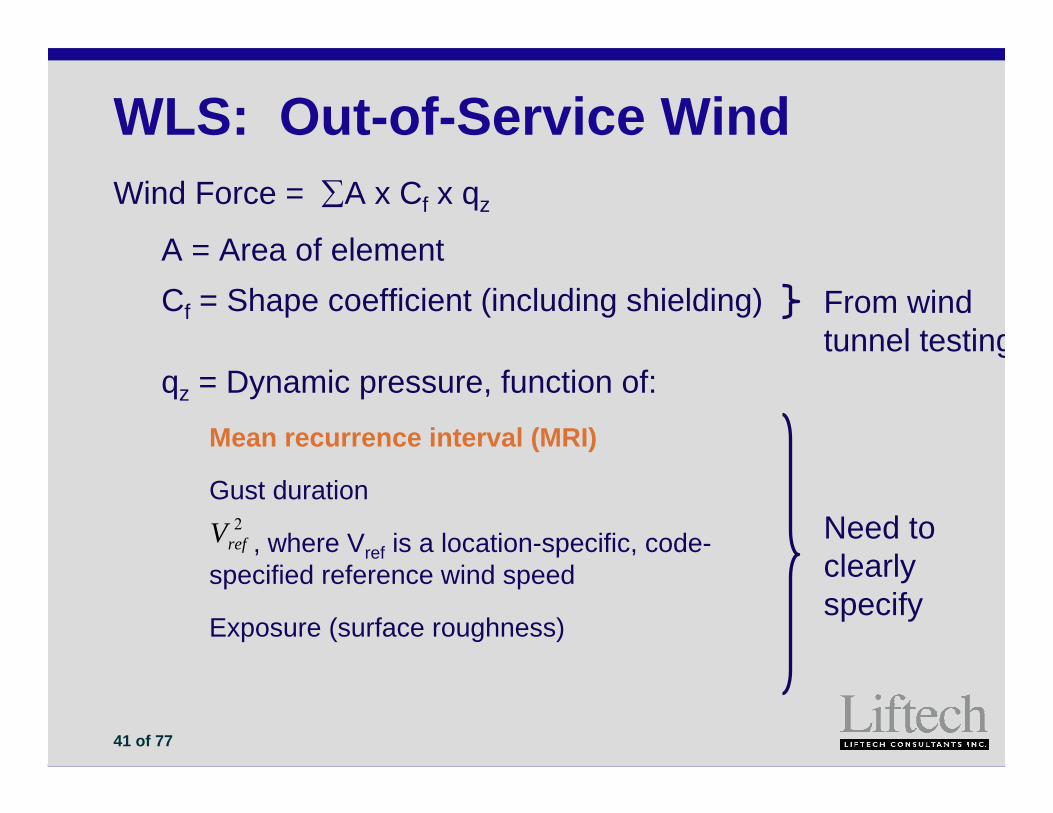
WLS: Out-of-Service WindWind Force = ∑A x Cf x qz
A = Area of crane elementCf = Shape coefficient (including shielding)
qz = Dynamic pressure, function of:
Mean recurrence interval (MRI)
Gust duration
, where Vref is a location-specific, code-specified reference wind speed
Exposure (surface roughness)
2refV Need to
clearly specify
From wind tunnel testing
39 of 77
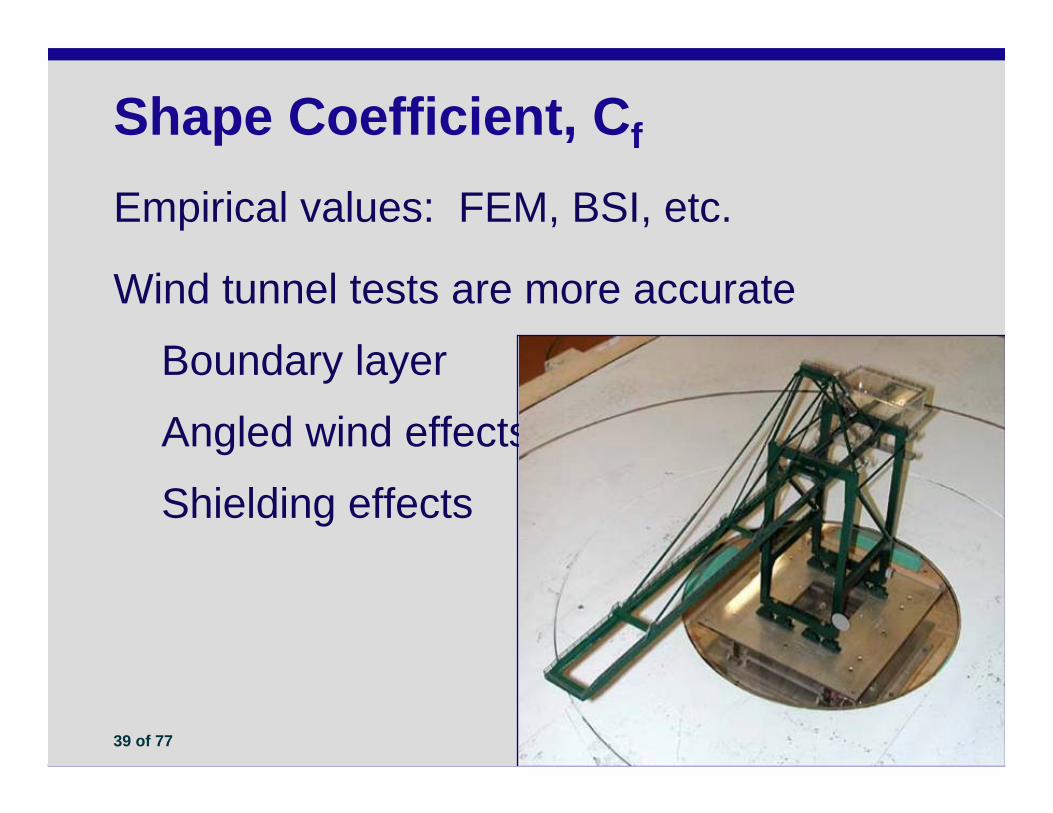
Shape Coefficient, Cf
Empirical values: FEM, BSI, etc.
Wind tunnel tests are more accurate
Boundary layer
Angled wind effects
Shielding effects

40 of 77
Angled Wind
0 45 90 135 180Rea
ctio
n
Wind Direction, Degrees
Wind Tunnel Test Liftech Equations
Fx Fz
FxFz
41 of 77
WLS: Out-of-Service WindWind Force = ∑A x Cf x qz
A = Area of elementCf = Shape coefficient (including shielding)
qz = Dynamic pressure, function of:
Mean recurrence interval (MRI)
Gust duration
, where Vref is a location-specific, code-specified reference wind speed
Exposure (surface roughness)
2refV Need to
clearly specify
From wind tunnel testing

42 of 77
Mean Recurrence Interval
Years in Operation
.39
.64
.87
.9950
.01
.02
.04
.101
.10
.18
.34
.6410
.64.22100 yrs
.87.4050 yrs
.98.6425 yrs
.99997.9310 yrs10025MRI
Probability of Speed Being Exceeded
Example:Chance of 50-yr wind being exceeded in 25 years: 40%
43 of 77
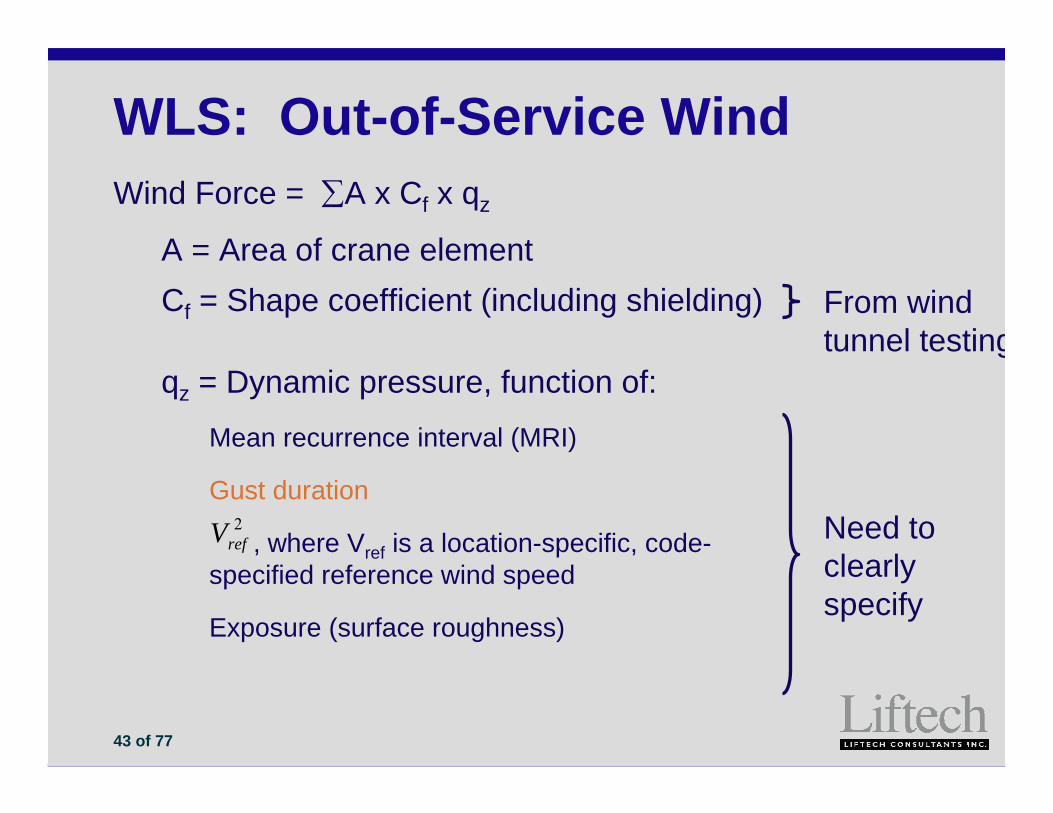
WLS: Out-of-Service WindWind Force = ∑A x Cf x qz
A = Area of crane elementCf = Shape coefficient (including shielding)
qz = Dynamic pressure, function of:
Mean recurrence interval (MRI)
Gust duration
, where Vref is a location-specific, code-specified reference wind speed
Exposure (surface roughness)
2refV Need to
clearly specify
From wind tunnel testing

44 of 77
Gust Duration

45 of 77
Wind Speed vs. Gust DurationV t
/ Vho
ur
Gust Duration (seconds)Ratio of probable maximum speed averaged over “t” seconds to hourly mean speed. Reference, ASCE 7-05.
( )
( )46.1
52.104.11
min103
min103
sec3
min10min103
VV
VV
VV
VV
VVhourly
hourly
=
⎟⎠⎞
⎜⎝⎛=
⎟⎟⎠
⎞⎜⎜⎝
⎛⎟⎟⎠
⎞⎜⎜⎝
⎛=
Example: converting 10-min speed to 3-sec speed
1.04
1.52

46 of 77
Code Gust Durations
50 yrs3 secHK 2004
50 yrs3 secASCE 7-02
50 yrs10 minFEM 1.004
50 yrs10 minEN 1991-1-4
MRI Gust DurationCode
Code definitions of basic wind speed

47 of 77
Typical Pressure Profiles
Shape of profile depends on surrounding surface roughness
0
25
50
75
100
125
150
175
200
500 1000 1500 2000Wind pressure, Pa
Hei
ght,
m
Smooth gradient
Stepped profile
48 of 77
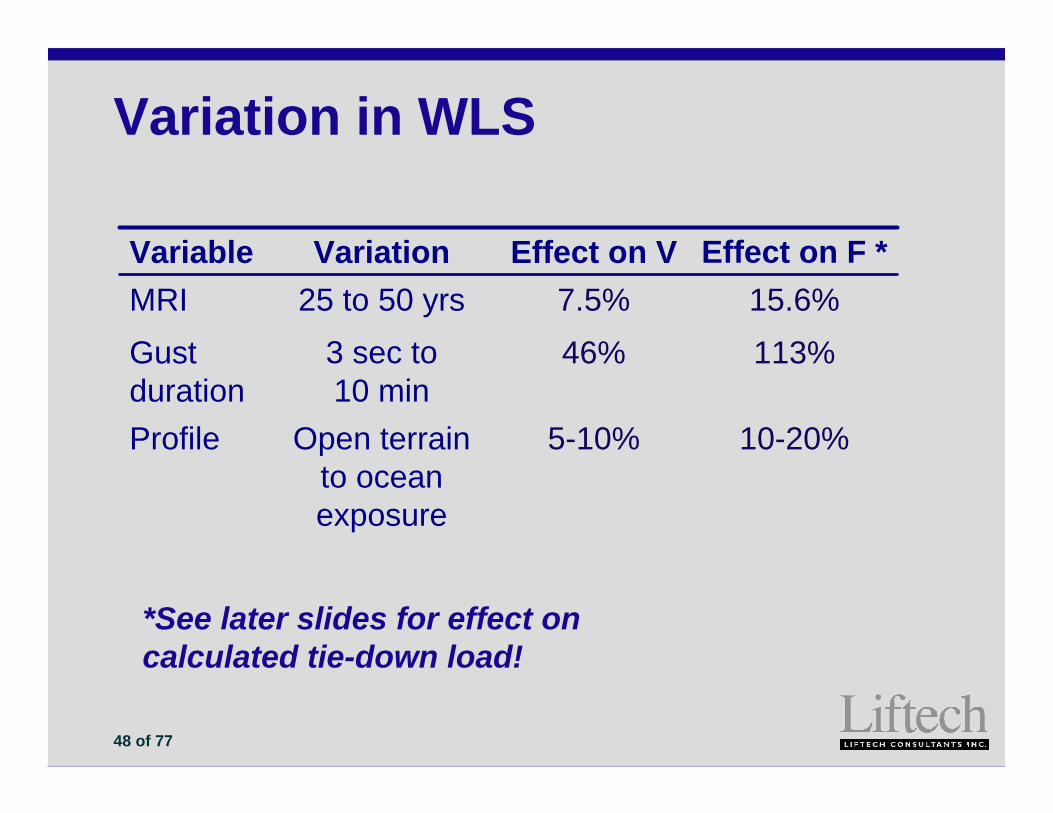
Variation in WLS
10-20%
113%15.6%
Effect on F *
5-10%
46%7.5%
Effect on V
Open terrain to ocean exposure
Profile
3 sec to 10 min
Gust duration
25 to 50 yrsMRIVariationVariable
*See later slides for effect on calculated tie-down load!

49 of 77
Recommendations for Specifying WLS
Return Period Use 50-yr MRIBasic wind speedGust duration Use local civil codeProfileOther factorsShape coefficients Wind tunnel tests
Do not mix and match between codes for pressure and load factors !

50 of 77
Corner Reactions – Angled Wind
Do not use spreadsheet !
Use frame analysis program
Frame stiffness is significant to reactions
51 of 77
Load Combinations

52 of 77
Load Combinations
Load combinationsOperatingOverloadStorm wind (out-of-service)
Design approaches Generally Allowable Stress Design (ASD)

53 of 77
Operating Condition Loads
DL: Crane weight*
LL: Rated container load
IMP & LAT: Inertial loads
WLO: Wind load, in service
*Excluding Rated Load
54 of 77
Out-of-Service & Overload
DL: Crane weight*
WLS: Wind load storm (out-of-service)
Overload Conditions (in and out-of-service)
*Including trolley and lift system

55 of 77
RecommendationsRequesting crane data
Ask for basic loadsCombine per ACI load factors
Requesting tendersProvide factored load tablesAsk to fill in tablesSpecify allowable factored loads
56 of 77
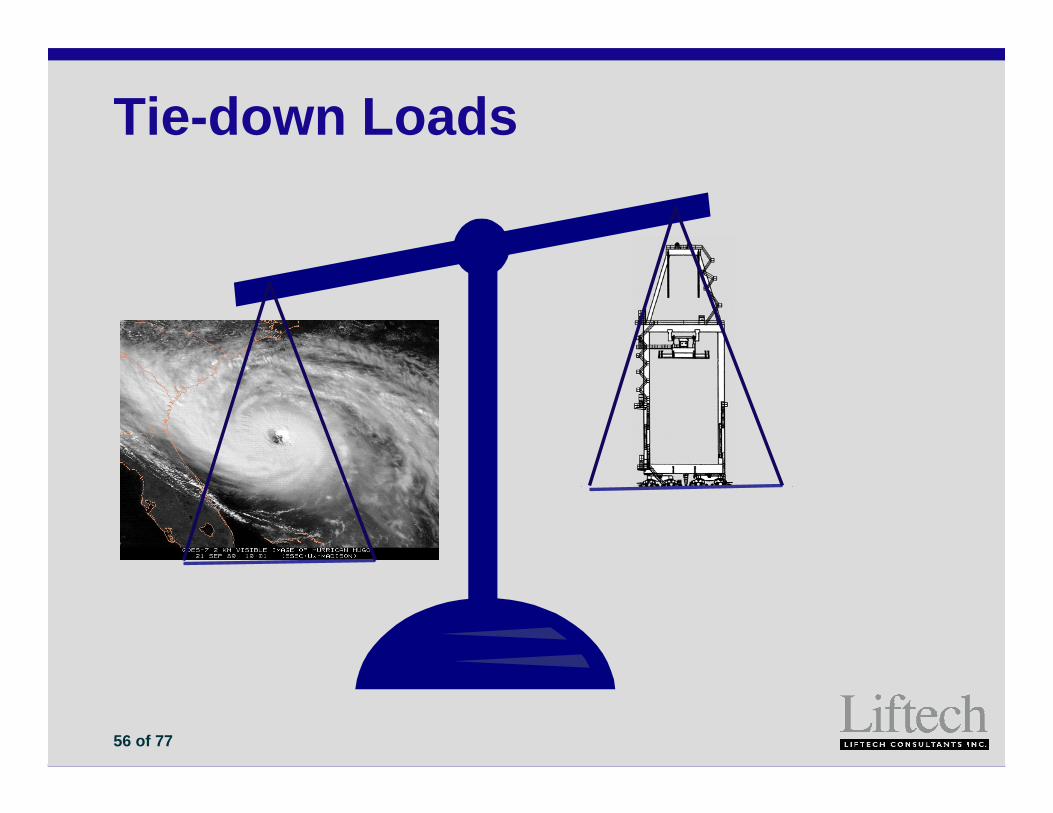
Tie-down Loads

57 of 77
Tie-Down Failures

58 of 77
Crane Tie-downs

59 of 77
Wind Load & Crane Reactions
FD
wind
Fstow pin
F tie-down
Fgantry
AB

60 of 77
Error in Calculated Tie-down Force
MomentRightingMomentgOverturnin
BD
hFwind ==
2
γ
( ) ( )1
11
21
211
,
,
−−+
=
⎥⎦⎤
⎢⎣⎡ −
⎥⎦⎤
⎢⎣⎡ −+
=γ
γeBDhF
A
BDhFeA
FF
Wind
Wind
CalculatedTiedown
ActualTiedown
Ratio of moments:
Error in calculated tie-down force:if “e” = error in wind force,
DFwind
Fstow pin
Ftie-down
Fgantry
AB

61 of 77
Error in Tie-down ForceTi
edow
n Fo
rce
Rat
io(A
ctua
l/Cal
cula
ted)
, Overturning Moment / Righting Momentγ
0
1
2
3
4
5
1 2 3
20% error in V
10% error in V
5% error in V
No error in V
62 of 77
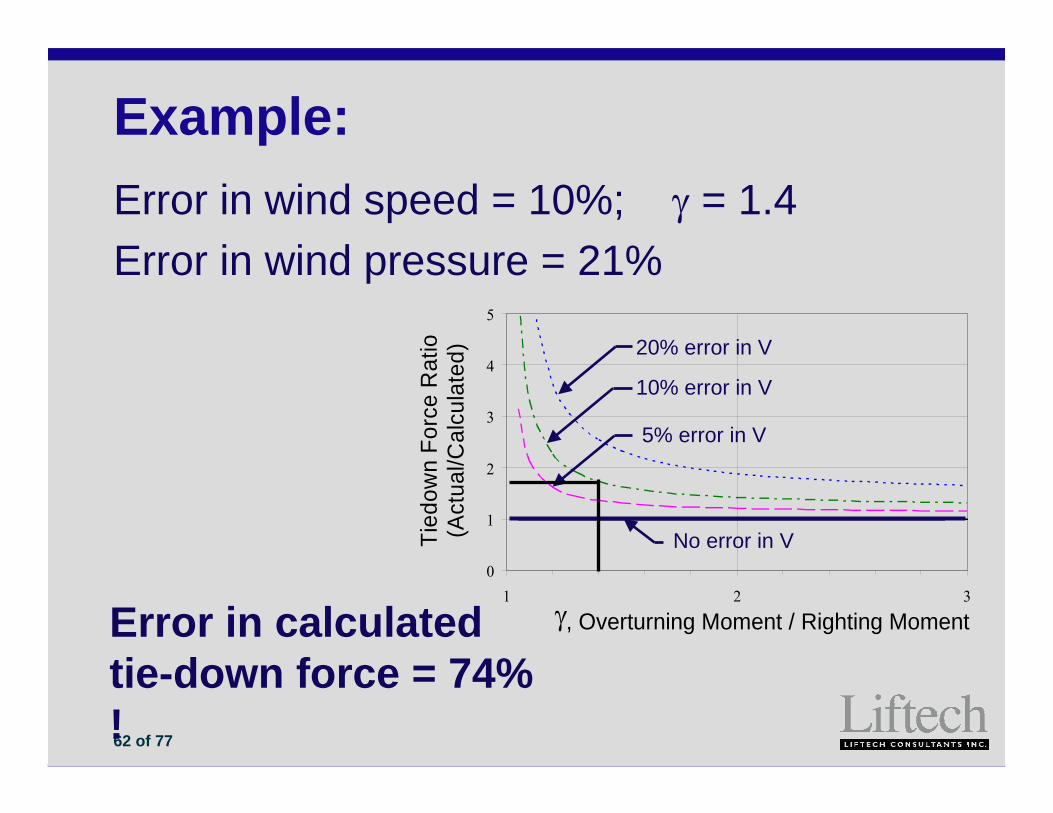
Example:
Error in calculated tie-down force = 74% !
Tied
own
Forc
e R
atio
(Act
ual/C
alcu
late
d)
, Overturning Moment / Righting Momentγ
0
1
2
3
4
5
1 2 3
20% error in V
10% error in V
5% error in V
No error in V
Error in wind speed = 10%; γ = 1.4Error in wind pressure = 21%

63 of 77
Stability Load Factors
1.3*0.90.9
ACIFactorLoad
1.21.2Wind Load, 50-year MRI
1.01.0TL + LS1.01.0Dead Load
FEMBSI
* 1.6 with ASCE 7-02 “directionality factor”

64 of 77
Uplift: Factored vs. Service
FactoredService
x 1.3 =
x 0.9 =
Load Factor
“Uplift”“No Uplift”+135-50 Calculated Uplift+585+450Wind Load
-450-500Dead Load
Load

65 of 77
Recommended Tie-down Strength RequirementsDesign using Factored Load
Turnbuckle B.S. = 1.6* x factored load
Proof test to 100% of factored load
Structural componentsAllowable stress of 0.9 x Fyield
* 2.5 for off-the-shelf turnbuckles.

66 of 77
Putting the Two Together

67 of 77
Problem OverviewCrane supplier and wharf designer work with incomplete and inconsistent data
Crane supplier generally uses Service Load approach
Wharf designer generally uses Factored Load approach
Neither knows what basis the other uses

68 of 77
Solution

69 of 77
Missing
Link
Crane Purchaser
WharfDesigner
CraneSupplier
Port
Crane purchaser provide or facilitate detailed information

70 of 77
Obtain From Wharf DesignerAssumed wheel arrangement
Service or factored
Load factors
Load combinations for operating, overload, and out-of-service conditions
Complete wind criteria
Allowable wheel loads, kips/ft** Crane supplier tends to provide kips/wheel

71 of 77
Example Combination Table: Service Wheel LoadsMode Operating Stowed
WOP1 WOP2 WOP3 WOP4 WS1 Dead Load DL 1.0 1.0 1.0 1.0 1.0 Trolley Load TL 1.0 1.0 1.0 1.0 1.0 Lift System LS 1.0 1.0 1.0 1.0 Lifted Load LL 1.0 1.0 1.0 Impact IMP 0.5 Gantry Lateral LATG 1.0 Op. Wind Load WLO 1.0 1.0 Stall Torque Load STL 1.0 Collision Load COLL 1.0 Storm Wind Load WLS 1.0 Earthquake Load EQ
50 x S 70 x S Allowable Wheel Loads (tons/wheel)
LS WS 65 x S 90 x S
S = Average spacing, in meters, between the wheels at each corner.Example: S = 1.5 m, Allowable LS Operating = 50 t/m * 1.5 m = 75 t/wheel

72 of 77
Example Combination Table: Factored Wheel LoadsMode Operating Stowed
WOP1 WOP2 WOP3 WOP4 WS1 Dead Load DL 1.2 1.2 1.0 1.0 1.2 Trolley Load TL 1.2 1.2 1.0 1.0 1.2 Lift System LS 1.2 1.2 1.0 1.2 Lifted Load LL 1.6 1.6 1.0 Impact IMP 0.8 Gantry Lateral LATG 0.8 Stall Torque Load STL 1.0 Collision Load COLL 1.0 Storm Wind Load WLS 1.6 Earthquake Load EQ
60 x S 80 x S Allowable Wheel Loads (tons/wheel)
LS WS 75 x S 100 x S
S = Average spacing, in meters, between the wheels at each corner.Example: S = 1.5 m, Allowable WS Storm = 100 t/m * 1.5 m = 150 t/wheel

73 of 77
Ask Crane Supplier ForWheel arrangement
Wheel loads for individual loads
Combined wheel loads for operating, overload, and out-of-service conditions
Complete wind criteria used and basis for shape factors
Individual and corner factored loads for tie-downs including direction of loading

74 of 77
Example Design Basic Load Table Wharf Designer needs from Crane
Supplier
75 of 77
Recap
Obtain detailed crane and wharf design dataStick to one crane design codeStick to one wharf design codeUse consistent design basis
Facilitate communication

76 of 77
Q & A

77 of 77
Arun Bhimani, S.E.PresidentLiftech Consultants Inc.www.liftech.net
Thank you
Erik Soderberg, S.E.PrincipalLiftech Consultants Inc.
This presentation will be available for download on Liftech’s website:
www.liftech.net
Crane Loads & Wharf Structure Design:Putting the Two Together

78 of 77
Quality Assurance Review:
Principal: Arun Bhimani
Editor: Erik Soderberg
Author: Arun Bhimani
Liftech Consultants Inc. file data:N:\Papers & Presentations\!Working\AAPA 2006 \Crane_Loads_and_Wharf_Design_AAPA..ppt
Copyright 2006 by Liftech Consultants Inc. All rights reserved.The information included in this presentation may not be altered, copied, or used without written authorization from Liftech Consultants Inc. Anyone making use of the information assumes all liability arising from such use.

79 of 77
Liftech Consultants Inc. Presentation Source Documentation:
Source documents will be stored in: Presentation\Waiting to Archive\AAPA 2006\Crane_Loads
FYI - Much content originally came from the TOC 2005 Europe presentation.