
Crammond, G., Boyd, S. and Dulieu Barton “Dynamic analysis ...
35
Crammond, G., Boyd, S. and Dulieu‐Barton J.M. “Dynamic analysis of composite marine structures using full‐field measurement”, J Mar Eng Technol., 13, 2014, 23‐35. 1 Title Dynamic analysis of composite marine structures using full-field measurement techniques Authors G Crammond, S W Boyd and J M Dulieu-Barton Fluid structures interaction research group, Faculty of Engineering and the Environment, University of Southampton, Southampton, SO17 1BJ, UK Synopsis Composite materials are increasingly used in structural applications within the marine industry. Due to the geometric complexity of marine structures, there is a practical requirement that they are assembled by joining smaller component pieces using either mechanical fasteners or adhesive bonding. In this paper Digital Image Correlation (DIC) is used to provide full-field analysis of the complex strain fields generated within an adhesively bonded composite single lap joint. Tests are undertaken quasi-statically and at high rate, demonstrating a significant change in the assembly response between laboratory testing conditions and dynamic loading events typical of the marine environment. The work demonstrates the potential of applying full-field experimental technique to provide detailed analysis of complex structural problems, typical of large marine structures. Authors Biography George Crammond was awarded an MEng in Ship Science at the University of Southampton with a specialist theme in advanced materials. He was awarded a PhD from the University of Southampton in 2013 for his thesis titled ‘Development of optical techniques for the experimental analysis of local stress and strain distributions in adhesively bonded composite joints’. In 2009 he was awarded the IMarEST Stanley Gray Fellowship to support his research. Dr Stephen Boyd is a Senior Lecturer in Ship Science at the University of Southampton. He is a naval architect and his research interests focus around the application of composite materials in the maritime environment. He is investigator on a number of research council
Transcript of Crammond, G., Boyd, S. and Dulieu Barton “Dynamic analysis ...
Crammond, G., Boyd, S. and Dulieu‐Barton J.M. “Dynamic analysis of composite marine structures using full‐field measurement”, J Mar Eng Technol., 13, 2014, 23‐35.
1
Title Dynamic analysis of composite marine structures using full-field measurement
techniques
Authors G Crammond, S W Boyd and J M Dulieu-Barton
Fluid structures interaction research group, Faculty of Engineering and the Environment,
University of Southampton, Southampton, SO17 1BJ, UK
Synopsis Composite materials are increasingly used in structural applications within the
marine industry. Due to the geometric complexity of marine structures, there is a practical
requirement that they are assembled by joining smaller component pieces using either
mechanical fasteners or adhesive bonding. In this paper Digital Image Correlation (DIC) is
used to provide full-field analysis of the complex strain fields generated within an adhesively
bonded composite single lap joint. Tests are undertaken quasi-statically and at high rate,
demonstrating a significant change in the assembly response between laboratory testing
conditions and dynamic loading events typical of the marine environment. The work
demonstrates the potential of applying full-field experimental technique to provide detailed
analysis of complex structural problems, typical of large marine structures.
Authors Biography George Crammond was awarded an MEng in Ship Science at the
University of Southampton with a specialist theme in advanced materials. He was awarded a
PhD from the University of Southampton in 2013 for his thesis titled ‘Development of optical
techniques for the experimental analysis of local stress and strain distributions in adhesively
bonded composite joints’. In 2009 he was awarded the IMarEST Stanley Gray Fellowship to
support his research.
Dr Stephen Boyd is a Senior Lecturer in Ship Science at the University of Southampton. He
is a naval architect and his research interests focus around the application of composite
materials in the maritime environment. He is investigator on a number of research council

Crammond, G., Boyd, S. and Dulieu‐Barton J.M. “Dynamic analysis of composite marine structures using full‐field measurement”, J Mar Eng Technol., 13, 2014, 23‐35.
2
projects including performance of fire retardant composite resins, damage tolerance of
composites subject to high speed loading and the use of tailored composites for tidal turbine
blades.
Janice Dulieu-Barton is a Professor of Experimental Mechanics and has worked in the field
since 1989. She has published more than 250 papers on this and related topics. Professor
Barton’s primary research interest is in imaging. Applications include: damage analysis of
composite/ sandwich/ textile materials, crack-tip stress studies and small scale full-field
experimental stress analysis. She is a Fellow of the UK Institute of Physics, a Chartered
Mechanical Engineer and associate editor of the international journal for experimental
mechanics: Strain.

Crammond, G., Boyd, S. and Dulieu‐Barton J.M. “Dynamic analysis of composite marine structures using full‐field measurement”, J Mar Eng Technol., 13, 2014, 23‐35.
3
Introduction
The beneficial specific material properties of polymer composites is leading to their increased
usage in the marine industry. The use of composites have been shown to offer structural
weight savings up to 36% for a large 52m naval patrol vessel compared to a comparable steel
hulled craft [1]. Through their use, lighter vessels experience operational and financial gains
such as increased payload capacity and improved fuel consumption in addition to lowering
the centre of gravity of the structure, producing better stability and sea keeping characteristics.
However, the increasing size of marine structures makes it impractical for a single shot
continuous moulding process to be employed, favouring the assembly of the vessel from a
strengthened shell hull structure. Therefore joints are required either to assemble the
composite structure from many smaller component parts or for the attachment of secondary
strengthening support structure, as shown in Fig 1.
FIG 1
Joints present a significant design challenge to engineers as they inherently contain
discontinuities in both geometry and material properties, generating complex stress and strain
distributions. Mechanical fastenings such as rivets, screws and bolts are currently the most
common joining mechanism used in industry. Their benefits include little surface preparation,
cheap component costs and are relatively easy to assemble and dismantle, which is very
important for the inspection, repair and maintenance of the structures [2–4].
The strength of mechanically fastened joints is provided by the non-slip frictional forces
generated by contact between the adherend bearing surfaces. The mechanical fastener
provides through-thickness reinforcement within the joint, forcing the bearing surfaces

Crammond, G., Boyd, S. and Dulieu‐Barton J.M. “Dynamic analysis of composite marine structures using full‐field measurement”, J Mar Eng Technol., 13, 2014, 23‐35.
4
together, increasing the contact force between adherends and hence increasing the ultimate
joint strength. The weak through-thickness properties of the composite material limits the
pretension that can be applied to the fastener without damage [5], which inevitably reduces
the contact between joint faces and hence the ultimate joint strength. Fretting damage
between the metallic fastener and the composite is also a possibility [6] increasing joint
compliance and decreasing the contact force between adherends. In addition the introduction
of a hole to accept the fastener results in fibre discontinuity in the composite requiring the
continuous fibres, in the vicinity of the hole, to carry more load. Ultimately mechanically
fastened joints are heavy and time consuming to manufacture, conflicting the high strength
and low weight benefits of composite materials. This provides the motivation for developing
a better understanding of alternative joining techniques.
The main alternative to mechanical fastening is adhesive bonding. The adhesive between
adherends forms a coherent structural layer chemically bonded between the adherend
surfaces, across which load is transferred. Epoxy based adhesives are most commonly used in
the marine industry due to their high strength, ease of application, good service temperature
range, resistance to moisture and chemical attack, and ability to bond a variety of different
substrate materials. The use of adhesive bonding provides a significant reduction in joint
weight compared to mechanical fasteners [1], increasing the structural efficiency of the joint.
Reductions in assembly time and part count, improving the ease of manufacture and reducing
the cost of production, are also experienced. Some surface preparation is required during
manufacture to clean the component surfaces, such that there is a good chemical
compatibility between the adherend and the adhesive, which largely governs the bond
strength.

Crammond, G., Boyd, S. and Dulieu‐Barton J.M. “Dynamic analysis of composite marine structures using full‐field measurement”, J Mar Eng Technol., 13, 2014, 23‐35.
5
Adhesive joint analysis
The discontinuous nature of both mechanically fastened and adhesive bonded joints creates
significant through-thickness load transfer between components. Marine structures also
experience high through-thickness loading from significant global bending and torsion loads
in the structure. In the mechanically fastened joint, the fastener provides reinforcement and
strength between adherends in the through-thickness direction. In contrast, the through-
thickness load transfer in the adhesive joint is dependent on the chemical bond between the
adhesive and the adherend surface. Bonded composite joints provide a difficult problem as
composites, though strong in the direction of the fibres, are weak normal to the fibre direction,
where their strength is dominated by the mechanical properties of the brittle polymer matrix.
Their weak through-thickness properties, and the relatively high through-thickness loading
across the discontinuity, make the laminate susceptible to the initiation of interlaminar cracks
leading to failure of the joint.
Research into adhesive joints has primarily assessed performance based upon ultimate tensile
strength [7] [8] and investigations in strength improvements through parametric geometry
changes [9–11]. Little consideration has been given to experimentally analysing the complex
strain distributions generated with the joint, and their influence on the formation of damage
within the composite material in the weak through-thickness direction. In the present paper
Digital Image Correlation (DIC) is used to evaluate the individual strain components
generated within the joint up to and including failure. Strain fields are examined at the root of
the discontinuity in the joint to provide detailed, data-rich, measurement of the developing
strain fields. Data gathered from the present investigation is used to observe changes in the
fundamental material and structural responses, which are critical to the formation of damage
in the complex composite structures. Importantly for designers and engineers, the data can be
Crammond, G., Boyd, S. and Dulieu‐Barton J.M. “Dynamic analysis of composite marine structures using full‐field measurement”, J Mar Eng Technol., 13, 2014, 23‐35.
6
used to validate numerical models which can be employed to efficiently represent the
developing stresses and strains in complex composite structural joints.
The response of the bonded assembly is also investigated under high rate loading due to the
high incidence of dynamic loading events in marine structures during operation, as shown by
Manganelli’s study of bow accelerations in 50ft & 60ft global race yachts [12]. Dynamic
loading incidences due to heavy seaways, ship motions or human factors, such as impacts,
produce very fast impulse loading of the structure [13–15]. These dynamic incidences result
in rapidly changing stresses, [16] increasing the potential for significant damage to the
structure [17]. Under these high-rate loading incidences both metallic and composite
materials display rate-dependent material properties. Metallic structures exhibit an increase in
stiffness and strength due to plasticity and dislocation dynamics [18], and composites display
an increase in strength due to viscoelastic effects within the matrix [19]. Investigation of
joints has observed changes in the response of the adhesive used within the bonded joints
[20–22] as well as the overall structural dynamics of bonded assemblies in tension [23], [24],
compression [25] and shear [26], [27].
In the present paper, testing is conducted both quasi-statically and at high rate, observing
changes in the joint behaviour between conditions. High speed cameras are used to provide
high temporal resolution DIC analysis of the developing strain fields within the joint structure.
Changes in the joint strength and strain distribution are identified, providing a better
understanding of the dynamic, real-world, behaviour of bonded composite joints. Knowledge
of the dynamic failure behaviour can be used to improve joint designs, and be engineered to
maximise in-service performance whilst minimising the initiation of damage.

Crammond, G., Boyd, S. and Dulieu‐Barton J.M. “Dynamic analysis of composite marine structures using full‐field measurement”, J Mar Eng Technol., 13, 2014, 23‐35.
7
Digital Image Correlation
Digital image correlation is a full-field optical white light technique based on the comparison
of images before, during and after the deformation of a test specimen. To facilitate the
correlation a stochastic speckle pattern is applied to the specimen surface, providing random
grey level variation across the image. An image correlation algorithm is used to identify areas
of matching pattern between images [28–31]. The position where the correlation function
value is maximised in the deformed image corresponds to the movement of the pattern during
deformation. The images of the speckled specimen are divided into a grid of smaller
interrogation cells, or subsets. The correlation between images is undertaken for each subset,
creating a full-field array of displacement vector data points across the image. A central
differences approach is used to determine the full-field strains from the deformation results.
A schematic of the correlation process can be seen in Fig 2. The spatial resolution and
accuracy of the displacements are limited by the total number of pixels within the image. The
spatial resolution of the data is maximised by reducing the size of the subsets, but as the
interrogation cell size decreases, the uncertainty in the strain measurement increases due to a
reduction in the number of features to track within the subset [32]. A more detailed
explanation of the digital image correlation process and discussion of alternative correlation
approaches can be found in literature presented by Pan [30], Sutton [28].
FIG 2
Joint structure
A single lap joint (SLJ) was selected for analysis due to its simple construction, large
geometric discontinuity and high through-thickness loading occurring between adherends.
The joint was constructed from four layers of 800g/m2 unidirectional and 14 layers of

Crammond, G., Boyd, S. and Dulieu‐Barton J.M. “Dynamic analysis of composite marine structures using full‐field measurement”, J Mar Eng Technol., 13, 2014, 23‐35.
8
450g/m2 chopped strand mat (CSM) glass fibre in a [CSM7 904 CSM7] layup using Gurit
Prime 20 LV epoxy resin and the resin infusion process. The SLJ specimen is shown Fig 3a);
it is 25 mm wide with an adherend overlap length of 25 mm. The adherends had a total length
of 150 mm with a 50 mm tapered end tab design. Araldite 2015, a toughened structural epoxy
adhesive, was used to bond the adherends together. The layup selected created a laminate
with comparable material and thickness to many marine laminates. The surface of the
laminate which lay against the flat mould tooling during manufacture was used as the
bonding surfaces in the joint. The specimens were manufactured by bonding the adherends
together in one 400mm wide joint, before cutting it thinner joints for testing. This method
minimises misalignment of the adherends during assembly and provides greater control over
the symmetry of the joint, both of which create more repeatable joints for testing.
The surfaces of the adherends were prepared for bonding by abrading the bonding areas with
P120 sandpaper and a flat sanding block to remove the resin rich surface layers of the
material and generate a clean surface for bonding. The abraded surfaces were cleaned with
acetone to remove any dirt or grease. Pressure was applied to the bond area during curing
using five 5 kg lab weights; ensuring good contact between the adherends and the adhesive.
The joint assembly was post cured at 80oC for 1hr as per the manufacture’s data sheet
instructions to maximise the shear strength of the adhesive. Thick layers of dissimilar
material in the laminate provide sufficient thickness across each material layer for a large
number of data points to be captured in the strain analysis. An image of the layered joint
structure is shown in Fig 3b).
The SLJ layup and overlap length were designed to ensure that the response of the joint in the
through-thickness direction is adequately captured using the optics and cameras available.
Adhesive spew fillets were removed during construction to artificially increase the peel strain
in the thick, stiff adherends. Although not perfectly representative of joint geometries used in

Crammond, G., Boyd, S. and Dulieu‐Barton J.M. “Dynamic analysis of composite marine structures using full‐field measurement”, J Mar Eng Technol., 13, 2014, 23‐35.
9
current marine structures, evaluation of the SLJ demonstrates the potential of the full-field,
non-contact DIC technique to analyse complex composite structures. The single lap joint has
also been extensively tested and modelled in literature [33] [34] [35] [36], which provides
confidence in the experimental methodology and the results discussed later in the paper.
Using this joint geometry as a demonstrator gives confidence in the experimental
methodology for evaluating complex structures. It shows the technique to be a powerful
analysis tool for structures where there is little knowledge or previous investigations of the
material and structural responses, such as in large marine structures.
FIG 3
SLJ quasi-static analysis
The SLJ was initially tested quasi-statically to establish a baseline joint response, against
which the effects of dynamic loading are compared. The joint was mounted in an Instron
5569 electromechanical test machine and loaded at 2 mm / min up to failure. A 16 MP 14 bit
monochromatic LaVision Imager pro X camera fitted with a Sigma 105 mm macro lens was
used to image the specimen with an image resolution of 142 pixels / mm at 5 Hz. Illumination
was provided by a LED ring flash light mounted onto the lens, delivering consistent cold
lighting of the specimen. The stochastic speckle pattern, which the correlation algorithm uses
to calculate deformation vectors, was applied using RS components matt black aerosol, fitted
with a needle cap, onto a white background painted onto the specimen. The pattern properties
were matched to the resolution of the image, minimising errors in the correlation. The
sequence of images was processed using the LaVision Davis 8.0 correlation software, with a
subset size of 75 x 75 pixels and a step size of 25 pixels, delivering a spatial resolution of
approximately 5 data points / mm.

Crammond, G., Boyd, S. and Dulieu‐Barton J.M. “Dynamic analysis of composite marine structures using full‐field measurement”, J Mar Eng Technol., 13, 2014, 23‐35.
10
Figs 4a-c) show a detailed view of the evolving peel strains, εx, within the joint loaded at 1.5,
3 and 4.7 kN respectively. Peel strain concentrations form at the root of the geometric
discontinuities in the CSM layers either side of the adhesive layer between adherends. These
concentrations form due to the internal bending moments created from the load path
eccentricity and become larger with greater applied load. The peel strain is greatest at the free
end of the adherends, where the structure is least constrained, experiencing the greatest
deformations. The bending and rotation of the joint during deformation generates a band of
high interfacial peel strain between the CSM and 90° materials around the discontinuity in
the adherend adjacent to the free end. The localised strains, generated at the discontinuity,
result in the initiation of a crack and the propagation of damage downwards in to the joint,
(see Fig 4c), and final joint failure at 4.8 kN. The white contours in the figure are areas of
very high strain in the adhesive where the colour scale is saturated. This scale was chosen in
order to observe the strain distributions in the composite adherends which is the objective of
the paper.
Figs 5a)-c) show the development of the shear strains within the joint at the same load
intervals as Fig 4. As expected, the largest shear strain is experienced within the adhesive
layer, as shear is the primarily load transfer mechanism between the inner and outer
adherends. A symmetrical shear strain distribution is observed, peaking towards the
discontinuity. The bending of the adherends is observed to generate greater shear strains in
the face sheet CSM material compared to the central 90o material, contributing to the high,
damage inducing, strain field at the root of the discontinuity. A plot of the axial strain
distributions in the joint are shown in Figs 6a)-c), identifying a non-uniform deformation
field across the joint due to the load transfer between adherends. A zero displacement
condition can also be observed at the free end of the adherends.
FIG 4

Crammond, G., Boyd, S. and Dulieu‐Barton J.M. “Dynamic analysis of composite marine structures using full‐field measurement”, J Mar Eng Technol., 13, 2014, 23‐35.
11
FIG 5
FIG 6
Analysis using the DIC technique provides a detailed and complimentary view of the
localised peel and shear strain distributions generated within the joint. High spatial resolution
full-field data is gathered, identifying the global and local material behaviours within the joint,
and the influence these high strain regions have at the discontinuity on the initiation of failure.
The strain distributions in Figs 4, 5 and 6 demonstrate that the relatively simple discontinuity
between components results in very complex, inter-dependent strain distributions within the
joint. The detail of these critical localised strain distributions would not be obtained using
traditional single point measurement techniques such as strain gauges. The observed strain
distributions agree with existing numerical models of single lap joints, such as the peel and
shear distributions along the bondline evaluated by Goland and Reisner [36]. The shear, peel
and axial strain distributions also show good agreement with those seen by Kumar et al [35]
and Tsai and Morton [37] of composite single lap joints, giving confidence that the
experimental methodology is accurately observing the load transfer mechanics between
adherends in the joint. The localised peel and shear strains identified at the root of the
discontinuity play a significant role in the development of damage and the control of ultimate
joint failure, providing an initiation site for damage in the strain critical brittle epoxy matrix
leading to ultimate joint failure. With the current spatial, and temporal, resolutions there is
insufficient detail to resolve the initiation and propagation behaviour around this damage
critical region and needs to be investigated further.
To improve the temporal resolution of the data, quasi-static tests were conducted using the
same test procedure with a 10 bit Photron SA5 high speed camera. The high speed camera
provides the capability to capture the fast initiation and development of damage within the
Crammond, G., Boyd, S. and Dulieu‐Barton J.M. “Dynamic analysis of composite marine structures using full‐field measurement”, J Mar Eng Technol., 13, 2014, 23‐35.
12
joint up to an including failure. Images were recorded at 1000 Hz with an image resolution of
464 x 384 pixels. The image size is much smaller than achieved previously with the 16 MP
LaVision Imager pro-x camera due to limits in the on board camera memory and the high
speed imaging technology. To compensate, optics are used to increase the magnification of
the image, increasing the number of pixels per millimetre in the image. This provides an
image with a high spatial resolution at the expense of reducing the size of the area of interest
for the analysis. An area of interest 6.2 mm x 5.1 mm was imaged at the root of the
discontinuity between the adherends, where damage was observed in Figs 4b) and 4c) to
initiate and propagate. A sigma 105 mm macro lens was attached to the Photron SA5
producing an image resolution of 75 pixels / mm, approximately half than that of the initial
analysis shown in Figs 4 & 5, due to the smaller sensor size of the high speed camera. The
image sequence was analysed with a subset size of 69 x 69 pixels and step size of 20 pixels,
producing a spatial resolution of approximately 4 data points / mm. Similar experimental
methods have been used to analyse small areas of interest around the root of the discontinuity
between adherends in a double butt strap joint with high confidence [38].
Fig 7 shows the a) axial, b) shear and c) peel strain distributions within the joint at 2.7 kN.
Although the image resolution with the high speed camera is lower than the previous analysis,
analysing the joint with a high temporal resolution is very important in establishing an
understanding of the rapid crack growth behaviour within the joint. These two high spatial
and temporal resolution data sets complement each other, providing a reference against which
the high rate testing results can be evaluated. Fig 7a) shows higher axial strain in the
constrained adherend on the left compared to the free adherend on the right, identifying the
free adherend to be lightly loaded. The axial strain field provides a quantitative visualisation
of the differential extension between adherends in the single lap joint due to the different
boundary conditions within the free end of the adherend on the right and the highly loaded

Crammond, G., Boyd, S. and Dulieu‐Barton J.M. “Dynamic analysis of composite marine structures using full‐field measurement”, J Mar Eng Technol., 13, 2014, 23‐35.
13
adherend on the left. As seen in Fig 7b), within the joint the shear strains are greatest within
the adhesive layer between adherends at the discontinuity, decreasing rapidly away from the
adhesive into the surrounding CSM material. Peel strains shown in Fig 7c), are concentrated
in the right hand adherend close to the free end, where load eccentricity is at its greatest,
reducing quickly away from the discontinuity.
Fig 8 shows data for an increased load of 3.1 kN; here the peel and shear strain distributions
develop into distinct, yet inter-dependent features. Analysis of the shear strains identifies a
non-uniform distribution across the thickness of the adhesive layer, generating higher shear
strains closer to the interface between the adhesive and the adherend on the right, propagating
into the CSM face sheets, Fig 8b). The peel strain in Fig 8c) is greatest adjacent to the region
of high shear strain at the interface between the adhesive and right hand adherend. The
position of these concentrations indicates a coupling between the through-thickness and shear
material responses at the interface resulting from the load transfer across the adhesive into the
adherend. A similar localisation of the strains along the interface was observed by Ruiz [39]
using high magnification Moiré interferometry. The high strain along the interface is
suspected to feature heavily in the initiation and propagation of damage.
The first visual signs of damage in the joint can be observed at 3.1 kN from the raw images.
A very small 0.13 mm crack forms at the root of the discontinuity at the interface between the
adhesive and the left hand, constrained, adherend. As this crack is very small it is not easily
discerned in the images. For the purpose of illustration, Figure 9a) shows the crack at 3.8 kN
when it is more clearly visible in the image. Shear strains in the adhesive layer are 1.8% just
prior to the crack initiation. The peel strain is much lower; between 0.15-0.2% and 0.5% axial
strain in the left hand adherend. The failure site is located within the left hand adherend,
where the local peel and shear strains are lower than along the interface as identified in Fig 4c.
This suggests that the initiation of damage is dominated by peel and not shear strain. The

Crammond, G., Boyd, S. and Dulieu‐Barton J.M. “Dynamic analysis of composite marine structures using full‐field measurement”, J Mar Eng Technol., 13, 2014, 23‐35.
14
severe geometric discontinuity at this location is also suspected to influence this damage in
the high axially loaded adherend.
The joint demonstrates significant residual strength and damage tolerance, with the load trace
largely unaffected by the steadily growing crack up to a length of 0.4 mm at 4.5 kN. Shortly
after exceeding 4.5 kN a critical crack length is reached and the crack growth becomes rapid
and unsteady leading to the final failure of the joint. The evolution of the crack from stable to
unstable behaviour is aided by high peel and shear strains which form ahead of the crack tip.
These high strains generate micro cracks ahead of the crack tip in the adhesive layer. Above
4.5 kN these micro cracks coalesce, forming a large single crack, rapidly increasing the crack
growth speed, up to a maximum crack length of 3.2 mm as shown in Fig 9b) after which joint
failure occurs,.
The strain distributions obtained from this investigation form a comprehensive baseline,
against which testing at high speed, representative of dynamic marine loading conditions, are
evaluated. The full-field DIC analysis is shown to be an effective tool for the evaluation of
the complex spatial and temporal behaviours occurring within the laminated structure of the
composite joint. The data identifies localised phenomenon at the root of the discontinuity to
be critical to the damage initiation and tolerance of the composite structure.
FIG 7
FIG 8
FIG 9
SLJ High strain rate analysis

Crammond, G., Boyd, S. and Dulieu‐Barton J.M. “Dynamic analysis of composite marine structures using full‐field measurement”, J Mar Eng Technol., 13, 2014, 23‐35.
15
To date, the majority of high strain rate testing of composite materials and bonded
components have used a split Hopkinson pressure bar, imparting strain rates of up to 104 s-1.
To achieve a constant strain rate loading it is usually the case that test coupon is relatively
small, hence limiting the type of structure and material that can be tested. Drop test rigs and
Charpy impact test rigs have also been used to assess strain rate sensitivity of adhesively
boned coupons under impact [40] and tension [41], [42], but are only capable of strain rates
up to 10 s-1. In this work an Instron VHS 80/20 servo hydraulic test machine, capable of
actuator displacement speeds up to 20 m/s, specially adapted for composite materials is
utilised. The geometry of the specimens used in this machine are of similar size as those as
defined by British (BS), International (ISO) and American (ASTM) standards at quasi-static
rates. The set-up of this machine provides results which are directly comparable between the
high speed and quasi-static test cases. There is a large enclosure around the machine allowing
good optical access of the specimen with high speed cameras as it is loaded. The machine
operates by the controlled single shot release of an oil reservoir held at 280 bar through a
control valve. The first 100 mm of the actuator displacement is within a hollow ‘slack adapter’
system attached to the bottom of the specimen, see Fig 10. This allows the acceleration of the
actuator up to constant velocity, removing any inertial loading from the specimen. At the end
of this initial displacement the actuator engages the end of the slack adapter tube, loading the
specimen, as shown in Fig 10. The speed and travel of the actuator allows for testing at strain
rates up to 102 s-1. The load is measured using a 100 kN Kistler piezo-electric load cell
sampled at 3 MHz. A TTL pulse generator is used to synchronise the data and image capture
between the test machine and the Photron SA5 high speed camera during the failure event,
triggered from the displacement of the slack adapter system just prior to engaging the loading
mechanism.

Crammond, G., Boyd, S. and Dulieu‐Barton J.M. “Dynamic analysis of composite marine structures using full‐field measurement”, J Mar Eng Technol., 13, 2014, 23‐35.
16
FIG 10
High speed testing was conducted with an actuator velocity of 2.5 m/s. This loading velocity
sits within the range of common slamming impact velocities found by Manganelli of for a 50
foot racing yacht during a circumnavigation of the globe [15]. An area measuring 12 mm x
8.9 mm around the root of the discontinuity was imaged using the Photron SA5 camera.
Images were recorded with a temporal resolution of 25 kHz and an image resolution of 600 x
448 pixels. The failure of the joint occurs rapidly, approximately 1 millisecond, presenting a
significant challenge in observing the development of the strain fields and damage within the
joint up to failure, as very few images are recorded during the loading and failure event.
FIG 11
FIG 12
Fig 11 shows the load trace from 4 specimens tested in the Instron VHS machine. The joints
load steadily up to approximately 6 kN, above which there are small fluctuations in the load
trace associated with the growth of damage up to final failure at approximately 9 kN. The
failure load during the quasi-static analysis was 4.5 kN, showing a 100% increase in the
failure load of the joints due to the increased loading rate. This is a significant change in joint
strength, and is greater than reported previously in similar testing of adhesives [43],
composite double butt strap joints [23] or single lap joints [42], which used composite layups
with 0o, 90o, 45o and woven 0/90o adherend face sheets. This suggests that the increase in
strength may be due to the behaviour of the CSM face sheet material, and its influence on the
failure mechanisms within the joint. A noticeable change in the failure surfaces for the joint is
observed between the two different loading regimes. At the quasi-static rate the failure
surface shows the crack growth to occur along the interface between the adhesive and the
composite adherend, with practically no crack growth into the composite adherend, as shown
Crammond, G., Boyd, S. and Dulieu‐Barton J.M. “Dynamic analysis of composite marine structures using full‐field measurement”, J Mar Eng Technol., 13, 2014, 23‐35.
17
in Fig 12a). At the elevated loading rate a different failure surface is observed, see Fig 12b),
which shows fibre-tear failure between adherends. This indicates that the crack has grown
within the adherend rather than just at the adhesive interface, resulting in the violent failure
surface observed. The consistent and dramatic change in the failure surfaces at the high
loading rate suggests a change in the behaviour associated with the increase in ultimate joint
strength through greater interaction between the CSM face sheet and the crack front. This
crack/fibre interaction is apparent from the variation in the load traces of the four specimens
in Fig 11 above 5.2 kN, indicating the variable development of damage within the joint.
Analysis of the developing strain fields using DIC from the high speed imaging was used to
evaluate the behaviour responsible for the changes in joint strength. The high speed images
were processed with a subset size of 49 x 49 pixels and a step size of 15 pixels, producing a
spatial resolution of 3.3 data points / mm. this produces data with a very similar to that of the
magnified quasi-static failure analysis in Fig 7. Inspection of the high speed image sequence
shows damage to occur at the interface between the right hand adherend and the adhesive
layer at the root of the discontinuity, the same location in the joint as observed in the quasi-
static analysis using the high speed camera. The initial damage occurs very quickly,
appearing in less than 1/25000th of a second between two images at 4.7 kN and 5.2 kN, which
is double the load of that in the quasi-static tests. Fig 13 shows the strain fields within the
joint loaded at 4.7 kN, prior to any visual indication of damage in the joint. Prior to the
initiation of damage in the joint at approximately 50% of the failure load, the shear and axial
strains next to the discontinuity are very similar to those in the quasi-static analysis also close
to 50% failure load At the root of the discontinuity the shear and axial strains reach a
maximum of 1.1%, and 0.35% respectively at the interface between the adhesive layer and
the right hand adherend. Very small peel strains, with a low signal to noise ratio are observed,
due to the low spatial resolution of the image, resulting in a poor correlation of the through-

Crammond, G., Boyd, S. and Dulieu‐Barton J.M. “Dynamic analysis of composite marine structures using full‐field measurement”, J Mar Eng Technol., 13, 2014, 23‐35.
18
thickness strains, limiting the analysis of the damage initiation event. The similarity of the
strains prior to damage at quasi-static and high speed loading shows that the initiation of
damage is predominantly a strain critical response within brittle epoxy matrix of the right
hand adherend at the root of the discontinuity, where the geometric discontinuity is the most
severe, and the stress is concentrated locally in the adherend.
The loading curve in Fig 13 increases to well above 5.2 kN, maintaining significant load
carrying capability while damage propagates, up to final failure at 9.7 kN. The strain fields at
8 kN show high axial strain in the right hand adherend during the propagation of damage
within the joint. Axial strain up to 0.65% forms within the undamaged CSM material in the
right hand adherend. Transverse cracking of the epoxy matrix is also visible in the 90o fibres
in the middle of the adherend due to the high axial strain in the adherend. The axial strains in
the CSM material identifies the continued load transfer between adherends in the damaged
condition provided by fibre bridging of the CSM layers across the crack front between
adherends. This agrees with the very violent failure surfaces, which show fibres pulled out of
the adherend aligned parallel to the direction of load. The CSM material also appears to
provide some crack blunting properties, reducing the propagation speed in the joint, as
identified by the large increase in ultimate strength compared to the results in literature
discussed earlier.
Testing at high speed shows a large increase in the ultimate strength of the joint, indicating a
strengthening due to the viscoelastic behaviour of the material. Analysis of the strain fields
shows the initiation of damage occur at similar strain levels between both loading rates tested,
at approximately 50% of the final failure load. The initiation of damage therefore is a strain
critical event, independent of loading rate and strengthening of the material. The strain
distributions show very complex load transfer behaviour around the joint, exhibiting
significant mixed mode loading, and coupled material response around the discontinuity. As a

Crammond, G., Boyd, S. and Dulieu‐Barton J.M. “Dynamic analysis of composite marine structures using full‐field measurement”, J Mar Eng Technol., 13, 2014, 23‐35.
19
result, the strain rate sensitivity of the joint strength cannot be thought of as a single global
response, but is a function of many different local material and dynamic behaviour in the
neighbourhood of the crack-tip. Full analysis of these material and damage mechanics
sensitivities ultimately is not possible with the current equipment, due to severe limitations in
the spatial and temporal resolutions of the high speed cameras available. As a result a
comprehensive comparison of the material behaviours between loading rates cannot be made.
Although limited in resolution due to the currently available hardware, important results have
been obtained. A large strengthening effect was observed due to the response of the CSM
face sheet material. The initiation of damage did not form in the area of greatest peel and
shear strains, but instead was observed to be a strain critical response within the adherend at
the root of the discontinuity, where the geometric discontinuity is the most severe and the
stress most concentrated. The complexity of the behaviour identified within the relatively
simple single lap joint, demonstrates that the local strain distributions have an important, and
often inter-dependent, contribution to the joint strength. Typically the joint geometries and
loadings regimes in marine structures are a lot more complex, attaching multiple components,
containing multiple discontinuities, for which there is no hope for a closed form solution.
Therefore it is vital that full-field data rich experimental investigations are used to provide a
better understanding of the material behaviour and initiation of damage within complex
structures such that engineers and designers have confidence in the use of adhesively bonded
joints.
FIG 13
Conclusions

Crammond, G., Boyd, S. and Dulieu‐Barton J.M. “Dynamic analysis of composite marine structures using full‐field measurement”, J Mar Eng Technol., 13, 2014, 23‐35.
20
Digital Image Correlation was used to establish the component strain distributions within a
composite single lap joint tested up to failure. Analysis focused on the root of the
discontinuity between adherends where failure initiation is observed. The joint was tested
quasi-statically and at high rate, representing the dynamic loading often experienced by
marine structures. High speed imaging was used to analyse the developing strains fields
associated with damage initiation and growth with a high temporal resolution. Significant
residual strength is observed after the initial development of a crack at the root of the
discontinuity in the joint at 50% of the final failure load for both load cases. The strains
evaluated prior to failure around the geometric discontinuity were very similar for both
conditions, identifying the damage initiation to be strain critical at the discontinuity
Significant damage tolerance was demonstrated after the initial development of failure at
approximately 50% of the failure load of the joint, and a 100% increase in the ultimate
strength of the joint was experience at high strain rate loading. The increases in joint strength
between adherends in the matrix dominated loading direction indicate possible viscoelastic
strengthening of the epoxy matrix at high strain rate. The behaviour of the CSM face sheet
material was seen to have a strongly beneficial effect on the strength of the joint, altering the
failure surfaces and indicating interaction between the fibres and the crack front, slowing the
crack propagation.
The results show that DIC is a powerful analytical tool for the evaluation of structures and
loading scenarios. This is particularly useful for complex composite structures where full
knowledge of the material response and loading conditions are not known, leading to
inaccurate numerical models and over engineered or inefficient structural design. Increased
experimental testing of marine structures will build this knowledge base, allowing the
development of numerical models which accurately represent the behaviour and interaction
of heterogeneous strain fields and their relation to the damage. With improved knowledge

Crammond, G., Boyd, S. and Dulieu‐Barton J.M. “Dynamic analysis of composite marine structures using full‐field measurement”, J Mar Eng Technol., 13, 2014, 23‐35.
21
and models, engineers can improve confidence in the structural integrity of adhesively
bonded joints, benefiting from the weight savings and structural efficiency improvements
they can offer, producing lighter, faster and more efficient marine structures.

Crammond, G., Boyd, S. and Dulieu‐Barton J.M. “Dynamic analysis of composite marine structures using full‐field measurement”, J Mar Eng Technol., 13, 2014, 23‐35.
22
[1] P. Goubalt and S. Mayes, “Comparative Analysis of Metal and Composite Materials for the Primary Structures of a Patrol Craft,” Naval Engineers Journal, vol. 108, no. 3, pp. 387–397, 1996.
[2] B. A. Brent and S. Brigham, “Joining composite materials - Mechanical or Adhevise?” [Online]. Available: http://strong.groups.et.byu.net/pages/articles/articles/joining2.pdf. [Accessed: 28-Jan-2013].
[3] S. D. Thoppul, J. Finegan, and R. F. Gibson, “Mechanics of mechanically fastened joints in polymer-matrix composite structures - A review,” Composites Science and Technology, vol. 69, no. 3–4, pp. 301–329, 2009.
[4] R. W. Messler, “The challenges for joining to keep pace with advancing materials and designs,” Materials and Design, vol. 16, pp. 261–269.
[5] F. Campbell, Structural Composite Materials. ASM International, 2010, pp. 449–451.
[6] O. Jacobs, K. Friedrich, and K. Schulte, “Fretting fatigue of continuous carbon fibre reinforced polymer composites,” Wear, vol. 145, no. 1, pp. 167–188, Apr. 1991.
[7] L. da Silva and R. D Adams, “Techniques to reduce the peel stresses in adhesive joints with composites,” International Journal of Adhesion and Adhesives, vol. 27, no. 3, pp. 227–235, Apr. 2007.
[8] T. Keller and T. Vallée, “Adhesively bonded lap joints from pultruded GFRP profiles. Part II: joint strength prediction,” Composites Part B: Engineering, vol. 36, no. 4, pp. 341–350, 2005.
[9] R. H. Kaye and M. Heller, “Through-thickness shape optimisation of bonded repairs and lap-joints,” Journal Of Adhesion, vol. 22, pp. 7–21, 2002.
[10] T. P. Lang and P. K. Mallick, “Effect of spew geometry on stresses in single lap adhesive joints,” Journal Of Adhesion, vol. 18, no. October 1997, pp. 167–177, 1998.
[11] P. Raos, D. Kozak, and M. Lucic, “Stress Strain Analysis of Single Lap Tensile Loaded Adhesive Joints,” in Proceedings of the 9th International Conference on Numerical Methods in Industrial Forming Processes, pp. 1093–1098.
[12] P. Manganelli and P. Wilson, “An experimental investigation of slamming on ocean racing yachts,” in Proceedings of the 15th Chesapeake Sailing Yacht Symposium, 2001.
[13] T. Allen, M. Battley, P. Casari, B. Kerling, I. Stenius, and J. Westlund, “Structural Responses of High Performance Sailing Yachts to Slamming Loads,” in 11th International Conference on Fast Sea Transportation, 2011, no. September 2011, pp. 585–592.
[14] E. Lolive, P. Casari, and P. Davies, “Loading rate effects on foam cores for marine sandwich structures,” in Proceedings of the 7th International Conference on Sandwich Structures, 2005, pp. 895–903.

Crammond, G., Boyd, S. and Dulieu‐Barton J.M. “Dynamic analysis of composite marine structures using full‐field measurement”, J Mar Eng Technol., 13, 2014, 23‐35.
23
[15] P. Manganelli, “Experimental investigation of dynamic loads on offshore racing yachts,” University of Southampton, 2006.
[16] M. Hobbs and P. Manganelli, “Measurment of accelerations and keel loads on canting keel race yachts,” in RINA Modern Yacht Conference, 2007.
[17] M. A. Battley, T. Allen, P. Pehrson, I. Stenius, A. Rosen, and N. Zealand, “Effects of panel stiffness on slamming responses of composite hull panels,” in 17th International Conference on Composite Materials ICCM17, 2009.
[18] R. W. Armstrong and S. M. Walley, “High strain rate properties of metals and alloys,” International Materials Reviews, vol. 53, no. 3, pp. 105–128, 2008.
[19] G. C. Jacob, J. M. Starbuck, J. F. Fellers, S. Simunovic, and R. G. Boeman, “Strain Rate Effects on the Mechanical Properties of Polymer Composite Materials,” Polymer, 2009.
[20] T. Iwamoto, T. Nagai, and T. Sawa, “Experimental and computational investigations on strain rate sensitivity and deformation behavior of bulk materials made of epoxy resin structural adhesive,” International Journal of Solids and Structures, vol. 47, no. 2, pp. 175–185, 2010.
[21] M. A. Martınez, I. S. Chocron, J. Rodrı, V. Sanchez, and L. A. Sastre, “Confined compression of elastic adhesives at high rates of strain,” Journal Of Adhesion, vol. 18, pp. 375–383, 1998.
[22] L. Ã. Goglio, L. Peroni, M. Peroni, and M. Rossetto, “High strain-rate compression and tension behaviour of an epoxy bi-component adhesive,” Journal Of Adhesion, vol. 28, pp. 329–339, 2008.
[23] O. Essersi, M. Tarfaoui, S. W. Boyd, F. Meraghni, and R. A. Shenoi, “Dynamic study of adhesively bonded double lap composite joints,” in 17th International Conference on Composite Materials, 2009.
[24] L. Zachary and C. Burger, “Dynamic wave propagation in a single lap joint,” Experimental Mechanics, vol. 20, no. 5, pp. 162–166, May 1980.
[25] G. Challita and R. Othman, “International Journal of Adhesion & Adhesives Finite-element analysis of SHPB tests on double-lap adhesive joints,” International Journal of Adhesion and Adhesives, vol. 30, no. 4, pp. 236–244, 2010.
[26] S. Raykhere, P. Kumar, R. K. Singh, and V. Parameswaran, “Dynamic shear strength of adhesive joints made of metallic and composite adherents,” Materials and Design, vol. 31, no. 4, pp. 2102–2109, 2011.
[27] C. Sato and K. Ikegami, “Dynamic deformation of lap joints and scarf joints under impact loads,” Journal Of Adhesion, vol. 20, pp. 17–25, 2000.
[28] M. A. Sutton, J.-J. Orteu, and H. W. Schreier, Image Correlation for Shape, Motion and Deformation Measurements: Basic Concepts,Theory and Applications. 2009.

Crammond, G., Boyd, S. and Dulieu‐Barton J.M. “Dynamic analysis of composite marine structures using full‐field measurement”, J Mar Eng Technol., 13, 2014, 23‐35.
24
[29] B. Pan, “Recent Progress in Digital Image Correlation,” Experimental Mechanics, Nov. 2010.
[30] B. Pan, K. Qian, H. Xie, and A. Asundi, “Two-dimensional digital image correlation for in-plane displacement and strain measurement: a review,” Measurement Science and Technology, vol. 20, no. 6, p. 062001, Jun. 2009.
[31] F. Hild and S. Roux, “Digital Image Correlation: from Displacement Measurement to Identification of Elastic Properties - a Review,” Strain, vol. 42, no. 2, pp. 69–80, May 2006.
[32] K. Triconnet, K. Derrien, F. Hild, and D. Baptiste, “Parameter choice for optimized digital image correlation,” Optics and Lasers in Engineering, vol. 47, no. 6, pp. 728–737, Jun. 2009.
[33] A. J. Comer, K. B. Katnam, W. F. Stanley, and T. M. Young, “Characterising the behaviour of composite single lap bonded joints using digital image correlation,” International Journal of Adhesion and Adhesives, vol. 40, pp. 215–223, Jan. 2013.
[34] M. Y. Tsai and J. Morton, “The effect of a spew fillet on adhesive stress distributions in laminated composite single-lap joints,” Composite Structures, vol. 32, no. 1–4, pp. 123–131, 1995.
[35] R. V. Kumar, M. Bhat, and C. Murthy, “Experimental analysis of composite single-lap joints using digital image correlation and comparison with theoretical models,” Journal of Reinforced Plastics and Composites, vol. 32, no. 23, pp. 1858–1876, Aug. 2013.
[36] M. Goland and E. Reissner, “The stresses in cemented joints,” Journal of Applied Mechanics, vol. 11, pp. 17–27, 1944.
[37] M. Y. Tsai, J. Morton, and F. L. Matthews, “Experimental and Numerical Studies of a Laminated Composite Single-Lap Adhesive Joint,” Journal of Composite Materials, vol. 29, no. 9, pp. 1254–1275, Jun. 1995.
[38] G. Crammond, S. . Boyd, and J. . Dulieu-Barton, “Evaluating the localised through-thickness load transfer and damage initiation in a composite joint using digital image correlation,” Composites Part A: Applied Science and Manufacturing, vol. SUBMITTED, 2014.
[39] P. D. Ruiz, F. Jumbo, J. M. Huntley, I. A. Ashcroft, and G. M. Swallowe, “Strain Measurement in the Adhesive Layer of a Bonded Joint Using High Magnification Moire Interferometry,” Experimental Analysis of Nano and Engineering Materials and Structures. pp. 357–358, 2007.
[40] S.-S. Pang, C. Yang, and Y. Zhao, “Impact response of single-lap composite joints,” Composites Engineering, vol. 5, no. 8, pp. 1011–1027, Jan. 1995.
[41] L. Ã. Goglio and M. Rossetto, “Impact rupture of structural adhesive joints under different stress combinations,” vol. 35, pp. 635–643, 2008.

Crammond, G., Boyd, S. and Dulieu‐Barton J.M. “Dynamic analysis of composite marine structures using full‐field measurement”, J Mar Eng Technol., 13, 2014, 23‐35.
25
[42] C. Galliot, J. Rousseau, and G. Verchery, “International Journal of Adhesion & Adhesives Drop weight tensile impact testing of adhesively bonded carbon / epoxy laminate joints,” International Journal of Adhesion and Adhesives, vol. 35, pp. 68–75, 2012.
[43] B. Revsin and S. . Bodner, “Experiments on the dynamic tensile strength of metals and plastics,” Isreal Journal of Technology, vol. 7, pp. 485–493, 1969.

Figure 1: Typical composite structure in yacht hull
Reference image I1
Deformed image I2
Reference image I1
Deformed image I2
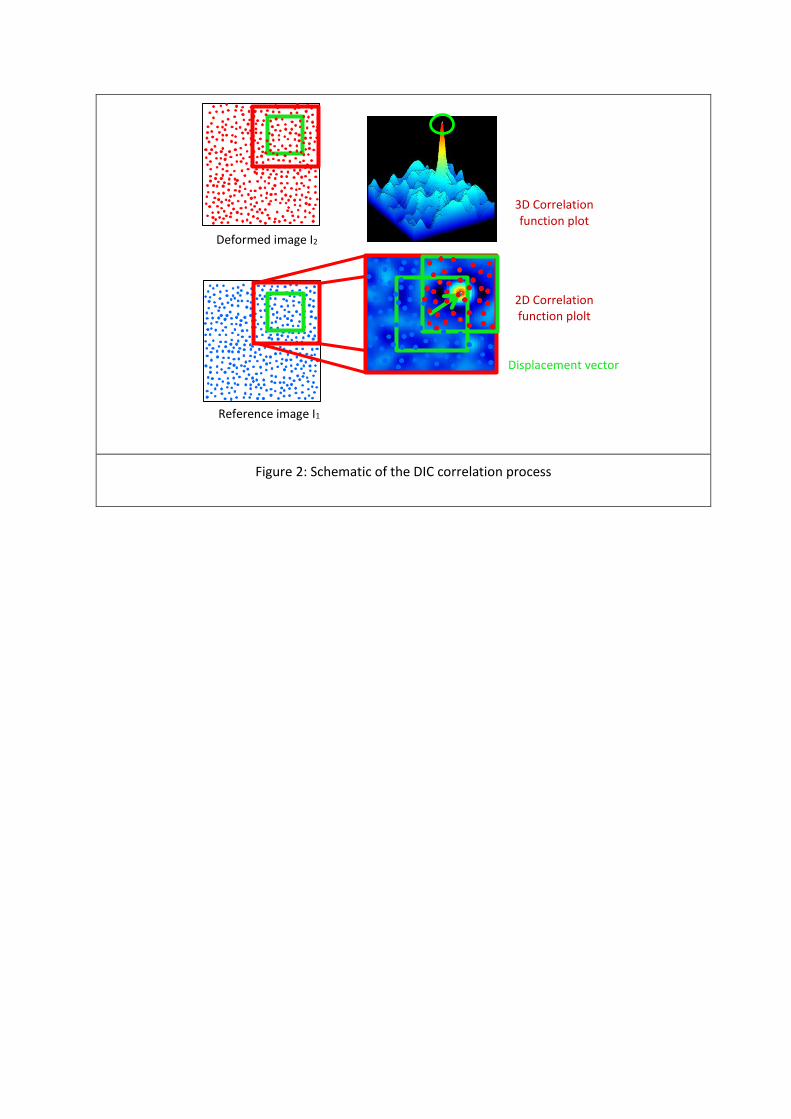
Figure 2: Schematic of the DIC correlation process
Reference image I1
Deformed image I2
Displacement vector
2D Correlation function plolt
3D Correlation function plot

Figure 3:a)Schematic of the single lap joint b) image of the layered composite structure of the
joint
Y
X
25mm
6mm
Adhesive
CSM 90
o
CSM b)
Root of discontinuity
Strap length Adhesive
a)

Figure 4: Peel strain within the SLJ at a) 1.5kN b) 3kN c) 4.7kN
Figure 5: Shear strain within the SLJ at a) 1.5kN b) 3kN c) 4.7kN
b) c) a)
b) c) a)
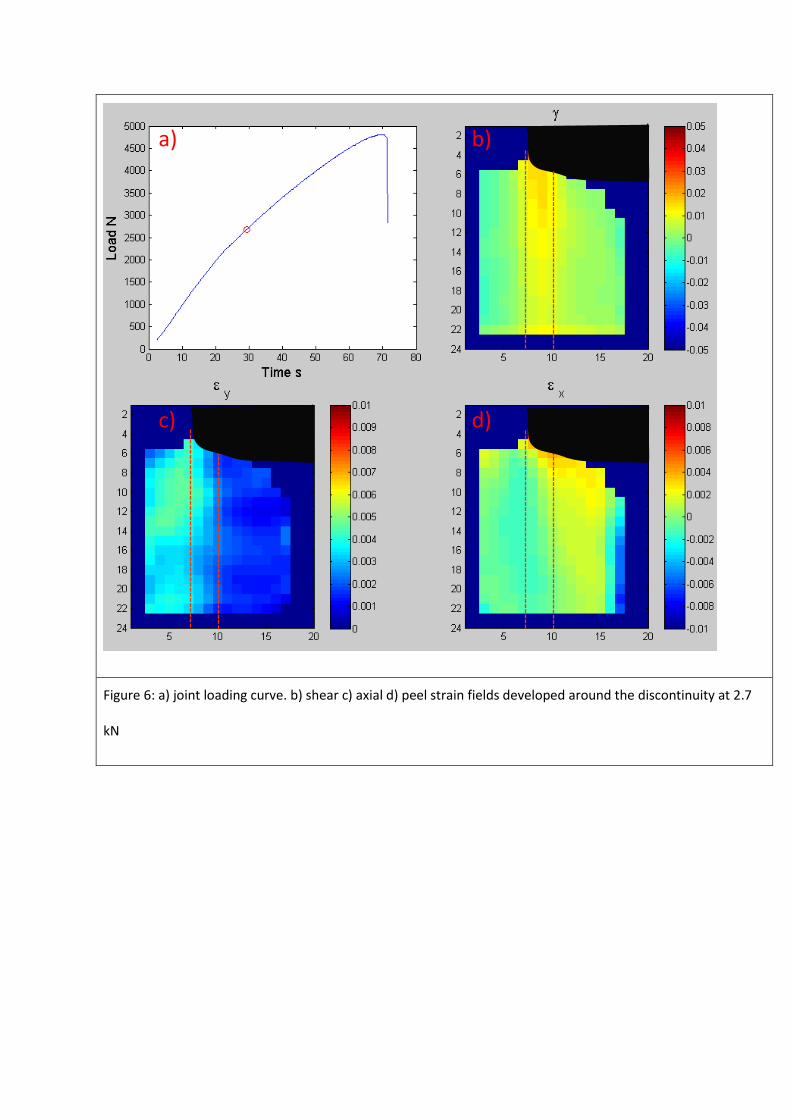
Figure 6: a) joint loading curve. b) shear c) axial d) peel strain fields developed around the discontinuity at 2.7
kN
a) b)
c) d)

Figure 7: a) joint loading curve. b) shear c) axial d) peel strain fields developed around the discontinuity
at 3.1 kN
a) b)
c) d)

Figure 8: a) joint loading curve. b) shear c) axial d) peel strain fields developed around the discontinuity
at 4.4 kN
a) b)
c) d)

Figure 9: Schematic of the slack adapter system, a) prior to actuator movement, b) during acceleration
of the actuator, c) engagement between stack adapter and specimen suring loading at constant
velocity
Bolted to jaw system
Attachment to VHS actuator
Slack adaptor tube
Slack adaptor plug
a) b) c)

Figure 10: SLJ loading curves at 2.5 m/s
Figure 11: Specimen failure surfaces at a) 2 mm/min b) 2.5 m/s
a) b)
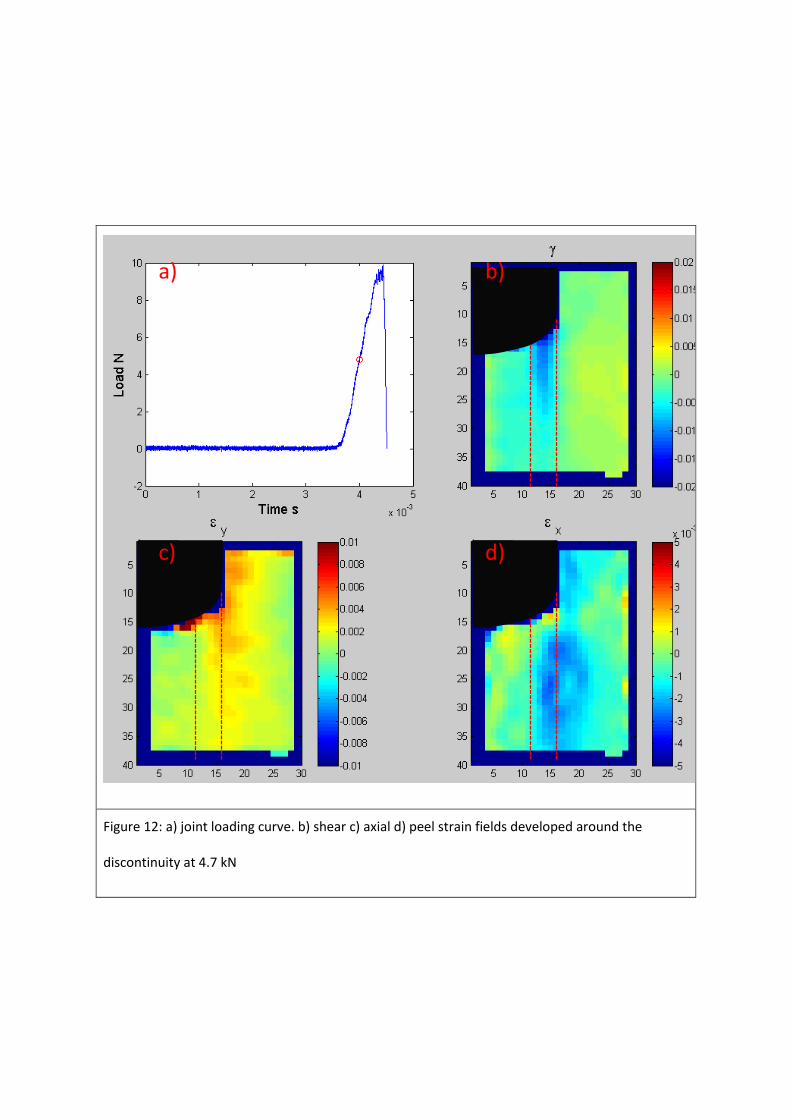
Figure 12: a) joint loading curve. b) shear c) axial d) peel strain fields developed around the
discontinuity at 4.7 kN
a) b)
c) d)