
Crowdsourcing Series: LinkedIn. By Vitaly Gordon & Patrick Philips.
Noname manuscript No.(will be inserted by the editor)
Vitaly Surazhsky · Craig Gotsman
A Qualitative Comparison of Some Mesh SimplificationSoftware Packages
Abstract Simplification of polygonal meshes enables ac-celerated rendering of large 3D scenes without compro-mising the visual quality of the result. The performanceof a number of software packages for mesh simplifica-tion, including both commercial and academic offerings,are compared in this survey. We analyze the geometricdistortion of the simplified version relative to the origi-nal, as measured by the Metro tool [3], vs. the polygoncount. The test datasets used in our study include mod-els of various size and Complexity, drawn from a numberof application domains.
This study does not address other issues related tothe software, such as efficiency, robustness, usability etc.As such, the report should not be interpreted as an over-all recommendation for any specific software package.
1 Introduction and Objectives
Polygonal meshes are the representation of choice for3D visualizations and simulations. Very complex andhighly detailed models are usually generated by eithersolid modeling CAD systems or 3D scanning devices. Tofaithfully represent these complex and detailed modelsthe resulting meshes may have an extremely large num-ber of polygons or triangles. Simplification (aka decima-tion) of polygonal meshes reduces this number, achiev-ing a significant speedup of the rendering of large scenesin dynamic simulation without compromising the visualquality of the scene appearance.
The simplification process and the requirements fromthe resulting mesh involve many different issues: runtimeperformance; memory consumption and ability to sim-plify extremely large models; ability to create differentlevels of detail (LODs); visual and geometric fidelity tothe original; ability to preserve sharp features, flat faces
CMA/IFI, University of Oslo
Center for Graphics and Geometric Computing (CGGC),Technion Israel Institute of Technology
Address(es) of author(s) should be given
and the model topology, ability to take into account tex-ture or other information provided in the model descrip-tion; and other application-specific issues.
This study addresses just one of the above issues,focusing on geometric fidelity of the simplified mesh tothe original. Visual fidelity, as opposed to geometric fi-delity, is obviously a better measure when the resultsare used for visualization. However, although there havebeen attempts to simplify meshes using a perception-based image-driven metric [9], it is extremely difficult inpractice to perform an image-based comparison of theresulting meshes.
Geometric fidelity usually means that the simplifiedmesh is a good approximation of the original with re-spect to some geometric distance measure. In this studywe analyze the simplification results using the popularMetro tool [3], which estimates the Hausdorff distance tothe original mesh. The Hausdorff distance is defined overpoint sets. We say that two point sets are within Haus-dorff distance d from each other if any point of one setis within (Euclidean) distance d from some point of theother set, and vice versa. In our case the two points setsare samples of the original and simplified surfaces. TheHausdorff distance provides a good estimate of the qual-ity of approximation and also of the visual appearanceof the simplified models. Other measures of geometricdifferences exist, such as volumetric deviation from theoriginal surface. However they are much more difficult tocompute and provide a less robust estimate of the visualand geometric fidelity.
Another issue that sometimes arises when evaluat-ing simplification results is the shape of the resultingmesh triangles. Well-shaped, close to equilateral, trian-gles are very important in applications such as finite ele-ment analysis, where a single skinny triangle may causenumerical problems in the mesh simulation. Mesh visu-alization, on the other hand, as well as general surfaceapproximation, based on triangle meshes, does not im-pose any special requirements on the shape of triangles.Requiring well-shaped triangles will usually result in anincrease in the triangle count of the simplified mesh, rel-ative to the case where no such requirement is imposed.
2 Vitaly Surazhsky, Craig Gotsman
Moreover, controlling the triangle shape in addition tothe geometric fidelity may significantly slow down thesimplification process. A special purpose remeshing pro-cess that corrects the shape of triangles and improvessome other mesh properties (see e.g. [1, 11]), is usuallyapplied as a post-processing step after the mesh simplifi-cation. In this study we are not concerned with the qual-ity of the triangle shapes and analyze only the geometricfidelity of the simplified mesh to the original.
Over the last decade many commercial software pack-ages for mesh simplification have appeared. Some of themare dedicated softwares, whose only purpose is mesh sim-plification. On the other hand, since simplification is socommonly used in mesh processing, most of the largecommercial systems for mesh manipulation have a built-in simplification tool. Moreover, there exist also softwarepackages developed in academia as implementations ofsimplification algorithm development. Many of them arejust prototypes, but there exist robust and efficient im-plementations as well. The software packages differ in ap-plicability, usability, flexibility, efficiency, but ultimatelythe main goal of all the packages is to produce a meshwith the best possible tradeoff between a good approxi-mation of the original mesh and the resulting mesh tri-angle count.
This study treats the software as a black box. No at-tempt is made to evaluate the algorithms or technologybehind the software packages. Neither do we provide acomprehensive survey of existing algorithms. For this, werefer the reader to the excellent surveys on mesh simpli-fication algorithms by Heckbert and Garland [6], Puppoand Scopigno [10] and Garland [4]. Cignoni et al. [2], inaddition to a survey of simplification methods, provide aqualitative comparison of some academic simplificationsoftware packages. To the best of our knowledge, to datethere has been no quantitative comparison of commercialsimplification packages.
2 The Software Packages
In this work we examined nine software packages formesh simplification, including both commercial and aca-demic offerings. These are but a subset of the availablepackages. Unfortunately, some of the software vendorswhom we approached for the purpose of this study de-clined to participate.
We briefly list the packages and classify them by theirapplication domains:Reverse engineering: In this domain we selected twocomprehensive systems for converting real-world objectsusing 3D scanning devices into accurate digital represen-tations such as polygonal meshes or NURBS surfaces.• Geomagic Studio 5.0
by Raindrop Geomagic, Inc.• Rapidform 2004
by INUS Technology, Inc.
Modeling: We used two award-winning systems for 3Dmodeling, animation and rendering.• 3ds max 7
by Autodesk, Inc.• Maya 5.0
by Alias Systems Corp.Simplification dedicated: These packages do nothing butsimplification. In addition to simplifying a single mesh,the packages can simplify models that consist of an hier-archy of meshes. This study, however, does not evaluatethis feature, which involve algorithms that distribute thebudget of of the required mesh triangle count over thehierarchy of meshes.• Action3D Reducer 1.1
by Action3D, Inc.This package uses the simplification technology bun-dled in Direct3D, a component of Microsofts DirectXSDK. Since we did not focus on the extra ability ofAction3D to handle a mesh hierarchy, we were ef-fectively evaluating the simplification performance ofDirect3D. This was verified by obtaining identical re-sults when using the Direct3D SDK directly.
• SIM Rational Reducer 3.1by Systems in Motion AS.
• VizUp Professional 1.5by VizUp Technology.
Academic packages:
• QSlim 2.0by Michael Garland, based on [5].
• Memoryless Simplificationby Peter Lindstrom, based on [8].This algorithm is accessible through the TeraScaleBrowser, a visualization system for interactive nav-igation developed at Lawrence Livermore NationalLaboratory.Some of the packages (e.g. VizUp Professional) are
completely automatic, but most of them provide variousoptions to control the simplification process. The natureof these options varies from one package to another, someare more intuitive than others. There is always a tradeoffwhen trying to satisfy a number of different requirementson the resulting mesh (see for example the discussion onthe quality of the mesh triangles in Section 1). Optionswhose main objective is to allow the user to prioritizedesirable properties of the output, are generally useful.
On the other hand, some of the software packagesallow the user to control the internal variables of the al-gorithm. Using such advanced options usually requiresat least a moderate knowledge of the simplification tech-nology and underlying algorithm used in the software.These options are very difficult to use, and, in our opin-ion, are a disadvantage of the software and algorithmdesign. They are, at most, only marginally beneficial toa typical user.
In our use of the software packages, we spared no ef-fort to adjust the options to produce the best possible

A Qualitative Comparison of Some Mesh Simplification Software Packages 3
results. Despite this, we do not guarantee that it is im-possible to improve on our simplification results for anyparticular model and any particular software.
3 The Test Dataset
We tested the software on the following seven models ofdifferent sizes, properties and acquisition sources.Grand Canyon: The model is a part of the Grand CanyonTerrain model by USGS and Chad McCabe, available athttp://www.cc.gatech.edu/projects/large models/gcanyon.html.The mesh is a manifold mesh containing 62,000 verticesand 31,228 triangles, representing a terrain surface.Cow: The cow model is a standard model for testing theperformance of mesh processing algorithms and is com-monly available. The mesh is a closed spherical manifoldcontaining 2,924 vertices and 5,844 triangles.Helicopter: This CAD model of a helicopter has manyfine details, but also close to redundant geometry. Themodel is provided with Rational Reducer by kind permis-sion of 3dlabs.com. The mesh is non-manifold, consistingof 44 connected components containing 59,582 verticesand 116,841 triangles.Shark: This CAD model of a shark consists of smooth,curved surfaces. It is distributed with Rational Reducerby kind permission of Viewpoint Datalabs Ltd. The meshconsists of 12 manifold connected components containing10,674 vertices and 20,464 triangles.P51–Mustang: This CAD model of a plane is character-ized by its visual simplicity but at the same time consistsof complicated design by polygons of different sizes andshapes. The model is courtesy of Viewpoint AnimationEngineering and is available from the the Avalon public3D archive. The mesh consists of 14 manifold connectedcomponents containing 1,601 vertices and 2,992 trian-gles.Fandisk: This CAD model is characterized by sharp edgesand complex surface curvature. It is supplied with theMesh Optimization software package by Hoppe [7], avail-able at http://research.microsoft.com/∼hoppe/code.htm.The mesh is a closed spherical manifold containing 6,475vertices and 12,946 triangles.Torus: This model is a tessellation of a smooth geomet-ric object with a large hyperbolic region. The mesh isa closed genus-1 manifold containing 3,200 vertices and6,400 triangles.
4 Our Experiments
Each model was simplified down to three different reso-lutions. The highest resolution (between 40% and 8% ofthe original polygon count) demonstrated the ability ofthe simplification packages to remove obviously redun-dant geometry while maintaining a result almost identi-cal to the original. The lowest resolution (between 10%and 1%) was selected such that the simplified mesh still
has all its important details but further simplificationwill dramatically change its appearance. The intermedi-ate resolution was chosen to examine the consistency ofthe simplification behavior.
For every simplified mesh we measured its Hausdorffand average distances to the original model. The twomeshes are first brought into close correspondence. TheHausdorff distance is then the maximal Euclidean dis-tance between a point on one surface and the closestpoint on the other surface. The average distance is theaverage of these point distances over the entire surface.The Hausdorff and average distances are defined overpoint sets, so the Metro tool point-samples the meshfaces and uses these samples to approximate the dis-tances between the meshes. Metro provides the Haus-dorff and average distances in both directions: when thefirst mesh is sampled and the distances to the secondmesh are computed, and vice versa. To symmetrize thismeasure, we used the maximum of the two Hausdorff dis-tances, and the average of the two average distances forthe Hausdorff and average distances between two meshes,respectively. Metro employs several types of samplingmethods. We used the subdivision sampling with 10 sam-ples per face.
One of the most difficult questions in the analysis ofthe results was how to combine them in order to fairlycompare them: We had 9 software packages, 7 modelsand 3 resolutions. The Metro results should be normal-ized somehow before being averaged. Different modelsat different resolution have distances of different magni-tude. Moreover while on one model at a specific resolu-tion all the software packages produced similar results,on another model the results varied significantly. Thus,we should take into account the difference in magnitudeand variance of the resulting distances when combiningthe results of a specific software package. In addition, wetried to do this in a way that is not very sensitive to out-liers (in our case an outlier is a package that performedsignificantly worse than the others), and at the same timedoes not penalize these outliers too much. Surprisingly,every package was an outlier at least once in our tests,thus this is a real concern.
We replace every measured distance to the original(either Hausdorff or average) by a corresponding score.The score is based on the distance but also reflects the re-sults of all other software packages on this specific modeland resolution, as follows: Let P be the set of all soft-ware packages, and let D = {di|i ∈ P} be the set of theresulting distances of the simplified meshes generated byall software packages on a specific model at a specific res-olution. Denote by dmin the minimum of D, and by dav
the average of D. Given d ∈ D, our goal is to computethe corresponding score s such that the following holds:• dmin has the score of 100, and• dav has the score of Cav,
where Cav is a constant denoting the average score. Sincethe score should be inversely proportional to the dis-
4 Vitaly Surazhsky, Craig Gotsman
tance, we can write this dependence as: s = k/d + c,where k and c are some constants. Having two condi-tions for the minimal and average score, we obtain: k =
100−Cav
1/dmin+1/davand c = 100 − k/dmin. We used Cav = 75
for all models and resolutions. In this case, the scoresare distributed mostly between 50 and 100. Since thescores have roughly the same variance and range, we canaverage them to estimate and compare the overall perfor-mance of the software packages. These appear in Figures1–9, while Figures 10 and 11 present the overall results.
5 Conclusion
Drawing precise conclusions from our study is very dif-ficult. No absolute winner or loser emerged. However, anumber of observations are possible.
In terms of the distance measures used, the Haus-dorff distance seems to reflect visual fidelity better thanthe average distance. A large deviation from the origi-nal surface even at just a small localized feature of themesh can significantly affect the visual perception of themodel, and this will be reflected in the Hausdorff dis-tance even if the rest of the simplified mesh is very closeto the original. The average distance describes the over-all fidelity, which is very important when the simplifiedmesh is used as an approximate representation of theoriginal for geometric processing, simulation or analysis.
With respect to the Hausdorff distance, GeomagicStudio was the leader in the high resolution category. Di-rect3D and Rapidform 2004 also demonstrated very goodresults in this category, while 3ds max was the leader inthe coarsest resolution category. In general, GeomagicStudio, Rapidform 2004 and 3ds max demonstrated su-perior results with respect to the Hausdorff distance.
Memoryless simplification seems to be the absoluteleader with respect to the average distance measure, re-taining a large performance gap relative to the others.We believe these results are due to the excellent algo-rithm employed [8]. After this, QSlim, Rapidform 2004,Maya, Geomagic Studio and VizUp Professional demon-strated good results with respect to the same measure.
Geomagic Studio and Rapidform 2004 demonstratedoutstanding results with respect to both the Hausdorffand average distances, which seems to be very difficultto achieve simultaneously.
On a practical note, all the simplification tools em-bedded in the large modeling software packages that wetested tend to produce simplified meshes of very highfidelity. So there does not seem to be any reason for auser of these packages to look for simplification technol-ogy outside the package, unless the model consists of anentire hierarchy of meshes, which are sometimes treatedseparately, resulting in suboptimal results.
This study has not addressed runtime and memoryperformance of the software packages in any detail. Nonethe-less, we can make some general comments on this aspect.
The runtime performance of all the software packageswas comparable, and considerably less computationallyexpensive than typical remeshing (see Section 1) algo-rithms, which are competition in some sense.
While runtime is an important issue in simplificationperformance, we believe that it is not as critical as mem-ory consumption, which can dramatically affect the over-all performance for very large input meshes. We hope toaddress this issue in detail in a future study.
6 Acknowledgements
We would like to thank Action3D, Inc., INUS Technol-ogy, Inc., Raindrop Geomagic, Inc., Systems in Motion ASand VizUp Technology for kindly providing us with a ver-sion of their software specifically for this study. We alsothank Peter Lindstrom and Hugues Hoppe for their helpin the evaluation of Memoryless Simplification and theDirect3D SDK respectively.
This study was partially supported by Israel Min-istry of Science grant 01-01-01509, German-Israel Fund(GIF) Grant I-627-45.6/1999, European FP6 NoE grant506766 (AIM@SHAPE), the Research Council of Nor-way (BeMatA project) and by the Technion Center ofSecurity Science and Technology.
References
1. Alliez, P., Colin de Verdiere, E., Devillers, O., Isenburg,M.: Isotropic surface remeshing. In: Proceedings of ShapeModeling International, pp. 49–58 (2003)
2. Cignoni, P., Montani, C., Scopigno, R.: A comparison ofmesh simplification algorithms. Computers and Graphics22(1), 37–54 (1998)
3. Cignoni, P., Rocchini, C., Scopigno, R.: Metro: Measur-ing error on simplified surfaces. Computer Graphics Fo-rum 17(2), 167–174 (1998)
4. Garland, M.: Multiresolution modeling: Survey & futureopportunities. Eurographics ’99 – State of the Art Re-ports pp. 111–131 (1999)
5. Garland, M., Heckbert, P.S.: Surface simplification usingquadric error metrics. Computer Graphics 31(AnnualConference Series), 209–216 (1997)
6. Heckbert, P.S., Garland, M.: Survey of polygonal surfacesimplification algorithms. SIGGRAPH ’97 Course Notes(1997)
7. Hoppe, H., DeRose, T., Duchamp, T., McDonald, J.,Stuetzle, W.: Mesh optimization. Computer Graphics.SIGGRAPH ’93 Proceedings 27, 19–26 (1993)
8. Lindstrom, P., Turk, G.: Fast and memory efficient polyg-onal simplification. In: Proceedings of IEEE Visualiza-tion, pp. 279–286 (1998)
9. Lindstrom, P., Turk, G.: Image-driven simplification.ACM Transactions on Graphics 19(3), 204–241 (2000).DOI http://doi.acm.org/10.1145/353981.353995
10. Puppo, E., Scopigno, R.: Simplification, LOD and mul-tiresolution — principles and applications. Eurographics’97 Tutorial Notes (1997)
11. Surazhsky, V., Gotsman, C.: Explicit surface remeshing.In: Proceedings of Eurographics Symposium on Geome-try Processing, pp. 17–28 (2003)

A Qualitative Comparison of Some Mesh Simplification Software Packages 5
Grand Canyon, Hausdorff distance
0.00 0.50 1.00 1.50 2.00 2.50 3.00 3.50 4.00 4.50 5.00
3DS Max
Geomagic Studio
Rapid Form 2004
Rational Reducer
Maya
Qslim
VizUp
Direct3D
Memoryless
8%
3%
1%
Grand Canyon, Average distance
0.00 0.05 0.10 0.15 0.20 0.25 0.30 0.35 0.40
3DS Max
Geomagic Studio
Rapid Form 2004
Rational Reducer
Maya
Qslim
VizUp
Direct3D
Memoryless
8%
3%
1%
Original
Hausdorff dist/score3DS Max 0.724 88.00 1.415 78.44 3.772 71.06Geomagic Studio 0.651 97.31 1.612 68.12 2.374 90.58Rapid Form 2004 1.490 45.21 1.127 100.00 2.014 100.00Rational Reducer 0.818 78.45 1.455 76.11 2.284 92.66Maya 0.946 68.43 1.762 61.81 4.050 68.78Qslim 0.633 100.00 1.558 70.69 2.050 98.91VizUp 0.744 85.77 1.396 79.57 7.054 55.63Direct3D 0.694 91.64 1.305 85.56 2.043 99.11Memoryless 0.794 80.70 1.351 82.46 2.048 98.96
Average dist/score3DS Max 0.0853 70.44 0.1518 72.01 0.2849 73.38Geomagic Studio 0.0716 79.57 0.1330 79.46 0.2529 80.24Rapid Form 2004 0.0646 85.62 0.1228 84.48 0.2419 83.02Rational Reducer 0.1135 58.68 0.1955 60.23 0.3516 63.10Maya 0.0691 81.58 0.1361 78.08 0.2792 74.49Qslim 0.0670 83.37 0.1324 79.76 0.2674 76.93VizUp 0.0738 77.88 0.1340 79.01 0.2586 78.90Direct3D 0.0721 79.17 0.1306 80.57 0.2376 84.16Memoryless 0.0526 100.00 0.0992 100.00 0.1911 100.00
8% 3% 1%
8% 3% 1%
Best 8%: QSlim Best 3%: Rapid Form 2004 Best 1%: Rapid Form 2004
Worst 8%: Rapid Form 2004 Worst 3%: Maya Worst 1%: VizUp
Fig. 1: Simplification results for the Grand Canyon model, which is a manifold mesh containing 62,000 vertices and 31,228 triangles,representing a terrain surface. The bar charts on the top show the Hausdorff and average distances. The tables contain both thedistances and the corresponding scores. The underlined and double-underlined distances are the minimal (best) and maximaldistances respectively. The two bottom rows demonstrate the best and worst results with respect to the Hausdorff distance.

6 Vitaly Surazhsky, Craig Gotsman
Cow, Hausdorff distance
0.00 1.00 2.00 3.00 4.00 5.00 6.00
3DS Max
Geomagic Studio
Rapid Form 2004
Rational Reducer
Maya
Qslim
VizUp
Direct3D
Memoryless
20%
10%
5%
Cow, Average distance
0.00 0.05 0.10 0.15 0.20 0.25 0.30 0.35 0.40 0.45 0.50
3DS Max
Geomagic Studio
Rapid Form 2004
Rational Reducer
Maya
Qslim
VizUp
Direct3D
Memoryless
20%
10%
5%
Original
Hausdorff dist/score3DS Max 0.921 65.70 1.639 89.33 2.549 100.00Geomagic Studio 0.726 83.19 1.346 100.00 3.288 84.58Rapid Form 2004 0.656 91.94 2.165 77.44 5.162 65.26Rational Reducer 0.924 65.47 2.378 74.13 4.231 72.72Maya 0.735 82.18 3.084 66.39 3.091 87.97Qslim 0.920 65.79 3.600 62.67 4.716 68.47VizUp 0.759 79.63 2.012 80.27 5.031 66.14Direct3D 0.603 100.00 2.766 69.39 5.921 60.91Memoryless 1.868 32.79 2.227 76.42 4.371 71.39
Average dist/score3DS Max 0.1072 67.62 0.2114 67.83 0.3658 70.72Geomagic Studio 0.0850 77.71 0.1581 80.45 0.3080 78.36Rapid Form 2004 0.0734 85.44 0.1449 84.98 0.2791 83.35Rational Reducer 0.1398 58.58 0.2681 59.93 0.4967 60.01Maya 0.0754 83.93 0.1527 82.20 0.2710 84.95Qslim 0.0701 88.12 0.1427 85.81 0.2670 85.78VizUp 0.0792 81.28 0.1638 78.69 0.3293 75.23Direct3D 0.0839 78.33 0.1762 75.29 0.3358 74.35Memoryless 0.0584 100.00 0.1136 100.00 0.2127 100.00
20% 10% 5%
20% 10% 5%
Best 20%: Direct3D Best 10%: Geomagic Studio Best 5%: 3ds max
Worst 20%: Memoryless Worst 10%: QSlim Worst 5%: Direct3D
Fig. 2: Simplification results for the cow model, which is a closed spherical manifold containing 2,924 vertices and 5,844 triangles.The bar charts on the top show the Hausdorff and average distances. The tables contain both the distances and the correspondingscores. The underlined and double-underlined distances are the minimal (best) and maximal distances respectively. The two bottomrows demonstrate the best and worst results with respect to the Hausdorff distance.
A Qualitative Comparison of Some Mesh Simplification Software Packages 7
Helicopter, Hausdorff distance
0.00 0.20 0.40 0.60 0.80 1.00 1.20 1.40 1.60 1.80
3DS Max
Geomagic Studio
Rapid Form 2004
Rational Reducer
Maya
Qslim
VizUp
Direct3D
Memoryless
10%
6%
3%
Helicopter, Average distance
0.00 0.01 0.01 0.02 0.02 0.03 0.03 0.04 0.04 0.05 0.05
3DS Max
Geomagic Studio
Rapid Form 2004
Rational Reducer
Maya
Qslim
VizUp
Direct3D
Memoryless
10%
6%
3%
Original
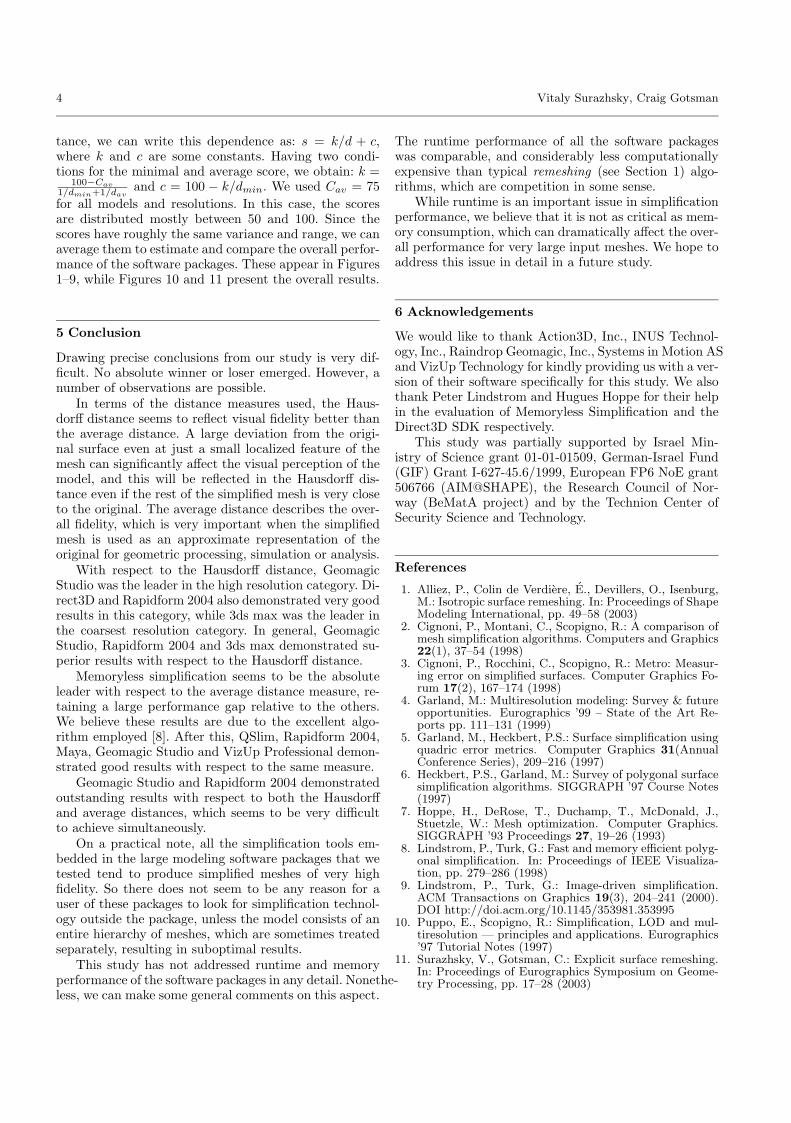
Hausdorff dist/score3DS Max 0.035 100.00 0.083 100.00 0.171 100.00Geomagic Studio 0.049 85.03 0.361 63.57 2.256 72.14Rapid Form 2004 0.071 73.22 0.119 85.50 1.184 74.21Rational Reducer 0.056 80.23 0.124 84.11 0.266 89.21Maya 0.045 88.39 0.109 88.70 0.197 95.97Qslim 0.085 69.02 0.206 71.69 1.177 74.24VizUp 0.126 62.22 0.226 70.03 1.760 72.79Direct3D 0.076 71.77 0.547 59.89 2.966 71.60Memoryless 0.129 61.85 0.398 62.57 1.145 74.36
Average dist/score3DS Max 0.0022 75.08 0.0059 75.03 0.0170 81.34Geomagic Studio 0.0041 71.02 0.0103 70.63 0.0642 68.68Rapid Form 2004 0.0031 72.48 0.0049 77.20 0.0174 80.93Rational Reducer 0.0033 72.16 0.0095 71.14 0.0293 74.11Maya 0.0008 91.31 0.0023 90.62 0.0082 100.00Qslim 0.0007 92.53 0.0022 91.70 0.0102 92.83VizUp 0.0014 80.05 0.0062 74.51 0.0422 71.07Direct3D 0.0019 76.66 0.0058 75.26 0.0267 75.09Memoryless 0.0006 100.00 0.0017 100.00 0.0109 91.12
10% 6% 3%
10% 6% 3%
Best 10%: 3ds max Best 6%: 3ds max Best 3%: 3ds max
Worst 10%: Memoryless Worst 6%: Direct3D Worst 3%: Direct3D
Fig. 3: Simplification results for the helicopter model, which is non-manifold, consisting of 44 connected components containing59,582 vertices and 116,841 triangles. The bar charts on the top show the Hausdorff and average distances. The tables contain boththe distances and the corresponding scores. The underlined and double-underlined distances are the minimal (best) and maximaldistances respectively. The two bottom rows demonstrate the best and worst results with respect to the Hausdorff distance.

8 Vitaly Surazhsky, Craig Gotsman
Shark, Hausdorff distance
0.00 0.10 0.20 0.30 0.40 0.50 0.60 0.70 0.80 0.90 1.00
3DS Max
Geomagic Studio
Rapid Form 2004
Rational Reducer
Maya
Qslim
VizUp
Direct3D
Memoryless
12%
7%
4%
Shark, Average distance
0.00 0.01 0.02 0.03 0.04 0.05 0.06 0.07 0.08 0.09
3DS Max
Geomagic Studio
Rapid Form 2004
Rational Reducer
Maya
Qslim
VizUp
Direct3D
Memoryless
12%
7%
4%
Original
Hausdorff dist/score3DS Max 0.197 71.11 0.211 89.94 0.429 94.85Geomagic Studio 0.130 95.24 0.219 88.10 0.553 78.15Rapid Form 2004 0.122 100.00 0.177 100.00 0.401 100.00Rational Reducer 0.176 76.67 0.418 63.90 0.712 65.31Maya 0.272 58.20 0.311 73.04 0.565 76.95Qslim 0.172 77.75 0.248 82.09 0.530 80.66VizUp 0.203 69.56 0.479 60.49 0.907 55.70Direct3D 0.146 87.58 0.303 74.00 4.633 27.42Memoryless 0.247 61.59 0.463 61.29 0.874 57.00
Average dist/score3DS Max 0.0170 77.81 0.0303 69.67 0.0531 71.59Geomagic Studio 0.0121 84.36 0.0219 77.85 0.0422 76.82Rapid Form 2004 0.0109 87.07 0.0185 83.28 0.0332 83.71Rational Reducer 0.0207 74.86 0.0377 65.42 0.0652 67.80Maya 0.0604 65.97 0.0190 82.49 0.0372 80.27Qslim 0.0091 91.93 0.0167 87.10 0.0337 83.22VizUp 0.0130 82.79 0.0256 73.55 0.0534 71.47Direct3D 0.0164 78.35 0.0315 68.81 0.0808 64.62Memoryless 0.0072 100.00 0.0125 100.00 0.0221 100.00
12% 7% 4%
12% 7% 4%
Best 12%: Rapid Form 2004 Best 7%: Rapid Form 2004 Best 4%: Rapid Form 2004
Worst 12%: Maya Worst 7%: VizUp Worst 4%: Direct3D
Fig. 4: Simplification results for the shark model, consisting of 12 manifold connected components containing 10,674 vertices and20,464 triangles. The bar charts on the top show the Hausdorff and average distances. The tables contain both the distances and thecorresponding scores. The underlined and double-underlined distances are the minimal (best) and maximal distances respectively.The two bottom rows demonstrate the best and worst results with respect to the Hausdorff distance.

A Qualitative Comparison of Some Mesh Simplification Software Packages 9
P51-Mustang, Hausdorff distance
0.00 0.02 0.04 0.06 0.08 0.10 0.12 0.14 0.16
3DS Max
Geomagic Studio
Rapid Form 2004
Rational Reducer
Maya
Qslim
VizUp
Direct3D
Memoryless
40%
20%
10%
P51-Mustang, Average distance
0.0000 0.0020 0.0040 0.0060 0.0080 0.0100 0.0120
3DS Max
Geomagic Studio
Rapid Form 2004
Rational Reducer
Maya
Qslim
VizUp
Direct3D
Memoryless
40%
20%
10%
Original
Hausdorff dist/score3DS Max 0.011 86.34 0.039 71.96 0.054 100.00Geomagic Studio 0.010 89.68 0.026 82.13 0.097 85.82Rapid Form 2004 0.010 90.04 0.041 71.26 0.448 71.58Rational Reducer 0.024 70.77 0.036 73.64 0.074 91.42Maya 0.035 66.48 0.035 74.15 0.450 71.56Qslim 0.021 72.94 0.025 83.77 0.452 71.54VizUp 0.018 75.63 0.036 73.60 0.100 85.25Direct3D 0.008 100.00 0.016 100.00 0.099 85.37Memoryless 0.012 84.65 0.051 67.19 0.088 87.70
Average dist/score3DS Max 0.0008 73.73 0.0034 71.88 0.0111 69.37Geomagic Studio 0.0009 72.63 0.0039 70.83 0.0107 69.90Rapid Form 2004 0.0003 86.43 0.0015 81.72 0.0074 76.55Rational Reducer 0.0011 70.76 0.0044 70.11 0.0094 72.06Maya 0.0011 70.68 0.0018 79.43 0.0074 76.64Qslim 0.0002 93.76 0.0011 89.16 0.0062 80.73VizUp 0.0003 90.24 0.0011 88.11 0.0037 98.24Direct3D 0.0004 84.31 0.0021 76.65 0.0058 82.79Memoryless 0.0002 100.00 0.0008 100.00 0.0036 100.00
40% 20% 10%
40% 20% 10%
Best 40%: Direct3D Best 20%: Direct3D Best 10%: 3ds max
Worst 40%: Maya Worst 20%: Memoryless Worst 10%: QSlim
Fig. 5: Simplification results for the P51–Mustang model, consisting of 14 manifold connected components containing 1,601vertices and 2,992 triangles. The bar charts on the top show the Hausdorff and average distances. The tables contain both thedistances and the corresponding scores. The underlined and double-underlined distances are the minimal (best) and maximaldistances respectively. The two bottom rows demonstrate the best and worst results with respect to the Hausdorff distance.

10 Vitaly Surazhsky, Craig Gotsman
Fandisk, Hausdorff distance
0.00 0.50 1.00 1.50 2.00 2.50
3DS Max
Geomagic Studio
Rapid Form 2004
Rational Reducer
Maya
Qslim
VizUp
Direct3D
Memoryless
10%
5%
2%
Fandisk, Average distance
0.00 0.01 0.02 0.03 0.04 0.05 0.06
3DS Max
Geomagic Studio
Rapid Form 2004
Rational Reducer
Maya
Qslim
VizUp
Direct3D
Memoryless
10%
5%
2%
Original
Hausdorff dist/score3DS Max 0.064 91.98 0.136 92.99 0.592 86.60Geomagic Studio 0.049 97.83 0.108 98.86 0.434 94.17Rapid Form 2004 0.074 89.36 0.192 86.53 0.410 95.88Rational Reducer 0.067 91.18 0.243 83.29 1.459 74.17Maya 0.135 82.05 0.169 88.68 0.511 89.89Qslim 3.967 73.43 3.967 71.61 3.879 68.88VizUp 0.125 82.72 0.277 81.74 2.019 71.82Direct3D 0.567 75.24 0.560 76.24 0.757 82.02Memoryless 0.045 100.00 0.104 100.00 0.361 100.00
Average dist/score3DS Max 0.004 79.57 0.011 77.34 0.048 77.21Geomagic Studio 0.003 87.74 0.007 87.18 0.028 88.81Rapid Form 2004 0.003 87.39 0.008 83.91 0.030 86.70Rational Reducer 0.007 71.00 0.029 66.58 0.168 65.82Maya 0.004 79.39 0.009 82.28 0.031 86.27Qslim 0.012 65.57 0.016 72.19 0.036 82.49VizUp 0.003 89.65 0.010 78.68 0.049 76.83Direct3D 0.005 74.50 0.013 75.27 0.046 77.74Memoryless 0.002 100.00 0.005 100.00 0.020 100.00
10% 5% 2%
10% 5% 2%
Best 10%: Memoryless Best 5%: Memoryless Best 2%: Memoryless
Worst 10%: QSlim Worst 5%: QSlim Worst 2%: QSlim
Fig. 6: Simplification results for the fandisk model, which is a closed spherical manifold containing 6,475 vertices and 12,946triangles. The bar charts on the top show the Hausdorff and average distances. The tables contain both the distances and thecorresponding scores. The underlined and double-underlined distances are the minimal (best) and maximal distances respectively.The two bottom rows demonstrate the best and worst results with respect to the Hausdorff distance.
A Qualitative Comparison of Some Mesh Simplification Software Packages 11
Torus, Hausdorff distance
0.00 1.00 2.00 3.00 4.00 5.00 6.00 7.00 8.00
3DS Max
Geomagic Studio
Rapid Form 2004
Rational Reducer
Maya
Qslim
VizUp
Direct3D
Memoryless
6%
3%
1%
Torus, Average distance
0.00 0.50 1.00 1.50 2.00 2.50
3DS Max
Geomagic Studio
Rapid Form 2004
Rational Reducer
Maya
Qslim
VizUp
Direct3D
Memoryless
6%
3%
1%
Original
Hausdorff dist/score3DS Max 1.420 63.54 2.501 51.04 5.445 73.89Geomagic Studio 0.731 86.30 1.382 100.00 4.688 80.13Rapid Form 2004 0.565 100.00 1.480 92.75 3.249 100.00Rational Reducer 1.155 69.06 2.102 62.51 5.594 72.86Maya 0.741 85.65 1.537 88.96 6.643 66.92Qslim 0.576 98.91 1.412 97.67 4.388 83.20VizUp 1.464 62.81 2.131 61.53 5.722 72.01Direct3D 1.284 66.10 2.075 63.44 7.967 61.65Memoryless 0.728 86.49 1.500 91.38 3.936 88.71
Average dist/score3DS Max 0.327 67.42 0.673 68.15 1.801 69.62Geomagic Studio 0.166 85.12 0.354 83.26 1.112 80.92Rapid Form 2004 0.171 84.07 0.344 84.21 1.065 82.22Rational Reducer 0.390 64.42 0.826 65.05 2.424 64.94Maya 0.175 83.24 0.363 82.44 1.055 82.51Qslim 0.155 87.76 0.323 86.31 1.003 84.13VizUp 0.284 70.20 0.602 70.11 1.690 70.82Direct3D 0.294 69.46 0.583 70.75 1.693 70.79Memoryless 0.118 100.00 0.232 100.00 0.676 100.00
6% 3% 1%
6% 3% 1%
Best 6%: Rapid Form 2004 Best 3%: Geomagic Studio Best 1%: Rapid Form 2004
Worst 6%: VizUp Worst 3%: 3ds max Worst 1%: Direct3D
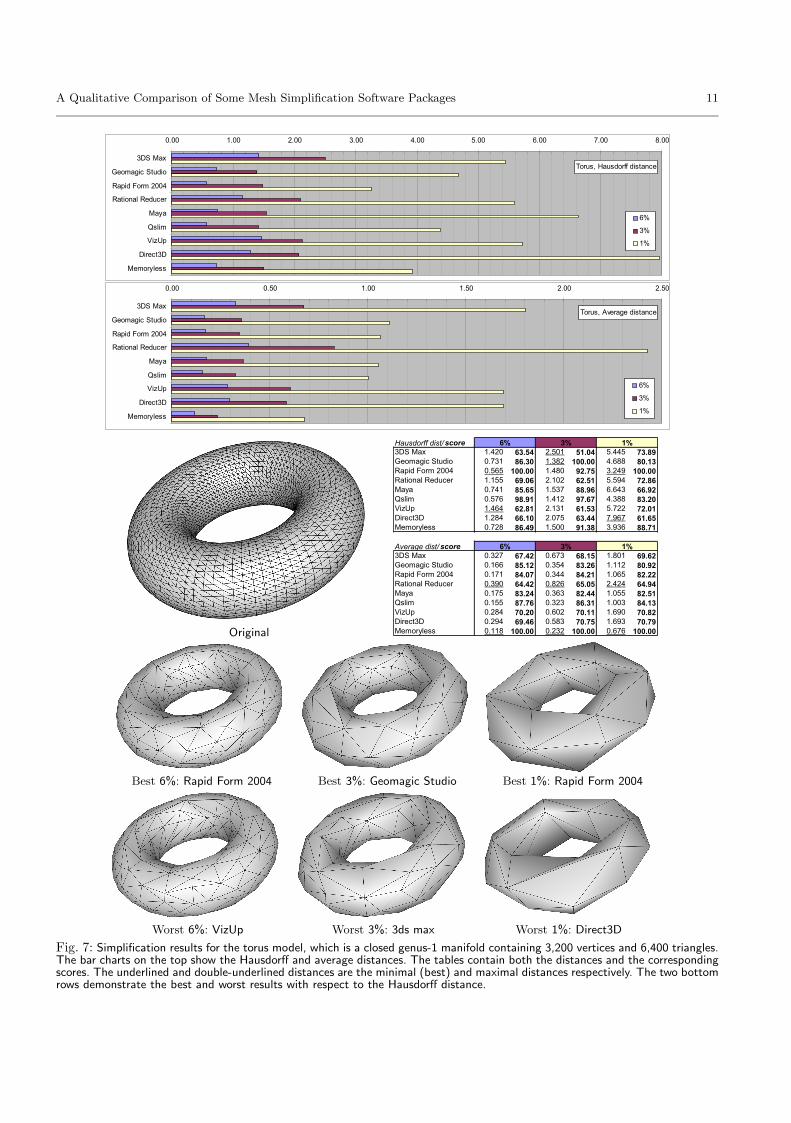
Fig. 7: Simplification results for the torus model, which is a closed genus-1 manifold containing 3,200 vertices and 6,400 triangles.The bar charts on the top show the Hausdorff and average distances. The tables contain both the distances and the correspondingscores. The underlined and double-underlined distances are the minimal (best) and maximal distances respectively. The two bottomrows demonstrate the best and worst results with respect to the Hausdorff distance.

12 Vitaly Surazhsky, Craig Gotsman
Hausdorff distance Score
60.00 65.00 70.00 75.00 80.00 85.00 90.00 95.00
3DS Max
Geomagic Studio
Rapid Form 2004
Rational Reducer
Maya
Qslim
VizUp
Direct3D
Memoryless
AverageHigh ResMed ResLow Res
Hausdorff 3DS Max Geomagic RapidForm RReducer Maya Qslim VizUp Direct3D MemorylessCanyon 8% 88.00 97.31 45.21 78.45 68.43 100.00 85.77 91.64 80.70Canyon 3% 78.44 68.12 100.00 76.11 61.81 70.69 79.57 85.56 82.46Canyon 1% 71.06 90.58 100.00 92.66 68.78 98.91 55.63 99.11 98.96
Cow 20% 65.70 83.19 91.94 65.47 82.18 65.79 79.63 100.00 32.79Cow 10% 89.33 100.00 77.44 74.13 66.39 62.67 80.27 69.39 76.42Cow 5% 100.00 84.58 65.26 72.72 87.97 68.47 66.14 60.91 71.39
Helicopter 10% 100.00 85.03 73.22 80.23 88.39 69.02 62.22 71.77 61.85Helicopter 6% 100.00 63.57 85.50 84.11 88.70 71.69 70.03 59.89 62.57Helicopter 3% 100.00 72.14 74.21 89.21 95.97 74.24 72.79 71.60 74.36
Shark 12% 71.11 95.24 100.00 76.67 58.20 77.75 69.56 87.58 61.59Shark 7% 89.94 88.10 100.00 63.90 73.04 82.09 60.49 74.00 61.29Shark 4% 94.85 78.15 100.00 65.31 76.95 80.66 55.70 27.42 57.00
Mustang 40% 86.34 89.68 90.04 70.77 66.48 72.94 75.63 100.00 84.65Mustang 20% 71.96 82.13 71.26 73.64 74.15 83.77 73.60 100.00 67.19Mustang 10% 100.00 85.82 71.58 91.42 71.56 71.54 85.25 85.37 87.70Fandisk 10% 91.98 97.83 89.36 91.18 82.05 73.43 82.72 75.24 100.00Fandisk 5% 92.99 98.86 86.53 83.29 88.68 71.61 81.74 76.24 100.00Fandisk 2% 86.60 94.17 95.88 74.17 89.89 68.88 71.82 82.02 100.00
Torus 6% 63.54 86.30 100.00 69.06 85.65 98.91 62.81 66.10 86.49Torus 3% 51.04 100.00 92.75 62.51 88.96 97.67 61.53 63.44 91.38Torus 1% 73.89 80.13 100.00 72.86 66.92 83.20 72.01 61.65 88.71
Average 84.13 86.71 86.20 76.57 77.67 78.28 71.66 76.62 77.50High Res 80.95 90.65 84.25 75.98 75.91 79.69 74.05 84.62 72.58Med Res 81.96 85.83 87.64 73.96 77.39 77.17 72.46 75.50 77.33Low Res 89.49 83.65 86.70 79.76 79.72 77.98 68.48 69.73 82.59
3DS Max Geomagic RapidForm RReducer Maya Qslim VizUp Action3D Memoryless
Fig. 8: Summary of the scores based on the Hausdorff distances. The top bar chart shows the overall (average) scores of the testedsoftware packages. The table provides the scores of the software packages for all the models as well as the overall scores. The greencells in the table indicate that the software demonstrated a very good result (score < 85) on a specific model and resolution.

A Qualitative Comparison of Some Mesh Simplification Software Packages 13
Average distance Score
60.00 65.00 70.00 75.00 80.00 85.00 90.00 95.00 100.00
3DS Max
Geomagic Studio
Rapid Form 2004
Rational Reducer
Maya
Qslim
VizUp
Direct3D
Memoryless
AverageHigh ResMed ResLow Res
Average 3DS Max Geomagic RapidForm RReducer Maya Qslim VizUp Direct3D MemorylessCanyon 8% 70.44 79.57 85.62 58.68 81.58 83.37 77.88 79.17 100.00Canyon 3% 72.01 79.46 84.48 60.23 78.08 79.76 79.01 80.57 100.00Canyon 1% 73.38 80.24 83.02 63.10 74.49 76.93 78.90 84.16 100.00
Cow 20% 67.62 77.71 85.44 58.58 83.93 88.12 81.28 78.33 100.00Cow 10% 67.83 80.45 84.98 59.93 82.20 85.81 78.69 75.29 100.00Cow 5% 70.72 78.36 83.35 60.01 84.95 85.78 75.23 74.35 100.00
Helicopter 10% 75.08 71.02 72.48 72.16 91.31 92.53 80.05 76.66 100.00Helicopter 6% 75.03 70.63 77.20 71.14 90.62 91.70 74.51 75.26 100.00Helicopter 3% 81.34 68.68 80.93 74.11 100.00 92.83 71.07 75.09 91.12
Shark 12% 77.81 84.36 87.07 74.86 65.97 91.93 82.79 78.35 100.00Shark 7% 69.67 77.85 83.28 65.42 82.49 87.10 73.55 68.81 100.00Shark 4% 71.59 76.82 83.71 67.80 80.27 83.22 71.47 64.62 100.00
Mustang 40% 73.73 72.63 86.43 70.76 70.68 93.76 90.24 84.31 100.00Mustang 20% 71.88 70.83 81.72 70.11 79.43 89.16 88.11 76.65 100.00Mustang 10% 69.37 69.90 76.55 72.06 76.64 80.73 98.24 82.79 100.00Fandisk 10% 79.57 87.74 87.39 71.00 79.39 65.57 89.65 74.50 100.00Fandisk 5% 77.34 87.18 83.91 66.58 82.28 72.19 78.68 75.27 100.00Fandisk 2% 77.21 88.81 86.70 65.82 86.27 82.49 76.83 77.74 100.00
Torus 6% 67.42 85.12 84.07 64.42 83.24 87.76 70.20 69.46 100.00Torus 3% 68.15 83.26 84.21 65.05 82.44 86.31 70.11 70.75 100.00Torus 1% 69.62 80.92 82.22 64.94 82.51 84.13 70.82 70.79 100.00
Average 72.70 78.65 83.08 66.51 81.85 84.82 78.92 75.85 99.58High Res 73.09 79.74 84.07 67.21 79.44 86.15 81.73 77.26 100.00Med Res 71.70 78.52 82.83 65.49 82.51 84.57 77.52 74.66 100.00Low Res 73.32 77.68 82.35 66.83 83.59 83.73 77.51 75.65 98.73
3DS Max Geomagic RapidForm RReducer Maya Qslim VizUp Action3D Memoryless
Fig. 9: Summary of the scores based on the average distances. The top bar chart shows the overall (average) scores of the testedsoftware packages. The table provides the scores of the software packages for all the models as well as the overall scores. The greencells in the table indicate that the software demonstrated a very good result (score < 78) on a specific model and resolution.


![Efficient Compression and Rendering of Multi-Reolution …gotsman/AmendedPubl/Vis2002/Karni...The spectral compression method of Karni and Gotsman [19] compresses the mesh geometry](https://static.fdocuments.us/doc/165x107/60bbabfdedde3f429f68b79a/efficient-compression-and-rendering-of-multi-reolution-gotsmanamendedpublvis2002karni.jpg)


