CRA - LoopNet...cra site plan │mill creek town center shops '1' medical/ office (private) 14 acre...
12
SHOPS '1' MEDICAL/ OFFICE (Private) SHOPS '2' REMY NATURE PARK SR503 SR503 SW 12th Ave. SW 13th Ave. SW 16th STREET SW 13th Ave. SW 12th Ave. SW 15th Ave. '3' PAD '2' SHOPS '1a' SHOPS '1b' SHOPS '4' PAD '6' SHOPS/REST. '5' MAJOR '9' MAJOR '10' CLUB HOUSE BATTLEGROUND, PIZZA TRAIL HEAD SCOTTON WAY RETAIL OPPORTUNITIES AVAILABLE IN BATTLE GROUND, WASHINGTON Call for details Rates SR-503: 20,170 ADT (15) Traffic Count SR-503 / SW 10th & SW Scotton Way in Battle Ground, WA Location The information herein has been obtained from sources we deem reliable. We do not, however, guarantee its accuracy. All information should be verified prior to purchase/leasing. View the Real Estate Agency Pamphlet by visiting our website, www.cra-nw.com/real-estate-agency-pamphlet/. CRA PRINTS WITH 30% POST-CONSUMER, RECYCLED-CONTENT MATERIAL Comments • Battle Ground’s newest development, located at the newly signalized intersection of SR-503 and Scotton Way • Anchored by a new Walmart Mill Creek Town Center DEVELOPED BY: N C RA Shops 1 & 2 • Call for details Available Space Phase 2 • Anchor & pads Jeff Olson Commercial Realty Advisors NW LLC [email protected] 503.274.0211 Matt Martinez HSM Washington [email protected] 541.840.2807 733 SW Second Avenue, Suite 200 Portland, Oregon 97204 www.cra-nw.com Licensed brokers in Oregon & Washington
Transcript of CRA - LoopNet...cra site plan │mill creek town center shops '1' medical/ office (private) 14 acre...

SHOPS '1'
MEDICAL/OFFICE
(Priv
ate)
14 ACREWETLANDPRESERVE
SHOPS '2'
REMY NATUREPARK
SR50
3SR
503
SW 1
2th
Ave
.
SW 1
3th
Ave
.
SW 16th STREET
SW 1
3th
Ave
.
SW 1
2th
Ave
.
SW 1
5th
Ave
.
'3'
PAD'2'
SHOPS'1a'
SHOPS'1b'
SHOPS'4'
PAD '6'
SHOPS/REST.'5'
MAJOR '9' MAJOR '10'
CLUBHOUSE
BATTLEGROUND,WASHINGTON
PIZZA
TRAIL HEAD
SCOTTON WAY
RETAIL OPPORTUNITIES AVAILABLE IN BATTLE GROUND, WASHINGTON
Call for detailsRates
SR-503: 20,170 ADT (15)
Traffic Count
SR-503 / SW 10th & SW Scotton Way in Battle Ground, WA
Location
The information herein has been obtained from sources we deem reliable. We do not, however, guarantee its accuracy. All information should be verified prior to purchase/leasing. View the Real Estate Agency Pamphlet by visiting our website, www.cra-nw.com/real-estate-agency-pamphlet/. CRA PRINTS WITH 30% POST-CONSUMER, RECYCLED-CONTENT MATERIAL
Comments• Battle Ground’s newest
development, located at the newly signalized intersection of SR-503
and Scotton Way
• Anchored by a new Walmart
Mill Creek Town Center
DevelopeD by:
N
CRA
Shops 1 & 2 • Call for details
Available Space
Phase 2 • Anchor & pads
Jeff Olson Commercial Realty Advisors NW LLC
[email protected] .274 .0211
Matt MartinezHSM Washington
733 SW Second Avenue, Suite 200 Portland, Oregon 97204
www.cra-nw.comLicensed brokers in Oregon & Washington

BATTLE GROUNDHIGH SCHOOL
2,151 STUDENTS
PostOffice
City Hall
LIBRARY
CHIEF UMTUCH MIDDLE SCHOOL
CAPTAIN STRONG PRIMARY SCHOOL
MAPLE GROVE MIDDLE & ELEMENTARY SCHOOLSBATTLE GROUND
FITNESS
KEO THAI CUISINEBG TROPHY &
SPORTING GOODS
CINEMA
LULU’S BOUTIQUE
LLOYD’S GRILL
n
BATTLE GROUND, WASHINGTON
CRA
EXTENSION OF SCOTTON WAY
PENDING
SCOTTON LANDINGPHASE 2
20,1
59 A
DT (1
2)20
,299
ADT
(12)
5,00
0 A
DT (0
9)
7,300 ADT (09) 7,316 ADT (12) 12,290 ADT (12)10,383 ADT (12)
SITE

CRA
SITE PLAN │MILL CREEK TOWN CENTER
SHOPS '1'
MEDICAL/OFFICE
(Priv
ate)
14 ACREWETLANDPRESERVE
SHOPS '2'
REMY NATUREPARK
SR50
3SR
503
SW 1
2th
Ave
.
SW 1
3th
Ave
.
SW 16th STREET
SW 1
3th
Ave
.
SW 1
2th
Ave
.
SW 1
5th
Ave
.
'3'
PAD'2'
SHOPS'1a'
SHOPS'1b'
SHOPS'4'
PAD '6'
SHOPS/REST.'5'
MAJOR '9' MAJOR '10'
CLUBHOUSE
BATTLEGROUND,WASHINGTON
PIZZA
TRAIL HEAD
SCOTTON WAY

LEASE PENDING
CRA
SITE PLAN │MILL CREEK TOWN CENTER
n
LEASE PENDING
CRA
SITE PLAN │MILL CREEK TOWN CENTER

CHARMING NAILS
CRAn
CRA
SITE PLAN │SHOPS 1
LEASE PENDING LEASE PENDING
CRA
SITE PLAN │SCOTTON LANDING - PHASE 2

SITE PLAN | LOCATIONMILL CREEK TOWN CENTER| ELEVATIONS
STANGEBENNER
SUITE B-130
A R C H I T E C T S , INC.
LAKE OSWEGO, OR 97035
5200 S.W. MEADOWS RD.
FAX (503) 670-0235
ASSOCIATES
(503) 670-0234
F:\2011 BSA Projects\11-128 Millcreek Town Center - Battle Ground\Renderings\_Color Elevations\11128_color elev(DR).dwg
Battleground, Washington
December 16, 2015
SCALE: 1/8" = 1'-0"N O R T H E L E V A T I O N
SCALE: 1/8" = 1'-0"E A S T E L E V A T I O N
SCALE: 1/8" = 1'-0"S O U T H E L E V A T I O N
SCALE: 1/8" = 1'-0"W E S T E L E V A T I O N
CRA

BATTLE GROUND, WASHINGTON
CRA

COMMERCIAL REALTY ADVISORSNORTHWEST LLC
CRA
Demographic Source: Applied Geographic Solutions 04/2016, TIGER Geography page 1 of 3©2016, Sites USA, Chandler, Arizona, 480-491-1112
Thi
s re
port
was
pro
duce
d us
ing
data
from
priv
ate
and
gove
rnm
ent s
ourc
es d
eem
ed to
be
relia
ble.
The
info
rmat
ion
here
in is
pro
vide
d w
ithou
t rep
rese
ntat
ion
or w
arra
nty.
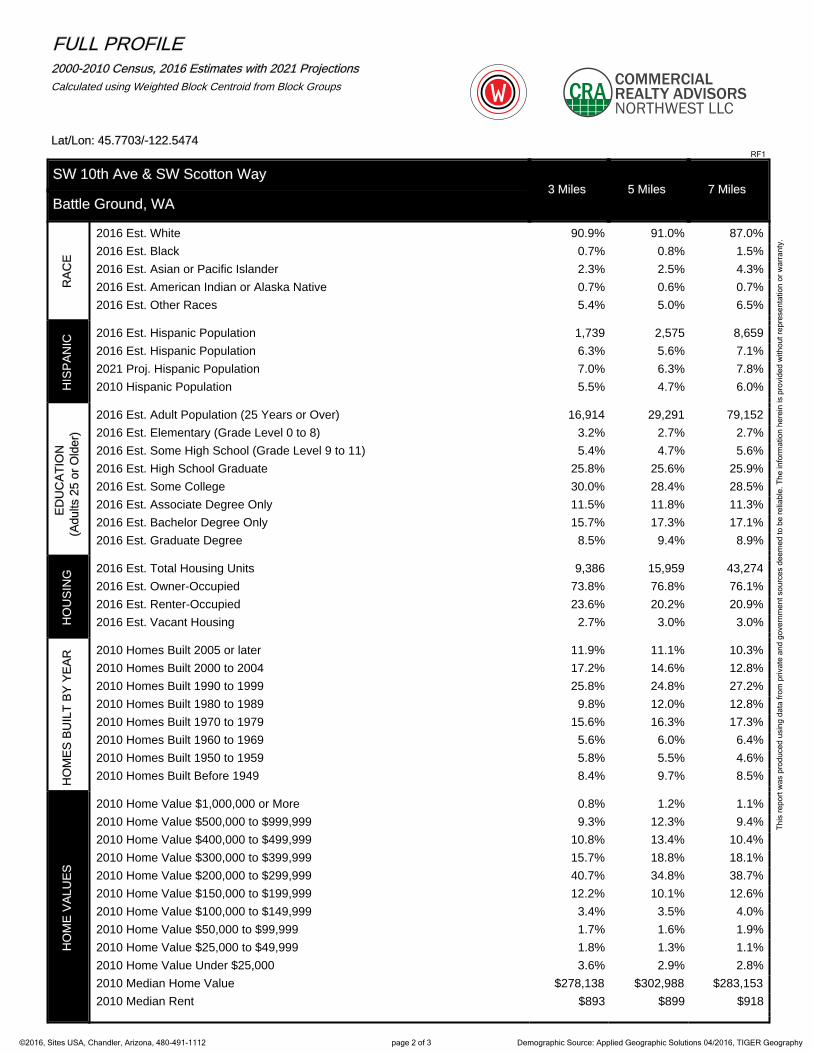
FULL PROFILE2000-2010 Census, 2016 Estimates with 2021 ProjectionsCalculated using Weighted Block Centroid from Block Groups
Lat/Lon: 45.7703/-122.5474RF1
SW 10th Ave & SW Scotton Way3 Miles 5 Miles 7 Miles
Battle Ground, WA
PO
PU
LATI
ON
2016 Estimated Population 27,525 45,644 122,7772021 Projected Population 29,332 48,737 130,9462010 Census Population 25,916 43,074 116,1962000 Census Population 17,181 31,530 88,993Projected Annual Growth 2016 to 2021 1.3% 1.4% 1.3%Historical Annual Growth 2000 to 2016 3.8% 2.8% 2.4%
HO
US
EH
OLD
S
2016 Estimated Households 9,135 15,472 41,9962021 Projected Households 9,810 16,648 45,1492010 Census Households 8,451 14,384 39,1682000 Census Households 5,689 10,466 30,017Projected Annual Growth 2016 to 2021 1.5% 1.5% 1.5%Historical Annual Growth 2000 to 2016 3.8% 3.0% 2.5%
AG
E
2016 Est. Population Under 10 Years 15.4% 13.9% 13.7%2016 Est. Population 10 to 19 Years 16.9% 16.2% 16.0%2016 Est. Population 20 to 29 Years 11.5% 10.6% 11.2%2016 Est. Population 30 to 44 Years 20.0% 18.6% 19.8%2016 Est. Population 45 to 59 Years 18.1% 20.3% 20.3%2016 Est. Population 60 to 74 Years 13.4% 15.4% 14.6%2016 Est. Population 75 Years or Over 4.6% 5.0% 4.4%2016 Est. Median Age 34.6 37.7 36.8
MA
RIT
AL
STA
TUS
&
GE
ND
ER
2016 Est. Male Population 49.6% 49.8% 50.0%2016 Est. Female Population 50.4% 50.2% 50.0%
2016 Est. Never Married 23.9% 23.3% 25.8%2016 Est. Now Married 60.3% 60.5% 56.9%2016 Est. Separated or Divorced 11.7% 11.7% 13.4%2016 Est. Widowed 4.1% 4.5% 3.9%
INC
OM
E
2016 Est. HH Income $200,000 or More 5.9% 6.8% 5.6%2016 Est. HH Income $150,000 to $199,999 5.0% 6.4% 6.4%2016 Est. HH Income $100,000 to $149,999 15.7% 17.9% 18.2%2016 Est. HH Income $75,000 to $99,999 14.2% 14.0% 16.2%2016 Est. HH Income $50,000 to $74,999 22.3% 21.0% 20.8%2016 Est. HH Income $35,000 to $49,999 13.6% 12.5% 12.9%2016 Est. HH Income $25,000 to $34,999 7.6% 7.5% 7.1%2016 Est. HH Income $15,000 to $24,999 8.2% 7.0% 6.7%2016 Est. HH Income Under $15,000 7.6% 7.0% 6.0%2016 Est. Average Household Income $80,897 $86,325 $84,3482016 Est. Median Household Income $65,612 $71,419 $72,6412016 Est. Per Capita Income $26,914 $29,330 $28,925
2016 Est. Total Businesses 950 1,488 4,2782016 Est. Total Employees 6,862 10,417 32,117
COMMERCIAL REALTY ADVISORSNORTHWEST LLC
CRA
Demographic Source: Applied Geographic Solutions 04/2016, TIGER Geography page 2 of 3©2016, Sites USA, Chandler, Arizona, 480-491-1112
Thi
s re
port
was
pro
duce
d us
ing
data
from
priv
ate
and
gove
rnm
ent s
ourc
es d
eem
ed to
be
relia
ble.
The
info
rmat
ion
here
in is
pro
vide
d w
ithou
t rep
rese
ntat
ion
or w
arra
nty.
FULL PROFILE2000-2010 Census, 2016 Estimates with 2021 ProjectionsCalculated using Weighted Block Centroid from Block Groups
Lat/Lon: 45.7703/-122.5474RF1
SW 10th Ave & SW Scotton Way3 Miles 5 Miles 7 Miles
Battle Ground, WA
RA
CE
2016 Est. White 90.9% 91.0% 87.0%2016 Est. Black 0.7% 0.8% 1.5%2016 Est. Asian or Pacific Islander 2.3% 2.5% 4.3%2016 Est. American Indian or Alaska Native 0.7% 0.6% 0.7%2016 Est. Other Races 5.4% 5.0% 6.5%
HIS
PA
NIC
2016 Est. Hispanic Population 1,739 2,575 8,6592016 Est. Hispanic Population 6.3% 5.6% 7.1%2021 Proj. Hispanic Population 7.0% 6.3% 7.8%2010 Hispanic Population 5.5% 4.7% 6.0%
ED
UC
ATI
ON
(Adu
lts 2
5 or
Old
er)
2016 Est. Adult Population (25 Years or Over) 16,914 29,291 79,1522016 Est. Elementary (Grade Level 0 to 8) 3.2% 2.7% 2.7%2016 Est. Some High School (Grade Level 9 to 11) 5.4% 4.7% 5.6%2016 Est. High School Graduate 25.8% 25.6% 25.9%2016 Est. Some College 30.0% 28.4% 28.5%2016 Est. Associate Degree Only 11.5% 11.8% 11.3%2016 Est. Bachelor Degree Only 15.7% 17.3% 17.1%2016 Est. Graduate Degree 8.5% 9.4% 8.9%
HO
US
ING 2016 Est. Total Housing Units 9,386 15,959 43,274
2016 Est. Owner-Occupied 73.8% 76.8% 76.1%2016 Est. Renter-Occupied 23.6% 20.2% 20.9%2016 Est. Vacant Housing 2.7% 3.0% 3.0%
HO
ME
S B
UIL
T B
Y Y
EA
R 2010 Homes Built 2005 or later 11.9% 11.1% 10.3%2010 Homes Built 2000 to 2004 17.2% 14.6% 12.8%2010 Homes Built 1990 to 1999 25.8% 24.8% 27.2%2010 Homes Built 1980 to 1989 9.8% 12.0% 12.8%2010 Homes Built 1970 to 1979 15.6% 16.3% 17.3%2010 Homes Built 1960 to 1969 5.6% 6.0% 6.4%2010 Homes Built 1950 to 1959 5.8% 5.5% 4.6%2010 Homes Built Before 1949 8.4% 9.7% 8.5%
HO
ME
VA
LUE
S
2010 Home Value $1,000,000 or More 0.8% 1.2% 1.1%2010 Home Value $500,000 to $999,999 9.3% 12.3% 9.4%2010 Home Value $400,000 to $499,999 10.8% 13.4% 10.4%2010 Home Value $300,000 to $399,999 15.7% 18.8% 18.1%2010 Home Value $200,000 to $299,999 40.7% 34.8% 38.7%2010 Home Value $150,000 to $199,999 12.2% 10.1% 12.6%2010 Home Value $100,000 to $149,999 3.4% 3.5% 4.0%2010 Home Value $50,000 to $99,999 1.7% 1.6% 1.9%2010 Home Value $25,000 to $49,999 1.8% 1.3% 1.1%2010 Home Value Under $25,000 3.6% 2.9% 2.8%2010 Median Home Value $278,138 $302,988 $283,1532010 Median Rent $893 $899 $918

COMMERCIAL REALTY ADVISORSNORTHWEST LLC
CRA
Demographic Source: Applied Geographic Solutions 04/2016, TIGER Geography page 3 of 3©2016, Sites USA, Chandler, Arizona, 480-491-1112
Thi
s re
port
was
pro
duce
d us
ing
data
from
priv
ate
and
gove
rnm
ent s
ourc
es d
eem
ed to
be
relia
ble.
The
info
rmat
ion
here
in is
pro
vide
d w
ithou
t rep
rese
ntat
ion
or w
arra
nty.
FULL PROFILE2000-2010 Census, 2016 Estimates with 2021 ProjectionsCalculated using Weighted Block Centroid from Block Groups
Lat/Lon: 45.7703/-122.5474RF1
SW 10th Ave & SW Scotton Way3 Miles 5 Miles 7 Miles
Battle Ground, WA
LAB
OR
FO
RC
E
2016 Est. Labor Population Age 16 Years or Over 20,377 34,735 93,7012016 Est. Civilian Employed 58.4% 58.0% 60.6%2016 Est. Civilian Unemployed 3.0% 2.7% 3.3%2016 Est. in Armed Forces 0.1% 0.1% 0.1%2016 Est. not in Labor Force 38.5% 39.2% 35.9%2016 Labor Force Males 48.7% 49.3% 49.5%2016 Labor Force Females 51.3% 50.7% 50.5%
OC
CU
PA
TIO
N
2010 Occupation: Population Age 16 Years or Over 11,199 18,459 51,2652010 Mgmt, Business, & Financial Operations 15.2% 16.4% 15.3%2010 Professional, Related 17.9% 19.7% 19.8%2010 Service 16.8% 15.6% 16.2%2010 Sales, Office 24.7% 23.5% 24.0%2010 Farming, Fishing, Forestry 0.7% 0.6% 0.4%2010 Construction, Extraction, Maintenance 11.8% 11.3% 9.8%2010 Production, Transport, Material Moving 12.9% 13.0% 14.6%2010 White Collar Workers 57.8% 59.6% 59.1%2010 Blue Collar Workers 42.2% 40.4% 40.9%
TRA
NS
PO
RTA
TIO
NTO
WO
RK
2010 Drive to Work Alone 79.2% 78.0% 78.4%2010 Drive to Work in Carpool 9.9% 9.8% 10.3%2010 Travel to Work by Public Transportation 1.3% 1.4% 2.0%2010 Drive to Work on Motorcycle 0.1% 0.2% 0.2%2010 Walk or Bicycle to Work 2.2% 2.2% 1.7%2010 Other Means 1.2% 1.4% 1.1%2010 Work at Home 6.1% 7.1% 6.2%
TRA
VE
L TI
ME 2010 Travel to Work in 14 Minutes or Less 19.1% 19.5% 20.5%
2010 Travel to Work in 15 to 29 Minutes 32.3% 35.1% 40.5%2010 Travel to Work in 30 to 59 Minutes 42.3% 39.0% 33.0%2010 Travel to Work in 60 Minutes or More 6.3% 6.4% 6.1%2010 Average Travel Time to Work 27.6 26.5 24.3
CO
NS
UM
ER
EX
PE
ND
ITU
RE
2016 Est. Total Household Expenditure $555 M $987 M $2.64 B2016 Est. Apparel $19.5 M $34.6 M $92.4 M2016 Est. Contributions, Gifts $37.7 M $68.6 M $181 M2016 Est. Education, Reading $21.5 M $39.1 M $104 M2016 Est. Entertainment $31.3 M $55.7 M $149 M2016 Est. Food, Beverages, Tobacco $85.0 M $150 M $401 M2016 Est. Furnishings, Equipment $19.2 M $34.3 M $92.0 M2016 Est. Health Care, Insurance $48.0 M $84.8 M $227 M2016 Est. Household Operations, Shelter, Utilities $172 M $305 M $814 M2016 Est. Miscellaneous Expenses $8.10 M $14.3 M $38.3 M2016 Est. Personal Care $7.20 M $12.8 M $34.2 M2016 Est. Transportation $106 M $188 M $504 M