CPT-Pro - Powerful CPT graphing and interpretation software · 2020-01-09 · Geosoft sp. z o.o....
10
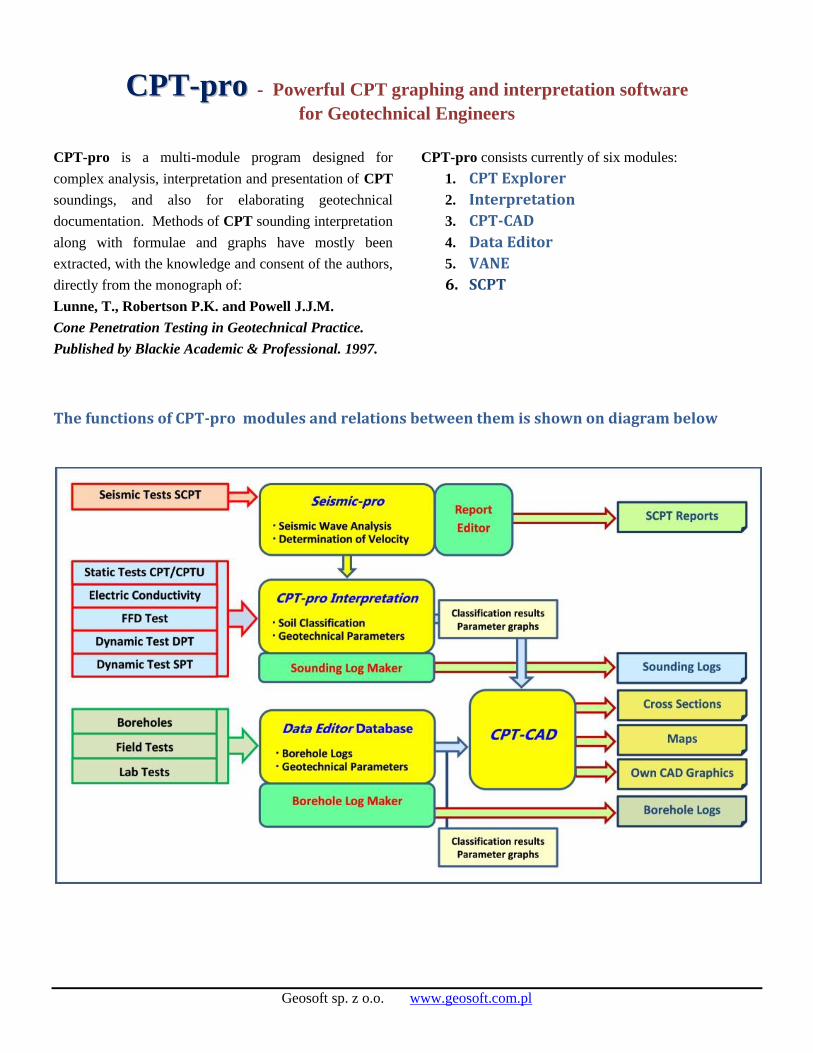
Geosoft sp. z o.o. www.geosoft.com.pl CPT-pro - Powerful CPT graphing and interpretation software for Geotechnical Engineers CPT-pro is a multi-module program designed for complex analysis, interpretation and presentation of CPT soundings, and also for elaborating geotechnical documentation. Methods of CPT sounding interpretation along with formulae and graphs have mostly been extracted, with the knowledge and consent of the authors, directly from the monograph of: Lunne, T., Robertson P.K. and Powell J.J.M. Cone Penetration Testing in Geotechnical Practice. Published by Blackie Academic & Professional. 1997. CPT-pro consists currently of six modules: 1. CPT Explorer 2. Interpretation 3. CPT-CAD 4. Data Editor 5. VANE 6. SCPT The functions of CPT-pro modules and relations between them is shown on diagram below
Transcript of CPT-Pro - Powerful CPT graphing and interpretation software · 2020-01-09 · Geosoft sp. z o.o....
Geosoft sp. z o.o. www.geosoft.com.pl
CCPPTT--pprroo - Powerful CPT graphing and interpretation software
for Geotechnical Engineers
CPT-pro is a multi-module program designed for
complex analysis, interpretation and presentation of CPT
soundings, and also for elaborating geotechnical
documentation. Methods of CPT sounding interpretation
along with formulae and graphs have mostly been
extracted, with the knowledge and consent of the authors,
directly from the monograph of:
Lunne, T., Robertson P.K. and Powell J.J.M.
Cone Penetration Testing in Geotechnical Practice.
Published by Blackie Academic & Professional. 1997.
CPT-pro consists currently of six modules:
1. CPT Explorer
2. Interpretation
3. CPT-CAD
4. Data Editor
5. VANE
6. SCPT
The functions of CPT-pro modules and relations between them is shown on diagram below

Geosoft sp. z o.o. www.geosoft.com.pl
CPT Explorer module is designed for managing, converting and selecting CPT data, containing:
◼ Browser with directory tree
◼ Map Project structure (tools and tree)
◼ Thumbnails with charts of selected parameter
◼ Header info with full edition
◼ Generation of map with CPT tests locations
◼ Preview selected data file
◼ Edition of header info (test no, co-ordinates etc.)
◼ Procedure of entry of Dynamic Penetration Test data
◼ Conversion of CPT data file to format *.CPD
◼ Reporting tool with basic statistics
Geosoft sp. z o.o. www.geosoft.com.pl
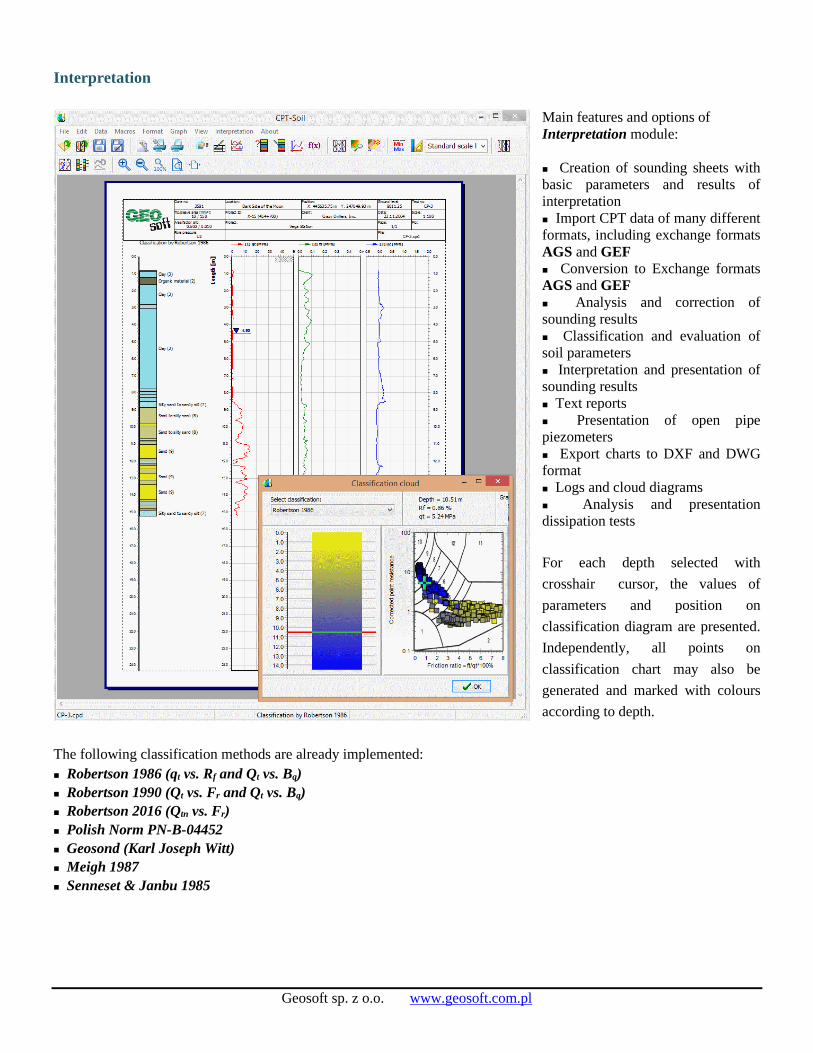
Interpretation
Main features and options of
Interpretation module:
◼ Creation of sounding sheets with
basic parameters and results of
interpretation
◼ Import CPT data of many different
formats, including exchange formats
AGS and GEF
◼ Conversion to Exchange formats
AGS and GEF
◼ Analysis and correction of
sounding results
◼ Classification and evaluation of
soil parameters
◼ Interpretation and presentation of
sounding results
◼ Text reports
◼ Presentation of open pipe
piezometers
◼ Export charts to DXF and DWG
format
◼ Logs and cloud diagrams
◼ Analysis and presentation
dissipation tests
For each depth selected with
crosshair cursor, the values of
parameters and position on
classification diagram are presented.
Independently, all points on
classification chart may also be
generated and marked with colours
according to depth.
The following classification methods are already implemented:
◼ Robertson 1986 (qt vs. Rf and Qt vs. Bq)
◼ Robertson 1990 (Qt vs. Fr and Qt vs. Bq)
◼ Robertson 2016 (Qtn vs. Fr)
◼ Polish Norm PN-B-04452
◼ Geosond (Karl Joseph Witt)
◼ Meigh 1987
◼ Senneset & Janbu 1985

Geosoft sp. z o.o. www.geosoft.com.pl
Formula Editor (optional in Interpretation module)
An add-on powerful Formula Editor allows user defined conditional interpretation functions. Conditions may concern:
- Range of depth or values of selected parameter,
- Soil type.
- Most of mathematical functions used in engineering practice are available.
Each formula can be saved with own name and used exactly in the same way as all evaluations implemented in
software.
The result of calculation can be saved on User
selected channel with own name, shortcut and basic
properties, like color of graph, thickness and style of
line, grid step and horizontal scale (minimum and
maximum).
The Unit Group as well as Unit can be freely
selected.

Geosoft sp. z o.o. www.geosoft.com.pl
Evaluations implemented in Interpretation module.
Each implemented method
comes from widely known
monographs and papers.
Some of them are based on
CPT parameters only,
however, there are some of
them which are based also
on external parameters like
Cone Factor Nk, Liquid
Limit WL, Poisson’s Ratio
etc. These ones may be
defined for each soil type
separately or may be a
function of depth
The description of each
formula with source,
formula and – if exists –
graph/diagram is attached
and available by clicking
[Method info] button.
Different unit systems.
All parameters, native and
all results of interpretation,
can be presented and
exported in reports in freely
chosen unit system.

Geosoft sp. z o.o. www.geosoft.com.pl
Batch processing
Batch processing settings window. This option
allows batch interpretation and reduction of as
many CPT files as necessary. Additionally,
completion of all descriptions (Location,
project name etc.) is available at the same
operation
Own interpretation formulas are available like
evaluations implemented in application.
Dual log
Dual log option allows to compare two
different tests (soil sticks and graphs of
parameters), for instance - before and after
compaction. Graphs of selected parameter can
be generated in separate graphic fields (each
for different test as on the left) or in the same
one (see next page).
Dual log with two graphs of parameters of
different test in the same graphic field.

Geosoft sp. z o.o. www.geosoft.com.pl
Data Editor for creating database containing information on User’s borehole logs and geotechnical parameters which have structure
[Value vs. Depth]. All results are saved in local database, however, due to structure of Data Editor, database file can be
shared in local network. Project structure included in Data Editor enables grouping of data sets, so data managing is
very easy and effective.
Each log and parameter value should include co-ordinates X, Y and Z, so it can be automatically presented on map
generated with Map module (as relevant symbol with description) and on geotechnical cross section, generated with
Cross Section module (borehole log as a soil stick with symbol/color filling and parameter as a graph).
All descriptions (soil type, consistency, moisture content etc.) are selected from User defined lists (see example on
left), so adding new borehole logs to database is very easy and efficient. Each soil layer can be saved in database with
own graphic symbol and representing color, which are used on cross sections as a filings of soil sticks. Water level
values (initial and stabilized) are saved in database and can be presented on section.
Graphs of parameters can be automatically included to geotechnical cross sections generated with Cross Section
module.
All geotechnical parameters which have a structure [Value vs. Depth] can be saved in the same database as a
relevant values connected to investigation hole. Soil type description of such hole is not required, so parameters can
exist only as a “values on certain depths”.

Geosoft sp. z o.o. www.geosoft.com.pl
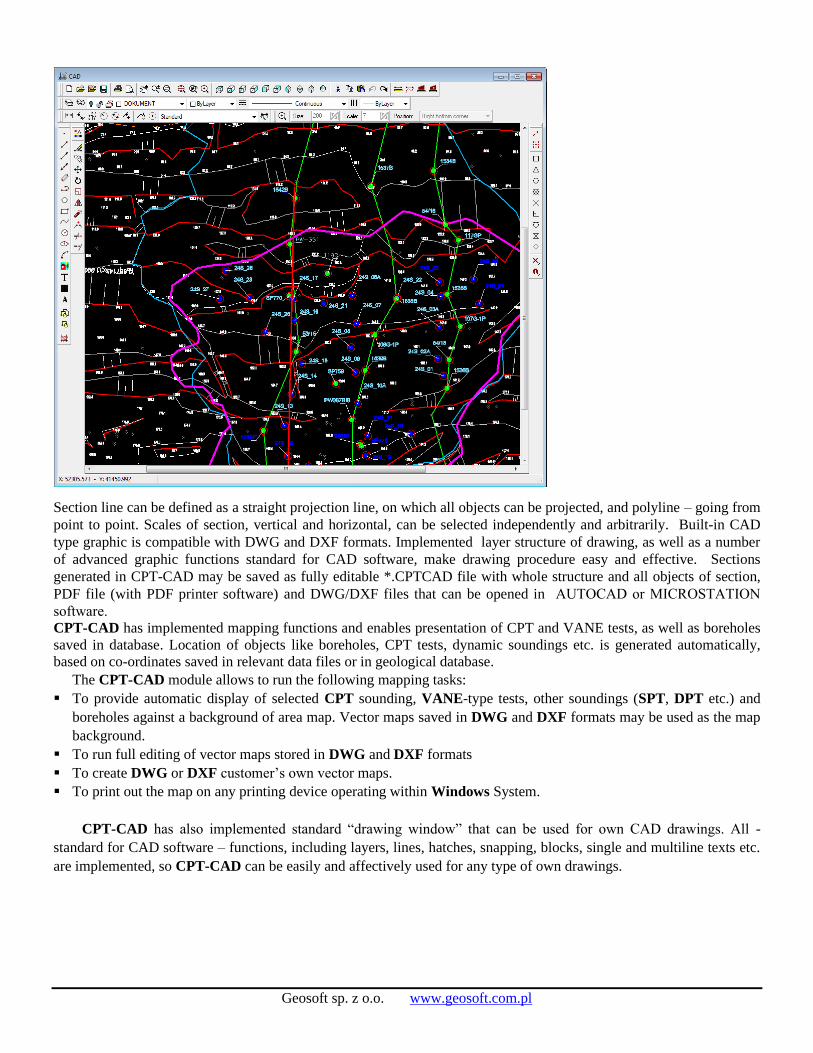
CPT-CAD for creation of geotechnical cross sections and maps. Sections may have different vertical and horizontal
scale, and contain:
▪ Charts/diagrams of CPT parameters
▪ Interpretation results of soil classification shown on section as soil sticks filled with geological patterns or colors
▪ Borehole logs from external sources (see Data Editor module)
▪ Interpretation results of values of selected soil parameters in the form of charts of such parameters
▪ Graphic objects that represent geotechnical layers and structures
▪ Additional descriptions and comments
▪ Additional graphic objects generated with sophisticated CAD type graphics
Geosoft sp. z o.o. www.geosoft.com.pl
Section line can be defined as a straight projection line, on which all objects can be projected, and polyline – going from
point to point. Scales of section, vertical and horizontal, can be selected independently and arbitrarily. Built-in CAD
type graphic is compatible with DWG and DXF formats. Implemented layer structure of drawing, as well as a number
of advanced graphic functions standard for CAD software, make drawing procedure easy and effective. Sections
generated in CPT-CAD may be saved as fully editable *.CPTCAD file with whole structure and all objects of section,
PDF file (with PDF printer software) and DWG/DXF files that can be opened in AUTOCAD or MICROSTATION
software.
CPT-CAD has implemented mapping functions and enables presentation of CPT and VANE tests, as well as boreholes
saved in database. Location of objects like boreholes, CPT tests, dynamic soundings etc. is generated automatically,
based on co-ordinates saved in relevant data files or in geological database.
The CPT-CAD module allows to run the following mapping tasks:
▪ To provide automatic display of selected CPT sounding, VANE-type tests, other soundings (SPT, DPT etc.) and
boreholes against a background of area map. Vector maps saved in DWG and DXF formats may be used as the map
background.
▪ To run full editing of vector maps stored in DWG and DXF formats
▪ To create DWG or DXF customer’s own vector maps.
▪ To print out the map on any printing device operating within Windows System.
CPT-CAD has also implemented standard “drawing window” that can be used for own CAD drawings. All -
standard for CAD software – functions, including layers, lines, hatches, snapping, blocks, single and multiline texts etc.
are implemented, so CPT-CAD can be easily and affectively used for any type of own drawings.

Geosoft sp. z o.o. www.geosoft.com.pl
SCPT module For reduction, analysis and
interpretation and plotting logs
of SCPT measurements
concerning both S-Wave and
P-Wave. Implemented
advanced mathematical tools,
including customizable
filtering procedures make
analysis very efficient.
Advanced graphic interface
and unique procedure of
manual moving the selected
graphs against the former ones
make the process of
calculating the velocity very
easy and accurate. The values
of interpreted velocity can be
plotted vs. depth with graphic
tools implemented in SCPT
module or automatically
exported to Data Editor database to further analysis provided in that module.
Compatibility of Seismic and Interpretation modules allows to enter seismic wave velocity interpreted in Seismic
module to data structure of Interpretation and further common interpretation and presentation. Sounding log generated
in Interpretation module may include graphs of all parameters that refer to CPTU and SCPT soundings.
Log generated in
Interpretation module with
imported seismic wave
velocity channels for further
analysis.


![SEMI-EMPIRICAL METHOD OF INTERPRETATION OF CPT … · SEMI-EMPIRICAL METHOD OF INTERPRETATION OF CPT DATA ... Meyerhof [11], and Roberston and Campanella[12] criteria were employed](https://static.fdocuments.us/doc/165x107/5d3e340888c9938d248de7f0/semi-empirical-method-of-interpretation-of-cpt-semi-empirical-method-of-interpretation.jpg)