cpmpertmy (1)
38
NETWORK TECHNIQUES - CPM & PERT Presented by Richa-16173 Divya-16164
-
Upload
divya-khandelwal -
Category
Documents
-
view
37 -
download
0
Transcript of cpmpertmy (1)

NETWORK TECHNIQUES - CPM & PERT
Presented by Richa-16173 Divya-16164
Content
• Introduction• Steps involved in PERT & CPM• Network principles • Approaches for network diagram• Rules for construction of network diagram • Sample question- CPM & PERT • Summary

INTRODUCTION Project • A project is an interrelated set of activities that has a definite
starting and ending point and that results in a unique product or service.
Project management • Project management is a scientific way of planning, implementing,
monitoring & controlling the various aspects of a project such as time, money, materials, manpower & other resources.
• For proper planning, scheduling and control of activities of given project and their interrelationship we use network techniques
Technique for project management CPM- critical path method. PERT-program evaluation review technique.

CPM-CRITICAL PATH METHOD
HISTORY : • It was developed independently in 1956-57 by Du Pont company in US to
solve trade off cost of project and it over all completion time (scheduling problems).It was applied to construction of chemical plant
DEFINITION: Critical path is the sequence of activities between a project’s start and finishthat takes the longest time to complete.
Applied to projects that employ stable technology and relatively risk freeHence the orientation is “DETERMINISTIC “.

PERT-PROGRAM EVALUATION REVIEW TECHNIQUE
HISTORY• Originally develop to facilitate the planning and scheduling Polaris fleet
Ballistic Missile Project of US government • Used for risk and uncertain situation • Used for research and development program, aerospace project • Project involving new technologies • Projects with variable completion time Hence the orientation of PERT is PROBALISTIC

DIFFERENCE BETWEEN CPM & PERT
CPM PERT• CPM works with fixed deterministic time
• PERT works with probabilistic time
• CPM is useful for repetitive and non complex projects with a certain degree of time estimates.
• PERT is useful for non repetitive and complex projects with uncertain time estimates.
• CPM includes time-cost trade off. • PERT is restricted to time variable.
• CPM- for construction projects. • PERT- used for R&D programs.

STEP INVOLVED IN PERT & CPM
Steps involved are :
• Identify the specific activities.
• Determine proper sequence of the activities.
• Construct the network diagram.
• Estimate the time required for each activity.
• Determine the critical path , slack.
• Development of project schedule
• Calculate the variability of project duration and probability of completion in given time(Update the PERT chart.)
NETWORK PRINCIPLES
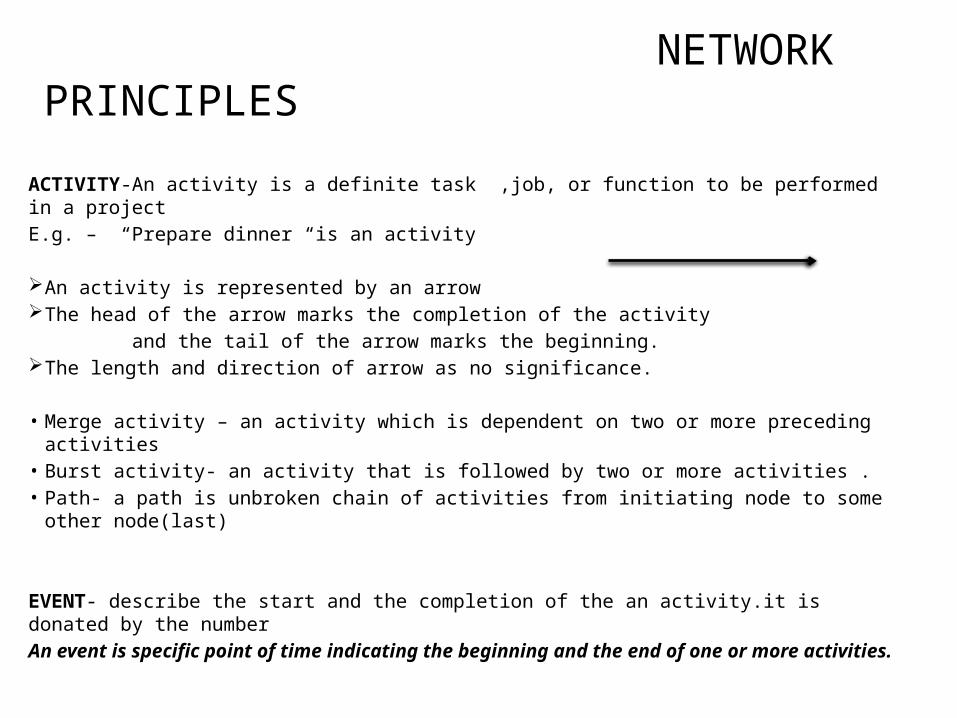
ACTIVITY-An activity is a definite task ,job, or function to be performed in a project E.g. – “Prepare dinner “is an activity
An activity is represented by an arrow The head of the arrow marks the completion of the activity and the tail of the arrow marks the beginning. The length and direction of arrow as no significance.
• Merge activity – an activity which is dependent on two or more preceding activities • Burst activity- an activity that is followed by two or more activities .• Path- a path is unbroken chain of activities from initiating node to some other node(last)
EVENT- describe the start and the completion of the an activity.it is donated by the numberAn event is specific point of time indicating the beginning and the end of one or more activities.

NETWORK PRINCIPLES
• There can be two format to define the network diagram Activity in the Box (AIB)/Activity on the node- Activity on arrow (A0A)
Activity in the box (AIB) Activity on arrow(AOA)
Get volunteer
7
Wash car3
Dry car4
Collect data
1 2 3
Wash car Dry car

APPRAOCHES FOR NETWORK DIAGRAM
ACTIVITY ON ARROW (AOA):• Uses arrow to represent activities and nodes to represent events.• It is Event Oriented.
1 876
54
3
2

• Uses nodes to represent activities indicate precedence relationships between them.
• It is Activity Oriented.
ACTIVITY ON NODE(AON):

RULES FOR NETWORK DIAGRAM
• Each activity have preceding and succeeding event.
• Before an activity can begin, it preceding activity must be completed.
• Each event should have distinct number in way that head of arrow is greater than the tail.
• Length and direction of the arrow has no significance.
• Flow is from left to right • Arrow should not intersect.• There should be no loop in the project
network • Not more than one activity can have same
preceding and succeeding events. Each activity is represented by unique numbered arrow
1
2
3 4Prepare dinner Take dinner
Receive guest
Send invitation
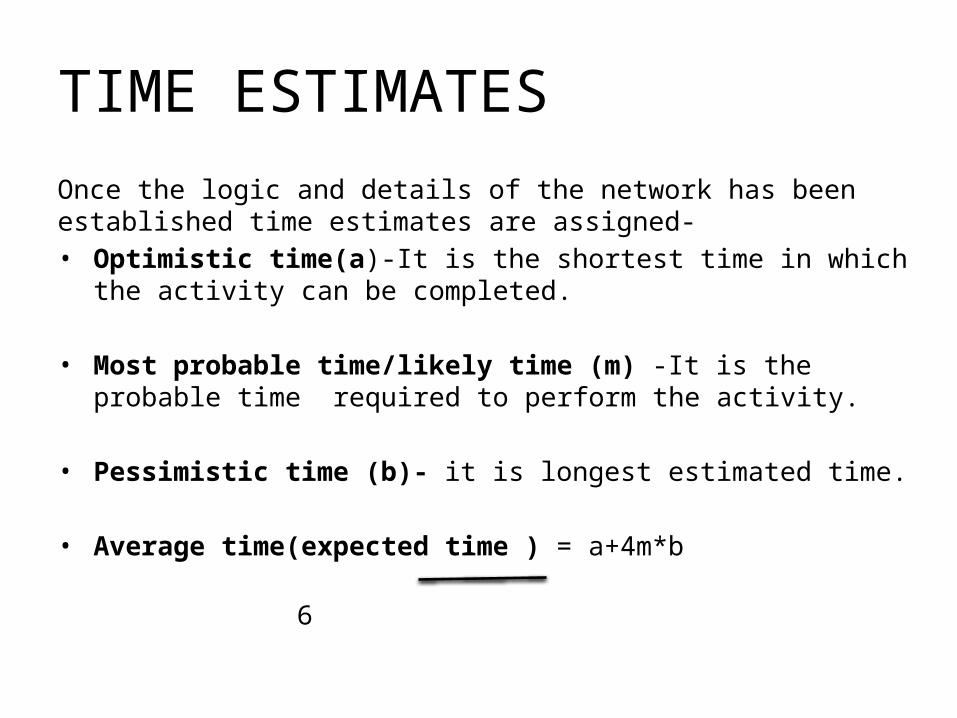
TIME ESTIMATES Once the logic and details of the network has been established time estimates are assigned-• Optimistic time(a)-It is the shortest time in which the activity can be
completed.
• Most probable time/likely time (m) -It is the probable time required to perform the activity.
• Pessimistic time (b)- it is longest estimated time.
• Average time(expected time ) = a+4m*b 6

CPM & PERT – sample Question

1- IDENTIFY THE ACTIVITIES2- ESTIMATE THE EXPECTED TIME by using = a+4m+b/6

Start
A B
C D
E
F
Level 1 Level2 Level 3
G
H I J
end
Level4 Level 5 level6
Each activity have preceding and succeeding event.Before an activity can begin, it preceding activity must be completed. Each event should have distinct number in way that head of arrow is greater than the tail.Length and direction of the arrow has no significance. Flow is from left to right Arrow should not intersect.There should be no loop in the project network Not more than one activity can have same preceding and succeeding events. Each activity is represented by unique numbered arrow
3- construction of network diagram
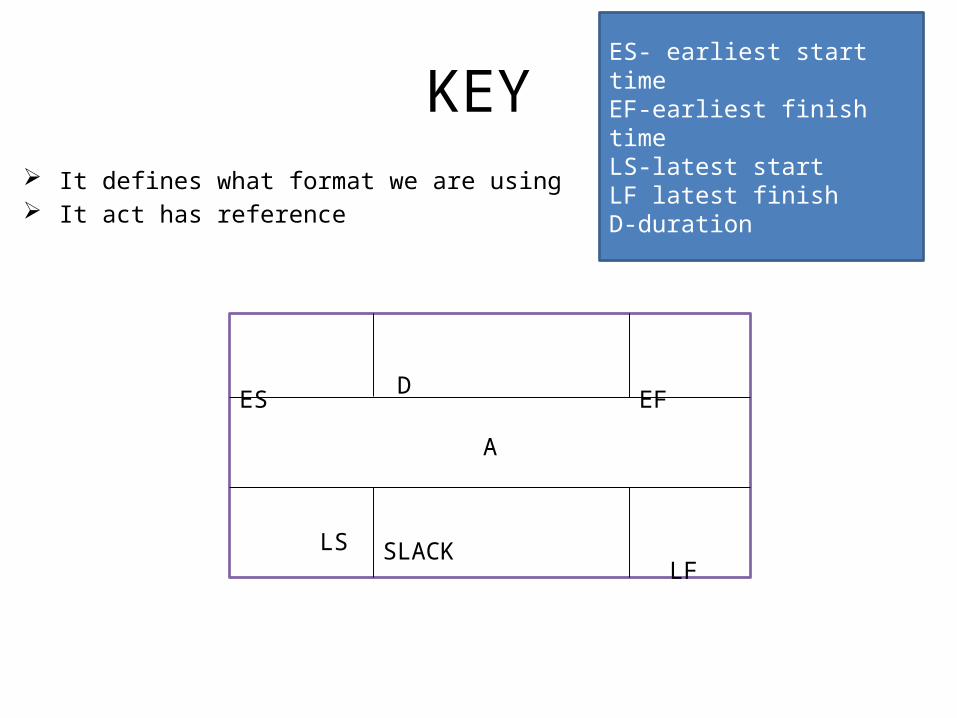
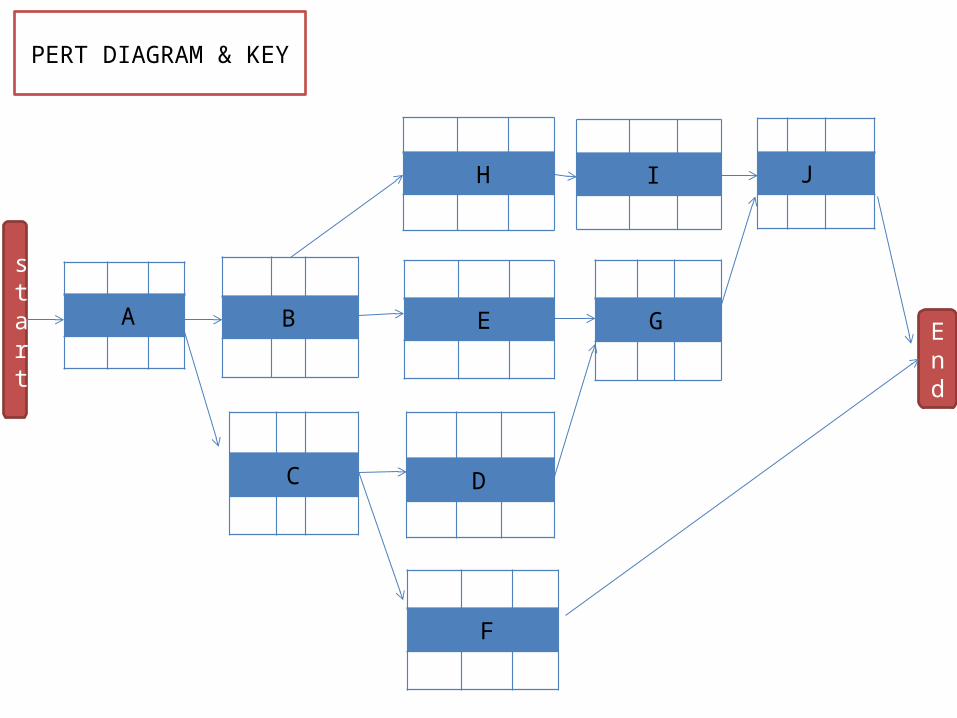
KEY It defines what format we are using It act has reference
A
ES
EF D
SLACK LS LF
ES- earliest start timeEF-earliest finish time LS-latest startLF latest finishD-duration

4-ESTIMATING TIME OF COMPLETION
Planning the schedule of the project
Time estimates include:1) D-Total time for completion( we already have)2) ES- Earliest start time: the earliest time at which the activity
can start given that its precedent activities must be completed first.
3) EF-Earliest finish time: equals to the earliest start time for the activity plus the time required to complete the activity.
4) LF- Latest finish time: the latest time in which the activity can be completed without delaying the project.
5) LS- Latest start time: equal to the latest finish time minus the time required to complete the activity.

6) FORWARD PASS: The early start and early finish times are calculated by moving forward through
the network considering the predecessor activities . Considers maximum
7) BACKWARD PASS: The latest start and finish times are calculated by moving backward through the
network. Considers minimum
8) SLACK TIME: Slack time for an activity is the difference between its earliest and latest start time
or between the earliest and latest finish time.
9) Critical path- is the path of activities having zero Slack time.
A
F
J
G
D
H
EB
C
I
start
End
PERT DIAGRAM & KEY

6A
4
F
4J
3
G
10
D
8H
6
E
6
B
3
C
4I
start
End
FILLING OF DURATION or EXPECTED TIME(D)
0 6 6A
9 4 13
F
24 4 28J
19 3 22
G
9 10 19
D
12 8 20H
12 6 18
E
6 6 12
B
6 3 9
C
20 4 24I
start
End
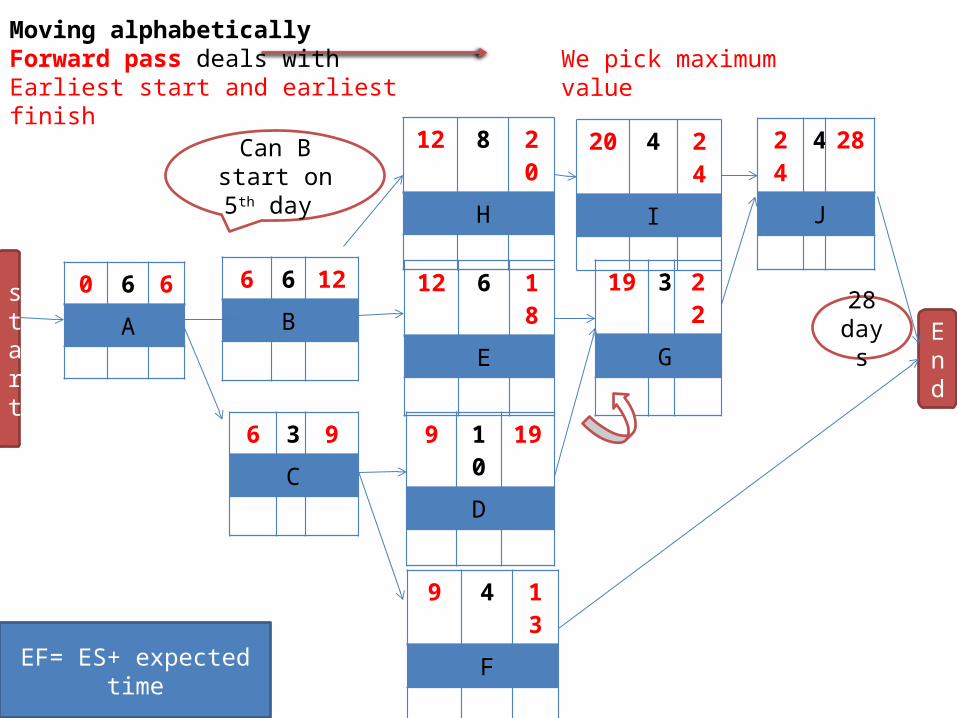
Moving alphabetically Forward pass deals withEarliest start and earliest finish
Can B start on 5th day
We pick maximum value
28 days
EF= ES+ expected time
0 6 6A
9 4 13
F
24 4 28J
24 28
19 3 22
G
9 10 19
D
12 8 20H
12 6 18
E
6 6 12
B
6 3 9
C
20 4 24I
start
End
28 days
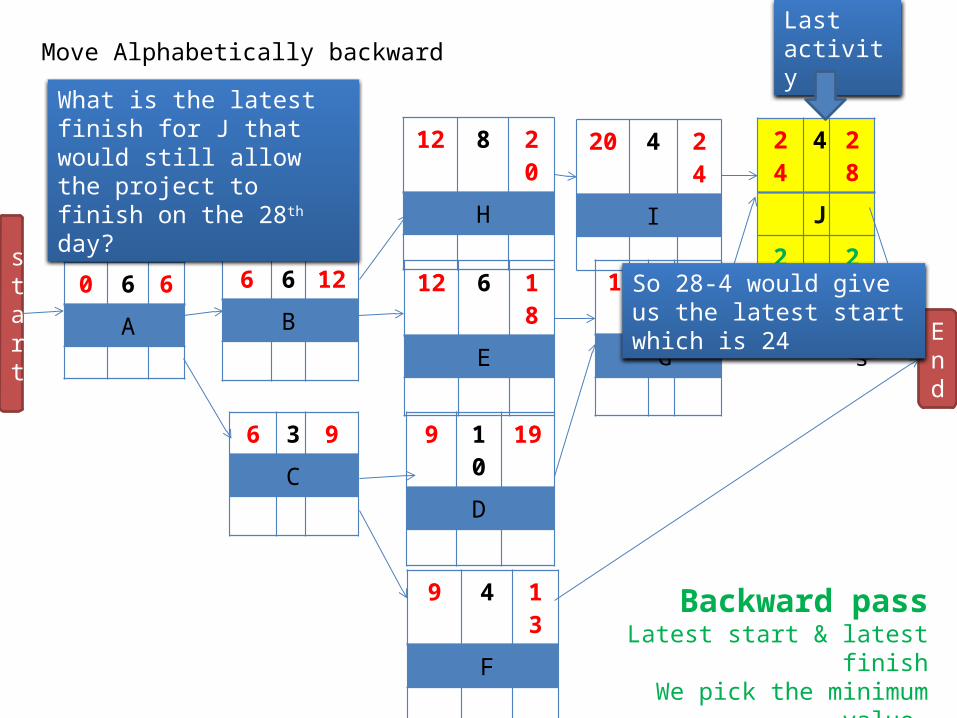
Backward passLatest start & latest finish
We pick the minimum value
Move Alphabetically backwardLast activity
What is the latest finish for J that would still allow the project to finish on the 28th day?
So 28-4 would give us the latest start which is 24

0 6 6A
9 4 13
F
24 4 28J
24 28
19 3 22
G
9 10 19
D
12 8 20H
12 6 18
E
6 6 12
B
6 3 9
C
20 4 24I
20 24
start
End
28 days
Backward passLatest start & latest finish
We pick the minimum value
Now we go backwards So , its J and IWe look at the right hand side of I What is the latest finish time for I Since it is coming only from J , it will be 24
Latest finish time of one activity is equivalent to latest start time of the next activity.

0 6 6A
9 4 13
F
24 28
24 4 28J
24 28
19 3 22
G
21 24
9 10 19
D
11 21
12 8 20H
12 20
12 6 18
E
15 21
6 6 12
B
6 3 9
C
20 4 24I
20 24
start
End
28 days
Backward passLatest start & latest finish
We pick the minimum value
Similarly we can calculate for the activities H,E,G,D,F

0 6 6A
9 4 13
F
24 28
24 4 28J
24 28
19 3 22
G
21 24
9 10 19
D
11 21
12 8 20H
12 20
12 6 18
E
15 21
6 6 12
B
6 3 9
C
8 11
20 4 24I
20 24
start
End
28 days
RULE FOR BACKWARD PASSWe pick the minimum value,
the smallest value.
C has two values , on the right hand side, there are two arrows coming out of C.One value is going to 11 and one is 24
This is the latest finish time for C which will still allow the project to happen on 28th day.
If we use 24, it will change the whole schedule.

SCHEDULING WHEN RESOURCES ARE LIMITED
• The early start schedule refers to the schedule in which all activities start as early as possible. The late start schedule reflects a desire to commit resources late – as late as possible.
• In real life situations there may be restrictions on the availability of resources . In the face of these , various schedules may have to be considered to find out which one is most appropriate in the light of these restrictions.

0 6 6A
0 6
9 4 13
F
24 28
24 4 28J
24 28
19 3 22
G
21 24
9 10 19
D
11 21
12 8 20H
12 20
12 6 18
E
15 21
6 6 12
B
6 12
6 3 9
C
8 11
20 4 24I
20 24
start
End
28 days
Backward passLatest start & latest finish
We pick the minimum value
Similarly we can calculate for the activities B , A
0 6 6A
0 0 6
9 4 13
F
24 15 28
24 4 28J
24 0 28
19 3 22
G
21 2 24
9 10 19
D
11 2 21
12 8 20H
12 0 20
12 6 18
E
15 3 21
6 6 12
B
6 0 12
6 3 9
C
8 2 11
20 4 24I
20 0 24
start
End
28 days
Backward passLatest start & latest finish
We pick the minimum value
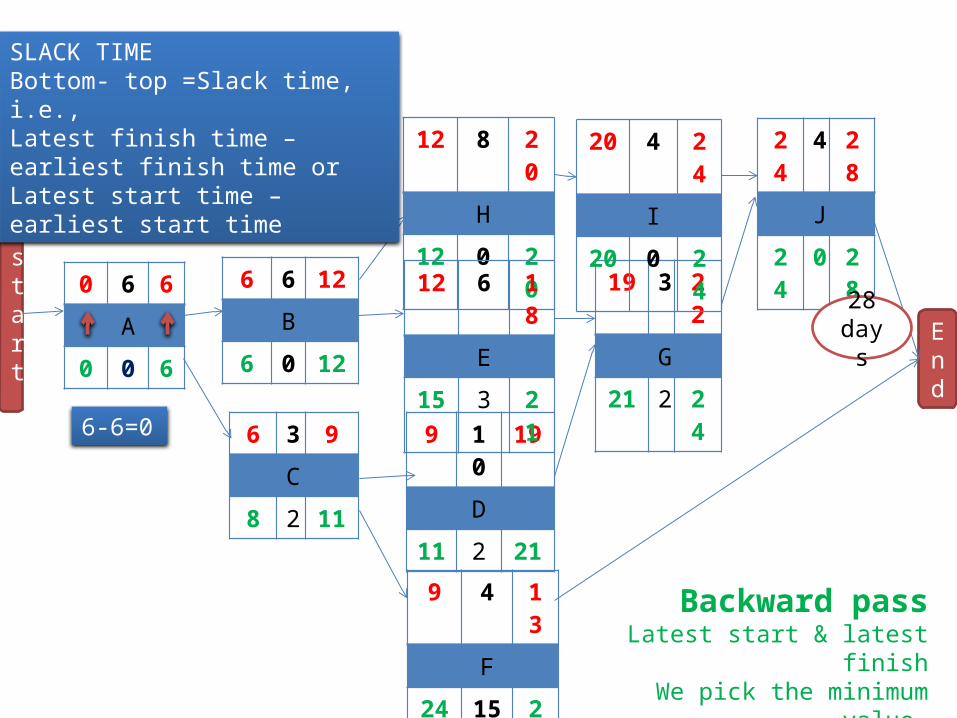
SLACK TIMEBottom- top =Slack time, i.e.,Latest finish time – earliest finish time orLatest start time – earliest start time
6-6=0

0 6 6A
0 0 6
9 4 13
F
24 15 28
24 4 28J
24 0 28
19 3 22
G
21 2 24
9 10 19
D
11 2 21
12 8 20H
12 0 20
12 6 18
E
15 3 21
6 6 12
B
6 0 12
6 3 9
C
8 2 11
20 4 24I
20 0 24
start
End
28 days
Critical Path ActivitiesThose activities which have a slag zero, that means no slack.Map the path from start to end
Which activity has zero slack from start?there is only one activity from start which has slack zero i.e. activity A
Critical path is
A-B-H-I-J
It is possible sometimes to have more than one critical path in a project.
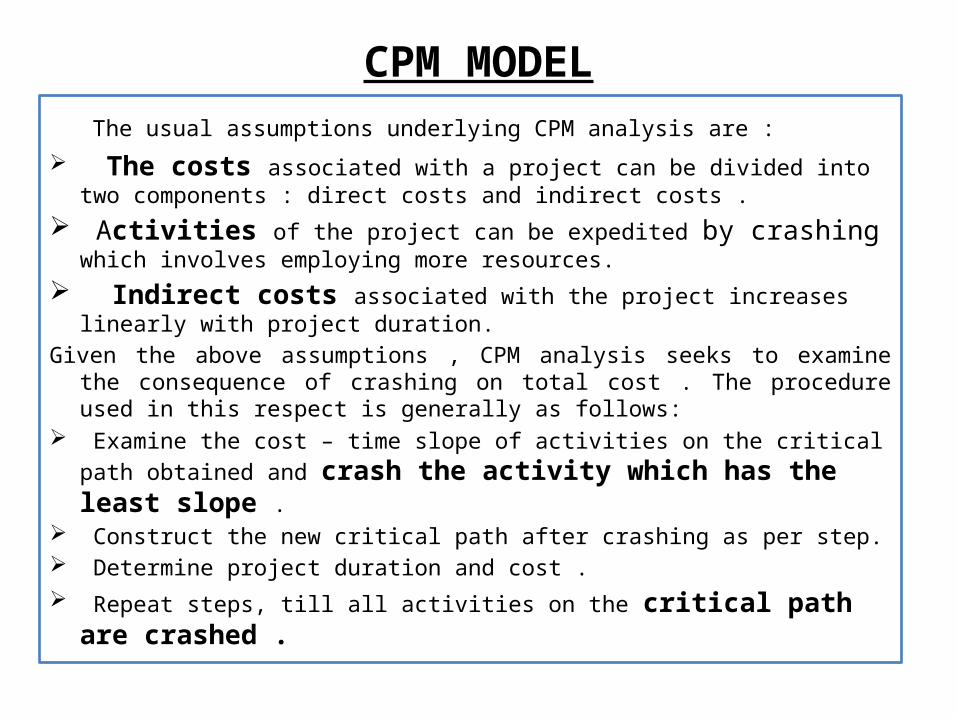
CPM MODEL
The usual assumptions underlying CPM analysis are : The costs associated with a project can be divided into two
components : direct costs and indirect costs . Activities of the project can be expedited by crashing which involves
employing more resources. Indirect costs associated with the project increases linearly with
project duration. Given the above assumptions , CPM analysis seeks to examine the
consequence of crashing on total cost . The procedure used in this respect is generally as follows:
Examine the cost – time slope of activities on the critical path obtained and crash the activity which has the least slope .
Construct the new critical path after crashing as per step. Determine project duration and cost . Repeat steps, till all activities on the critical path are crashed .

PERT MODEL
Variability in PERT analysis is measured by variance or its square root , standard deviation.
The steps involved in calculating the standard deviation of the duration of the critical path are as follows :
Determine the standard deviation of the duration of each activity on the critical path.
Determine the standard deviation of the total duration of the critical path on the basis of information obtained in the step.
Armed with information about the mean and standard deviation of critical path duration.

QUES.: Given that the variance for the project is 9.1, what is the probability that the project would be completed in 27 days?
In order to do this question , the first thing is to draw a normal distribution curve

Expected time for completing the project is 28 days.This means that it is the expected time or mean time. It means that there is 50-50 chance that the project will be completed in 28 days.
µ = 28X= 27
In order to know the probability of the project to be completed in 27 days ,we need to know this area
σ 2 ( variance)= 9.11
So, σ= √9.11 = 3.02
FORMULAZ= X- µ σ , so Z= 27-28 3.02 = -0.33
Look for the value of Z= -0.33 in the Z distribution table.area for standard distribution table shows that the value (area) is 0.1293.

0.50
0.1293
0.5-0.1293=0.3707= 37.07%
We know that there is 0.5 chance of project being completed in 28 days
By looking at Z table we have found this.
What this is telling us is that the probability of the project being completed in 27 days is 37.07%.Remember that the probability for 28 days is 50%

NETWORK COST SYSTEM To provide a vehicle for cost planning and control of projects , the network
cost system was developed . This represents a very useful supplement to the traditional time – oriented network analysis .
The basic principle of network cost system is fairly simple : costs are planned , measured , analysed , and controlled in terms of project activities.
As the project progresses , the following may be measured / estimated periodically for purposes of monitoring and control :
Costs incurred to – date , Budgeted costs to – date , Value of work done to – date , Cost over – run to – date , and Time over – run to – date .

CONCLUSION
The techniques of PERT and CPM discussed here are essentially time – oriented . They seek to answer questions like :
What is the most desirable time schedule of activities ?How much time would it take , on an average , to
complete the project ?What is the probability of completing the project in a
specified time ?

THANK YOU!


![089 ' # '6& *#0 & 7 · 2018. 4. 1. · 1 1 ¢ 1 1 1 ï1 1 1 1 ¢ ¢ð1 1 ¢ 1 1 1 1 1 1 1ýzð1]þð1 1 1 1 1w ï 1 1 1w ð1 1w1 1 1 1 1 1 1 1 1 1 ¢1 1 1 1û](https://static.fdocuments.us/doc/165x107/60a360fa754ba45f27452969/089-6-0-7-2018-4-1-1-1-1-1-1-1-1-1-1-1-1-1.jpg)