Cpc File Edited Version
18
COMMUNICATION CIRCUITS AND PRINCIPL ES PRACTICAL FILE
-
Upload
vaibhav-khurana -
Category
Documents
-
view
225 -
download
0
Transcript of Cpc File Edited Version

8/6/2019 Cpc File Edited Version
http://slidepdf.com/reader/full/cpc-file-edited-version 1/18
COMMUNICATION CIRCUITS
AND
PRINCIPL
ES
PRACTICAL
FILE

8/6/2019 Cpc File Edited Version
http://slidepdf.com/reader/full/cpc-file-edited-version 2/18
INDEX1. TO STUDY AND IMPLEMENT AM MODULATION
2. TO STUDY AND IMPLEMENT AM DEMODULATION
3. TO STUDY AND IMPLEMENT DSBSC MODULATION
4. TO STUDY AND IMPLEMENT DSBSC DEMODULATION
5. TO STUDY AND IMPLEMENT SSB MODULATION
6. TO STUDY AND IMPLEMENT SSB DEMODULATION
EXPERIMENT 1 AIM
To study amplitude modulation
SOFTWARE REQUIRED: MATLAB
THEORY
Amplitude modulation (AM) is a technique used in electronic communication, most commonly
for transmitting information via a radio carrier wave. AM works by varying the strength of thetransmitted signal in relation to the information being sent
In amplitude modulation the modulation voltage whose frequency is lower than that of the
carrier frequency varies the amplitude of a carrier signal. The complex envelope of an AM signal
is given by
)](1[)( t m At g c+=

8/6/2019 Cpc File Edited Version
http://slidepdf.com/reader/full/cpc-file-edited-version 3/18
Ac indicates the power level of AM and m(t ) is the Modulating Signal. Hence the amplitude
modulated signal is given by
s(t)=g(t)*cos(wct)
Energy spectrum of the AM modulated message signal.
The percentage of overall modulation is
If the amplitude of the message signal and that of the carrier signal are equal then the
modulation index is 100%.
AM SIGNAL WAVEFORM
Amax = 1.5Ac
Amin = 0.5 Ac
% Positive modulation= 50%
% Negative modulation =50%
Overall Modulation = 50%
WAVEFORMS:
[ ] [ ]max min max ( ) min ( )% Modulation 100 1002 2
c
m t m t A A
A
−−= × = ×
]0[i.e.,modulationof absencein theenvelopeAMof Level-
)](1[of valueMinimum-
)](1[of valueMaximum-
min
max
=
+
+
m(t) A
t m A A
t m A A
c
c
c

8/6/2019 Cpc File Edited Version
http://slidepdf.com/reader/full/cpc-file-edited-version 4/18
0 1 0 0 2 0 0 3 0 0 4 0 0 5 0 0 6 0 0 7 0 0 8 0 0 9 0 0 - 1
0
1
t im e
m
e s s a g e
s i g n a l
0 1 0 0 2 0 0 3 0 0 4 0 0 5 0 0 6 0 0 7 0 0 8 0 0 9 0 0 - 1
0
1
t im e
c a r r i e r s i g n a l
0 1 0 0 2 0 0 3 0 0 4 0 0 5 0 0 6 0 0 7 0 0 8 0 0 9 0 0 - 2
0
2
t im e
m
o d u l a t e d
s i g n a l
0 1 0 0 2 0 0 3 0 0 4 0 0 5 0 0 6 0 0 7 0 0 8 0 0 9 0 0 0
2 0 0
4 0 0
6 0 0
t im e
f f t m
o d u l a t e d s
i g n a l
MATLAB CODE:
% AMPLITUDE MODULATION
m=.7;
pi=3.14;t=0:1000;
fm=10;
fc=100;
mt=cos(2*pi*fm*t);
ct=cos(2*pi*fc*t);
md=(1+m.*cos(2*pi*fm*t)).*cos(2*pi*fc*t);
ft3=abs(fft(md));
subplot(4,1,1)
plot(t,mt),xlabel('time'),ylabel('message signal');
subplot(4,1,2)
plot(t,ct),xlabel('time'),ylabel('carrier signal');
subplot(4,1,3)
plot(t,md),xlabel('time'),ylabel('modulated signal');subplot(4,1,4)
stem(t,ft3),xlabel('time'),ylabel('fft modulated signal');
PRECAUTIONS
1. The carrier frequency should be sufficiently larger than the modulating signal frequency.
Experiment no.2

8/6/2019 Cpc File Edited Version
http://slidepdf.com/reader/full/cpc-file-edited-version 5/18
AIM
To study amplitude demodulation
SOFTWARE REQUIRED: MATLAB
THEORY
The simplest form of product detector multiplies an incoming signal by its carrier, to produce a
copy of the original message, and another AM signal at twice the original carrier frequency. This
high-frequency component can then be filtered out, leaving the original signal
If m(t ) is the original message, the AM signal can be shown to be
Multiplying the AM signal x
(t ) by an oscillator at the same frequency as and in phase with the carrier yields
which can be re-written as
After filtering out the high-frequency component based around cos(2ωt ) and the DC component C , the originalmessage will be recovered.
Although this simple detector works, it has two major drawbacks:
• The frequency of the local oscillator must be the same as the frequency of the carrier, or else the output
message will fade in and out in the case of AM, or be frequency shifted in the case of SSB
• Once the frequency is matched, the phase of carrier must be obtained, or else the demodulated messagewill be attenuated, but the noise will not be.
8/6/2019 Cpc File Edited Version
http://slidepdf.com/reader/full/cpc-file-edited-version 6/18
0 5 0 1 0 0 1 5 0 2 0 0 2 5 0 3 0 0 3 5 0 4 0 0 4 5 0 5 0 0-1
0
1
t i m e
m
e s s a g e
s i g n a l
0 5 0 1 0 0 1 5 0 2 0 0 2 5 0 3 0 0 3 5 0 4 0 0 4 5 0 5 0 0-1
0
1
t i m e
c a r r i e
r s i g n a l
0 5 0 1 0 0 1 5 0 2 0 0 2 5 0 3 0 0 3 5 0 4 0 0 4 5 0 5 0 00
0 . 5
1
t i m e
d e m
o d u l a t e d
s i g n a l
0 5 0 1 0 0 1 5 0 2 0 0 2 5 0 3 0 0 3 5 0 4 0 0 4 5 0 5 0 0
0
1 0 0
2 0 0
3 0 0
t i m e
f f t s i g n a l
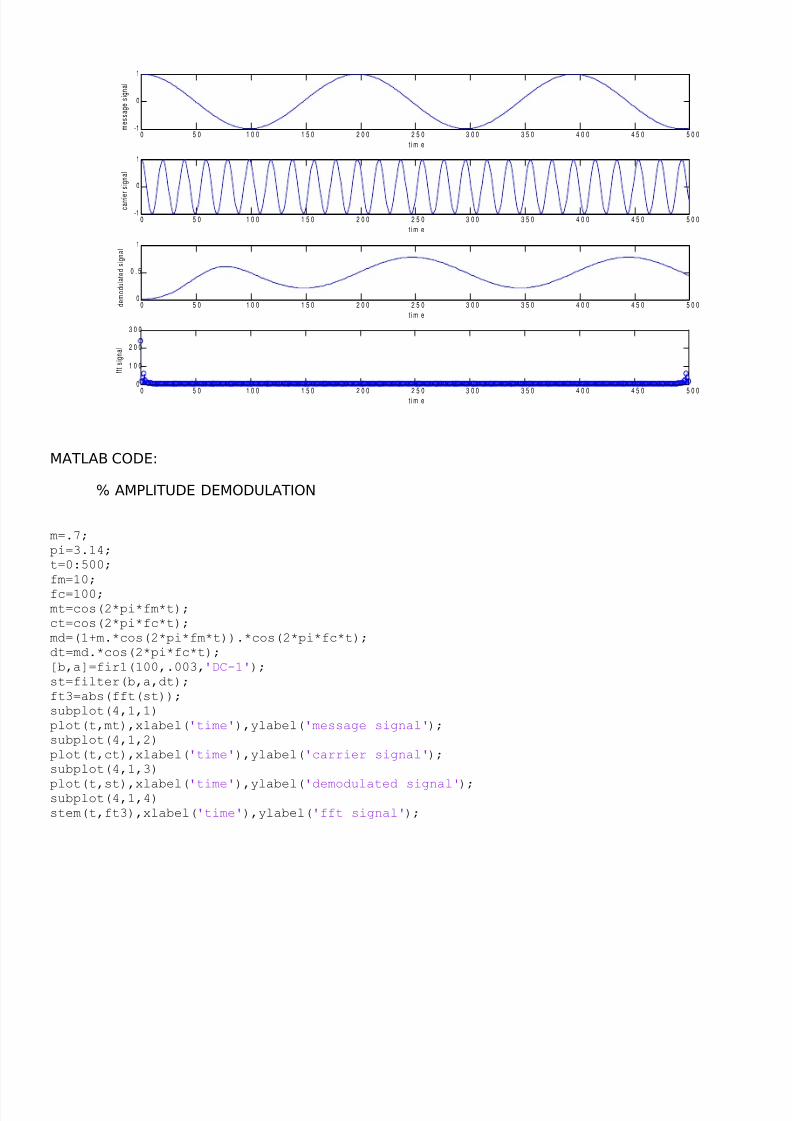
MATLAB CODE:
% AMPLITUDE DEMODULATION
m=.7;
pi=3.14;
t=0:500;
fm=10;
fc=100;
mt=cos(2*pi*fm*t);
ct=cos(2*pi*fc*t);
md=(1+m.*cos(2*pi*fm*t)).*cos(2*pi*fc*t);
dt=md.*cos(2*pi*fc*t);
[b,a]=fir1(100,.003,'DC-1');
st=filter(b,a,dt);
ft3=abs(fft(st));
subplot(4,1,1)
plot(t,mt),xlabel('time'),ylabel('message signal');
subplot(4,1,2)
plot(t,ct),xlabel('time'),ylabel('carrier signal');
subplot(4,1,3)
plot(t,st),xlabel('time'),ylabel('demodulated signal');subplot(4,1,4)
stem(t,ft3),xlabel('time'),ylabel('fft signal');

8/6/2019 Cpc File Edited Version
http://slidepdf.com/reader/full/cpc-file-edited-version 7/18
EXPERIMENT 3
AIM
To study Double Side Band- Suppressed Carrier Modulation using MATLAB.
SOFTWARE REQUIRED
MATLAB
THEORY
Double-sideband suppressed-carrier transmission (DSB-SC): transmission in which (a) frequencies
produced by amplitude modulation are symmetrically spaced above and below the carrier frequency and (b) the
carrier level is reduced to the lowest practical level, ideally completely suppressed.
In the double-sideband suppressed-carrier transmission (DSB-SC) modulation, unlike AM, the wave carrier isnot transmitted; thus, a great percentage of power that is dedicated to it is distributed between the sidebands,
which implies an increase of the cover in DSB-SC, compared to AM, for the same power used.
DSB-SC equation is of the form
It is obtained by eliminating the carrier component from AM signal. Its disadvantage is that it
needs a coherent carrier detector at the receiver.
This is used for RDS (Radio Data System) because it is difficult to decouple.
t t m At s ccω
cos)()(=

8/6/2019 Cpc File Edited Version
http://slidepdf.com/reader/full/cpc-file-edited-version 8/18
WAVEFORMS:
0 2 0 0 4 0 0 6 0 0 8 0 0 1 0 0 0 1 2 0 0 1 4 0 0 1 6 0 0 1 8 0 0 2 0 0 0-1 0
0
1 0
t i m e
m
e s s a g e
s i g n a l
0 2 0 0 4 0 0 6 0 0 8 0 0 1 0 0 0 1 2 0 0 1 4 0 0 1 6 0 0 1 8 0 0 2 0 0 0
-1 0
0
1 0
t i m e
c a r r i e r s i g n a l
0 2 0 0 4 0 0 6 0 0 8 0 0 1 0 0 0 1 2 0 0 1 4 0 0 1 6 0 0 1 8 0 0 2 0 0 0-1 0 0
0
1 0 0
t i m e
m
o d u l a t e d
s i g n a l
0 2 0 0 4 0 0 6 0 0 8 0 0 1 0 0 0 1 2 0 0 1 4 0 0 1 6 0 0 1 8 0 0 2 0 0 00
2
4x 1 0
4
t i m e
f f t m
o d u l a t e d
s i g n a l
MATLAB CODE:
% DSBSC MODULATION
fm=10;
fc=100;
am=8;
ac=10;
t=0:2000;
mt=am*cos(2*pi*fm*t);
ct=ac*cos(2*pi*fc*t);st=mt.*ct;
ft3=abs(fft(st));
subplot(4,1,1)
plot(t,mt),xlabel('time'),ylabel('message signal');
subplot(4,1,2)
plot(t,ct),xlabel('time'),ylabel('carrier signal');
subplot(4,1,3)
plot(t,st),xlabel('time'),ylabel('modulated signal');
subplot(4,1,4)
stem(t,ft3),xlabel('time'),ylabel('fft modulated signal');
8/6/2019 Cpc File Edited Version
http://slidepdf.com/reader/full/cpc-file-edited-version 9/18
PRECAUTIONS
2. The carrier frequency should be sufficiently larger than the modulating signal frequency.
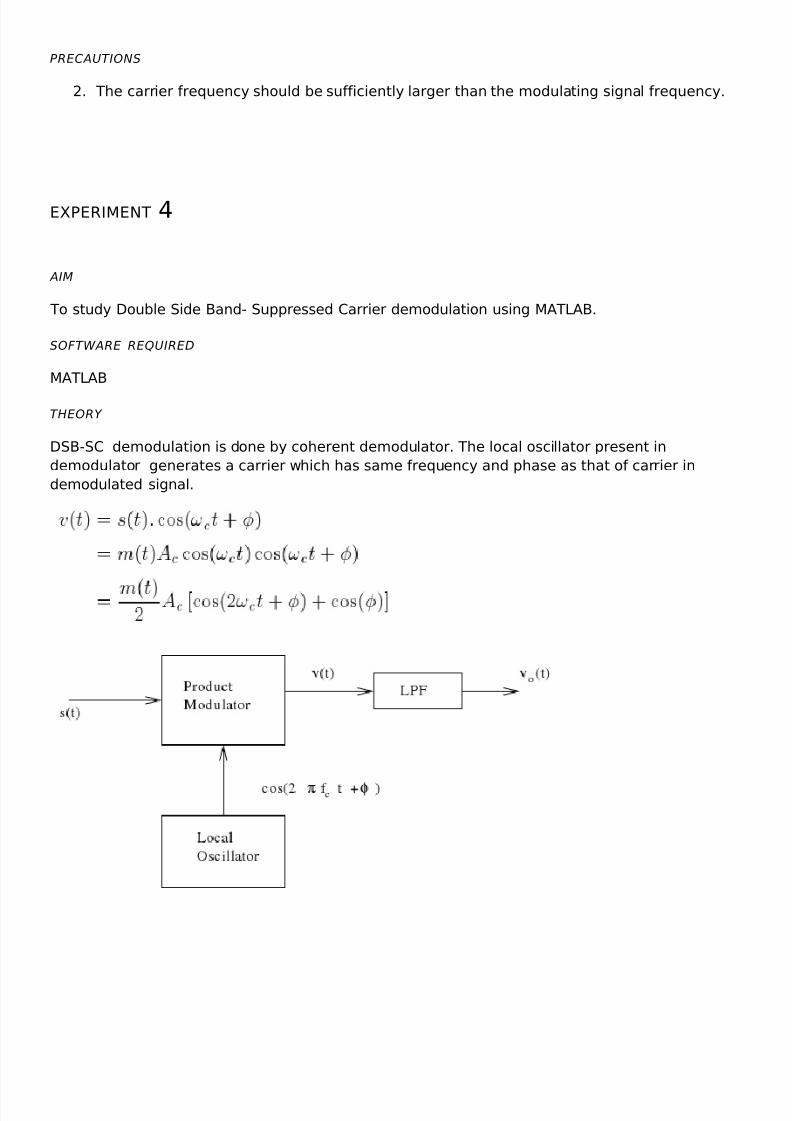
EXPERIMENT 4
AIM
To study Double Side Band- Suppressed Carrier demodulation using MATLAB.
SOFTWARE REQUIRED
MATLAB
THEORY
DSB-SC demodulation is done by coherent demodulator. The local oscillator present in
demodulator generates a carrier which has same frequency and phase as that of carrier in
demodulated signal.

8/6/2019 Cpc File Edited Version
http://slidepdf.com/reader/full/cpc-file-edited-version 10/18
For demodulation the audio frequency and the carrier frequency must be exact otherwise we get
distortion
MATLAB CODE:
% DSBSC DEMODULATION
fm=10;
fc=100;
am=8;
ac=10;
t=0:1000;
mt=am*cos(2*pi*fm*t);
ct=ac*cos(2*pi*fc*t);
md=mt.*ct;
dt=md.*cos(2*pi*fc*t);
[b,a]=fir1(100,.003,'DC-1');
st=filter(b,a,dt);
ft3=abs(fft(st));
subplot(4,1,1)
plot(t,mt),xlabel('time'),ylabel('message signal');subplot(4,1,2)
plot(t,ct),xlabel('time'),ylabel('carrier signal');
subplot(4,1,3)
plot(t,st),xlabel('time'),ylabel('demodulated signal');
subplot(4,1,4)
stem(t,ft3),xlabel('time'),ylabel('fft demodulated signal');

8/6/2019 Cpc File Edited Version
http://slidepdf.com/reader/full/cpc-file-edited-version 11/18
WAVEFORMS:
0 1 0 0 2 0 0 3 0 0 4 0 0 5 0 0 6 0 0 7 0 0 8 0 0 9 0 0 1 0 0 0- 1 0
0
1 0
t i m e
m
e s s a g e
s i g n a l
0 1 0 0 2 0 0 3 0 0 4 0 0 5 0 0 6 0 0 7 0 0 8 0 0 9 0 0 1 0 0 0- 1 0
0
1 0
t i m e
c a r r i e r s i g n a l
0 1 0 0 2 0 0 3 0 0 4 0 0 5 0 0 6 0 0 7 0 0 8 0 0 9 0 0 1 0 0 0
- 5 0
0
5 0
t i m e
d e m
o d u l a t e d
s i g n a l
0 1 0 0 2 0 0 3 0 0 4 0 0 5 0 0 6 0 0 7 0 0 8 0 0 9 0 0 1 0 0 00
1
2x 1 0
4
t i m e f f t d e m
o d u l a t e d
s i g n a l
PRECAUTIONS
1. The carrier frequency should be sufficiently larger than the modulating signal frequency.

8/6/2019 Cpc File Edited Version
http://slidepdf.com/reader/full/cpc-file-edited-version 12/18
EXPERIMENT 5 AIM
To study SSB Modulation using MATLAB.
SOFTWARE REQUIRED
MATLAB
THEORY
Single-sideband modulation (SSB) is a refinement of amplitude modulation that more
efficiently uses electrical power and bandwidth. It is closely related to vestigial sideband
modulation (VSB). Amplitude modulation produces a modulated output signal that has twice the
bandwidth of the original baseband signal. Single-sideband modulation avoids this bandwidth
doubling, and the power wasted on a carrier, at the cost of somewhat increased device
complexity.SSB was also used over long distance telephone lines, as part of a technique known
as frequency-division multiplexing (FDM).
Only a single side band of the DSB-SC modulated wave is transmitted.

8/6/2019 Cpc File Edited Version
http://slidepdf.com/reader/full/cpc-file-edited-version 13/18
SSB signal is represented by :
φSSB (t) = m(t) cos(ωc t) ± m^(t) sin(ωc t)
where
φUSB (t) = m(t) cos(ωc t) + m^(t) sin(ωc t)
and
φSSB (t) = m(t) cos(ωc t) - m^(t) sin(ωc t)

8/6/2019 Cpc File Edited Version
http://slidepdf.com/reader/full/cpc-file-edited-version 14/18
Generation of SSB Signal
Waveforms
0 1 0 2 0 3 0 4 0 5 0 6 0 7 0 8 0 9 0 1 0 00
1 0
2 0
3 0
4 0
5 0
t i m e
u p p e r s i d e
b a n d
0 1 0 2 0 3 0 4 0 5 0 6 0 7 0 8 0 9 0 1 0 00
1 0
2 0
3 0
4 0
5 0
t i m e
l o w e r s i d e
b a n d
MATLAB CODE:
%ssb modulation
fm=.02;
fc=.2;
t=0:100;
mt=cos(2*pi*fm*t);
mht=sin(2*pi*fm*t);
upp=mt.*cos(2*pi*fc*t)-mht.*sin(2*pi*fc*t);
low=mt.*cos(2*pi*fc*t)+mht.*sin(2*pi*fc*t);
ffu=abs(fft(upp));
ffl=abs(fft(low));

8/6/2019 Cpc File Edited Version
http://slidepdf.com/reader/full/cpc-file-edited-version 15/18
subplot(2,1,1)
stem(t,ffu),xlabel('time'),ylabel('upper side band');
subplot(2,1,2)
stem(t,ffl),xlabel('time'),ylabel('lower side band');
PRECAUTIONS
1. The carrier frequency should be sufficiently larger than the modulating signal frequency.

8/6/2019 Cpc File Edited Version
http://slidepdf.com/reader/full/cpc-file-edited-version 16/18
EXPERIMENT 6 AIM
To study SSB demodulation using MATLAB.
SOFTWARE REQUIRED
MATLAB
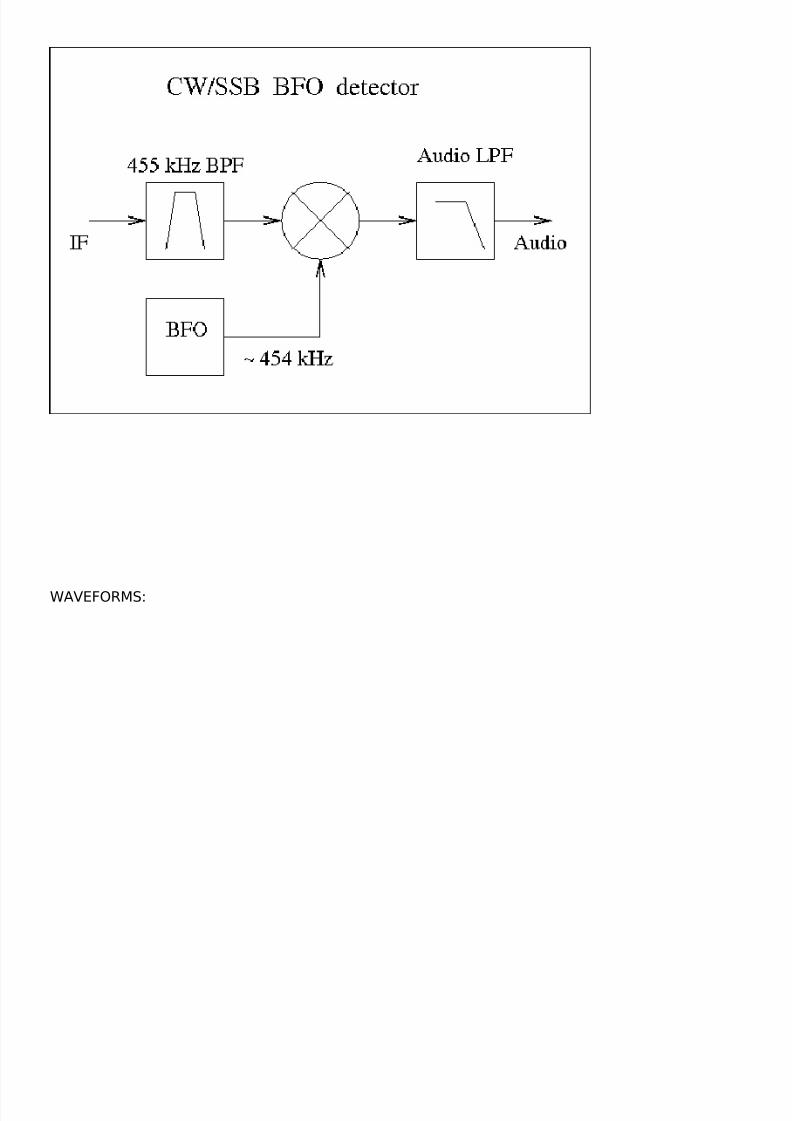
THEORY
The front end of an SSB receiver is similar to that of an AM or FM receiver. To recover the origina
signal from the IF SSB signal, the single sideband must be frequency-shifted down to its original
range of baseband frequencies, by using a product detector which mixes it with the output of a
beat frequency oscillator (BFO)For this to work, the BFO frequency must be accurately adjusted.If the BFO is mis-adjusted, the output signal will be frequency-shifted,
8/6/2019 Cpc File Edited Version
http://slidepdf.com/reader/full/cpc-file-edited-version 17/18
WAVEFORMS:

8/6/2019 Cpc File Edited Version
http://slidepdf.com/reader/full/cpc-file-edited-version 18/18
0 2 0 0 4 0 0 6 0 0 8 0 0 1 0 0 0 1 2 0 0 1 4 0 0 1 6 0 0 1 8 0 0 - 1
-0 . 5
0
0 . 5
1
t im e
m e s s a g e
s i g n a l
0 2 0 0 4 0 0 6 0 0 8 0 0 1 0 0 0 1 2 0 0 1 4 0 0 1 6 0 0 1 8 0 0 -0 . 5
0
0 . 5
t im e
d e m
o d u l a t e d
s i g n a l
MATLAB CODE:
%ssb demodulation
fm=10;
fc=100;
t=0:2000;
mt=cos(2*pi*fm*t);
ct=cos(2*pi*fc*t);
mht=sin(2*pi*fm*t);
upp=mt.*cos(2*pi*fc*t)-mht.*sin(2*pi*fc*t);
st=upp.*ct;
[b,a]=fir1(100,.003,'DC-1');
dt=filter(b,a,st);
subplot(2,1,1)
plot(t,mt),xlabel('time'),ylabel('message signal');
subplot(2,1,2)plot(t,dt),xlabel('time'),ylabel('demodulated signal');
PRECAUTIONS
1. The carrier frequency should be sufficiently larger than the modulating signal frequency.