
CoxBrendanIntergratedProjectReport
51
SOUTHERN CROSS UNIVERSITY ASSIGNMENT COVER SHEET For use with online submission of assignments Please complete all of the following details and then make this sheet the first page of each file of your assignment – do not send it as a separate document. Your assignments must be submitted as either Word documents, text documents with .rtf extension or as .pdf documents. If you wish to submit in any other file format, please discuss this with your lecturer well before the assignment submission date. Student Name: Brendan Cox Student ID No.: 22025632 Unit Name: Integrated Project Unit Code: SCI00211 Tutor’s name: Bill Boyd Assignment No.: 3 Assignment Title: The influence of low pH on macroinvertebrate community composition in acidic waterways associated with coastal lowland acid sulfate soil discharge. Due date: 19/02/2016 Date submitted: 19/02/2016 Declaration: I have read and understand the Rules Relating to Awards (Rule 3 Section 18 – Academic Misconduct Including Plagiarism) as contained in the SCU Policy Library. I understand the penalties that apply for plagiarism and agree to be bound by these rules. The work I am submitting electronically is entirely my own work. Signed: (please type your name) Mr. Brendan G. Cox Date: 19/02/2016
-
Upload
brendan-cox -
Category
Documents
-
view
219 -
download
0
Transcript of CoxBrendanIntergratedProjectReport

SOUTHERN CROSS UNIVERSITY
ASSIGNMENT COVER SHEET
For use with online submission of assignments
Please complete all of the following details and then make this sheet the first page of each file of your assignment – do not send it as a separate document. Your assignments must be submitted as either Word documents, text documents with .rtf extension or as .pdf documents. If you wish to submit in any other file format, please discuss this with your lecturer well before the assignment submission date.
Student Name: Brendan Cox
Student ID No.: 22025632
Unit Name: Integrated Project
Unit Code: SCI00211
Tutor’s name: Bill Boyd
Assignment No.: 3
Assignment Title: The influence of low pH on macroinvertebrate community composition in acidic waterways associated with coastal lowland acid sulfate soil discharge.
Due date: 19/02/2016
Date submitted: 19/02/2016
Declaration:
I have read and understand the Rules Relating to Awards (Rule 3 Section 18 – Academic Misconduct Including Plagiarism) as contained in the SCU Policy Library. I understand the penalties that apply for plagiarism and agree to be bound by these rules. The work I am submitting electronically is entirely my own work.
Signed: (please type your name)
Mr. Brendan G. Cox
Date: 19/02/2016
The influence of low pH on macroinvertebrate community composition in acidic waterways associated with coastal lowland acid sulfate soil discharge.
Southern Cross University 2016 1
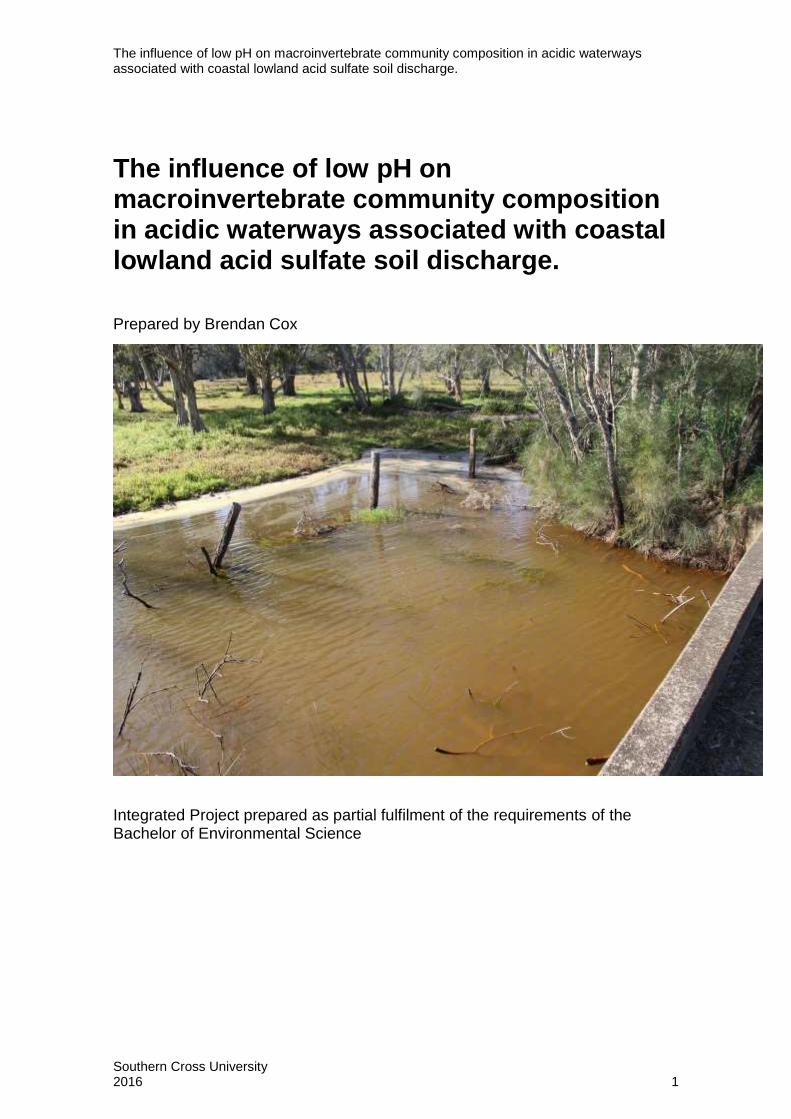
The influence of low pH on macroinvertebrate community composition in acidic waterways associated with coastal lowland acid sulfate soil discharge.
Prepared by Brendan Cox
Integrated Project prepared as partial fulfilment of the requirements of the Bachelor of Environmental Science

Brendan Cox, 2016
Integrated Project 2
I, Brendan Cox, consent to this report being made available for photocopying and loan, provided that my work is fully acknowledged and that the granting of such a licence in no way inhibits me from exercising any of my exclusive rights under the Copyright Act 1968. I understand this licence is granted in the interests of education and research and that no royalties are payable.
19/02/2015

The influence of low pH on macroinvertebrate community composition in acidic waterways associated with coastal lowland acid sulfate soil discharge.
Southern Cross University 2016 3
Acknowledgements
To Dr Kathryn Taffs, my project supervisor, thank you for this fascinating topic,
your advice, critical review of my drafts and for opening my eyes up to the world
of freshwater ecology.
To Maxine Dawes, for your time and knowledge with the laboratory equipment
and teaching me invaluable lab skills I will no doubt require in the future.
To my fiancée Ange for here support through my project, and for your help with
all the field work, I could not have done this research without your help.
And thanks to everyone else that gave their, assistance, time, advice and
support.

Brendan Cox, 2016
Integrated Project 4
Abstract
The export of acidic-discharge created during oxidation of iron sulfides contained within coastal acid sulfate soils are a major cause of waterway acidification. Acidification disrupts the chemical, physical and biological processes of freshwater ecosystems. Coastal wetlands have been drained for agricultural and developmental use, lowering of the water table exposing sulfidic sediments to oxygen, producing actual acid sulfate soils which in turn causes acidification of surface water. A lowering of pH, dissolved oxygen and an increase in dissolved metal and sulfate concentration are major water quality issues associated with acidification of waterways. Macroinvertebrates represent a valuable tool in investigating the effects of non-point source pollution such as acidification. The aim of this study was to identify the effect of low pH associated with acidic-discharge from coastal lowland acid sulfate soils caused a change in macroinvertebrate community composition. The lower Richmond River flood plain is a known hotspot of coastal lowland acid sulfate soil, and has a highly altered hydrology due to a significant artificial drainage network allowing year round agricultural production. Macroinvertebrates were collected from twelve study sites located within the lower Richmond River flood plain. Physico-chemical water quality measurements were also collected. To allow for comparisons in macroinvertebrate community compositions sites were classified as Acidic or Neutral by acidification based on their pH. Macroinvertebrate abundance and taxa richness was not effected by acidic discharge however a change in the macroinvertebrate community composition occurred. A shift from acid-sensitive to acid-tolerant taxa was identified as a result of acidification. Adaptions by acid-tolerant taxa allows them to survive in low pH aquatic environments. It was uncertain if pH alone was the cause of the community composition identified due to the range water quality issues associated with acidification. This study showed that community composition was effected by waterway acidification.
Keywords: Macroinvertebrate community composition, Abundance, Taxa richness, pH, Coastal Lowland Acid Sulfate Soils, Freshwater ecosystem, Acidification.

The influence of low pH on macroinvertebrate community composition in acidic waterways associated with coastal lowland acid sulfate soil discharge.
Southern Cross University 2016 5
Table of Contents
Abstract .............................................................................................................. 4
1. Introduction ................................................................................................. 6
Coastal lowland acid sulfate soils .......................................................... 7
Water Quality ........................................................................................ 8
Acidification of aquatic ecosystems ....................................................... 9
Aquatic macroinvertebrates ................................................................. 10
2. Methods .................................................................................................... 12
Site Description ................................................................................... 12
Sampling sites ..................................................................................... 13
Field measurements ............................................................................ 15
Macroinvertebrates.............................................................................. 15
3. Results ...................................................................................................... 16
Water Quality ...................................................................................... 16
Macroinvertebrates.............................................................................. 19
4. Discussion ................................................................................................. 25
Water Quality ...................................................................................... 25
Macroinvertebrates.............................................................................. 26
Community Composition ..................................................................... 27
Limitations ........................................................................................... 28
5. Conclusion ................................................................................................ 29
6. References ................................................................................................ 30
7. Appendices ............................................................................................... 36
Appendix A. Sub-habitats sampled ..................................................... 36
Appendix B. Macroinvertebrates ......................................................... 36
Appendix C. SIGNAL 2 scores ............................................................ 38
Appendix D. Water Quality Measurements ......................................... 50
Appendix E. Field Observations .......................................................... 50

Brendan Cox, 2016
Integrated Project 6
1. Introduction
Acidification of streams and waterways affects the physical, chemical and biological patterns and process of freshwater ecosystems (Guerold et al., 2000; Macdonald et al., 2007). Waterway acidification is a key threat to the functioning and biodiversity of freshwater ecosystems (Lamers et al., 1998). Due to their central role in freshwater ecosystems macroinvertebrates represent a valuable tool for investigating the effects of surface water acidification (Guerold et al., 2000). While the cause of waterway acidification varies the results are typically the same (Lamers et al., 1998; Gerhardt et al., 2004; Burton et al., 2006). The reduced water quality associated with acidification effects the biological productivity of freshwater ecosystems (Guerold et al., 2000; Sommer & Horwitz, 2001; Baldigo & Lawrence, 2001; Fitzpatrick, et al., 2009). Loss or change of habitat occur due to a change in water chemistry (Preda & Cox, 2001) killing native water plant species making way for acid-tolerant species (mostly exotics) in affected waterways (Furguson & Eyre, 1999; Cook et al., 2000). A change in ecological integrity is caused by waterway Acidification
The consequences of acidification on aquatic biota may possibly include fish kills, algal blooms, loss of water birds, invertebrates, amphibians and the loss of biodiversity in effected freshwater ecosystems (White et al., 1997; Guerold et al., 2000; Baldigo & Lawerence, 2001; Sommer & Horwitz, 2001; Burton et al., 2006; Ruiz-Halpern, et al., 2015). Acidification of waterways can occur from acid mine drainage, atmospheric acidification and acid sulfate soil discharge (Burton et al., 2006). In Australia acid sulfate soil discharge is the major source of surface water acidification (Cornfield, 2000). Acidification of waterways causes degradation of the ecological condition in effected freshwater ecosystems.
Water logged soils and soft sediments that contain iron sulfide minerals and small quantities of monosulfides are categorised as Potential Acid Sulfate Soils (PASS) (Fitzpatrick, et al., 2009). While soils containing sulfidic minerals of which pyrite(FeS2) is the predominate form (Burton et al., 2006) remain wetted and undisturbed they pose little to no risk of acidification as pyrite is stable under natural anoxic conditions (Sammut et al., 1996; White et al., 1997; Furguson & Eyre, 1999; Fitzpatrick, et al., 2009; Simpson et al., 2010). It is when exposed to oxygen through natural or anthropogenic disturbance and drainage resulting in a lowering of the water table that PASS become Actual Acid Sulfate Soils (AASS) and cause for concern. As the water table drops permitting air to enter the soil profile, the oxygen in the air consequently causes pyrite to start oxidating (Ritsema & Groeneberg, 1993). The oxidation of pyrite result in the formation of sulfidic acid (H2SO4) which accumulates in the soil (Furguson & Eyre, 1999). These highly acidic AASS pose a high risk to both the terrestrial and aquatic environment.
Anthropogenic activates exacerbate the natural production of acid formation in acid sulfate soil environments (Sammut et al., 1996). Disturbance of PASS occurs mostly due to changes in soil, surface and ground water levels resulting from mostly anthropogenic activity (Ruiz-Halpern, et al., 2015). Disturbance and

The influence of low pH on macroinvertebrate community composition in acidic waterways associated with coastal lowland acid sulfate soil discharge.
Southern Cross University 2016 7
drainage result from activities such as vegetation removal and engineering works, the major effect of these is the artificial lowering of the water table exposing PASS to the air (Wong et al., 2010). Natural process may also expose PASS to the air, erosion and drought are the major natural causes of ground water lowering (Lamers et al., 1998; Fitzpatrick, et al., 2009). Vast amounts of sulfidic acid are produced in the soil through pyrite oxidation in acid sulfate soil environments (Furguson & Eyre, 1999; Macdonald et al., 2007). The acid reacts with soil minerals and dissolves aluminium, iron and other acid-soluble metals (White et al., 1997; Furguson & Eyre, 1999; Vuai et al., 2003; Macdonald et al., 2007), soil water, ground water and runoff export these products into nearby surface waters in acidic discharge. Acid sulfate water is produced and discharged into drains and waterways in acid sulfate soil environments (Bigham et al, 1996; Fitzpatrick, et al., 2009; Ruiz-Halpern, et al., 2015). The export of pyrite oxidation products into drains and waterways causes the acidification of freshwater ecosystems.
Coastal lowland acid sulfate soils Acid sulfate soils are intimately linked to coastal wetland landscapes (Powell & Martens, 2005). The reaction of sulfate-rich seawater with iron in the sediments forms iron-sulfide minerals. Coastal Lowland Acid Sulfate Soils (CLASS) formed during the Holocene as sea levels rose inundating low lying coastal areas with sulfate-rich sea water (Burton et al., 2006; Ruiz-Halpern, et al., 2015). Inundation resulted in sediments containing organic matter and iron oxides mixing with sulfides in the sea water causing a reduction reaction producing vast amounts of iron sulfides (Sammut & Lines-Kelly, 2004; Macdonald et al., 2007). Iron sulfides and monosulfides are contained within waterlogged sediments (mostly coastal wetlands) that formed on floodplains in low lying areas near the coast where vast amounts of CLASS accumulated behind barrier systems and in estuarine embayment’s (White et al., 1997; Furguson & Eyre, 1999; Wong et al., 2010; Ruiz-Halpern, et al., 2015). CLASS are widespread along coastal areas and underlie coastal floodplains including urban and agricultural lands (White et al., 1997).
Due to the flood prone nature of CLASS-environments the hydrology is usually highly modified due to extensive drainage works (Burton et al., 2006; Wright & Burgin, 2009; Ruiz-Halpern, et al., 2015). With population pressures and the need for prime agricultural land coastal wetland areas have been drained (Powell & Martens, 2005), and significant engineering works undertaken to reduce the impacts of flooding (DeWeys et al., 2010; Ruiz-Halpern, et al., 2015) permitting year round agricultural production. The construction of levees, flood gates and drainage networks along with land clearing have altered the rate at which CLASS is exposed through disturbance leading to the oxidation of the sulfides they contain (Powell & Martens, 2005). The artificial lowering of the water table through engineering works and land clearing for increased agricultural production and urban development highly effect the hydrology of CLASS-environments increasing the export of oxidation products into nearby waterways.

Brendan Cox, 2016
Integrated Project 8
Flood mitigation drains that drain CLASS-environments contain Monosulfides Black Oozes (MBOs). The formation of MBOs that contain high organic matter enriched in iron monosulfides (Bush et al., 2004) have the potential to cause rapid deoxygenation of water if mobilised in so called ‘black water’ events (Cavanagh et al., 2006), due to their high dissolved oxygen demand. MBOs may be mobilized by floods or dredging operations in CLASS-environments (Bush et al., 2004). Through artificial drainage and natural pedogenesis, lowland coastal floodplains have been transformed from a store of sulfur and metals to a source (Macdonald et al., 2004). Acidic-discharge causes the acidification of waterways in CLASS-environments leading to a reduction in water quality and biological productivity.
Water Quality Water quality of waterways are profoundly affected by acidification in CLASS-environments (Macdonald et al., 2004; Cavanagh et al., 2006). Waterways affected by acidification typically have a lowered pH (< 6), lowered dissolved oxygen content (< 80%) (Furguson & Eyre, 1999; Ruiz-Halpern et al., 2015) and high levels of dissolved metals (Furguson & Eyre, 1999; Vuai et al., 2003) exceeding Australian water quality guidelines (ANZECC, 2000; Simpson et al., 2010). The reduced pH associated with CLASS is a result of sulfuric acid accumulation and discharge (White et al.,1997). Dissolved oxygen is reduced in acidified waterways by the oxygenation of iron monosulfides, as oxygen is consumed in the oxidation reaction (Cook et al., 2000). The high organic matter decomposition in acidic waters has a high biological oxygen demand depleting effected waterways of dissolved oxygen (Ruiz-Halpern et al., 2015). Dissolved oxygen is further reduced in the secondary oxidation of Iron (White et al., 1997). Dissolved oxygen is consumed in the high chemical oxygen demand and biological oxygen demand reactions within acid sulfate waters. Acidic-discharge highly effects the water quality in CLASS-environments.
The leeching and transport of major and trace metals into surface waters (Preda & Cox, 2001) results from acidic water passing through the soil profile reacting with clay minerals to release metal ions (White et al., 1997; Fältmarsch et al., 2008). Principally these dissolved metals include, aluminium, iron, potassium, sodium, magnesium and manganese. Dissolved metals specifically aluminium and iron are converted to the solid hydroxide species in acid sulfate waters (Furguson & Eyre, 1999). As flocculation of iron and aluminium occurs they are rapidly removed from the water column adsorbing suspended solids, smothering aquatic plants and benthos with toxic metal enriched precipitates (Furguson & Eyre, 1999; Simpson et al., 2010). Iron precipitates also coat organic litter on the banks and beds of streams and waterways (Sammut et al., 1996; Sullivan & Bush, 2004). The release of toxic quantities of metals into waterway is a key consequence of acidification associated with acidic-discharge in CLASS-environments. The products formed during pyrite oxidation and the associated mobilisation of toxic metals in CLASS-environments have profound implications on water quality (White et al., 1997) causing dramatic changes to the ecology of effected freshwater systems.

The influence of low pH on macroinvertebrate community composition in acidic waterways associated with coastal lowland acid sulfate soil discharge.
Southern Cross University 2016 9
Acidification of aquatic ecosystems Acidic-discharge causes acidification of receiving surface waters in CLASS-environments, a reduction in the health of aquatic ecosystems is a direct result (White et al., 1997; Fältmarsch et al., 2008). Water chemistry is highly effected by acidification (Sammut et al., 1996) this results in a reduction to aquatic ecosystem integrity (Vuai et al., 2003) and causes a loss of aquatic biota (Baldigo & Lawrence, 2001; Fältmarsch et al., 2008). The response to acidification of waterways by the instream community includes a reduction in biomass and a reduction in acid-sensitive species. an increase in biomass and density of acid-tolerant species occurs in parallel as a response to acidification. (Baldigo & Lawerence, 2001). A change in the macrophytes community is seen as a result of acidification as acid and aluminium tolerant plants species replace the natural aquatic plant community (Sammut et al., 1996; Furguson & Eyre, 1999). The aquatic biota and plant community within freshwater ecosystems is altered by waterway acidification.
The leeching of toxic products of pyrite oxidation increases the stress on aquatic ecosystems. Aquatic biota is affected by the high concentration of dissolved metal in acidic-discharge (Sammut et al., 1995; Furguson & Eyre, 1999; Fältmarsch et al., 2008). Flocs of aluminium smother benthos and aquatic plants (White et al., 1997; Furguson & Eyre, 1999). Loss of the fish community also occurs as flocs of aluminium coat their gills (Sammut et al., 1995). Precipitation of metals passing through the water column causes crystal-clear water resulting in increased light penetration (Fältmarsch et al., 2008). High water transparency is caused by aluminium induced flocculation of turbid drain water, a major characteristic of acidification (Sammut et al. 1996). An increase in light penetration in these transparent waters rises water temperatures, increasing plant growth which in turn through the breakdown of organic matter caused a lowering in dissolved oxygen. Water transparency, pH and dissolved metal concentration have the greatest effect on aquatic biota in acidified waters (Cornfield, 2000; Fältmarsch et al., 2008).
Altered abiotic conditions and disruption to food web dynamics are indirect results of acidification (Webster et al., 1992). Decreased food supplies occur due to mortalities and emigration of aquatic biota to less acidic waters (Baldigo & Lawrence, 2001). Janssens de Bisthoven et al., (2006) explain that the loss of large crustaceans which are detritivores and herbivores within a food web has a significant impact of freshwater ecosystems. The impairment of ecological process reduces species diversity and cause habitat degradation (Sammut et al., 1996). Crustacean, shellfish and fish mortalities are major ecological impacts of acidification (Sammut et al., 1995). A reduction in fish populations may also occurs due to a lack of recruitment and a reduction in reproduction rates within acidic waters (Baker & Christensen, 1991; Sammut et al., 1996; Baldigo & Lawrence, 2001). The combination low pH, low dissolved oxygen and high dissolved metal concentration associated with acidic-discharge (Powell & Martens, 2005) in CLASS-environments causes ecological impairment of freshwater environments.

Brendan Cox, 2016
Integrated Project 10
Aquatic macroinvertebrates The biological responses of populations and communities of certain indicator organisms are valuable tools to evaluate the effect of aquatic environmental changes (Campbell, 2002; Bae et al., 2005; Bonada et al., 2006). Macroinvertebrates have become the most frequently used biological indicators in freshwater systems (Resh & Jackson, 1993) due to their wide diversity of forms, range of responses to stressors, their sessile nature and short life cycles (Charvet et al. 2000; Campbell, 2002). Using the biological responses of macroinvertebrates derives relevance to the ecological degradation caused by waterway acidification. Typically, macroinvertebrates have short life cycles compared to other aquatic creatures, usually in the order of months to years long limiting their ability to recolonise sites rapidly, therefore changes to population and community composition reflect changes in the aquatic environment (Campbell, 2002, Reece & Richardson, 1999). Macroinvertebrates differ in their sensitivity to stressors and therefore respond to contaminants in the water column as well as those in the sediment (Reece & Richardson, 1999). Macroinvertebrates have the ability to respond to a range of environmental variables including sediment quality, water quality, hydrological conditions and biological factors (Rosenberg & Resh, 1993; Bonada et al., 2006; Raposeiro & Costa, 2009). The response of aquatic macroinvertebrates derives relevance to changes in the aquatic environmental.
Macroinvertebrate families are ideal for use as biological indicators of water quality as their tolerance level to pollution including acidity varies (Havas & Advokaat, 1995; Wright & Burgin, 2009). Biodiversity of aquatic macroinvertebrates and community composition are important indicators of diffuse pollution sources (Mandaville, 2002; Johnson et al., 2013) such as acidic-discharge in CLASS-environments. A Loss of macroinvertebrate diversity can lead to serious degradation of freshwater ecosystems (Guerold et al., 2000). ANZECC (2000) recommend using macroinvertebrate abundance and taxa composition as indicator to unnatural changes in pH as well as dissolved oxygen. Macroinvertebrate abundance and taxa richness which represent a snapshot of community composition have been widely used to access the biological integrity of freshwater systems suffering from non-point source pollution (Johnson et al., 2013). Research by Guerold et al. (2000) advocates the use of simple taxa richness based indices which can provide an accurate tool to evaluate the impacts of waterway acidification on macroinvertebrates. Macroinvertebrate community composition along with abundance and taxa richness information represent a useful tool for assessing the impacts of waterway acidification by acidic-discharge in CLASS-environments.
Considerable research efforts have been given to the effects of acid mine drainage, atmospheric acidification on aquatic macroinvertebrates. Less attention has been paid to the effect of acid sulfate soil discharge. The effects of acidification on freshwater ecosystems is well established (Vaui et al., 2003; Petrin et al., 2007). The specific response from macroinvertebrate to acidification is less clear with the current research inconclusive to effects. While it is understood that aquatic macroinvertebrates are effected by acidification (Guerold et al., 2000; Sommer & Horwitz, 2001; Lewis et al., 2007; Petrin et al.,
The influence of low pH on macroinvertebrate community composition in acidic waterways associated with coastal lowland acid sulfate soil discharge.
Southern Cross University 2016 11
2008) results vary among studies, with taxa richness, abundance and community composition responses different. Further research is required to understand the specific response of macroinvertebrates to waterway acidification in CLASS-environments.
Current research advocates that as acidification occurs acid-sensitive taxa are replaced with acid-tolerant taxa (Guerold et al., 2000; Lewis et al., 2007; Petrin et al., 2008). Research by Sommer & Horwitz (2001; 2009) indicate that the total number of macroinvertebrate families identified was not reduced by acidification, rather a shift in community composition occurred with the loss of acid-sensitive taxa. In comparison a study by Guerold et al., (2000) found that taxa richness decreased dramatically in low pH environments associated with acidification. Furthermore, a study by Lewis et al, (2007) emphases that macroinvertebrate assemblages varied significantly with pH. While Petrin et al. (2008) found that macroinvertebrate community composition changed in acidified aquatic environments and diversity was impaired. While the major chemical and physical effects of acidification of freshwater ecosystems is understood a conclusion is still to be reached on the specific response by macroinvertebrates to freshwater acidification.
The aim of this study was to determine whether low pH waters associated with acidic-discharge in CLASS-environments affected aquatic macroinvertebrate abundance, taxa richness and community composition in effected waterways. Aquatic macroinvertebrates samples and physico-chemical parameters were collected from Acidic and Neutral sites. Macroinvertebrates samples collected were identified to family level before data was analysed to identify the influence of pH on macroinvertebrates abundance, taxa richness and community composition. This will identify the specific responses of aquatic macroinvertebrates to the relative effects of acidic-discharge in CLASS-environments.

Brendan Cox, 2016
Integrated Project 12
2. Methods
Site Description The lower Richmond River floodplain below Coraki in Northern New South Wales, Australia covers an area of approximately 1070km2 (Eyre et al., 2006). The lower Richmond River floodplain has a sub-tropical climate and receives a high annual rainfall of 1660mm at Broadwater (BOM, 2015) particularly from January to April as tropical cyclones can bring heavy rainfall and flooding. The lower Richmond River floodplain below Coraki has a high occurrence of CLASS (CSIRO, 2012; Ruiz-Halpern et al., 2015). With an average elevation of predominately less than 1m the lower Richmond River floodplain is made up of large backswamps. Tuckean swamp, Sandy Creek, Rocky Mouth Creek, and Bungawalbin Creek(Figure1) make up the major backswamp basins, covering approximately 32% of the floodplain (Wong et al., 2010) and are a major source of acid to the lower Richmond River (Furguson & Eyre, 1999; Cavanagh et al., 2007, Wong et al., 2010; Ruiz-Halpern et al., 2015).
Figure 1. Richmond River and Richmond River Floodplain, Northern NSW, Australia (Source: Australian Severe Weather, 2008).

The influence of low pH on macroinvertebrate community composition in acidic waterways associated with coastal lowland acid sulfate soil discharge.
Southern Cross University 2016 13
The conversion of forests to agricultural lands and the draining of wetlands for flood mitigation works have changed the hydrodynamics of the lower Richmond River floodplain (Cavanagh et al., 2007). Before European settlement floodplain vegetation consisted of rainforest, stands of Swamp Oak (Casuarina glauca), Swamp Mahogany (Eucalyptus robusta), Tee Tree (Melaleuca alternifolia) and sedgelands (Tulau, 1999). All vegetation types with tolerance to waterlogging and inundation (Tulau, 1999; Eyre et al., 2006). The floodplain current dominant vegetation is now open pasture, which has a limited tolerance to inundation and water logging (Wong et al., 2010). The extensive drainage network of open drains and ditches allows for year round agriculture on the floodplain (Tulau, 1999) this has caused a change in the hydrology increasing the rate of exposure of CLASS.
Tuckean Swamp is a coastal floodplain wetland that covers approximately 5000ha and is extensively drained by agricultural and flood mitigation drains (Cornfield, 2000). Before European settlement the Tuckean Swamp had an ecology based on episodic inundation (Cavanagh et al., 2006). The creation of drains to reduce flood peaks and duration have significantly changed the Tuckean Swamp lowering the water table and exposing CLASS (Sammut et al., 1996; Cornfield, 2000; NPWS, 2002; Ruiz-Halpern et al., 2015). Henderson’s Drain the central drain of Tuckean Swamp is formed by the Baggotville barrage where tidal flood gates regulate the flow of water (Sammut et al., 1996; Cornfield, 2000) lowering the water table as well as reducing the tidal influence and salt water inundation. Cattle grazing, tea tree plantations, soy bean and sugar cane production are the major landuses in the Tuckean Swamp area (Wong, et al., 2010). Tuckean nature reserve a large expanse of melaleuca swamp surrounds the central drain and covers an area of around 915Ha within the Tuckean Swamp area (NPWS, 2002). The hydrology, vegetation and landuses of Tuckean Swamp have been highly altered since European settlement.
Significant areas of CLASS also occur in the Bungawalbin, Sandy Creek and Rocky Mouth Creek sub-catchments (Sammut et al., 1995). Rocky Mouth Creek has its head waters in national park and flows through areas of sugar cane production before joining the Richmond River at Woodburn. Bungawalbin Creek also has its head waters in national park before flowing through areas used mostly for tea tree cultivation. Sandy Creek a tributary of the Bungawalbin, drains a large area of floodplain south of casino on the southern side of the Richmond River (Owers, 2005). Before artificial draining the Sandy Creek area was part of an extensive open wetland swamp system containing large areas of semi-permanent water bodies (Owers, 2005). Over the past 100 years this has been converted to predominately cattle grazing lands with some sugar cane production in the lower reaches. Agricultural landuses and artificial drainage have highly altered the hydrology of the lower Richmond River floodplain.
Sampling sites The study encompassed twelve sites located within the lower Richmond River floodplain below Coraki (Figure 2). Eight sites situated within Tuckean Swamp area, two sites were located on Sandy Creek and one site on both Bungawalbin

Brendan Cox, 2016
Integrated Project 14
and Rocky Mouth Creeks (Table 1). Sites were selected for their location within known CLASS hotspots. The Sites selected were classified as either Acidic (pH <6) or Neutral (pH >6) with an equal number of sites from both classes, allowing statistical comparisons to be made. Neutral sites were selected as reference sites, as they were determined as least disturbed by acidification, this was based on pH as the key water quality indicator to the occurrence of acidification. At each site physico-chemical properties were measures and macroinvertebrates samples.
Figure 2. Location of Tuckean Swamp, Sandy Creek, Bungawalbin Creek and Rocky Mouth Creek study sites within lower Richmond River floodplain, Norther east NSW, Australia.
Table 1. Site, Stream Name, GPS location and pH of studied sites within the lower Richmond River floodplain below Coraki, NSW, Australia. (* denotes Tuckean Swamp sites)
Site Stream Name GPS Location pH Acidic/ Neutral
001 Stoney Island Drain Upper* 28⁰57'03.9"S 153⁰22'06.6"E 7.26 Neutral
002 Stibbards Creek* 28⁰58'48.6"S 153⁰22'11.1"E 6.76 Neutral
003 Tucki Drain* 28⁰57'54.1"S 153⁰21'52.0"E 6.72 Neutral
004 Paperbark Swamp Drain* 28⁰55'21.1"S 153⁰22'20.2"E 3.05 Acidic
005 Hendersons Drain* 28⁰57'16.8"S 153⁰23'04.7"E 3.73 Acidic
006 Stoney island Drain Lower* 28⁰57'10.6"S 153⁰22'47.0"E 4.29 Acidic
007 Rocky Mouth Creek 29⁰05'45.2"S 153⁰19'24.7"E 4.85 Acidic
008 Bungawalbin Creek 29⁰05'52.4"S 153⁰13'41.3"E 7.10 Neutral
009 Sandy Creek 29⁰01'18.7"S 153⁰14'00.7"E 5.66 Acidic
010 Sandy Creek 29⁰01'25.8"S 153⁰13'53.9"E 6.39 Neutral
011 Stibbards Creek* 28⁰58'43.5"S 153⁰20'55.5"E 7.33 Neutral
012 Baggotville Barrage* 28⁰58'44.1"S 153⁰24'18.3"E 5.84 Acidic

The influence of low pH on macroinvertebrate community composition in acidic waterways associated with coastal lowland acid sulfate soil discharge.
Southern Cross University 2016 15
Field measurements Field work was carried out between the 27th of October and the 15th of December 2015. At each study site field observations were taken including: land use, riparian condition, water shading (%), water odour and oils, turbidity, flow level, current velocity and local catchment erosion. Once observations were recorded physico-chemical measurements were carried out. pH was measured using a Eutech pH 5+ probe, conductivity and water temperature were measured using a Eutech Esoscan Con 6 conductivity probe. All instruments were calibrated before use. Dissolved Oxygen(DO) (mg/l) was measured using a DO titration kit and converted to DO% saturation. Water samples from surface water were also collected at each site in rinsed plastic bottles, frozen and sent to the Environmental Analysis Laboratory at Southern Cross University, Lismore for acid sulfate water testing for a range of water quality parameters associated with acidified waters. Analyses included: pH, conductivity, dissolved Iron, dissolved aluminium, dissolved chloride and sulfate, chloride: sulfate ratio and titratable acidity.
Macroinvertebrates To investigate the effects of acidification on taxa richness, abundance and community composition, aquatic macroinvertebrates were collected from 12 sites using a triangular dip net with a basal length of 350mm (250-micron net size). A total of 10m of aquatic habitat was sampled at each site, ensuring a broad range of sub-habitats were sampled as recommended by Gooderham et al. (2010) agreed level taxonomic method. The Sub habitats sampled were boulder/cobble/course substrate, sand/silt deposition areas, bare edge, leaf pack, wood/snags and aquatic plants, the percentage of each sub habitat sampled was recorded (Appendix A). Live picking of samples in the field was conducted for 40 minutes by two people, by placing collected samples into large shallow white trays, with macroinvertebrates picked from the sample using, forceps, pipettes and spoons. Picked macroinvertebrates were placed in 70% ethanol for storage for identification at a later date in the laboratory.
In the Laboratory macroinvertebrate identification was carried out with the aid of a stereomicroscope with photos taken where possible (Appendix B). Using the Murry Darling Freshwater Research Centres Bug Guide (MDFRC, 2013), appropriate identification keys (Gooderham & Tsyrlin, 2002) and other guides (Hawking & Smith, 1997) macroinvertebrates were identified to family level. Once identification was made data was recorded on bug data sheets. Macroinvertebrates were assigned a SIGNAL 2 sensitivity grade (Chessman, 2003), SIGNAL 2 scores (Appendix C) and Shannon-Weiner Diversity Index were then calculated for each site. To identify the effects of acidification in macroinvertebrate community composition T-tests were performed to compare abundance, taxa richness and diversity indexes between Acidic and Neutral sites to identify if any significant difference between the two groups existed.

Brendan Cox, 2016
Integrated Project 16
3. Results
Water Quality Sites ranged from highly acidic to neutral as shown in Figure 3. Acidic sites had an average pH of 4.57, with a minimum pH of 3.05 and a maximum pH of 5.84. Neutral sites had an average pH of 6.93, with a minimum pH of 6.39 and a maximum pH 7.33. Low Dissolved Oxygen(DO) was observed at a majority of sites (Figure 3) with only sites eleven and twelve having DO levels within recommended values. ANZECC (2000) set a trigger value for DO (% saturation) between 85 and 110% a majority sites were outside the recommended values. Water temperature was mostly consistent across sites. Moderate water levels were observed at all sites with low flow velocities also observed.
Figure 3. DO% saturation, water temperature and pH from study sites sampled, lower Richmond River floodplain, NSW, 2015.
The results of t-tests performed to identify if a difference in water quality parameters occurred between sites classified as Acidic and Neutral are shown in Table 2. Between classes pH was significant difference with pH significantly lower at Acidic sites. There was not a significant difference in DO% between Acidic and Neutral sites. Conductivity ranged from 107 to 2260µs just outside the ANZECC (2000) water quality guidelines of 120 - 2200µs (Appendix D). and was not significantly different between classes. Field observations (Appendix E) identified Acidic sites within Tuckean Swamp were suffering from crystal clear waters.
0
20
40
60
80
100
120
0
1
2
3
4
5
6
7
8
DO
%, W
ater
Tem
p(⁰
c)
pH
Site
Water Temperature (⁰C) DO % pH
Acidic Neutral
4 5 6 7 9 12 10 3 2 8 1 11

The influence of low pH on macroinvertebrate community composition in acidic waterways associated with coastal lowland acid sulfate soil discharge.
Southern Cross University 2016 17
Table 2. Results of t-test analysis preformed water quality measurements collected from study sites within the lower Richmond River floodplain, Northern NSW, Australia.
Min Max n Mean SD df t p
pH 10 5.0107 0.0005 Acidic 3.05 5.84 6 4.57 1.0931 Neutral 6.39 7.33 6 6.93 0.3639
Conductivity (µs) 10 1.3127 0.2463 Acidic 170.4 2260.0 6 715.46 848.24 Neutral 107.4 493.0 6 253.95 148.82
DO% Acidic 12 101 6 62.00 2.62 10 0.5279 0.6091 Neutral 25 113 6 71.17 2.57
The results from the water chemistry analysis performed on water samples collected at each site are shown in Table 3. Chloride measurements are generally consistent across sample sites and are within an acceptable range for freshwater ecosystems. To compare water chemistry data t-tests were performed the results are shown in Table 4. Chloride levels were not significantly different between classes. Sulfate levels were higher at Acidic sites with an average concentration of 280.92mg/L. Neutral sites had an average sulfate concentration of14.69mg/L, sulfate concentrations were all below those of Acidic Sites. Acidic sites four and seven had very high sulfide levels of 1281mg/L and 237 mg/L respectively effecting the variance in the t-tests. As a result of large variances in data, result for sulfate levels were not significantly different across classes, though sulfate levels are clearly lower at Neutral sites. The Chloride: sulfate ratio was much lower at Acidic sites statistical tests reflect this with significantly difference in chloride: sulfate ratio between classes. Low ratios are an important indicator to the existence of sulfates as a result of sulfide oxidation in CLASS-environments.
Table 3. Acid sulfate water analysis results from Environmental Analysis Laboratory, Lismore, from lower Richmond River floodplain, NSW, 2015.
Acidic/ Neutral
Site pH Chloride (mg/L)
Sulfate (mg/L)
Chloride: sulfate ratio
Dissolved iron (mg/L)
Dissolved aluminum (mg/L)
Acidic 4 3.05 66.6 1281 0.1 24.400 105.000
Acidic 5 3.73 21.2 62 0.3 0.814 3.001
Acidic 6 4.29 23.0 32 0.7 0.174 0.978
Acidic 7 4.85 199.0 237 0.8 0.073 0.401
Acidic 9 5.66 22.5 26 0.9 0.930 0.157
Acidic 12 5.84 43.0 47 0.9 0.026 0.011
Neutral 10 6.39 20.0 23 0.9 1.003 0.086
Neutral 3 6.72 13.2 11 1.2 0.054 0.007
Neutral 2 6.76 27.2 9 2.9 0.113 0.026
Neutral 8 7.09 52.0 9 5.8 0.039 0.011
Neutral 1 7.26 72.1 20 3.7 0.020 0.004
Neutral 11 7.33 109.2 16 6.7 0.108 0.024

Brendan Cox, 2016
Integrated Project 18
Table 4. Results of t-test analysis preformed water quality measurements collected from study sites within the lower Richmond River floodplain, Northern NSW, Australia (Min, Max and Mean values are all in mg/L).
Min Max n Mean SD df t p
Chloride (mg/l) 10 0.4266 0.6808 Acidic 21.2 199.00 6 62.55 69.131 Neutral 20.0 109.00 6 48.91 36.716
Sulfate (mg/l) 10 1.3139 0.2459 Acidic 25.7 1218.00 6 280.92 496.298 Neutral 9 23.00 6 14.69 5.82
Chloride: sulfate Ratio 10 2.9807 0.0307 Acidic 0.050 0.90 6 3.53 0.3462 Neutral 0.900 6.70 6 0.62 2.3672
Dissolved iron (mg/l) 10 1.0435 0.3404 Acidic 0.030 24.40 6 4.402 9.8042 Neutral 0.020 1.00 6 0.222 0.3840
Dissolved aluminum (mg/l) 10 1.0506 0.3415
Acidic 0.010 105 6 18.258 42.5088
Neutral 0.004 0.086 6 0.0263 0.0305
Dissolved iron and aluminium concentrations were considerably higher at Acidic sites. The average iron concentration at Acidic sites was 4.4mg/L compared to 0.22mg/L at Neutral sites. Iron concentrations were not significantly different between classes (Table 4). As seen in Table 3 iron levels were noticeably lower at Neutral sites with concentrations varying greatly across sites. Levels of dissolved aluminium varied greatly across all sites with concentrations visibly higher at Acidic sites. Acidic sites had an average aluminium concentration of 18.26mg/L compared to Neutral sites with an average concentration of 0.03mg/L. Aluminium concentrations were not significantly different between classes (Table 4). ANZECC (2000) sets a trigger for aluminium of 0.055mg/L in waters with a pH>6.5 and has no trigger for waters with a pH<6.5 as low pH waters are known to increase dissolved metal concentrations. All sites with a pH > 6.5 have acceptable concentrations of dissolved aluminium. Dissolved iron and aluminium concentrations were considerably higher at Acidic sites.
All Acidic sites have high dissolved aluminium and iron concentrations well exciding Neutral sites, though no significant difference between classes was identified. Acidic Site four had greatly elevated concentrations of dissolved metals, sulfates and a very low chloride: sulfate ratio due to its significantly low pH, this effected statistical analysis performed by creating large variances in the data. The sulfate and chloride levels at site seven were also greatly elevated effecting statistical analyses preformed. Variances in data have effected statistical analysis resulting in the lack of a significant difference between classes.
The results of a Principal Component Analysis (PCA) preformed to analyse the influence that water quality variables had on the study sites is shown in Figure 4. The environmental variables most influencing study sites are overlain on the ordinations with the vectors showing the direction of the maximum correlation.

The influence of low pH on macroinvertebrate community composition in acidic waterways associated with coastal lowland acid sulfate soil discharge.
Southern Cross University 2016 19
the longer they are the stronger the correlation. The PCA results indicated that with the exception of temperature all measured parameters have a comparable influence upon sites. Further examination shows a similar influence of dissolved iron, dissolved aluminium and sulfate on sites and that they are likely linked. The results also identified a possible relationship between pH, DO and chloride and that all had a significant influence upon sites. Temperature was not very influential on sites as values were similar. The number of sites is on the lower limit reducing the robustness of the PCA.
Figure 4. PCA identifying influence of water quality variables on study sites, lower Richmond River floodplain, Northern NSW, Australia.
Macroinvertebrates Overall, a total 942 individual aquatic macroinvertebrates were identified across the twelve study sites sampled, from 33 separate family taxa (Table 5) belonging to 12 orders. The composition of the macroinvertebrate community at each study site at family level was compared. Several major differences were seen in community composition showing that low pH associated with acidification in CLASS-environments has led to a change. Hypogastruridae, Notonectidae, Mesoveliidae, Veliidae and Corixidae were found in greater abundance at Acidic-sites though still present in significant numbers at Neutral sites. These taxa are acid-tolerant since they were identified in abundance at Acidic sites. Dytiscidae were the most abundant taxa identified occurring at high numbers across a majority of both Acidic and Neutral sites. Several taxa were identified exclusively at Acidic sites including; Hypogastruridae, Curculionidae, Crambiidae, Hydrometridae and Aeshnidae. With exception of Aeshnidae, taxa identified only at Acidic sites were not significantly abundant, Aeshnidae was the only taxa identified in significantly high abundance in Acidic sites only. Taxa identified only at acidic sites are highly acid-tolerant and from the results are better adapted to survive in low pH aquatic environments.

Brendan Cox, 2016
Integrated Project 20
Several family taxa appear to be moderately acid-sensitive since they are present at sites with varying pH but are in higher abundance at Neutral sites. Lestidae, Chironomidae and Acarnia(Mites) were identified across both Acidic and Neutral sites, they were significantly more abundance at Neutral sites. Numerous family taxa were identified exclusively at Neutral sites in significant numbers, symptomatic of highly acid-sensitive taxa. Sphaeromatidae, Naucoridae, Baetidae, Atyidae, Parastacidae, Leptoceridae and Oligochaeta. Gomphidae and Pleidae. Corullanidae, Cordullidae, Culicidae were identified exclusively at Neutral sites though not in significant numbers. The most significant finding was the non-occurrence of Atyidae at Acidic sites, and its significantly high abundance across Neutral sites implying its high acid-sensitivity.
Table 5. Macroinvertebrate community composition of study sites, lower Richmond River floodplain, Northern NSW, Australia, 2015.
Family
Sites 4 5 6 7 9 12 10 3 2 8 1 11
SIGNAL 2 Grade
Acidic Neutral
Acanaina 6 5 1 10 31 29 8
Leptoceridae 6 1 3
Baetidae 5 12
Veliidae 5 10 4 45 6 12 1 4 5 8 2
Cordullidae 5 3
Gomphidae 5 1
Parastacidae 4 1
Nepidae 4 1 1 2
Gerridae 4 1 1 2 1
Aeshnidae 4 71
Atyidae 3 15 12 12 17 8
Chironomidae 3 2 4 3 1 7 2 5 19
Hydrometridae 3 1
Isostictidae 3 3 1 1
Hydrophilidae 2 20 1 2 1 1
Dytiscidae 2 99 31 33 2 6 17 8 16 37
Curculionidae 2 1
Corullanidae 2 21
Mesoveliidae 2 1 25 9 3 1
Pleidae 2 3
Corixidae 2 28 2 1
Naucoridae 2 3
Crambiidae 2 1 1
Coenugrionidae 2
Pisauridae 1 2 1 1 1 1 2 1 1
Hypogastruridae 1 31 4
Culicidae 1 1 Notonectidae 1 10 2 2 21 1 7
Belostomatidae 1 1 2 6 1 2 3 3
Sphaeromatidae 1 5 1
Lestidae 1 1 7 2 1 1 4 15 6 15
Libellulidae 1 1 3 1 1
Oligochaeta 6 2

The influence of low pH on macroinvertebrate community composition in acidic waterways associated with coastal lowland acid sulfate soil discharge.
Southern Cross University 2016 21
The macroinvertebrate community composition identified to order level is shown in Figure 5. Order level identification shows a change in the community composition between Acidic and Neutral sites with Lepidoptera and Collembola only identified at Acidic sites, signifying there them as acid-tolerant. Decapoda, Isopoda, Ogochaeta and Trichoptera are recognized as acid-sensitive as they were only identified at Neutral sites. Hemiptera was the only order found at all sites while Acanaina was found at both classes of site but was in much higher abundance at Neutral sites. Coleoptera the most abundant across all sites. Community composition at order level differed across sites with a definite difference seen between Acidic and Neutral sites.
Figure 5. Macroinvertebrate community composition at order level, from study sites, lower Richmond River floodplain, Northern NSW, Australia, 2015.
Abundance and taxa richness of aquatic macroinvertebrates identified following sampling from the twelve study sites are presented in Figure 6. Abundance varied significantly between individual sites with Site twelve having the lowest abundance with just 12 individuals identified, while Site four had the highest abundance with 161 individuals identified, both these sites are classed as Acidic. There was no significant difference in abundance between classes (Table 6). Taxa richness varied across sites with Site seven and twelve both
0
1
2
3
4
5
6
7
8
0%
10%
20%
30%
40%
50%
60%
70%
80%
90%
100%
004 005 006 007 009 012 001 002 003 008 010 011
Site
pH
Co
mm
un
ity
Stru
ctu
re (
ord
er)
Lepidoptera
Oligochaeta
Trichoptera
Isopoda
Ephemeroptera
Collembola
Diptera
Decapoda
Acanaina
Odonata
Hemiptera
Coleoptera
pHAcidic Neutral

Brendan Cox, 2016
Integrated Project 22
classed as Acidic sites having the lowest taxa richness with only 6 family taxa identified, Site one had the highest taxa richness with 15 family taxa identified. Taxa richness was not significantly different between classes (Table 6). Taxa richness and abundance of macroinvertebrates at study sites was not effected significantly.
Figure 6. Abundance and Taxa Richness of macroinvertebrates collected at study sites, lower Richmond River floodplain, Northern NSW, Australia
Table 6. Results of T-test analysis preformed on macroinvertebrate abundance and taxa richness date collected from study sites within the lower Richmond River floodplain, Northern NSW, Australia
Min Max n Mean SD df t p
Abundance 10 0.4286 0.6773 Acidic 11 161 6 84.5 62.385 Neutral 49 110 6 72.5 28.468
Taxa Richness 10 0.4285 0.6773 Acidic 6 13 6 8.5 2.888 Neutral 7 15 6 10.7 3.445
Results of diversity index calculations used to identify a change in community composition are presented in Figure 4. Site seven which was acidic had the lowest Shannon-Weiner Diversity Index score of 0.79. Site eight being a Neutral site had the highest Shannon-Weiner Diversity Index score with a score of 3.05. Site five had a SIGNAL 2 score of 1.64 the lowest score calculated and was an Acidic Site. The highest SIGNAL 2 score calculated was Site eight with a score of 3.05 and was a Neutral site.
0
1
2
3
4
5
6
7
8
9
0
20
40
60
80
100
120
140
160
180
4 5 6 7 9 12 10 3 2 8 1 11
pH
Ab
un
dan
ce, R
ich
nes
s
Site
Richness Abundance pH
Acidic Neutral

The influence of low pH on macroinvertebrate community composition in acidic waterways associated with coastal lowland acid sulfate soil discharge.
Southern Cross University 2016 23
Figure 7. SIGNAL 2 Score and Shannon-Weiner diversity index scores at study sites, lower Richmond River floodplain, Northern NSW, Australia
To determine if low pH associated with acidic-discharge within CLASS-environments effected macroinvertebrate diversity (an indicator of community composition change) paired-sample t-tests were conducted (Table 3). A significant difference was seen in Shannon-Weiner diversity index with Neutral sites scoring higher. There was a significant difference in SIGNAL 2 scores with Neutral sites having higher scores. Significantly higher SIGNAL 2 scores were recorded for Neutral sites, these scores are very low in terms of SIGNAL 2 scores. A score out of 10 is possible for SIGNAL 2 score, the highest score was calculated for site eight though this was only 3.05, but on average Neutral sites had a score of 2.85 while Acidic sites had an average score of 2.16 and as low as 1.64. When comparing the effects of pH on these diversity indexes (Figure 4) a relationship between pH and SIGNAL 2 scores is seen with the scores increasing with pH with an R2 value of 0.677, the relationship between pH and Shannon-Weiner Diversity index is less strong with an R2 value of 0.498.
Table 3. Results of t-test analysis preformed on macroinvertebrate diversity calculations.
Min Max n Mean SD df t p
SIGNAL 2 scores 10 3.806 0.007 Acidic 1.64 2.71 6 2.15 0.395 Neutral 2.54 3.05 6 2.84 0.201
Shannon-Weiner 10 3.105 0.011 Acidic 0.79 1.60 6 1.26 0.329 Neutral 1.50 2.19 6 1.83 0.311
0
1
2
3
4
5
6
7
8
4 5 6 7 9 12 10 3 2 8 1 11
pH
, Div
ersi
ty
Site
Shannon Weiner SIGINAL Score pH
NeutralAcidic

Brendan Cox, 2016
Integrated Project 24
Figure 4. Scatterplot of pH vs SIGNAL 2 score and Shannon-Weiner Diversity Index in the Lower Richmond River floodplain below Coraki, NSW.
The SIGNAL 2 bi-plot (Figure 5) shows a majority of sites are within quadrat 4 which is characterised by streams affected by industrial, urban or agricultural pollution. These pollution sources are all major anthropogenic sources of pollution. The results of the bi-plot suggest that acidification has the same effect as those created by humans. A significant difference between Acidic and Neutral for both Shannon Weiner diversity Index and SIGNAL 2 scores establish a change in macroinvertebrate community composition has occurred. The data analysis shows that neither abundance or taxa richness was significantly different when comparing Acidic and Neutral sites.
Figure 5. SIGNAL 2 Bi-plot, Lower Richmond River floodplain below Coraki, NSW. with blue representing Acidic sites and orange representing Neutral sites.
R² = 0.6774
R² = 0.4988
0.00
0.50
1.00
1.50
2.00
2.50
3.00
3.50
0.00 1.00 2.00 3.00 4.00 5.00 6.00 7.00 8.00
Div
ersi
ty S
core
s
pHSIGINAL Score Shannon Weiner
0.00
1.00
2.00
3.00
4.00
5.00
6.00
7.00
0 2 4 6 8 10 12 14 16 18 20
SIG
INA
L2 S
core
(Fa
mily
)
Number of macroinvetebrate famlies
SIGNAL 2 Score
Quadrant 3
Quadrant 4
Quadrant 1
Quadrant 2

The influence of low pH on macroinvertebrate community composition in acidic waterways associated with coastal lowland acid sulfate soil discharge.
Southern Cross University 2016 25
4. Discussion
Water Quality Isolating lowered pH as the main environmental factor in the macroinvertebrate community composition change identified by this study is not confirmed. The result of water quality analyses show several key water quality parameters associated with acidification can affect macroinvertebrate community composition in CLASS-environments. Several key water quality factors appear to be involved in the community composition change identified lowered pH, significantly higher levels of dissolved metals specifically aluminium and iron, and low chloride: sulfate ratios may all have affect macroinvertebrate community composition. pH and dissolved metal concentration have the greatest effect on community composition in acidified waters (Cornfield, 2000). This study has identified that acidification causes community change rather than specifically low pH, due to the major water quality issues associated with acidification in CLASS-environments.
Dissolved metals specifically iron and aluminium were found in higher concentrations at Acidic sites, as expected to occur in waterways affected by acidification. The effects of high metal concentrations are well understood and known to cause macroinvertebrate community composition change (Sommer & Horwitz, 2001). Chloride: sulfate ratio is valuable to assess whether elevate sulfate levels have been derived from exposure to acid sulfate soils. Elevated levels of sulfate ions relative to chloride ions indicates the presence of acid sulfate soils (Mulvey, 1993). A ratio of less than four and definitely less that two is a strong indicator to the source of sulfate is from sulfide oxidation (Mulvey, 1993) such as those in CLASS-environments. Acidic sites have a ratio below one advocating their acidification by pyrite oxidation.
Dissolved oxygen is a significant water quality parameter when assessing aquatic ecosystem health (ANZECC, 2000). The lack of a significant difference in dissolved oxygen levels between site classes suggests that dissolved oxygen is not a significant factor in the community change seen in this study. Low dissolved oxygen is of concern and represents a significant concern for the health of the waterways sampled during this study. Low dissolved oxygen however appeared not to be significant factor in the community composition change identified.
Acidification has a major effect on the aquatic plant community within acidified waterways. The Cape waterlilies (Nymphaea caerulea) was prevalent at all effected sites. Nymphaea caerulea is a major introduced aquatic weed found within acidified systems across NSW and Queensland (Griffith et al., 2003). Nymphaea caerulea is both highly aluminium and acid tolerant making it proficient at surviving and thriving in acidified waterways (Sammut et al., 1995) within CLASS-environments displacing similar native species. Acidification causes alterations in aquatic plant communities towards a simpler suite of acid and aluminium tolerant plants (Ferguson & Eyre, 1999).
The dissolved oxygen concentration at Site nine was recorded at 12% significantly lower than all other sites. The likely explanation for this is a

Brendan Cox, 2016
Integrated Project 26
possible black water event mobilising MBOs causing deoxygenation of Sandy Creek. With heavy rains the week before sampling disturbing accumulated MBOs known to occur in the upper reaches of Sandy Creek (Bush et al., 2004). The high abundance of Hypogastruridae which are found in waterways following rain events (Gooderham & Tsyrlin, 2002) is evidence of rains significant enough to cause disturbance of MBOs upstream of Site nine. MBOs are mobilized during heavy rain events causing severe and rapid deoxygenation of waterways, this had no effect on the macroinvertebrate community composition with the highest taxa richness and SIGNAL 2 score of any Acidic site being recorded. Further investigation in to the effect of MBO mobilisation and macroinvertebrate community composition is needed to understand the impact of such events.
Macroinvertebrates Results showed that waterway acidification associated with acid-discharge in CLASS-environment had no significant effect on the abundance or taxa richness of macroinvertebrate, rather a change in macroinvertebrate community composition was identified. The lack of any significant difference in abundance and taxa richness may be the result of adaption of aquatic macroinvertebrates to low pH environments. A change from acid-sensitive taxa to acid tolerant taxa is a result of waterway acidification (Sommer & Horwitz, 2001). The macroinvertebrate community conceivably will have had sufficient time to adapt to low pH conditions, if low pH environments have persisted for a prolonged time period (Petrin et al., 2008). The Tuckean swamp has had issues with waterway acidification for decades (DeWeys et al., 2010) as a result aquatic macroinvertebrate community has had time to adapt to the low pH environment that now exists. A shift in community composition is a result of long term waterway acidification (Petrin et al., 2008).
Acidic environments are inhabited by acid-tolerant taxa adapted to survive in low pH environments (Guerold et al., 2000; Lewis et al., 2007; Petrin et al., 2008). A significant adaption by aquatic macroinvertebrates is the ability to breathing surface oxygen rather than through gills allowing survival in highly acidic waters (Ward & Tockner, 2001; Sommer & Horwitz, 2009). Acid-sensitive taxa tend to be highly permeable (Havas & Advokaat, 1995) taxa such as Atyidae for example. Predatory taxa tend to be tolerant to low pH due to their bodies being highly impermeable such as Dytiscidae and Notonectidae (Havas & Advokaat, 1995). Adaptions allow acid-tolerant taxa to survive in acidified waterways in CLASS-environments.
Dytiscidae were the most abundant family taxa identified, found in significant numbers at both Acidic and Neutral sites. They are known to inhabit acidic areas (MDFRC, 2013), with a SIGNAL 2 sensitivity grade of 2 they are very tolerant to pollution such as acidification. Dytiscidae are predatory feeders with well-developed wings giving them the ability to find habitats with a sufficient food source (Gooderham & Tsyrlin, 2002). Site four had the highest abundance of Dytiscidae and the lowest pH (3.05). Dytiscidae are from the order Coleoptera which due to their form are able to survive in many different habitats (Gooderham & Tsyrlin, 2002). Coleoptera are characterised by their hard

The influence of low pH on macroinvertebrate community composition in acidic waterways associated with coastal lowland acid sulfate soil discharge.
Southern Cross University 2016 27
impermeable wing covers and sclerotisation of their abdomen and thorax, their ability to fly allows them disperse to new habitats (Gooderham & Tsyrlin, 2002). Dytiscidae are highly adapted to survive in highly acidic waterways with hard impermeable bodies due to the predatory nature.
The most significant result at a family taxonomic level was the lack of Atyidae at Acidic sites. Atyidae which was highly abundant at Neutral sites, did not occur at Acidic sites. The lack of family Atyidae from Acidic sites indorses their sensitivity to low pH although they have a SIGNAL 2 grade of 3 making them quite tolerant of pollution. Atyidae from the order Decapoda are affected by low pH associated with acidification (Powell & Martens, 2005). Atyidae are detritivores and herbivores (Janssens de Bisthoven et al., 2006), feeding on plant and animal detritus as well as bacteria and algal particles, they mostly gather food particles of rocks and plants (MDFRC, 2013). Metals in toxic quantities in organic matter, coating plant and leaf material and on rocks in acidified waterways in CLASS-environments cause may result in the loss of Atyidae. Their food source is effected by toxic levels of metal contamination, specifically caused by the flocculation of aluminium in acidic waters (Furguson & Eyre, 1999; Simpson et al., 2010). These results may identify Atyidae as a potential indicator taxa of acidification (Sommer & Horwitz, 2009). Decapoda are known to be useful indicators of aquatic ecosystem degradation (Gooderham & Tsyrlin, 2002; Janssens de Bisthoven et al., 2006). Further research would be required to fully understand their role as an indicator to waterway acidification in CLASS-environments.
Acidification of waterways by acidic-discharge from acid sulfate soil is a natural process (Bigham et al., 1996). In Class-environments this natural process has been exacerbated by anthropogenic activity (White et al., 1997; Sullivan & Bush, 2004). Biota may be adapted to natural acidification, therefore adaption to acidification from acidic-discharge may explain the lack of any significant difference in the macroinvertebrate taxa richness and abundance identified. Petrin et al., (2008) in their study comparing the effects of natural acidification compared to anthropogenic acidification of waterways found that anthropogenic acidification caused a change in the aquatic community, while natural acidification caused little change in the taxa richness and abundance of biota though a change in families was identified. This may go some way in explaining the lack of any significant difference seen in abundance and macroinvertebrate taxa richness.
Community Composition Macroinvertebrate community composition is challenging to compare in a meaningful way. The use of diversity indexes such as the Shannon Weiner Diversity Index gives a statistical value to diversity allowing for comparisons to be made. The Shannon-Weiner Diversity Index is commonly used to calculate aquatic biodiversity (Mandaville, 2002). By comparing the proportion of individuals to the taxa in the community and the total number of taxa in the community the diversity can be calculated (Mandaville, 2002). The significantly higher scores at Neutral sites is verification that a change in macroinvertebrate community composition has occurred. As scores are significantly higher at

Brendan Cox, 2016
Integrated Project 28
Neutral sites it can be reasoned that this constitutes a change in the macroinvertebrate community composition and is a key indicator of the change identified by this study.
More significant are the SIGNAL 2 scores which showed that the community within Neutral sites comprised macroinvertebrate families that have a higher SIGNAL 2 sensitive grade. This means that the families are more sensitive to pollution, the significantly higher SIGNAL 2 scores at Neutral sites indicates a change in the community composition caused by low pH, high dissolved metals and low chloride: sulfate ratios as a result of acidification within a CLASS-environments. The results of Siginal2 bi-plot suggest that all sites are suffering from some sort of human induced pollution and water quality data gives little insight to why this is the case (Chessman, 2003). The placement within the bi-plot of a majority of sites in to quadrant four advocates that the sites are all significantly impaired by pollution. The results Suggests that impairment is causing reduction in both taxa richness and SIGNAL 2 scores.
The effectiveness of the Siginal2 scores as an indicator of acidification in CLASS-environments is brought in to question. The relationship between pH and SIGNAL 2 scores shows that scores were significantly influenced by pH. Other water quality issues also may have played a significant role as seen in the results of the PCA, statistical tests and water quality data. Signal 2 uses water-quality sensitives of taxa to give a score of ecological impairment (Chessman, 2003) with zero being severely impaired and ten being a waterway in natural condition. SIGNAL 2 water-quality sensitive values were created using water temperature, turbidity, electrical conductivity, alkalinity, pH, dissolved oxygen, total nitrogen and total phosphorus levels as the key indicators of water-quality (Chessman, 2003). The water-quality issues associated with acidification in CLASS-environments such as high dissolved metals and sulfate levels were not considered. The validity of Siginal2 scores in this context are therefore questionable and while a relationship between pH and Siginal2 scores was established this is not enough to isolate pH as the sole driver in macroinvertebrate community composition change.
Limitations The inability to isolate effects from the influence of other environmental variables from low pH associated with acidification may have reduced the effectiveness of results. A confounding factor not considered by this study is the nutrient content of the water at study sites, this data would help to identify pH as the driving factor in community composition change. Other pollution sources may be present the impact of which may have effected results (Wright & Burgin, 2009). Discrimination of pH from natural variation in water quality is required to give ecological relevance to the community composition change identified in this study.
Sampling, picking and identifying aquatic macroinvertebrates requires experience and knowledge to be conducted successfully (Metzeling et al., 2003). The live picking of samples may result in cryptic and small taxa being over looked (Chessman, 2002) which may have reduced the effectiveness of this study. Identification errors may have occurred a satisfactory set of

The influence of low pH on macroinvertebrate community composition in acidic waterways associated with coastal lowland acid sulfate soil discharge.
Southern Cross University 2016 29
procedures for quality assurance and quality control would be required if a larger scale study was to be conducted, to insure results are accurate (Mandaville, 2002).
The use of observations rather than measurements has reduced the ability to identify water transparency as a factor in the community change identified. The use of scientific instruments to get a numerical value of water transparency would allow for its effects to be quantified. Measuring turbidity with a Secchi-disk (Fuller et al., 2004), or measuring total suspended solids would be a better method than using qualitative measurements. Current velocity would have been better as a quantitative measurement with the use of a flow meter rather than an objective observation. The use of specific scientific instruments to gain numerical data would increase the effectiveness of results.
5. Conclusion
The aim of this study was to identify the effect of low pH caused by acidic-discharge in CLASS-environments on macroinvertebrate community composition, abundance and species richness. This study highlights acidification and its associated water quality issues are a cause of aquatic macroinvertebrate community composition rather than pH alone. Acidification of freshwater ecosystems in CLASS-Environments occurs as a result of drainage-induced oxidation of sulfides in formerly waterlogged, sulfidic soils (White et al., 1997; Burton et al., 2007). Low chloride: sulfate ratio, low pH, high dissolved iron and aluminium all infer the that the Acidic sites are suffering from acidic-discharge induced acidification in CLASS-environments. Discrimination of pH from natural variation in water quality is required to give ecological relevance to the community composition change identified in this study. Low pH effects macroinvertebrate community composition though other acidification associated water quality parameters also have an effect.
Waterway acidification had no effect on the taxa richness and abundance of aquatic macroinvertebrates in CLASS-environments. A change in macroinvertebrate community composition as a result of acidification was identified using diversity indexes. The community composition change identified was from acid-sensitive taxa at Neutral sites to acid-tolerant taxa at Acidic sites. Acid-tolerant taxa have adaptions allowing them to survive in the low pH environments such as the ability to breath atmospheric oxygen rather than dissolved oxygen through gills. Predatory taxa such as Dytiscidae and Notonectidae tend to be acid-tolerant while detritivores such as Atyidae tend to be acid-sensitive. Abundance and taxa richness are not effected by acidic discharge however a change in the macroinvertebrate community composition occurs as a result of acidification. The complex association between acidification of freshwater ecosystems in CLASS-environments and macroinvertebrate community composition change requires further research to fully understand the significances.

Brendan Cox, 2016
Integrated Project 30
6. References
Backer, J.P. & S.W Christenses. (1991). Effects of acidification on biological communities in aquatic ecosystems. In D.F. Charles & S. Christie(Ed.), Acidic deposition and aquatic ecosystems. New York: Springer-Verlag.
ANZECC. (2000). Australian and New Zealand Guidelines for Fresh and Marine Water Quality. Volume 1, The Guidelines. Australian and New Zealand Environment and Conservation Council and Agriculture and Resource Management Council of Australia and New Zealand. Canberra.
Bae, Y.J., Kil, H.K., & Bae, K.S. (2005). Benthic macroinvertebrates for uses in stream biomonitoring and restoration. KSCE Journal of Civil Engineering, 9, 55 – 63.
Baldigo, B.P. & Lawerence G.B. (2001) Effects of stream acidification and habitat on fish populations of a North America river. Aquatic Sciences, 63, 196 – 222.
Bigham, J.M., Schwertmann, U., Traina, S.J., Winland, R.L. & Wolf, M. (1996) Schwertmannite and the chemical modelling of iron in acid sulfate waters. Geochimica et Cosmochimica Acta, 60, 2111 – 2121.
BOM. (2015) Climate Statistics for Australian locations. Retrieved 24/12/2015 from http://www.bom.gov.au/jsp/ncc/cdio/cvg/av
Bonada, N., Prat, N., Resh, V.H. & Statzner, B. (2006). Developments in aquatic insect biomonitoring: a comparative analysis of recent approaches. Annual Review of Entomology, 51, 495 – 523.
Burton, E.D., Bush, R.T & Sullivan L.A. (2006). Sedimentary iron geochemistry in acidic waterways associated with coastal lowland acid sulfate soils. Geochimica Et Cosmochimica Acta. 70, 5455 – 5468.
Bush, R.T., Fyfe, D. & Sullivan, L.A. (2004) Occurrence and abundance of monosulfidic black ooze in coastal acid sulfate soil landscapes. Australian Journal of Soil Research, 42, 609 – 616.
Campbell, I.C. (2002). Biological monitoring and assessment using invertebrates. In F.R Burden, U. Foerstmer & I.D. McKelvie (Eds.), Environmental Monitoring Handbook. Sydney: McGraw-Hill Professional.
Cook, F.J., Hicks, W., Gardner, E.A., Carlin, G.D. & Froggatt, D.W. (2000) Export of acidity in drainage water from acid sulfate soils. Marine Pollution Bulletin, 41, 319 – 326.
Cornfield, J. (2000). The effect of acid sulfate runoff on a subtidal estuarine microbenthic community in the Richmond River, NSW, Australia. ICES Journal of Marine Science, 57, 1517 – 1523.

The influence of low pH on macroinvertebrate community composition in acidic waterways associated with coastal lowland acid sulfate soil discharge.
Southern Cross University 2016 31
Cavanagh, D., Dalrymple, B. & Wood, M. (2006). Managing water quality in the Richmond River Estuary, Australia. Retrieved 10/11/2015 from http://rrcc.nsw .gov.au/wp-content/uploads/2011/03/Managing-Water-Quality-in-the-Richmond-River-Estuary-Australia-Damion-Cavanagh-Brad-Dalrymple-Michael-Wood.pdf
Chessman, B. (2003). SIGNAL 2 – A scoring system for macroinvertebrate (‘water bugs’) in Australian rivers. Monitoring River Health Initiative Technical Report no 31. Commonwealth of Australia, Canberra
Charvet, S., Statzner, B., Usseglio-Polatera, P, & Dumonts, B. (2000). Traits of benthic macroinvertebrates is semi-natural French Streams: an initial application to biomonitoring. Freshwater Biology, 43, 277 – 296.
DeWeys, J., Santos, I.R. & Eyre, B.D. (2010). Unravelling the sources of acidity to NSW estuaries during floods using a novel tracer technique. Retrieved 03/09/2015 from http://www.coastalconference.com/2010/papers2010/Jason %20de%20 We ys%20full%20paper.pdf
Eyre, B.D., Kerr, G. & Sullivan, L.A. (2006). Deoxygenation potential of the Richmond River estuary floodplain, Northern NSW, Australia. River Research and Application, 22, 981 – 992.
Fältmarsch, R.M., Astrӧm, M.E. & Vuori, K. (2008). Environmental risks of metal mobilised from acid sulfate soils in Finland: a literature review. Boreal Environmental Research, 13, 444 – 456.
Fitzpatrick, R.W., Shand, p. & Merry, R.H (2009) Acid Sulfate Soils. In Jennings J.t. (Ed.), Natural History of Riverlands and Murrylands. Adelaide, Royal Society of South Australia(Inc).
Fuller, L. M., Aichele, S. S., & Minnerick, R. J. (2004). Predicting water quality by relating Secchi-disk transparency and chlorophyll a measurement to satellite imagery for Michigan inland lakes, August 2002. US Department of the Interior, US Geological Survey.
Furguson, A. & Eyre, B. (1999). Behaviour of aluminium and iron in acid runoff from acid sulphate soils in the Lower Richmond River Catchment. Journal of Australian Geology & Geophysics, 17, 193 – 201.
Gerhardt, A., Janssens de Bisthoven, L. & Soares. (2004). Macroinvertebrates responses to acid mine drainage: community metrics and on-line behavioural toxicity. Environmental Pollution, 130, 263 – 274.
Gooderham, J. & Tsyrlin, E. (2002). The Waterbug Book – A Guide to the Freshwater Macroinvertebrates of Temperate Australia. CSIRO Publishing, Collingwood, Victoria.
Gooderham, J., Sloane, T. & Tsyrlin, (2010). The ALT method (Agreed Level Taxonomy). Retrieved 15/10/2015 from http://thewaterbug.net/attachments/ ALT_methods_v1.2.pdf
Brendan Cox, 2016
Integrated Project 32
Griffith, S.J., Bale, C., Adam, P. & Wilson, R. (2003). Wallum and related vegetation on the NSW North Coast: descriptions and phytosociological analysis. Cunninghamia, 8, 202 – 252.
Guerold, F., Boudot, J., Jacquemin, G., Vein, D., Merlet, D. & Rouiller, J. (2000). Macroinvertebrate community loss as a result of headwater stream acidification in the Vosges Mountains (N-E France). Biodiversity and Conservation, 9, 767 – 783.
Havas, M. & E. Advokaat, 1995. Can sodium regulation be used to predict the relative acid-sensitivity of various lifestages and different species of aquatic fauna? Water, Air, & Soil Pollution, 85, 865 – 870.
Hawking, J.H. & Smith, F.J. (1997). Colour Gide to Invertebrates of Australian Inland Waters. Albury Australia.: Co-operative research centre for freshwater ecology.
Janssens de Bisthoven, L., Gerhardt, A., Guhr, K. & Soares, A. (2006). Behaviooral changes and acute toxicity to the freshwater shrimp Atyaephyra desmaresti Millet (Decapoda: Natantis) from exposed acid mine drainage. Ecotoxicology, 15, 215 – 227.
Johnson, R., Jin, h., Carreiro, M. & Jack, J. (2013) Macroinvertebrate community structure, secondary production and trophic-level dynamics in urban streams affected by non-point-source pollution. Freshwater biology, 5, 843-857.
Lamers, L., Van Roozendaal, S. & Roelofs, J. (1998). Acidification of freshwater wetlands: combined effects of non-airborne Sulfur pollution and desiccation. Water, air, soil pollution, 105, 95 – 106.
Lewis, B.R., Jüttner, I., Reynolds, B. & Ormerod, S.J. (2007). Comparative assessment of stream acidity using diatoms and macroinvertebrates: implications for river management and conservation. Aquatic Conservation: Marine and Freshwater Ecosystems, 17, 502 – 519.
Macdonald, B.T.C., White, I., Keene, A.F., Melville, M.D. & Reynolds, J.K. (2004). Acidity, metals and acid sulfate soils. Paper presented at Australian New Zealand Soils Conference 5th - 9th December 2004, Sydney, Australia.
Macdonald, B.T.C., White, I., Astrӧm, M.E., Keene, A.F., Melville, M.D. & Reynolds, J.K. (2007). Discharge of weathering products from acid sulfate soils after a rainfall event, Tweed River, eastern Australia. Applied Geochemistry, 22, 2695 – 2705.
Maher, C.A. (2013). Examining geochemical processes in acid sulphate soils using stable sulphur isotopes. Unpublished PhD Thesis, Southern Cross University, Lismore.
Mandaville, S.M. (2002). Benthic macroinvertebrates in freshwater – Taxa tolerances values, metrics, and protocols. Project H-1, Soil & Water Conservation Society of Metro: Halifax.

The influence of low pH on macroinvertebrate community composition in acidic waterways associated with coastal lowland acid sulfate soil discharge.
Southern Cross University 2016 33
Metzeling, L., Chessman, B., Hardwick, R. & Wong, V. (2003). Rapid assessment of rivers using macroinvertebrates: the role of experience, and comparisons with quantitative methods. Hydrobiologia, 510, 39 – 52.
Mulvey, P. (1993) Pollution, prevention and management of sulfuric clays and sands. In; Bush, R. (Ed.) Proceedings of the First National Conference on Acid Sulfate Soils. 24-25 June. Coolangatta.
Murry-Darling Freshwater Research Centre(MDFRC). (2013). Identification and ecology of Australian freshwater invertebrates; an interactive guide with colour digital imagery to assist in the identification of aquatic invertebrates. Retrieved 09/11/2015 from http://www.mdfrc.org.au/bug guide/index.htm
NSW National Parks and Wildlife Services(NPWS). (2002). Tuckean Nature Reserve: plan of management. Retrieved 16/01/2016 from http://www. environment.nsw.gov.au/par kmanagement/TuckeanNRMgmtplan.htm
Owers, G. (2005). Wetland Health Project - Improving wetland management for farm productivity and water quality. Ballina. Bungawalbin Catchment Management Group.
Petrin, Z., Laudon, H. & Malmquvist, B. (2007). Does freshwater macroinvertebrate diversity along a pH gradient reflect adaption to low pH? Freshwater Biology, 52, 2172 – 2183.
Petrin, Z., Laudon, H. & Malmquvist, B. (2008). Diverging effects of anthropogenic acidification and natural acidity on community structure in Swedish streams. Science of the Total Environment, 394, 321 – 330.
Preda, M. & Cox, M.E. (2001). Trace metals in acid sediments and waters, Pimpama catchment, southeast Queensland, Australia. Environmental Geology, 40, 755 – 768.
Powell, B. & Martens, M. (2005). A review of acid sulfate soils impacts, actions and policies that impact on water quality in Great Barrier Reef catchments, including a case study of remediation at East Trinity. Marine Pollution Bulletin, 51, 149 – 164.
Raposeiro, P.M. & Costa, A.C. (2009). Benthic macroinvertebrates based indices for assessing the ecological status of freshwaters on oceanic islands. Arquipélago. Life and Marine Sciences 26, 15 – 24.
Reece, P.F. & Richardson, J.S. (1999). Biomonitoring with the reference Condition Approach for the Detection of Aquatic Ecosystems at Risk. Proceedings of a Conference on the Biology and Management of Species and Habitats at Risk, 549 – 552.
Ritsema, C.J. & Groeneberg, J.E. (1993). Pyrite oxidation, carbonate weathering, and gypsum formation in drained potential acid sulfate soils. Soil Science Society of America Journal, 57, 968 – 976.

Brendan Cox, 2016
Integrated Project 34
Ruiz-Halpern, S., Maher, D.T., Santos, I.R, & Eyre, B.D. (2015). High CO2 evasion during floods in an Australian subtropical estuary downstream from modified acidic floodplain wetland. Limnology and Oceanography, 60, 42 – 56.
Sammut, J., Melville, M.D., Callinan, R.B. & Fraser, C.G. (1995). Estuarine acidification: impacts on aquatic biota of draining acid sulfate soils. Australian Geographical Studies, 35, 89 – 100.
Sammut, J., White, I, & Melville, M.D. (1996). Acidification of an estuarine tributary in eastern Australia due to drainage of acid sulfate soils. Marine and Freshwater Research, 47, 669 – 684.
Simpson, S., Fitzpatrick, R., Shand, P., Angle, B., Spadaro, D. & Mosley, L. (2010). Climate-driven mobilisation of acid and metals from acid sulfate soils. Marine and Freshwater Research, 61, 129 – 138.
Sommer, B. & Horwitz, P. (2009). Macroinvertebrate cycles of decline and recovery in Swan Coastal Plain (Western Australia) wetlands affected by drought-induced acidification. Hydrobiologia, 624, 191 – 203.
Sommer, B. & Horwitz, P. (2001). Water quality and macroinvertebrate response to acidification following intensified summer droughts in Western Australian wetland. Marine & Freshwater Research, 52, 1015 – 1021.
Sullivan, L.A. & Bush, R.T. (2004). Iron precipitate accumulations associated with waterways drained coastal acid sulfate landscapes of eastern Australia. Marine and Freshwater Research, 55, 727 – 736.
Tulau, M.J. (1999). Acid sulfate soil management priority areas in the lower Richmond River floodplain. Report to the Department of Land and Water Conservation. Sydney.
Vuai, S.A., Nakamura, K & Tokuyama. (2003) Geochemical characteristics of runoff from acid sulfate soils in the northern area of Okinawa Island, Japan. Geochemical Journal, 37, 579 – 592.
Ward, J.V. & Tockner, K. (2001). Biodiversity towards a unifying theme for river ecology. Freshwater Biology, 46, 807 – 819.
Webster, K.E., Frost, T.M., Watras, C.J., Swenson, W.A., Gonzalez, M. & Garrison, P.J. (1992). Complex biological responses to the experimental acidification of Little Rock Lake, Wisconsin, USA. Environmental Pollution, 78, 73 – 78.
White, I., Melville, M.D., Wilson, B.P. & Sammut, J. (1997). Reducing acidic discharges from coastal wetlands in eastern Australia. Wetlands Ecology and Management, 5, 55 – 72.

The influence of low pH on macroinvertebrate community composition in acidic waterways associated with coastal lowland acid sulfate soil discharge.
Southern Cross University 2016 35
Wong, V., Johnston, S.G., Bush, R.T., Sullivan, L.A., Clay, C., Burton, E.D. & Slavich, P.G. (2010). Spatial and temporal changes in estuarine water quality during a post-flood hypoxic event. Estuarine, coastal and shelf science, 87, 73 – 82.
Wright, I.A. & Burgin, S. (2009). Comparison of sewage and coal-mine wastes on stream macroinvertebrates within an otherwise clean upland catchment, Southeastern Australia. Water, Air and Soil Pollution, 204, 227 – 241.

Brendan Cox, 2016
Integrated Project 36
7. Appendices
Appendix A. Sub-habitats sampled
Appendix Table 1. Habitat sampled and percentage of habitat samples.
Site 1 2 3 4 5 6 7 8 9 10 11 12
Boulder/cobble/ Coarse substrate
0 20 0 0 0 0 0 10 0 10 10 0
Sand/silt deposition areas
20 10 20 30 10 30 0 40 0 0 0 0
Bare edge 20 20 30 0 0 10 0 20 50 30 20 10 Leaf Pack 15 20 20 20 20 0 30 20 0 10 10 20 Wood/snags 5 25 10 20 10 20 10 5 10 10 0 0 Aquatic Plants 40 5 20 30 60 40 60 5 40 40 60 70 Total (%) 100 100 100 100 100 100 100 100 100 100 100 100
Appendix B. Macroinvertebrates
Macroinvertebrate photographs (Source Author, 2015)
Order Coleoptera
Curculionidae
Corullanidae
Hydrophilidae
Dytiscidae
Dytiscidae larve
Order Hemiptera
Corixidae Mesoveliidae
Veliidae

The influence of low pH on macroinvertebrate community composition in acidic waterways associated with coastal lowland acid sulfate soil discharge.
Southern Cross University 2016 37
Nepidae
Hydrometridae Belostomatidae
Notonectidae
Gerridae
Naucoridae
Order Odonata
Libellulidae Gomphidae
Cordullidae
Isostictidae
Lestidae
Order Diptera Order Isopoda Order Trichoptera
Culicidae
Sphaeromatidae
Leptoceridae

Brendan Cox, 2016
Integrated Project 38
Class Collembola Order Ephemeroptera Order Lepidoptera
Hypogastruridae Baetidae
Crambiidae
Appendix C. SIGNAL 2 scores
Appendix Table 2. Site 1 macroinvertebrate sensitivity grades and SIGNAL 2 scores.
Family SIGNAL 2
Sensitivity Grade Number of
Species Weight Factor
Grade x Weight factor
Mites 6 29 5 30
Hydrophilidae 3 1 1 3
Dytiscidae 2 16 5 10
Atyidae 3 17 5 15
Parastacidae 4 0
Chironomidae 3 5 2 6
Nepidae 4 0
Notonectidae 1 7 3 3
Belostomatidae 1 0
Gerridae 4 1 1 4
Mesoveliidae 2 3 2 4
Veliidae 3 8 3 9
Pleidae 2 3 2 4
Corixidae 2 1 1 2
Lestidae 1 6 2 2
Gomphidae 5 1 1 5
Leptoceridae 6 3 2 12
Libellulidae 1 0
Pisauridae 1 0
Naucoridae 2 3 2 4
Aeshnidae 4 0
Isostictidae 3 0
Coenugrionidae 2 0
Total 15 37 113
SIGNAL 2 Score 3.05

The influence of low pH on macroinvertebrate community composition in acidic waterways associated with coastal lowland acid sulfate soil discharge.
Southern Cross University 2016 39
Appendix Table 3. Site 2 macroinvertebrate sensitivity grades and SIGNAL 2 scores.
Family SIGNAL 2
Sensitivity Grade Number of
Species Weight Factor
Grade x Weight factor
Mites 6 31 5 30
Hydrophilidae 3 0
Dytiscidae 2 8 3 6
Atyidae 3 12 4 12
Parastacidae 4 0
Chironomidae 3 0
Nepidae 4 0
Notonectidae 1 0
Belostomatidae 1 0
Gerridae 4 0
Mesoveliidae 2 1 1 2
Veliidae 3 4 2 6
Pleidae 2 0
Corixidae 2 0
Lestidae 1 15 4 4
Gomphidae 5 0
Leptoceridae 6 0
Libellulidae 1 1 1 1
Pisauridae 1 0
Naucoridae 2 0
Aeshnidae 4 0
Isostictidae 3 0
Coenugrionidae 2 0
Oligochaeta 2 2 1 2
Total 8 21 63
SIGNAL 2 Score 3

Brendan Cox, 2016
Integrated Project 40
Appendix Table 4. Site 3 macroinvertebrate sensitivity grades and SIINAL 2 scores.
Family SIGNAL 2 Sensitivity Grade
Number of Species
Weight Factor
Grade x Weight factor
Mites 6 10 3 18
Hydrophilidae 3 0
Dytiscidae 2 17 4 8
Atyidae 3 15 4 12
Parastacidae 4 1 1 4
Chironomidae 3 0
Nepidae 4 0
Notonectidae 1 0
Belostomatidae 1 0
Gerridae 4 0
Mesoveliidae 2 0
Veliidae 3 1 1 3
Pleidae 2 0
Corixidae 2 ? 0
Lestidae 1 4 2 2
Gomphidae 5 0
Leptoceridae 6 0
Libellulidae 1 0
Pisauridae 1 1 1 1
Naucoridae 2 0
Aeshnidae 4 0
Isostictidae 3 0
Coenugrionidae 2 0
Total 8 16 48
SIGNAL 2 Score 3

The influence of low pH on macroinvertebrate community composition in acidic waterways associated with coastal lowland acid sulfate soil discharge.
Southern Cross University 2016 41
Appendix Table 5. Site 4 macroinvertebrate sensitivity grades and SIGNAL 2 scores.
Family SIGNAL 2 Sensitivity Grade
Number of Species
Weight Factor
Grade x Weight factor
Mites 6 0
Hydrophilidae 3 20 4 12
Dytiscidae 2 99 5 10
Atyidae 3 0
Parastacidae 4 0
Chironomidae 3 0
Nepidae 4 0
Notonectidae 1 10 3 3
Belostomatidae 1 1 1 1
Gerridae 4 0
Mesoveliidae 2 1 1 2
Veliidae 3 0
Pleidae 2 0
Corixidae 2 28 5 10
Lestidae 1 0
Gomphidae 5 0
Leptoceridae 6 0
Libellulidae 1 0
Pisauridae 1 2 1 1
Naucoridae 2 0
Aeshnidae 4 0
Isostictidae 3 0
Coenugrionidae 2 0
Total 8 20 39
SIGNAL 2 Score 1.95

Brendan Cox, 2016
Integrated Project 42
Appendix Table 6. Site 5 macroinvertebrate sensitivity grades and SIGNAL 2 scores.
Family SIGNAL 2 Sensitivity Grade
Number of Species
Weight Factor
Grade x Weight factor
Mites 6 0
Hydrophilidae 3 0
Dytiscidae 2 31 5 10
Atyidae 3 0
Parastacidae 4 0
Chironomidae 3 2 1 3
Nepidae 4 0
Notonectidae 1 2 1 1
Belostomatidae 1 2 1 1
Gerridae 4 0
Mesoveliidae 2 0
Veliidae 3 0
Pleidae 2 0
Corixidae 2 0
Lestidae 1 1 1 1
Gomphidae 5 0
Leptoceridae 6 0
Libellulidae 1 1 1 1
Pisauridae 1 1 1 1
Naucoridae 2 0
Aeshnidae 4 0
Isostictidae 3 0
Coenugrionidae 2 0
Total 7 11 18
SIGNAL 2 Score 1.63

The influence of low pH on macroinvertebrate community composition in acidic waterways associated with coastal lowland acid sulfate soil discharge.
Southern Cross University 2016 43
Appendix Table 7. Site 6 macroinvertebrate sensitivity grades and SIGNAL 2 scores.
Family SIGNAL 2
Sensitivity Grade Number of
Species Weight Factor
Grade x Weight factor
Mites 6 5 2 12
Hydrophilidae 3 0
Dytiscidae 2 33 5 10
Atyidae 3 0
Parastacidae 4 0
Chironomidae 3 4 2 6
Nepidae 4 1 1 4
Notonectidae 1 2 1 1
Belostomatidae 1 6 3 3
Gerridae 4 0
Mesoveliidae 2 0
Veliidae 3 10 3 9
Pleidae 2 0
Corixidae 2 2 2 4
Lestidae 1 7 3 3
Gomphidae 5 0
Leptoceridae 6 0
Libellulidae 1 3 2 2
Pisauridae 1 0
Naucoridae 2 0
Aeshnidae 4 71 5 20
Isostictidae 3 0
Coenugrionidae 2 0
Curculionidae 2 1 1 2
Total 12 30 76
SIGNAL 2 Score 2.53

Brendan Cox, 2016
Integrated Project 44
Appendix Table 8. Site 7 macroinvertebrate sensitivity grades and SIGNAL 2 scores.
Family SIGNAL 2
Sensitivity Grade Number of
Species Weight Factor
Grade x Weight factor
Mites 6 1 1 6
Hydrophilidae 3 1 1 3
Dytiscidae 2 0
Atyidae 3 0
Parastacidae 4 0
Chironomidae 3 0
Nepidae 4 0
Notonectidae 1 0
Belostomatidae 1 1 1 1
Gerridae 4 0
Mesoveliidae 2 0
Veliidae 3 4 2 6
Pleidae 2 0
Corixidae 2 0
Lestidae 1 0
Gomphidae 5 0
Leptoceridae 6 0
Libellulidae 1 0
Pisauridae 1 1 1 1
Naucoridae 2 0
Aeshnidae 4 0
Isostictidae 3 0
Coenugrionidae 2 0
Oligochaeta 2 0
Curculionidae 0
Hypogastruridae 1 31 5 5
Total 6 11 22
SIGNAL 2 Score 2

The influence of low pH on macroinvertebrate community composition in acidic waterways associated with coastal lowland acid sulfate soil discharge.
Southern Cross University 2016 45
Appendix Table 9. Site 8 macroinvertebrate sensitivity grades and SIGNAL 2 scores.
Family SIGNAL 2
Sensitivity Grade Number of
Species Weight Factor
Grade x Weight factor
Mites 6 0
Hydrophilidae 3 0
Dytiscidae 2 0
Atyidae 3 12 4 12
Parastacidae 4 0
Chironomidae 3 2 1 3
Nepidae 4 0
Notonectidae 1 0
Belostomatidae 1 0
Gerridae 4 2 1 4
Mesoveliidae 2 0
Veliidae 3 5 2 6
Pleidae 2 0
Corixidae 2 0
Lestidae 1 0
Gomphidae 5 0
Leptoceridae 6 1 1 6
Libellulidae 1 0
Pisauridae 1 0
Naucoridae 2 0
Aeshnidae 4 0
Isostictidae 3 1 2 6
Coenugrionidae 2 0
Oligochaeta 2 0
Corullanidae 2 21 5 10
Sphaeromatidae 1 5 2 2
Total 8 18 49
SIGNAL 2 Score 2.72

Brendan Cox, 2016
Integrated Project 46
Appendix Table 10. Site 9 macroinvertebrate sensitivity grades and SIGNAL 2 scores.
Family SIGNAL 2
Sensitivity Grade Number of
Species Weight Factor
Grade x Weight factor
Mites 6 0
Hydrophilidae 3 0
Dytiscidae 2 0
Atyidae 3 12 4 12
Parastacidae 4 0
Chironomidae 3 2 1 3
Nepidae 4 0
Notonectidae 1 0
Belostomatidae 1 0
Gerridae 4 2 1 4
Mesoveliidae 2 0
Veliidae 3 5 2 6
Pleidae 2 0
Corixidae 2 0
Lestidae 1 0
Gomphidae 5 0
Leptoceridae 6 1 1 6
Libellulidae 1 0
Pisauridae 1 0
Naucoridae 2 0
Aeshnidae 4 0
Isostictidae 3 1 1 3
Coenugrionidae 2 0
Oligochaeta 2 0
Corullanidae 2 21 5 10
Sphaeromatidae 1 5 2 2
Total 8 17 46
SIGNAL 2 Score 2.7

The influence of low pH on macroinvertebrate community composition in acidic waterways associated with coastal lowland acid sulfate soil discharge.
Southern Cross University 2016 47
Appendix Table 11. Site 10 macroinvertebrate sensitivity grades and SIGNAL 2 scores.
Family SIGNAL 2
Sensitivity Grade Number of
Species Weight Factor
Grade x Weight factor
Mites 6 0
Hydrophilidae 3 2 1 3
Dytiscidae 2 6 3 6
Atyidae 3 0
Parastacidae 4 0
Chironomidae 3 7 3 9
Nepidae 4 2 1 4
Notonectidae 1 1 1 1
Belostomatidae 1 3 2 2
Gerridae 4 1 1 4
Mesoveliidae 2 9 4 8
Veliidae 3 12 4 12
Pleidae 2 0
Corixidae 2 0
Lestidae 1 1 1 1
Gomphidae 5 0
Leptoceridae 6 0
Libellulidae 1 0
Pisauridae 1 2 1 1
Naucoridae 2 0
Aeshnidae 4 0
Isostictidae 3 0
Coenugrionidae 2 0
Oligochaeta 2 0
Cordullidae 5 3 2 10
Total 12 24 61
SIGNAL 2 Score 2.54

Brendan Cox, 2016
Integrated Project 48
Appendix Table 12. Site 11 macroinvertebrate sensitivity grades and SIGNAL 2 scores.
Family SIGNAL 2 Sensitivity Grade
Number of Species
Weight Factor
Grade x Weight factor
Mites 6 8 3 18
Hydrophilidae 3 1 1 3
Dytiscidae 2 37 5 10
Atyidae 3 8 3 9
Parastacidae 4 0
Chironomidae 3 19 4 12
Nepidae 4 0
Notonectidae 1 0
Belostomatidae 1 3 2 2
Gerridae 4 0
Mesoveliidae 2 1 1 2
Veliidae 3 2 1 3
Pleidae 2 0
Corixidae 2 0
Lestidae 1 15 4 4
Gomphidae 5 0
Leptoceridae 6 0
Libellulidae 1 0
Pisauridae 1 1 1 1
Naucoridae 2 0
Aeshnidae 4 0
Isostictidae 3 1 1 3
Coenugrionidae 2 0
Oligochaeta 2 0
Sphaeromatidae 1 1 1 1
Baetidae 5 12 4 20
Culicidae 1 1 1 1
Total 14 32 89
SIGNAL 2 Score 2.78

The influence of low pH on macroinvertebrate community composition in acidic waterways associated with coastal lowland acid sulfate soil discharge.
Southern Cross University 2016 49
Appendix Table 13. Site 12 macroinvertebrate sensitivity grades and SIGNAL 2 scores.
Family SIGNAL 2
Sensitivity Grade Number of
Species Weight Factor
Grade x Weight factor
Mites 6 0
Hydrophilidae 3 0
Dytiscidae 2 0
Atyidae 3 0
Parastacidae 4 0
Chironomidae 3 1 1 3
Nepidae 4 0
Notonectidae 1 0
Belostomatidae 1 0
Gerridae 4 0
Mesoveliidae 2 0
Veliidae 3 6 3 9
Pleidae 2 0
Corixidae 2 0
Lestidae 1 1 1 1
Gomphidae 5 0
Leptoceridae 6 0
Libellulidae 1 1 1 1
Pisauridae 1 1 1 1
Naucoridae 2 0
Aeshnidae 4 0
Isostictidae 3 0
Coenugrionidae 2 0
Oligochaeta 2 0
Crambiidae 2 1 1 2
Total 6 8 17
SIGNAL 2 Score 2.13

Brendan Cox, 2016
Integrated Project 50
Appendix D. Water Quality Measurements
Appendix Table 14. Water quality measurements from study sites taken during sampling within the lower Richmond River floodplain, Northern NSW, 2015
Acidic/ Neutral
Site pH Conductivity
(µs) Water
Temp (⁰C) DO (mg/L) DO %
ANZECC 2000 Trigger Values
6.5 – 8.0 125 - 2200 - - 85 - 110
Acidic 4 3.05 2260 25.1 5.0 61
Acidic 5 3.73 272 25.8 4.8 62
Acidic 6 4.29 172 26.2 4.1 49
Acidic 7 4.85 1169 26.1 7.6 87
Acidic 9 5.66 170 25.3 0.8 12
Acidic 12 5.84 249 27.5 8.0 101
Neutral 10 6.39 157 27.4 1.2 25
Neutral 3 6.72 107 23.1 5.7 66
Neutral 2 6.76 170 27.1 6.0 75
Neutral 8 7.10 221 26.3 4.8 62
Neutral 1 7.26 375 24.1 7.2 86
Neutral 11 7.33 493 25.5 8.8 113
Appendix E. Field Observations
Appendix Table 15. Field observations from study sites taken during sampling within the lower Richmond River floodplain, Northern NSW, 2015.
Site Stream Width
(m)
Land use
Riparian Condition
Shading Water Odour
Water Oils
Turbidity Flow level
Current Velocity
LCE
1 6.7 1 4 3 1 1 2 2 1 3
2 12.5 5 3 2 1 1 4 3 1 2
3 18.2 4 5 1 1 1 3 3 1 2
4 10.6 4 4 3 6 1 2 2 1 1
5 20 1 2 5 1 1 1 3 1 1
6 5.5 1 2 5 1 1 1 3 0 1
7 10 5 5 1 1 1 1 3 1 1
8 25 4 2 4 6 1 2 3 1 1
9 4.8 4 3 4 6 1 2 2 1 2
10 5.8 4 3 5 1 1 3 5 1 1
11 5 5 5 1 1 1 3 2 0 1
12 25 4 3 3 1 1 2 3 1 1
Land use- 1 = Native forest, 2 = Forestry, 3 = Native heath/grassland, 4 = Grazing, 5 = Cropped; Riparian Condition: 1 =
Natural, 2 = Good, 3 = moderate, 4 = Poor, 5 = no riparian vegetation; Shading: 1 = <5%, 2 = 6-25%, 3 = 26-50%, 4 =
51-75%, 5. = >76%; Water Odours: 1 = normal, 2 = sewage, 3 = petroleum, 4. = chemical, 5 = stormwater, 6 = musty;
Water Oils: 1 = none, 2 = slick, 3 = sheen, 4 = globes, 5 = flecks; Turbidity: 1 = clear, 2 = slight, 3 = turbid, 4 =
opaque/liquid silt(clay like); Flow level (Relative to water mark) normal inundation level shown by limit of terrestrial
grasses, by eroded area, or by boundary in bank sediment types): 1 = No flow(dry / isolated pools), 2 = Low(<<water
mark), 3 = Moderate(around water mark), 4 = High (>>water mark); Current velocity(in sample area); 0 = no flow, 1 =
slow, 2 = medium/moderate, 3 = fast to very fast; Local Catchment Erosion(within sight of site); 1 = none, 2 = slight, 3
moderate, 4. Heavy.


