COVID‑19 Financial Report
32
NORTHERN TERRITORY COVID‑19 Financial Report July 2020
Transcript of COVID‑19 Financial Report

NORTHERN TERRITORY
COVID‑19Financial Report
July 2020


1
ContentsChapter 1 Introduction and background 3
Outlook prior to COVID‑19 3Territory Government’s immediate response 4Stimulus and support measures 4Territory Economic Reconstruction Commission 7Potential health and economic impacts if no action was taken 8Deferral of 2020‑21 Budget and passing of the Supply Act 8Other upcoming financial reports 9
Chapter 2 Basis for preparation of report 11Risks and qualifications 11Commonwealth Economic and Fiscal Update 12Jurisdictional comparison of fiscal impact 14
Chapter 3 Northern Territory fiscal update 15Overview of budget as at 2019‑20 Mid‑Year Report 15Key fiscal indicators – operating statement 15General government sector net operating balance 16Non financial public sector fiscal balance 16Reconciliation with previous fiscal projections 16Policy changes since 2019‑20 Mid‑Year Report 17Non‑policy changes since 2019‑20 Mid‑Year Report 18Key fiscal indicators – balance sheet 192019‑20 preliminary outcome – agency expenses 19Revised GST estimates 21Own‑source revenues 21
Chapter 4 Economic update 25Economic performance and outlook prior to COVID‑19 26Key economic indicators 26Impact on the economy 27
Contents

2
COVID-19 Financial Report –July 2020

Introduction and background 3
Chapter 1Introduction and background
The COVID‑19 pandemic has disrupted the global economy. Governments are intervening in unprecedented ways to save lives, jobs and livelihoods. Over the past few months all Territorians have pulled together to effectively respond to the health and resultant economic crisis created by COVID‑19. The emergency is not yet behind us, and our response must maintain the flexibility to adjust and adapt to the changing environment. It requires the continued strong collaboration between governments, business, industry, community leaders and other key stakeholders to sustain business and jobs, and chart a new path to growth.
This COVID‑19 Financial Report has been prepared under highly uncertain circumstances, with the full impact of COVID‑19 on health, economic activity and public finances still evolving.
However, it is clear that the enormity of COVID‑19, and its onset across Australia and the world, has resulted in significant and necessary action from all levels of government. The Northern Territory Government has taken decisive and necessary action to mitigate community transmission, contain the impacts on public health resources, reduce the economic consequences, and support the economy as it rebounds from the health and economic crisis.
Outlook prior to COVID‑19Prior to COVID‑19, the Territory’s budget faced challenging circumstances with unprecedented reductions in the Territory’s largest revenue source, the GST, and challenging economic conditions as the economy transitioned from the construction to production phase of the Ichthys liquefied natural gas (LNG) project. Government set a plan to return the Territory’s budget to a sustainable position through implementing savings and revenue measures, and structural reforms across the Northern Territory public sector.
The Territory Government published the 2019‑20 Mid‑Year Report on 27 November 2019, detailing the Territory’s fiscal and economic projections for 2019‑20 and forward estimates. The 2019‑20 Mid‑Year Report showed that prior to the emergence of COVID‑19, the Territory’s fiscal position was forecast to improve in 2019‑20 compared to the forecasts in the 2019‑20 Budget, with increases in debt and deficits by 2022‑23 primarily due to additional infrastructure investment (predominantly the Darwin Ship Lift and Marine Industries Project) and further reductions in projected GST revenue. Nevertheless, through reforms implemented as part of government’s A Plan to Fix the Budget, the Territory was projected to achieve fiscal surplus in 2027‑28, a year ahead of previous projections.
Prior to COVID‑19, the Territory economy was also showing signs of improvement. The 2019‑20 Mid‑Year Report showed that while key economic forecasts indicated generally soft economic conditions in the short term, an upturn in economic activity was projected in the medium term, supported by investment in a range of economic enabling infrastructure including the ship lift facility, Katherine logistics hub and transport infrastructure to support industry.

4 Introduction and background
COVID-19 Financial Report –July 2020
Territory Government’s immediate responseThe Territory Government’s focus from the start of the pandemic has been clear – save lives and save jobs.
From a health perspective, as the number of COVID‑19 cases in Australia escalated in March, all states and territories implemented restrictions and safety measures to stop the spread of the virus. The Territory was one of the first jurisdictions to announce strict travel restrictions, and this undoubtedly contributed to there being only 32 confirmed cases in the Territory as at 24 July, compared with over 13 000 cases nationally. The Territory was also the first jurisdiction to release a staged and safe plan to ease restrictions. The Roadmap to the new normal is a comprehensive plan designed to maintain health outcomes and minimise the economic impacts of the pandemic. The government’s decisive health response to the pandemic has made the Territory the safest place in Australia and created the conditions to allow for safe easing of restrictions, and the careful adjustment of border restrictions on 17 July. As at 24 July the Territory is the only jurisdiction to have no cases of community transmission of COVID‑19.
From an economic perspective, Commonwealth Treasury and the Reserve Bank of Australia advised National Cabinet that immediate and wide‑ranging assistance was needed to minimise the damage to the economy arising from the necessary business and travel restrictions required by the health response. Independent commentators, such as Deloitte Access Economics, Commonwealth Bank, ANZ and NAB all published economic forecasts indicating the significant economic cost of the health response in the absence of government assistance.
Accordingly, the Territory Government responded quickly to support businesses and households impacted by the virus, and established a Jobs Rescue and Recovery plan with three key phases:
• survive – which had an immediate focus on countering the financial, economic and employment hardship arising from the restriction measures imposed under the health response to the crisis
• adapt (and recover) – focused on the short to medium‑term task of job resumption, reopening businesses and encouraging new businesses where gaps have developed, supporting businesses and employees to adapt to the new operating environment, and addressing urgent and emerging sector needs such as workforce and market access
• rebound (and reset) – encouraging the reconstruction of the Territory economy to be best positioned for long‑term growth and job creation. With a medium to long‑term focus, rebound includes prioritising government investment and accelerating early private investment in ready (or near ready) projects, upskilling the workforce, bringing forward the plans of existing Territory industry participants, and securing the next tranche of private investment.
Stimulus and support measuresIn response to the impacts of COVID‑19, the Territory Government has provided a range of stimulus and support measures aimed at supporting businesses and individuals, and stimulating economic activity.
The stimulus and support measures provided by the Territory Government include direct assistance and relief measures for businesses and households, waivers and deferrals of government fees and charges, tailored industry support, and support for not‑for‑profit entities, community organisations and the local government sector. These measures complement the package of relief measures offered by the Commonwealth.
Introduction and background 5
The Territory Government stimulus and support measures are valued at $383 million to date. This is lower than the $408 million estimated in April because the Territory Government’s swift actions and ability to lift business restrictions earlier than the rest of Australia means it is likely that lower than expected own‑source taxation revenue will be forgone compared to earlier estimates.
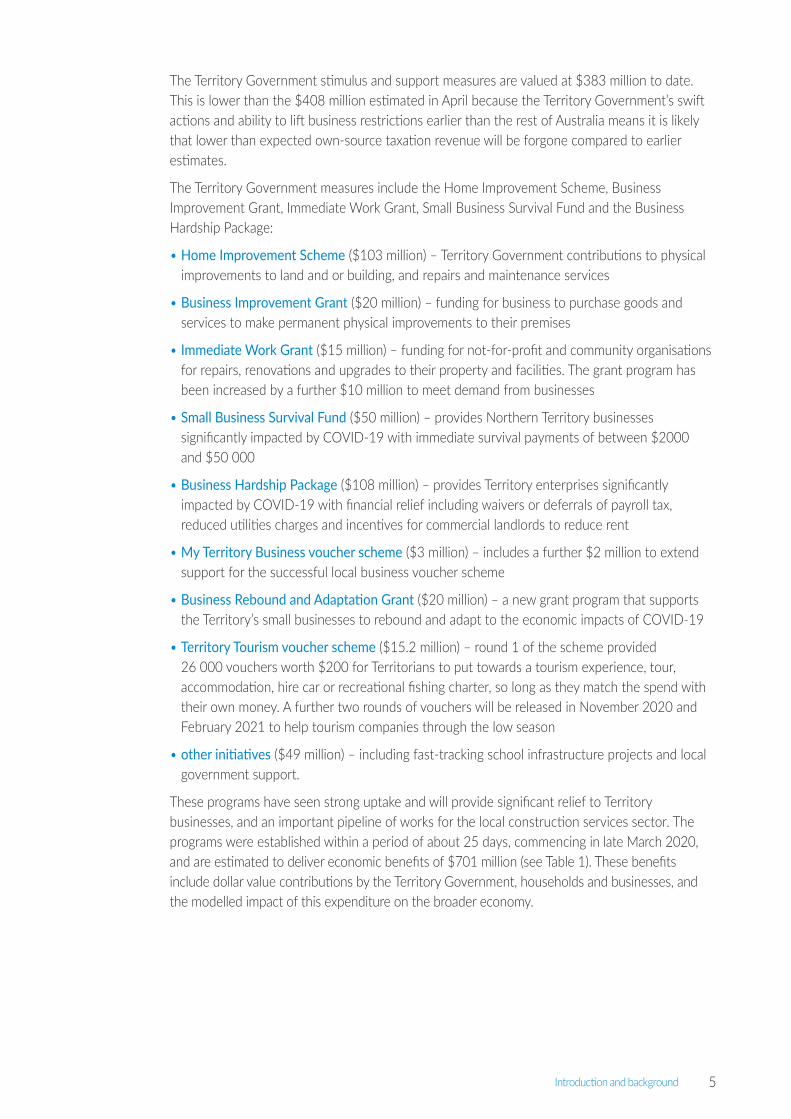
The Territory Government measures include the Home Improvement Scheme, Business Improvement Grant, Immediate Work Grant, Small Business Survival Fund and the Business Hardship Package:
• Home Improvement Scheme ($103 million) – Territory Government contributions to physical improvements to land and or building, and repairs and maintenance services
• Business Improvement Grant ($20 million) – funding for business to purchase goods and services to make permanent physical improvements to their premises
• Immediate Work Grant ($15 million) – funding for not‑for‑profit and community organisations for repairs, renovations and upgrades to their property and facilities. The grant program has been increased by a further $10 million to meet demand from businesses
• Small Business Survival Fund ($50 million) – provides Northern Territory businesses significantly impacted by COVID‑19 with immediate survival payments of between $2000 and $50 000
• Business Hardship Package ($108 million) – provides Territory enterprises significantly impacted by COVID‑19 with financial relief including waivers or deferrals of payroll tax, reduced utilities charges and incentives for commercial landlords to reduce rent
• My Territory Business voucher scheme ($3 million) – includes a further $2 million to extend support for the successful local business voucher scheme
• Business Rebound and Adaptation Grant ($20 million) – a new grant program that supports the Territory’s small businesses to rebound and adapt to the economic impacts of COVID‑19
• Territory Tourism voucher scheme ($15.2 million) – round 1 of the scheme provided 26 000 vouchers worth $200 for Territorians to put towards a tourism experience, tour, accommodation, hire car or recreational fishing charter, so long as they match the spend with their own money. A further two rounds of vouchers will be released in November 2020 and February 2021 to help tourism companies through the low season
• other initiatives ($49 million) – including fast‑tracking school infrastructure projects and local government support.
These programs have seen strong uptake and will provide significant relief to Territory businesses, and an important pipeline of works for the local construction services sector. The programs were established within a period of about 25 days, commencing in late March 2020, and are estimated to deliver economic benefits of $701 million (see Table 1). These benefits include dollar value contributions by the Territory Government, households and businesses, and the modelled impact of this expenditure on the broader economy.

6 Introduction and background
COVID-19 Financial Report –July 2020
Table 1: Major economic support initiatives provided by the Territory Government
ProgramProgram value
($M)Applications
receivedTotal economic
impact ($M)
Home Improvement Scheme 103 19 573 268
Business Improvement Grant 20 1 423 48
Immediate Work Grant 15 108 43
Small Business Survival Fund 50 1 730 50
Business Hardship Package 108 1 177 108
My Territory Business voucher scheme 3 n.a. 31
Business Rebound and Adaptation Grant 20 n.y.c. 74
Territory Tourism voucher scheme 15 26 000 30
Other1 49 n.a. 49
Total 383 50 011 701
n.a.: not available; n.y.c.: not yet commenced1 Includes initiatives such as the fast‑tracking school infrastructure projects, local government support, and freezing of
regulatory fees and charges.Source: Department of Trade, Business and Innovation; Department of Treasury and Finance; City of Darwin
The value of the Commonwealth’s economic stimulus is estimated at $289 billion, of which around $164 billion is directed to supporting individuals, households and businesses, with the balance of $125 billion targeted at banking and lending institutions to support the flow of credit in the economy (particularly to businesses). It is estimated that around 1.5 per cent of the available support payments to individuals, households and businesses will flow into the Territory economy.
As the Territory economy gradually reopens, the government can build on the ‘survive and adapt’ platforms to focus on the rebound phase. Operation Rebound charts the Territory’s path to deliver the following objectives:
• maximise opportunities for jobs and businesses to accelerate a return to economic stability
• ensure the most prospective new investments are activated quickly
• adopt a mindset to quickly enable private sector investment and job creation
• advance the Territory’s economic plan for diversification, building on our comparative advantages and exploiting our strategic location
• capitalise on the Territory’s strategic position and energy resources to meet the increased requirement for manufacturing and supply chain security identified by the COVID‑19 crisis.
The objectives will be achieved using a rapid and coordinated approach, building on the agility and collaboration displayed through the health crisis.
To minimise the economic toll on the economy, each jurisdiction adopted a staged approach to the easing of restrictions, based on the 3‑step framework for a COVIDSafe Australia (see Table 2). The Territory was the first jurisdiction to enter the third stage of easing restrictions and was one of the earliest to lift domestic travel restrictions. In conjunction with government assistance measures, the early easing of restrictions has helped to offset the economic impact of the outbreak.
Following the recent outbreak of community transmission in Victoria and New South Wales, most jurisdictions are imposing travel restrictions on visitors from these states.

Introduction and background 7
Table 2: Summary of staged easing of restrictions by jurisdiction
Staged easing of restrictions1
Stage 1 Stage 2 Stage 3Northern Territory 1 May 15 May 5 JuneNew South Wales2 15 May 1 June 1 JulyVictoria2 13 May 1 June 22 JuneQueensland 16 May 1 June 3 JulyWestern Australia 27 April 18 May 6 JuneSouth Australia 11 May 1 June 29 JuneTasmania 18 May 15 June 13 JulyAustralian Capital Territory2 8 May 30 May t.b.c.
t.b.c.: to be confirmed1 The easing of restrictions has been mapped to the 3‑step framework for a COVIDSafe Australia.2 Domestic travel to these jurisdictions was not initially restricted in March 2020.Source: State and Territory government media releases
Territory Economic Reconstruction CommissionOn 22 May 2020, the Territory Government established the Territory Economic Reconstruction Commission to provide a roadmap to accelerate the economic rebound post‑COVID‑19 and to position the Territory for growth. Former Chairman and CEO of the Dow Chemical Company, Andrew Liveris, and former Chief Minister, Paul Henderson, are co‑chairs of the commission, with other members being prominent Australians with a broad range of expertise. The commission is tasked with providing advice on:
• creating jobs in the near term
• options to attract investment, including in regions and remote communities
• priorities for regulatory reform and streamlining approvals to support industry and investment
• how to build on the Territory’s competitive advantage and strategic location
• engagement with the Commonwealth, investors and trade partners.
The Commission delivered its first report on 20 July and will deliver its final report in November 2020. The Commission recommends the Territory Government focus on growing five key sectors: energy (renewables and gas); manufacturing (gas and non‑gas); agribusiness; resources; and tourism.
The report contains 15 immediate recommendations to help attract and secure investment, make it easier to do business and back locals. Government has accepted all recommendations and will commence action on them immediately.
The Chief Minister has written to the chief executives of all departments requesting this work be prioritised, particularly the recommendations relating to regulatory approval processes.
The challenge of expediting the Territory’s economic recovery is also supported by establishing:
• Team NT, which brings together a team of highly experienced and skilled individuals with strong ties to the Territory. Team NT is tasked to provide advice on specific aspects of government’s economic development, and international engagement, trade and investment agendas
• the Central Australian Economic Reconstruction Committee, which will provide advice to the Minister for Central Australian Reconstruction on creating jobs, attracting investment, including in remote communities, and ensuring priority economic projects are fast‑tracked
8 Introduction and background
COVID-19 Financial Report –July 2020
• local Regional Economic Reconstruction Committees focused on providing advice on the region‑specific development needs and priorities.
Potential health and economic impacts if no action was takenThe Territory Government has taken decisive action to maintain the safety of Territorians and stay ahead of the pandemic. The early action by government has put the Territory in a better position than many other jurisdictions to emerge from the economic and social impacts of COVID‑19.
Based on initial national modelling1 of the impacts of COVID‑19 conducted by the Commonwealth, in the absence of health measures such as border controls and business restrictions, it is estimated that up to 92 500 Territorians (37.7 per cent of the population) could have become infected with COVID‑19, with up to 5400 Territorians hospitalised (2.2 per cent of the population). There would have almost certainly been further devastating impacts on our most vulnerable populations, in particular in remote Aboriginal communities.
It is estimated that the direct costs associated with dealing with 92 500 infections and an additional 5400 hospitalisations would have exceeded $200 million. This figure is based on the potential additional number of patients infected, multiplied by the average occupied bed days and cost per bed day of the patients that have been infected in the Territory to date.
These are just the direct costs to the Territory health and hospital network and do not include the significant additional costs incurred in the economy by individuals, families and businesses if this outcome eventuated.
The effects of COVID‑19 on the Australian and international economies impact directly on the Territory economy. Supply chain disruptions would have exacerbated the employment disruptions and loss of business and consumer confidence that would arise from the significant infection rates. In this respect, Table 13 sets out the estimated economic impacts that would have resulted in the absence of government assistance and stimulus.
Deferral of 2020‑21 Budget and passing of the Supply ActDue to the unprecedented impact of COVID‑19 on the community and economy, the Commonwealth made a decision to postpone its 2020‑21 Budget until Tuesday, 6 October 2020.
Given the nation’s uncertain economic circumstances and the extreme difficulty of making economic and fiscal forecasts at this time, all states and territories agreed to suspend the delivery of their budgets until after delivery of the Commonwealth budget, and have passed temporary supply bills.
Postponing the 2020‑21 Budget has enabled governments to focus on addressing the immediate health and economic implications of COVID‑19, and will ensure detailed analysis of financial and economic impacts can be provided. The 2020‑21 Northern Territory Budget will be delivered on 10 November 2020.
1 Commonwealth Government, Impact of COVID‑19, Theoretical modelling of how the health system can respond, https://www.health.gov.au/sites/default/files/documents/2020/04/impact‑of‑covid‑19‑in‑australia‑ensuring‑the‑health‑system‑can‑respond‑summary‑report.pdf.

Introduction and background 9
In light of the delay of the Territory Budget, the Legislative Assembly passed the Supply (2020‑2021) Act 2020 in March 2020 to provide for interim agency expenditure to enable the continued delivery of essential government services in 2020‑21. It provides up to six months of expenditure based on 50 per cent of total appropriation for 2020‑21, as detailed in the 2019‑20 Mid‑Year Report, and also includes a contingency of $300 million in Treasurer’s Advance for 2020‑21 to fund response measures and capital expenditure to support the infrastructure program.
Other upcoming financial reportsFurther to this report, and in the lead up to the release of the 2020‑21 Budget, government will provide additional information on the Territory’s fiscal position.
The 2019‑20 Preliminary Outcome Report, to be published in mid‑August 2020, will provide estimates of the Territory’s 2019‑20 fiscal outcome.
The 2019‑20 Treasurer’s Annual Financial Report, to be published in October 2020, will present the Territory’s actual 2019‑20 financial performance, including whole of government audited financial statements, as required under the Financial Management Act 1995 and Fiscal Integrity and Transparency Act 2001.
The 2020‑21 Budget will be tabled in the Legislative Assembly on 10 November 2020.
Further updated details of the fiscal impacts of COVID‑19 will be available through these reports.

10
COVID-19 Financial Report –July 2020

Basis for preparation of report 11
Chapter 2Basis for preparation of report
This report provides estimates on the impacts of COVID‑19 on the Territory’s economic output, labour force and population based on the policy responses of the Commonwealth and Territory governments to contain the virus.
It includes a preliminary estimate of the offsetting positive impact on the Territory economy from various assistance packages announced by the Commonwealth and Territory governments to counter the financial, economic and employment hardship arising from the COVID‑19 restriction measures.
It also provides updated fiscal estimates resulting from material variations that have occurred since the 2019‑20 Mid‑Year Report and their effects on the remainder of 2019‑20 and 2020‑21 Budget. These variations include:
• COVID‑19 response measures
• revised GST estimates
• revised own‑source revenue estimates
• new operational and capital funding commitments.
These variations have resulted in a worsening of the Territory’s 2020‑21 key fiscal aggregate estimates.
Risks and qualificationsThe final impact of COVID‑19 and related response measures on the Territory’s fiscal and economic outlook remains highly uncertain. Recent escalation of new infections in New South Wales and Victoria serve to heighten this uncertainty. Consequently, the assumptions and published estimates in this report only consider information available up to the date of this report and may be affected by new information.
These estimates may be subject to significant revision at the next round of official forecasts.
The full impact of the pandemic is unknown at this stage, and the severity of the outbreak in each country across the world, the effectiveness of containment efforts, and the economic and behavioural responses of consumers and businesses will all impact the rate of recovery in the Territory economy.
Given the heightened uncertainty, any changes to policies and actions to address COVID‑19, both domestically and abroad, may present significant risks to projected outcomes. Therefore, this report only provides an update on the preliminary 2019‑20 end‑of‑year outcome and revised estimates for the 2020‑21 financial year.
While all effort has been made to finalise 2019‑20 end‑of‑year information to the extent practicable, the data presented in this report is unaudited and as such is subject to amendment. Audited financial statements for the general government, non financial public sector and total public sector will be published in October 2020 as part of the Treasurer’s Annual Financial Report.

12 Basis for preparation of report
COVID-19 Financial Report –July 2020
Commonwealth Economic and Fiscal UpdateOn 23 July 2020, the Commonwealth released its Economic and Fiscal Update, which outlines the impact of COVID‑19 on the nation’s finances. Due to uncertainty around the economic outlook, updated forecasts and projections over the forward estimates period and medium term have not been included in this report and will be provided in the Commonwealth’s 2020‑21 Budget, to be delivered on 6 October 2020.
A total economic support package of around $289 billion in fiscal and balance sheet measures has been provided by the Commonwealth to support the economy through this crisis, including:
• $125 billion in balance sheet support, including Term Funding Facility to support lending to Australian businesses
• $85.7 billion in JobKeeper payments, which have been extended until 28 March 2021
• $31.9 billion to improve cash flow for employers
• $16.8 billion in income support for individuals, including the Coronavirus Supplement, which has been extended until 31 December 2020
• $9.4 billion in payments to support households
• $9.4 billion to support hospitals and for additional health measures.
Specific Commonwealth support for the Territory includes:
• $40.4 million for road safety improvements under the Infrastructure Investment Program and shovel‑ready projects, including strengthening and widening priority roads
• support to offset the cost of implementing COVID‑19‑related travel restrictions in remote communities
• bringing forward $74.8 million over three years from 2019‑20 to fast track the delivery of the Darwin City Deal education and community precinct
• additional funding over five years to 2024‑25 under the new National Health Reform Agreement for public hospital services.
These economic support initiatives have contributed towards a significant worsening in the Commonwealth’s budget position, with estimated budget deficits of $85.8 billion in 2019‑20 and $184.5 billion in 2020‑21.
Net debt is expected to be $488.2 billion (24.6 per cent of gross domestic product (GDP)) at 30 June 2020 and increase to $677.1 billion (35.7 per cent of GDP) at 30 June 2021. A summary of the Commonwealth budget aggregates is at Table 3.

Basis for preparation of report 13
Table 3: Commonwealth budget aggregates
2019‑20 2020‑21
$B $B
Underlying cash balance
Economic and fiscal update ‑ 85.8 ‑ 184.5
2019‑20 MYEFO 5.0 6.1
Variation ‑ 90.8 ‑ 190.6
Gross debt
Economic and fiscal update 684.3 851.9
2019‑20 MYEFO 645.9 643.1
Variation 38.4 208.8
Net debt
Economic and fiscal update 488.2 677.1
2019‑20 MYEFO 392.3 379.2
Variation 95.9 297.9
MYEFO: Mid‑Year Economic and Fiscal OutlookSource: Commonwealth of Australia, Economic and Fiscal Update, July 2020, and Mid‑Year Economic and Fiscal Outlook December 2019
The Australian economy was significantly impacted in the final quarter of 2019‑20 by COVID‑19 related border closures and trading restrictions, and the impacts on consumer spending, business investment and, more broadly, confidence. Despite significant monetary, fiscal, regulatory and financial stability measures that have been put in place, the latest update reports a significant deterioration in all key economic indicators since the Mid‑Year Economic and Fiscal Outlook (MYEFO) (see Table 4 below).
The Commonwealth expects the economy to recover from the June quarter outcome over the forecast period, supported by the easing of restrictions around most of the country (notwithstanding the recent increasing of restrictions from ‘hot spot’ regions), a strengthening in consumer and business confidence and the labour market, and the recovery in the global economy.
Table 4: Commonwealth major economic parameters (%)
2019‑20 MYEFO Economic and Fiscal Update Difference
2019‑20 2020‑21 2019‑20 2020‑21 2019‑20 2020‑21
Real GDP 2.25 2.75 ‑ 0.25 ‑ 2.50 ‑ 2.50 ‑ 5.25
Employment 1.75 1.75 ‑ 4.40 1.00 ‑ 6.15 ‑ 0.75
Unemployment rate 5.25 5.25 7.00 8.75 1.75 3.50
Consumer price index 2.00 2.25 ‑ 0.25 1.25 ‑ 2.25 ‑ 1.00
Wage price index 2.50 2.50 1.75 1.25 ‑ 0.75 ‑ 1.25
Nominal GDP 3.25 2.25 2.00 ‑ 4.75 ‑ 1.25 ‑ 7.00

14 Basis for preparation of report
COVID-19 Financial Report –July 2020
Jurisdictional comparison of fiscal impactIn the other states and territories, there has been no consistent approach to reporting key fiscal indicators but all jurisdiction are reporting downward revisions. Table 5 sets out the information available as at 23 July 2020 on the comparative effect on state and territory fiscal indicators.
Table 5: Key fiscal information released by other states and territories
Summary description
New South Wales Revenue is expected to fall by around $20 billion over five years to 2023‑24.
Victoria An operating deficit of $7.5 billion is projected for 2019‑20. Own‑source taxation and GST revenue is forecast to decrease by $2.5 billion in 2019‑20 and $6 billion in 2020‑21, compared to the 2019‑20 Budget Update released in December 2019.
Queensland Forecast operating deficit of $5.9 billion in 2019‑20 and $8.5 billion in 2020‑21. A reduction in revenue of at least $6.5 billion is expected over 2019‑20 and 2020‑21, including a reduction in GST of up to $2.5 billion over the two years. Gross debt is expected to increase from $43.8 billion in 2019‑20 to $59.4 billion in 2020‑21 at the government sector level, and from $40.2 billion in 2019‑20 to $41.3 billion in 2020‑21 for government owned corporations.
Western Australia Total government revenue is estimated to decline by $1.8 billion over 2019‑20 and 2020‑21.
South Australia Forecast general government surplus of $91 million for 2019‑20 is now expected to be a deficit of $1.9 billion. Net debt forecast to increase by $1.6 billion in 2019‑20. GST revenues expected to reduce by $850 million in 2019‑20 and $1.1 billion in 2020‑21. Payroll tax could be $90 million lower in 2019‑20 and $100 million lower in 2020‑21. Other state taxation revenue could be $230 million lower in 2019‑20 and $360 million lower in 2020‑21.
Tasmania Own‑source taxation revenue is forecast to decrease by $76.3 million in 2019‑20 and by $283.2 million in 2020‑21. GST revenue is forecast to decrease by $309.8 million in 2019‑20 and $357.6 million in 2020‑21. Net debt is forecast to increase to $2.35 billion in 2020‑21, an increase of $1.7 billion from previously published estimates.
Australian Capital Territory
Net operating balance position expected to deteriorate and net debt to rise. This will reflect major reductions in national GST revenue, further reductions in own‑source taxation revenue and increased expenditure to support the COVID‑19 response.

Northern Territory fiscal update 15
Chapter 3Northern Territory fiscal update
This section provides an update on the Territory’s fiscal position, including the 2019‑20 preliminary unaudited outcome and 2020‑21 revised fiscal outlook compared to the 2019‑20 Mid‑Year Report, incorporating budget variations resulting from COVID‑19 response measures, GST revenue updates and other material variations that have occurred since the publication of the 2019‑20 Mid‑Year Report in November 2019.
Overview of budget as at 2019‑20 Mid‑Year ReportPrior to COVID‑19, the Territory’s budget faced challenging circumstances, primarily due to consecutive reductions in GST revenue, moderating economic conditions led by the construction phase of the Ichthys LNG project winding down and increasing demand for frontline services.
In response to these challenges, combined with the Territory’s limited capacity to influence the level of revenue it can generate, significant reforms and savings were implemented in the 2019‑20 Budget to achieve the necessary level of expenditure restraint to return the budget to surplus over the medium term.
The 2019‑20 Mid‑Year Report projected a net operating balance deficit of $787 million in 2019‑20, operating deficits averaging $414 million over the forward estimates and a fiscal balance deficit of $1.05 billion in 2019‑20, reducing to a small surplus by 2027‑28.
Key fiscal indicators – operating statement The updated estimates incorporate the effect of government decisions since the 2019‑20 Mid‑Year Report, further reductions in GST revenues, reductions in own‑source revenue and the flow‑on effect of the 2019‑20 preliminary unaudited outcome.
Table 6 presents the updated key fiscal aggregates for the general government and non financial public sector operating statement measures for 2019‑20 and 2020‑21, compared to those published in the 2019‑20 Mid‑Year Report.
Table 6: Key fiscal indicators – operating statement
2019‑20Outcome1
2020‑21Estimate
$M $MGeneral government sector Net operating balance
2019‑20 Mid‑Year Report ‑ 787 ‑ 420Updated estimate ‑ 887 ‑ 1 504Variation from 2019‑20 Mid‑Year Report ‑ 100 ‑ 1 084
Non financial public sector Fiscal balance
2019‑20 Mid‑Year Report ‑ 1 049 ‑ 1 003Updated estimate ‑ 970 ‑ 2 283Variation from 2019‑20 Mid‑Year Report 79 ‑ 1 280
1 Updated estimate reflects the preliminary unaudited outcome for 2019‑20.

16 Northern Territory fiscal update
COVID-19 Financial Report –July 2020
General government sector net operating balanceThe net operating balance represents total revenue less total operating expenses, with capital spending only recognised in the fiscal balance. As shown in Table 6, the general government sector net operating balance has declined in both years, with a deficit of $887 million in 2019‑20 and a $1.504 billion deficit projected for 2020‑21.
The increased net operating balance deficits largely reflect:
• further reductions in the Territory’s GST revenue as a result of the significant decline in the national GST pool
• declines in own‑source revenue
• the effect of government policy decisions, predominantly to counter the health, financial, economic and employment hardship arising from COVID‑19
• timing variations from 2019‑20 to 2020‑21.
Non financial public sector fiscal balanceThe fiscal balance is influenced by the same factors affecting the general government sector net operating balance, however the fiscal balance includes net capital investment and excludes depreciation.
As shown in Table 6, the fiscal balance estimate for 2019‑20 has improved by $79 million from that published in the 2019‑20 Mid‑Year Report with a deficit of $970 million. However, the updated projection for 2020‑21 has worsened from that estimated at the 2019‑20 Mid‑Year Report, with a projected fiscal balance deficit of $2.283 billion. This increase reflects the factors as described above, combined with new and revised timing of capital expenditure.
Reconciliation with previous fiscal projectionsThe following analysis provides explanations between the updated estimates within this report from those reported in the 2019‑20 Mid‑Year Report. Variations have been classified as policy and non‑policy changes. Policy variations are the result of government decisions to implement new or expanded agency programs, COVID‑19 response measures and savings measures, while non‑policy variations are due to influences outside the government’s control, such as changes in external economic conditions.
Table 7 summarises the effect of policy and non‑policy changes on the non financial public sector’s fiscal balance since the 2019‑20 Mid‑Year Report.
Table 7: Non financial public sector fiscal balance – policy and non‑policy changes since the 2019‑20 Mid‑Year Report
2019‑20Outcome1
2020‑21Estimate
$M $M2019‑20 Mid‑Year Report ‑ 1 049 ‑ 1 003Policy changes ‑ 84 ‑ 356
Non‑policy changes 163 ‑ 924Updated estimate ‑ 970 ‑ 2 283
1 Updated estimate reflects the preliminary unaudited outcome for 2019‑20.

Northern Territory fiscal update 17
As outlined in Table 7, the major cause for the deterioration of the fiscal balance in 2020‑21 is the effect of non‑policy changes, largely further reductions in GST revenue and policy changes to support COVID‑19 response measures.
Policy changes since 2019‑20 Mid‑Year ReportTable 8 highlights the effects of policy changes in the non financial public sector’s fiscal balance since the 2019‑20 Mid‑Year Report.
Table 8: Non financial public sector fiscal balance – policy changes since 2019‑20 Mid‑Year Report
2019‑20Outcome1
2020‑21Estimate
$M $M
Operational commitments ‑ 42 ‑ 117
COVID‑19 response measures ‑ 119 ‑ 216
Capital commitments to support economic rebound ‑ 159
COVID‑19 reprioritisation 24 73
Savings and contingency measures 54 63
Total policy variations ‑ 84 ‑ 356
1 Preliminary unaudited outcome for 2019‑20.
The effect of policy changes over 2019‑20 and 2020‑21 largely reflects government’s decision to implement a number of response measures to counter the economic effects of COVID‑19, combined with a significant increase in funds to progress capital works in 2020‑21.
Operational commitmentsKey operational commitments include:
• $19 million in 2019‑20 and $32 million in 2020‑21 to contribute towards the National Disability Insurance Scheme, not previously budgeted
• $20 million in 2020‑21 to support additional resources for border controls in response to COVID‑19
• $16.2 million in 2020‑21 to support operational and maintenance costs of running quarantine facilities at Howard Springs and Alice Springs
• $15.1 million in 2019‑20 to support continued demand in correctional services and community safety
• $11.8 million in 2020‑21 to prepare the Territory for regulatory petroleum exploration and production activities.
COVID‑19 response measuresIn response to COVID‑19, the Territory Government is delivering $383 million for a range of assistance measures aimed at supporting businesses and individuals, and stimulating economic activity. This comprises $340 million in immediate measures, plus a further $43 million recently approved to extend a number of existing measures and establish the new Business Rebound and Adaptation Grant. COVID‑19 response measures are detailed in section 1 of this report.
18 Northern Territory fiscal update
COVID-19 Financial Report –July 2020
Capital commitments to support economic reboundIn April 2020, the Territory Government committed an additional $157 million in capital works cash for 2020‑21 to support the timely delivery of projects on the 2020‑21 capital works program and stimulate economic recovery. A further $2 million was provided for capital equipment to improve capacity to respond to bushfires.
COVID‑19 reprioritisation and savings measuresTo offset the impact of COVID‑19 response measures on the Territory’s budget position, the Territory Government identified $116 million across a number of projects and programs to be reprioritised. Of these reprioritised funds, $20 million relating to a reduction in the Local Jobs Fund did not improve the fiscal balance position but improved the Territory’s cash balances, in accordance with the accounting treatment of equity investments.
In addition to these reprioritised funds, agency underspends that resulted from the deferral or reduction in expenditure commitments in both 2019‑20 and, to a lesser extent, 2020‑21 were also repurposed to offset the cost of new measures.
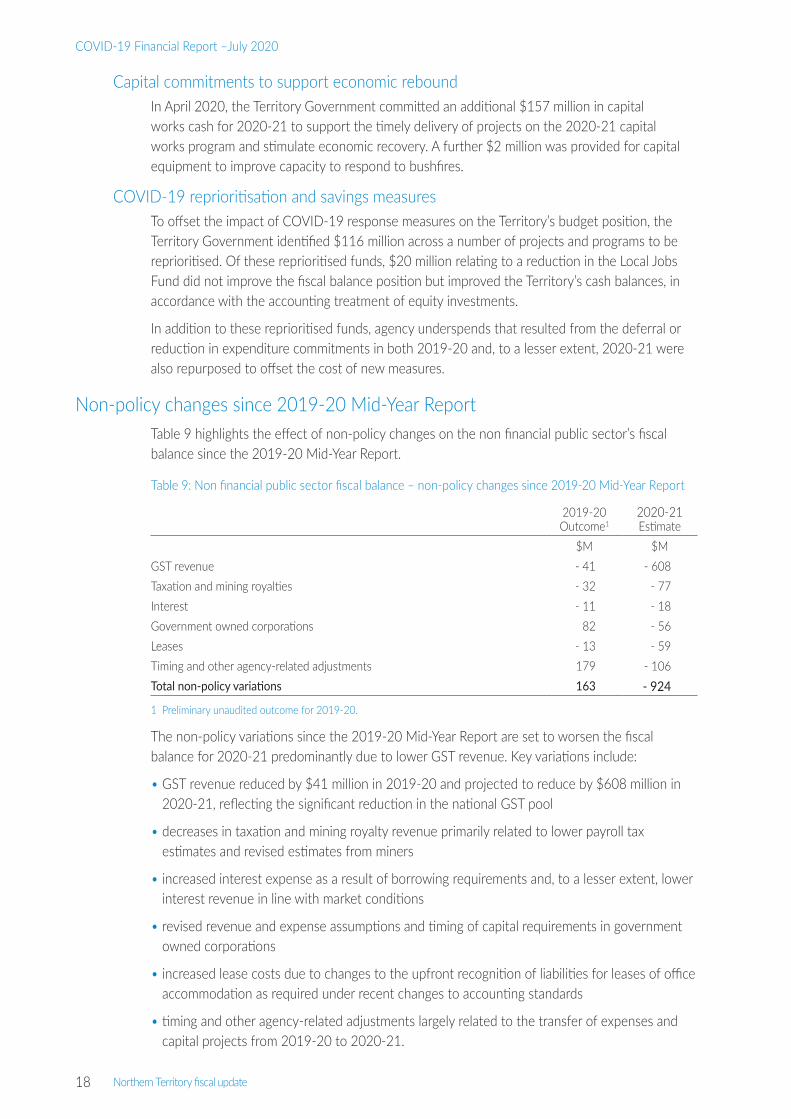
Non‑policy changes since 2019‑20 Mid‑Year ReportTable 9 highlights the effect of non‑policy changes on the non financial public sector’s fiscal balance since the 2019‑20 Mid‑Year Report.
Table 9: Non financial public sector fiscal balance – non‑policy changes since 2019‑20 Mid‑Year Report
2019‑20Outcome1
2020‑21Estimate
$M $MGST revenue ‑ 41 ‑ 608Taxation and mining royalties ‑ 32 ‑ 77Interest ‑ 11 ‑ 18Government owned corporations 82 ‑ 56Leases ‑ 13 ‑ 59Timing and other agency‑related adjustments 179 ‑ 106Total non‑policy variations 163 ‑ 924
1 Preliminary unaudited outcome for 2019‑20.
The non‑policy variations since the 2019‑20 Mid‑Year Report are set to worsen the fiscal balance for 2020‑21 predominantly due to lower GST revenue. Key variations include:
• GST revenue reduced by $41 million in 2019‑20 and projected to reduce by $608 million in 2020‑21, reflecting the significant reduction in the national GST pool
• decreases in taxation and mining royalty revenue primarily related to lower payroll tax estimates and revised estimates from miners
• increased interest expense as a result of borrowing requirements and, to a lesser extent, lower interest revenue in line with market conditions
• revised revenue and expense assumptions and timing of capital requirements in government owned corporations
• increased lease costs due to changes to the upfront recognition of liabilities for leases of office accommodation as required under recent changes to accounting standards
• timing and other agency‑related adjustments largely related to the transfer of expenses and capital projects from 2019‑20 to 2020‑21.
Northern Territory fiscal update 19
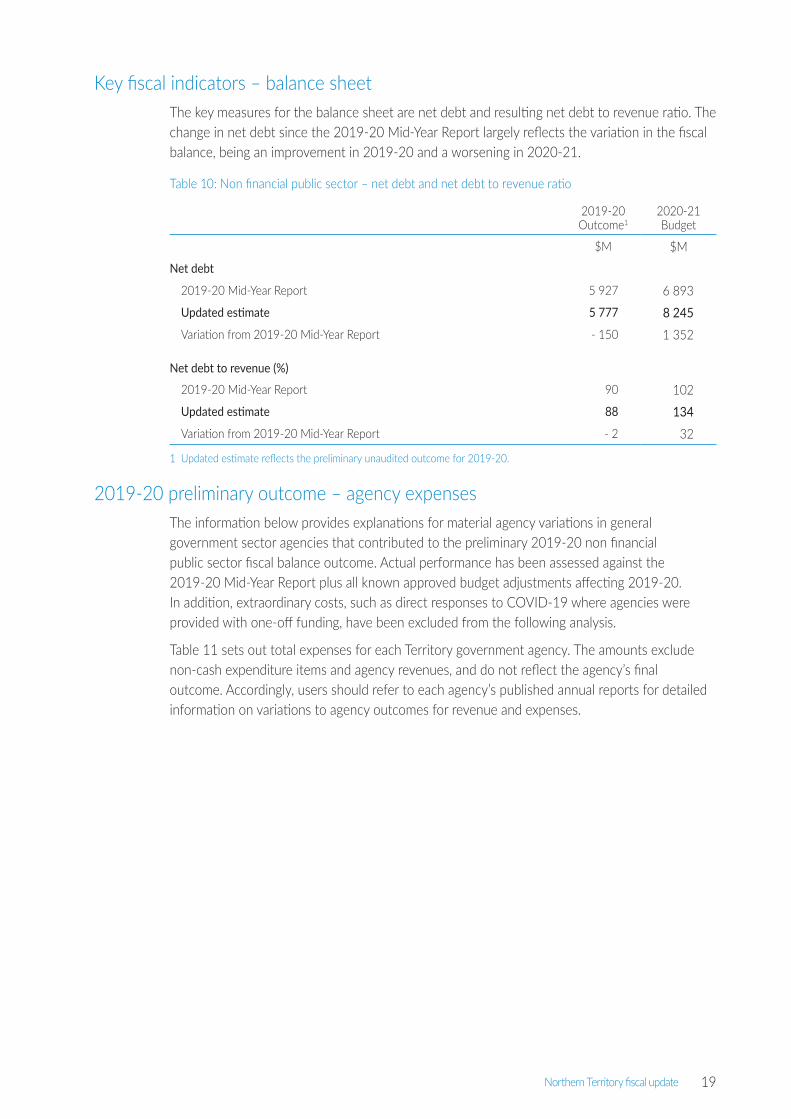
Key fiscal indicators – balance sheetThe key measures for the balance sheet are net debt and resulting net debt to revenue ratio. The change in net debt since the 2019‑20 Mid‑Year Report largely reflects the variation in the fiscal balance, being an improvement in 2019‑20 and a worsening in 2020‑21.
Table 10: Non financial public sector – net debt and net debt to revenue ratio
2019‑20Outcome1
2020‑21Budget
$M $MNet debt
2019‑20 Mid‑Year Report 5 927 6 893Updated estimate 5 777 8 245Variation from 2019‑20 Mid‑Year Report ‑ 150 1 352
Net debt to revenue (%)
2019‑20 Mid‑Year Report 90 102Updated estimate 88 134Variation from 2019‑20 Mid‑Year Report ‑ 2 32
1 Updated estimate reflects the preliminary unaudited outcome for 2019‑20.
2019‑20 preliminary outcome – agency expensesThe information below provides explanations for material agency variations in general government sector agencies that contributed to the preliminary 2019‑20 non financial public sector fiscal balance outcome. Actual performance has been assessed against the 2019‑20 Mid‑Year Report plus all known approved budget adjustments affecting 2019‑20. In addition, extraordinary costs, such as direct responses to COVID‑19 where agencies were provided with one‑off funding, have been excluded from the following analysis.
Table 11 sets out total expenses for each Territory government agency. The amounts exclude non‑cash expenditure items and agency revenues, and do not reflect the agency’s final outcome. Accordingly, users should refer to each agency’s published annual reports for detailed information on variations to agency outcomes for revenue and expenses.

20 Northern Territory fiscal update
COVID-19 Financial Report –July 2020
Table 11: Total expenses by agency
2019‑20 Budget
estimate
2019‑20 Preliminary outcome
Overspend (+)/ underspend (‑)
$000 $000 $000
Auditor‑General's Office 4 924 5 248 324
Department of the Chief Minister 100 107 100 297 190
Department of the Legislative Assembly 24 300 22 686 ‑ 1 614
Northern Territory Electoral Commission 2 524 2 907 383
Office of the Independent Commissioner Against Corruption 5 622 4 319 ‑ 1 303
Ombudsman's Office 2 482 2 377 ‑ 105
Department of Trade, Business and Innovation 239 920 233 763 ‑ 6 157
Department of Treasury and Finance 162 249 144 771 ‑ 17 478
Office of the Commissioner for Public Employment 6 476 6 213 ‑ 263
Northern Territory Police, Fire and Emergency Services 403 973 409 207 5 234
Territory Families 312 256 307 316 ‑ 4 940
Department of the Attorney‑General and Justice 371 430 373 565 2 135
Department of Health 1 614 585 1 635 023 20 438
Top End Health Service 1 065 503 1 074 709 9 206
Central Australia Health Service 431 806 427 909 ‑ 3 897
Department of Local Government, Housing and Community Development
417 022 420 073 3 051
Department of Tourism, Sport and Culture 203 575 201 869 ‑ 1 706
Department of Corporate and Information Services 279 754 279 791 37
Department of Environment and Natural Resources 54 519 54 242 ‑ 277
Aboriginal Areas Protection Authority 5 272 5 329 57
Department of Infrastructure, Planning and Logistics 354 893 332 234 ‑ 22 659
Department of Education 1 003 365 988 774 ‑ 14 591
Department of Primary Industry and Resources 88 815 82 287 ‑ 6 528
Key agency variations include:
• $20.4 million overspend within the Department of Health largely relating to the Territory’s contribution towards the National Disability Insurance Scheme in excess of funded levels
• $9.2 million overspend within the Top End Health Service relating to frontline service pressures in the Royal Darwin and Palmerston hospitals
• $5.2 million overspend within the Northern Territory Police, Fire and Emergency Services largely relating to COVID‑19 border and quarantine expenditure in excess of funded levels, and additional frontline resourcing pressures
• $3.1 million overspend within the Department of Local Government, Housing and Community Development largely relating to disaster relief payments
• agency underspends largely relate to revised timing of Commonwealth and Territory‑funded programs.
In addition to the above, infrastructure and capital‑related expenditure within general government sector agencies was underspent by $57.8 million in 2019‑20, largely relating to the revised timing of Commonwealth‑funded housing and road programs and major information and communications technology projects, in line with revised milestone payments.

Northern Territory fiscal update 21
Revised GST estimatesGST revenue is the Territory’s largest revenue source estimated to represent around 40 per cent of the Territory’s total revenue in 2019‑20. The amount of GST received by the Territory each year reflects the combined impact of the Territory’s share of national population, its GST relativity and the size of the national GST pool. This has reduced since 2016, when GST represented around 50 per cent of the Territory’s total revenue.
Since the Territory’s 2019‑20 Mid‑Year Report, Australia has experienced significant disruptions in consumer spending arising from the extreme summer bushfires and closure of many industries and businesses during COVID‑19.
As a result of these economic conditions, the Commonwealth’s Economic and Fiscal Update released on 23 July 2020 forecasts a substantial reduction of around $5.2 billion to the national GST pool in 2019‑20 and $7.6 billion in 2020‑21. These are in addition to the reductions already reported in the Commonwealth 2019‑20 MYEFO ($1.8 billion in 2019‑20 and $2.4 billion in 2020‑21), which themselves came on top of reductions in the Commonwealth 2019‑20 Budget.
This is expected to result in a reduction of the Territory’s GST revenue of $261 million in 2019‑20 and $389 million in 2020‑21.
However, due to the manner in which GST revenue is received from the Commonwealth, with payments currently based on the 2019‑20 MYEFO, the reduction to the Territory’s GST revenue for 2019‑20 will mainly occur through a balancing adjustment made in 2020‑21. Therefore, the updated estimates reflect $41 million lower receipts in 2019‑20 and an estimated reduction of $608 million in 2020‑21 compared to the 2019‑20 Mid‑Year Report. These figures are presented in Table 9.
These GST reductions take the cumulative reduction in estimated GST funding to the Territory since 2015‑16 to more than $3.1 billion.
Own‑source revenuesThe Territory’s own‑source revenue largely comprises mining royalties, payroll tax, conveyance duty, and gambling, motor vehicle and insurance taxes.
Table 12: Own‑source revenue estimates for 2019‑20 and 2020‑21 compared to the Mid‑Year Report
2019‑20 2020‑21
Mid‑Year Report Outcome1 Mid‑Year Report Estimate
$M $M $M $M
Mining royalties 411.7 405.6 350.0 308.7
Payroll tax 228.3 200.0 246.8 192.4
Conveyance and related duty 76.5 70.7 103.6 118.2
Taxes on gambling 85.2 75.3 88.5 80.3
Motor vehicle taxes 79.1 72.2 81.5 73.3
Taxes on insurance 50.8 55.0 51.8 56.1
Other taxes 0.0 2.1 0.0 2.0
TOTAL 931.6 880.8 922.2 831.0
1 Preliminary unaudited 2019‑20 outcome.

22 Northern Territory fiscal update
COVID-19 Financial Report –July 2020
In aggregate, own‑source revenue receipts in 2019‑20 were $50.8 million (around 5 per cent) lower than estimated in the 2019‑20 Mid‑Year Report, while own‑source revenues for 2020‑21 are expected to decline by $91.2 million (around 10 per cent) compared to the 2019‑20 Mid‑Year Report forecast.
Estimates of own‑source revenue in 2020‑21 are subject to a higher level of uncertainty than usual due to ongoing uncertainty around the economic effects of COVID‑19, and the impact on businesses and employment when the Commonwealth JobKeeper payments and other assistance reduce and subsequently cease.
Mining royaltiesMining royalties are the single largest own‑source revenue for the Territory. At the time of the 2019‑20 Mid‑Year Report, mining royalty collections were estimated at $411.7 million in 2019‑20 and $350 million in 2020‑21. Mining royalty collections for 2019‑20 have remained broadly in line with mid‑year expectations, at $405.6 million, while collections for 2020‑21 are expected to decline to $308.7 million, reflecting greater global economic uncertainty, partially offset by an improved United States/Australian dollar exchange rate and an improving outlook for the price of gold.
Payroll taxIn 2019‑20, $200 million was collected in payroll tax revenue, $28.3 million lower than the estimate of $228.3 million in the 2019‑20 Mid‑Year Report. Payroll tax collections are expected to decline in 2020‑21 to $192.4 million, a decrease of $54.4 million from the forecast of $246.8 million in the 2019‑20 Mid‑Year Report.
The expected decline in payroll tax revenue reflects the general economic impacts of COVID‑19, such as increased unemployment and diminished consumer and household confidence, business interruptions arising from the Commonwealth and Territory’s health response, including national and territory border closures, temporary business closures and variations to business operations to accommodate physical distancing. The revised estimates also incorporate the revenue foregone from payroll tax waivers and deferrals for eligible businesses for up to six months as part of the Territory Government’s business hardship relief measures provided by the Territory, and a payroll tax waiver on Commonwealth JobKeeper payments.
Conveyance and related dutyThe Territory’s conveyance and related duty is derived from direct and indirect conveyances on dutiable property in the Territory, such as real estate, business property and the acquisition of interests in corporate structures that own land in the Territory.
Conveyance and related duty collections totalled $70.7 million in 2019‑20, a reduction of $5.8 million compared to the estimate of $76.5 million in the 2019‑20 Mid‑Year Report. This reduction reflects lower economic activity and consumer confidence as a result of COVID‑19 in the last quarter of the 2019‑20 financial year.
In 2020‑21, conveyance and related duty revenue is expected to total $118.2 million, an increase of $14.6 million compared to the estimate of $103.6 million in the Mid‑Year Report. The 2020‑21 estimates reflect the negative economic impact of COVID‑19 and impact on the employment outlook, consumer confidence and household income offset by a large one‑off commercial transaction that occurred in 2019‑20 to be brought to account in 2020‑21.
Northern Territory fiscal update 23
Taxes on gambling Taxes on gambling are the fourth most significant own‑source revenue in the Territory behind mining royalties, payroll tax and conveyance duties. Taxes on gambling comprise wagering taxes (on horse and greyhound racing), bookmakers and betting exchange taxes, community gaming machine taxes paid by casinos, pubs and clubs with gaming machines, lottery taxes and the community benefit levy.
Gaming and wagering venues were directed to temporarily close in March 2020 due to COVID‑19 and did not reopen until 5 June 2020. Casinos, pubs and clubs were granted a gaming tax waiver for the month of March 2020. As a result, gambling tax revenue in 2019‑20 was $75.3 million, a reduction of $9.9 million from the 2019‑20 Mid‑Year Report estimate of $85.2 million. In 2020‑21, gambling tax revenue is expected to be $80.3 million, a reduction of $8.2 million from the $88.5 million forecast in the 2019‑20 Mid‑Year Report.
Motor vehicle taxesMotor vehicle taxes comprise stamp duty payable on vehicle purchases as well as motor vehicle registration fees. These revenues move in line with economic activity, population growth, employment, household income and consumer confidence. In addition, motor vehicle registration fees are indexed to the change in revenue units. Cabinet determined that revenue units were to be held constant at 2019‑20 levels in 2020‑21. Motor vehicle taxes in 2019‑20 totalled $72.2 million compared to the 2019‑20 Mid‑Year Report of $79.1 million. In 2020‑21, motor vehicle taxes are expected to total $73.3 million compared to the 2019‑20 Mid‑Year Report of $81.5 million. This revised outlook reflects the negative economic impact of COVID‑19.
Taxes on insuranceThe outlook for stamp duty on insurance, which is the second largest stamp duty revenue line, has exceeded the mid‑year outlook for 2019‑20 and is on track to also exceed the revenue expectation for 2020‑21. Stamp duty on insurance is now expected to be around 8 per cent higher in 2019‑20 and 2020‑21 than estimated at mid‑year. Stamp duty on insurance is expected to average $55.5 million across 2019‑20 and 2020‑21, up from a mid‑year average of $51.3 million.
Other taxesOther taxes comprise the Commercial Passenger Levy and the Property Activation Levy. The passenger service levy relates to a $1 per trip levy applied to all trips of point‑to‑point transport services. The Property Activation Levy was introduced from 1 July 2019 and applies to vacant land and vacant ground floor commercial premises within a designated zone in the central business district. It is designed to incentivise activation of vacant spaces.

24
COVID-19 Financial Report –July 2020

Economic update 25
Chapter 4Economic update
COVID‑19 has resulted in a significant ongoing shock to global, national and regional economies. Governments have implemented strict measures to slow the transmission of the virus and its associated health impacts. The scale of the restrictions and impacts on economies is unprecedented. The pace of easing restrictions in the Territory and nationally will heavily influence economic outlooks. The risk of infection rates rising is very real, which has been seen in Victoria since early July, and has the capacity to derail economic recovery efforts. In this environment, forecasting the Territory’s economic outlook is increasingly difficult.
Restrictions and physical distancing measures have been successful in slowing infection rates but have had significant economic impacts, especially in those industries that rely on close contact with a large number of customers. In the Territory, household spending was starting to show early signs of recovery in early 2020 but was subsequently impacted by COVID‑19‑related job losses and ongoing uncertainty regarding the pace and shape of the recovery. The necessary pace and severity of measures to slow infection rates gave households and businesses little time to respond and adjust their business models. In this environment, there was a strong need for governments to implement short to medium‑term measures to assist individuals and businesses to cope and adjust to the new reality.
Government fiscal stimulus measures have been supported by the Reserve Bank of Australia (RBA), which reduced the cash rate by 50 basis points to 0.25 per cent in March 2020, and advised it will not increase this rate until progress is being made towards full employment. The RBA has also implemented other measures to provide financial market liquidity, help lower funding costs across the economy and support the provision of credit – especially to small and medium‑sized businesses.
Leading indicators have generally picked up recently but the RBA has flagged that the economy will need considerable support for some time. This will be assisted by the Commonwealth’s recent commitment to extend a range of economic support packages.
The RBA’s ‘baseline’ (gradual recovery) growth outlook scenario suggests national economic growth is expected to start recovering in the second half of 2020 led by consumption, with growth over 2021 also supported by business and dwelling investment. Nonetheless, the level of output in 2022 is still expected to be below levels estimated in the RBA’s February 2020 Statement on Monetary Policy. In this scenario the national unemployment rate was expected to peak at around 10 per cent in June 2020 and be above pre‑COVID‑19 levels in two years’ time.
The degree of uncertainty regarding the economic outlook is reflected in forecasts reported by organisations such as Deloitte Access Economics, the Commonwealth Bank, ANZ and NAB. These forecasts have varied significantly and been subject to significant revisions as new data is released. However, there has been a general consensus that the Territory is likely to be the least affected of the jurisdictions due to its low level of infection and capacity to lift business restrictions earlier than the rest of the country. That said, the impacts are still significant and are particularly being felt in the tourism, arts and recreation, transport and construction industries.

26 Economic update
COVID-19 Financial Report –July 2020
Although all jurisdictions have deferred the release of budgets, most jurisdictions have released abridged fiscal and economic updates or ministerial statements, including New South Wales, Victoria, Western Australia, Tasmania and the Australian Capital Territory. All jurisdictions are reporting downward revisions to key economic indicators.
Of the jurisdictions reporting gross state product (GSP), downward revisions for 2019‑20 range from minus 2.3 percentage points in Western Australia (from 3 per cent to 0.7 percent), to minus 4.75 percentage points in Tasmania (from 3 per cent to minus 1.75 per cent). Victoria has estimated real GSP to fall 5.25 per cent in 2020.
Western Australia is the only jurisdiction to update GSP forecasts for 2020‑21 and reports a downward revision of 5.6 percentage points (from 2.5 per cent to minus 3.1 per cent).
Due to the ongoing uncertainty, the revised economic estimates are only presented for 2019‑20 and 2020‑21, and need to be viewed in the context of being prepared in a highly uncertain and rapidly evolving environment, acknowledging they will be revised further in future updates.
Economic performance and outlook prior to COVID‑19Immediately prior to COVID‑19 the Territory’s domestic economy was starting to show early signs of recovery, with private consumption and investment improving as the economy transitioned following the huge investment for the Ichthys LNG project and its impact on investment, population, employment and consumer spending.
This was reflected in the 2019‑20 Mid‑Year Report (released in November 2019), which forecast GSP growth of 6.3 per cent in 2019‑20 and averaging 3.2 per cent over the forward estimates. The strong growth outlook for 2019‑20 was underpinned by LNG exports but was also supported by improving conditions in the domestic, onshore economy. Data released since the 2019‑20 Mid‑Year Report (and prior to COVID‑19) supported this improving domestic outlook, with:
• year‑on‑year growth in state final demand (SFD) showing early signs of recovering, reporting three consecutive quarters of improvement to the March quarter 2020
• employment trending up in the nine months to March 2020
• retail spending trending up in the year to March 2020
• residential building approvals reporting three consecutive months of growth
• the decline in the rate of annual business investment growth slowing.
Economic data released since March 2020 reports that conditions have deteriorated markedly.
Key economic indicatorsTable 13 reports key economic indicators as at the 2019‑20 Mid‑Year Report and revised estimates. The revised estimates are reported in two ways. The first revised estimate incorporates the impact of Commonwealth and Territory government stimulus measures on the indicators. The second revised estimate reflects the likely impact on the economic indicators in the absence of any government stimulus.

Economic update 27
Table 13: Summary of COVID‑19 impacts to key economic indicators
2019‑20 2020‑21
2019‑20 Mid‑Year Report
Revised est. policy
intervention
Revised est. no policy
intervention
2019‑20 Mid‑Year Report
Revised est. policy
intervention
Revised est. no policy
intervention% % % % % %
Gross state product1 6.3 3.8 2.3 4.1 ‑ 3.4 ‑ 5.0
State final demand1 ‑ 1.7 ‑ 4.0 ‑ 5.6 0.3 ‑ 3.9 ‑ 5.7
Employment2 ‑ 2.0 ‑ 0.8 ‑ 2.1 0.7 ‑ 1.6 ‑ 3.6
Unemployment rate³ 5.0 5.6 6.8 4.5 6.8 8.3
Population4 0.0 ‑ 0.3 ‑ 0.3 0.6 0.1 0.1
Consumer price index2 1.2 0.7 0.7 1.4 0.5 0.5
Wage price index2 1.5 2.3 2.3 1.5 1.7 1.7
est.: estimate1 Year ended June, year‑on‑year percentage change, inflation adjusted.2 Year ended June, year‑on‑year percentage change.3 Year average.4 Year ended June, annual percentage change.Source: Department of Treasury and Finance; Australian Bureau of Statistics
Impact on the economyThe duration and severity of COVID‑19 physical distancing measures will impact this economic outlook. In the Territory these measures have included the closure or limitation of business activity that relies on direct consumer contact, and restrictions on international, interstate and intrastate travel. The restrictions have created a series of supply and demand shocks in the economy, resulting in significantly reduced tourist numbers and the effective closure of many tourism activities, lower consumption of goods and services, and reduced demand for labour. With labour‑intensive tourism‑related activities representing over 4 per cent of the Territory economy, the pace of the easing of restrictions for interstate and international visitors will be a significant factor influencing the pace of the economic recovery.
The Territory’s decisive health policy response, support packages and early easing of restrictions through the Roadmap to the new normal plan have supported activity but the Territory is not immune from the economic impacts of COVID‑19. The pace of the Territory’s recovery will also depend on how the national economy recovers, how household and business behaviours and production might change, and how successful government policies and assistance measures are in supporting households and businesses over the medium term.
The economic modelling incorporates assumptions that:
• the Territory’s borders opened on 17 July 2020 but restrictions for people coming from Victoria and other dedicated hotspots persist for the September quarter 2020
• international visitor numbers are very low through 2020‑21
• the Commonwealth’s JobKeeper and JobSeeker programs continue as announced on 21 July 2020
• interstate and international trade of goods is relatively unaffected by COVID‑19.
28 Economic update
COVID-19 Financial Report –July 2020
Gross state product and state final demandIt is estimated the Territory’s GSP will grow by 3.8 per cent in 2019‑20 to $27.1 billion. This is down from the 2019‑20 Mid‑Year Report estimate of 6.3 per cent growth. GSP is anticipated to contract by 3.4 per cent in 2020‑21, down from 4.1 per cent growth published in the 2019‑20 Mid‑Year Report. SFD is expected to decrease by about 4 per cent in both 2019‑20 and 2020‑21.
Estimates include the positive impact of COVID‑19 assistance packages implemented by the Commonwealth and Territory governments, including the continuation of the Commonwealth’s JobKeeper and JobSeeker programs.
It is estimated the stimulus measures will contribute around $400 million per annum to SFD in 2019‑20 and 2020‑21, and illustrates that in the absence of stimulus, economic conditions in the Territory would be significantly worse.
Household consumption is now anticipated to decrease by 1 per cent in 2019‑20 and 2.6 per cent in 2020‑21, reflecting ongoing uncertainty and declining population. Businesses most impacted by weaker household consumption will be those operating in the recreation, travel, culture, hotel, café and restaurant sectors. The recovery of household consumption through 2020‑21, particularly for non‑discretionary spending, is likely to be slow and linked to employment growth.
Even prior to COVID‑19, the Territory’s investment pipeline was subdued and weaker global economic conditions are likely to further constrain business investment in the short to medium term. This is especially the case for energy exploration and investment in the Territory (both upstream and downstream), which will be impacted by weaker global demand and prices for oil.
Further out, changes in demand in traditional energy markets could create domestic and international opportunities in the renewable energy sector to support the Territory’s economic recovery. This would be consistent with the Territory Government’s goals that 50 per cent of energy consumed in the Territory will be from renewables by 2030 and carbon emissions reduced to net zero by 2050.
The outlook for dwelling and other construction is a risk to the economic forecasts, notably from the December quarter onwards, as the impact on consumer and business sentiment could be significant if stimulus is removed from the economy before conditions improve sufficiently. Acknowledging this risk, the Territory Government implemented the Home Improvement Scheme to protect the Territory from the deep economic impact of COVID‑19 and keep shops and businesses open, cash flowing and people working.
The Home Improvement Scheme is designed to fast‑track screwdriver‑ready projects and has almost 20 000 applications, which are expected to contribute almost $270 million to the Territory economy over the coming year. The Commonwealth has also introduced the HomeBuilder initiative to support activity and employment in the residential construction market by encouraging the commencement of new home builds and renovations.

Economic update 29
EmploymentBorder closures, trading restrictions and physical distancing had immediate impacts on the viability of many Territory businesses, which flowed through to reduced employment, notably in the retail trade, accommodation and food services, arts and recreation, and transport industries. Although restrictions are starting to ease, the subdued economic environment and trading conditions are expected to persist for an extended period and will continue to impact business confidence. Constrained cash flow and weaker confidence will impact new business investment in the short to medium term as firms bunker down to focus on key activities needed to survive COVID‑19 and delay or cancel investments. This will flow directly through to fewer jobs in industries that rely on investment in physical infrastructure, such as professional services and construction.
Since the COVID‑19 outbreak, labour market conditions in the Territory have deteriorated, with an estimated loss of around 3600 workers in the June quarter 2020, largely due to the impact of restrictions. This represents a 2.7 per cent drop in employment in the quarter and 0.8 per cent decline in 2019‑20 relative to 2018‑19. Notwithstanding the June quarter deterioration, the employment result for 2019‑20 is a significant improvement on the 2019‑20 Mid‑Year Report estimate of a 2 per cent decline and is due to stronger than expected employment growth in the six months to April 2020.
At the same time, the average unemployment rate for 2019‑20 is weaker than estimated in the Mid‑Year Report. This reflects that unemployed people have had a greater propensity to remain in the Territory over the past year. Historically a large proportion of people not able to secure employment in the Territory have a tendency to migrate interstate. In the June quarter trading restrictions saw unemployment numbers increase further, at a time when border restrictions inhibited mobility and when there were also reduced employment opportunities interstate.
Despite the decrease in employment, the impact of the restrictions would have been significantly worse in the absence of government assistance measures. It is estimated the Commonwealth and Territory government stimulus measures have saved about 6700 workers who would have otherwise lost their jobs. In the absence of such measures, employment is expected to have declined by 2.1 per cent in 2019‑20.
New payroll data reports the impact on jobs and wages in the Territory has been less severe compared to the rest of Australia with gradual recovery in the Territory commencing mid‑April (Chart 1). While the accommodation and food services, and arts and recreation industries are still severely impacted (Chart 2), the data reports employment in these sectors was closest to pre‑COVID (14 March) levels of all jurisdictions.

30 Economic update
COVID-19 Financial Report –July 2020
Chart 1: Employee jobs and wages index, single touch payroll1
1 Index 14 March = 100Source: Department of Treasury and Finance; Australian Bureau of Statistics
Chart 2: Change in employee jobs between 14 March and 11 July 2020
Source: Department of Treasury and Finance; Australian Bureau of Statistics
Labour market conditions are expected to remain subdued over the rest of 2020 but will be supported by lifting domestic travel restrictions (apart from the recent sharp increases in COVID‑19 cases in Victoria and New South Wales) and government stimulus packages. Despite easing restrictions, employment is expected to decline by a further 1.6 per cent in 2020‑21, influenced by the continuation of the Commonwealth’s JobKeeper and JobSeeker programs and the recently announced JobTrainer program. Even with these measures, employment conditions are expected to be subdued in the second half of 2020‑21.
85
90
95
100
105
Northern Territory jobs Australia jobs Northern Territory wages Australia wages
25 Jan 08 Feb 22 Feb 07 Mar 21 Mar 04 Apr 18 Apr 02 May 16 May 30 May 13 Jun 27 Jun 11 Jul
Northern Territory Australia-20 -15 -10 -5 0 5 %
Agriculture, forestry and fishingElectricity, gas, water and waste services
Public administration and safetyRetail trade
Financial and insurance servicesHealth care and social assistance
Education and trainingArts and recreational services
ManufacturingRental, hiring and real estate services
Information media and telecommunicationsOther services
ConstructionAdministrative and support services
Professional, scientific and technical servicesAccommodation and food servicesTransport, postal and warehousing
Wholesale tradeMining