COVID-SCORE: A global survey to ... - LSHTM Research Online
18
RESEARCH ARTICLE COVID-SCORE: A global survey to assess public perceptions of government responses to COVID-19 (COVID-SCORE-10) Jeffrey V. Lazarus ID 1 *, Scott Ratzan 2 , Adam Palayew 1 , Francesco C. Billari 3 , Agnes Binagwaho ID 4 , Spencer Kimball 5 , Heidi J. Larson 6,7 , Alessia Melegaro 3 , Kenneth Rabin 2 , Trenton M. White 1 , Ayman El-Mohandes ID 2 1 Barcelona Institute for Global Health (ISGlobal), Hospital Clı ´nic, University of Barcelona, Barcelona, Spain, 2 Graduate School of Public Health & Health Policy, City University of New York (CUNY), New York, New York, United States of America, 3 Department of Social and Political Science, Bocconi University, Milan, Italy, 4 University of Global Health Equity, Kigali, Rwanda, 5 Emerson College, Boston, Massachusetts, United States of America, 6 London School of Hygiene and Tropical Medicine, London, United Kingdom, 7 Department of Health Metrics Sciences, University of Washington, Seattle, Washington, United States of America * [email protected] Abstract Background Understanding public perceptions of government responses to COVID-19 may foster improved public cooperation. Trust in government and population risk of exposure may influ- ence public perception of the response. Other population-level characteristics, such as country socio-economic development, COVID-19 morbidity and mortality, and degree of democratic government, may influence perception. Methods and findings We developed a novel ten-item instrument that asks respondents to rate key aspects of their government’s response to the pandemic (COVID-SCORE). We examined whether the results varied by gender, age group, education level, and monthly income. We also exam- ined the internal and external validity of the index using appropriate predefined variables. To test for dimensionality of the results, we used a principal component analysis (PCA) for the ten survey items. We found that Cronbach’s alpha was 0.92 and that the first component of the PCA explained 60% of variance with the remaining factors having eigenvalues below 1, strongly indicating that the tool is both reliable and unidimensional. Based on responses from 13,426 people randomly selected from the general population in 19 countries, the mean national scores ranged from 35.76 (Ecuador) to 80.48 (China) out of a maximum of 100 points. Heterogeneity in responses was observed across age, gender, education and income with the greatest amount of heterogeneity observed between countries. National scores correlated with respondents’ reported levels of trust in government and with country- level COVID-19 mortality rates. PLOS ONE PLOS ONE | https://doi.org/10.1371/journal.pone.0240011 October 6, 2020 1 / 18 a1111111111 a1111111111 a1111111111 a1111111111 a1111111111 OPEN ACCESS Citation: Lazarus JV, Ratzan S, Palayew A, Billari FC, Binagwaho A, Kimball S, et al. (2020) COVID- SCORE: A global survey to assess public perceptions of government responses to COVID-19 (COVID-SCORE-10). PLoS ONE 15(10): e0240011. https://doi.org/10.1371/journal.pone.0240011 Editor: David Hotchkiss, Tulane University, UNITED STATES Received: July 25, 2020 Accepted: September 17, 2020 Published: October 6, 2020 Copyright: © 2020 Lazarus et al. This is an open access article distributed under the terms of the Creative Commons Attribution License, which permits unrestricted use, distribution, and reproduction in any medium, provided the original author and source are credited. Data Availability Statement: All relevant data are within the manuscript and its Supporting Information files. Funding: Funding for this international study was made possible by unrestricted grants from the research foundation budget of the City University of New York (CUNY) Graduate School of Public Health and Health Policy. In addition, grants were received from Dr. Jonathan Fielding, the United States Council for International Business Foundation, Dr. Kenneth Rabin and Bocconi
Transcript of COVID-SCORE: A global survey to ... - LSHTM Research Online

RESEARCH ARTICLE
COVID-SCORE: A global survey to assess
public perceptions of government responses
to COVID-19 (COVID-SCORE-10)
Jeffrey V. LazarusID1*, Scott Ratzan2, Adam Palayew1, Francesco C. Billari3,
Agnes BinagwahoID4, Spencer Kimball5, Heidi J. Larson6,7, Alessia Melegaro3,
Kenneth Rabin2, Trenton M. White1, Ayman El-MohandesID2
1 Barcelona Institute for Global Health (ISGlobal), Hospital Clı́nic, University of Barcelona, Barcelona, Spain,
2 Graduate School of Public Health & Health Policy, City University of New York (CUNY), New York, New
York, United States of America, 3 Department of Social and Political Science, Bocconi University, Milan, Italy,
4 University of Global Health Equity, Kigali, Rwanda, 5 Emerson College, Boston, Massachusetts, United
States of America, 6 London School of Hygiene and Tropical Medicine, London, United Kingdom,
7 Department of Health Metrics Sciences, University of Washington, Seattle, Washington, United States of
America
Abstract
Background
Understanding public perceptions of government responses to COVID-19 may foster
improved public cooperation. Trust in government and population risk of exposure may influ-
ence public perception of the response. Other population-level characteristics, such as
country socio-economic development, COVID-19 morbidity and mortality, and degree of
democratic government, may influence perception.
Methods and findings
We developed a novel ten-item instrument that asks respondents to rate key aspects of
their government’s response to the pandemic (COVID-SCORE). We examined whether the
results varied by gender, age group, education level, and monthly income. We also exam-
ined the internal and external validity of the index using appropriate predefined variables. To
test for dimensionality of the results, we used a principal component analysis (PCA) for the
ten survey items. We found that Cronbach’s alpha was 0.92 and that the first component of
the PCA explained 60% of variance with the remaining factors having eigenvalues below 1,
strongly indicating that the tool is both reliable and unidimensional. Based on responses
from 13,426 people randomly selected from the general population in 19 countries, the
mean national scores ranged from 35.76 (Ecuador) to 80.48 (China) out of a maximum of
100 points. Heterogeneity in responses was observed across age, gender, education and
income with the greatest amount of heterogeneity observed between countries. National
scores correlated with respondents’ reported levels of trust in government and with country-
level COVID-19 mortality rates.
PLOS ONE
PLOS ONE | https://doi.org/10.1371/journal.pone.0240011 October 6, 2020 1 / 18
a1111111111
a1111111111
a1111111111
a1111111111
a1111111111
OPEN ACCESS
Citation: Lazarus JV, Ratzan S, Palayew A, Billari
FC, Binagwaho A, Kimball S, et al. (2020) COVID-
SCORE: A global survey to assess public
perceptions of government responses to COVID-19
(COVID-SCORE-10). PLoS ONE 15(10): e0240011.
https://doi.org/10.1371/journal.pone.0240011
Editor: David Hotchkiss, Tulane University, UNITED
STATES
Received: July 25, 2020
Accepted: September 17, 2020
Published: October 6, 2020
Copyright: © 2020 Lazarus et al. This is an open
access article distributed under the terms of the
Creative Commons Attribution License, which
permits unrestricted use, distribution, and
reproduction in any medium, provided the original
author and source are credited.
Data Availability Statement: All relevant data are
within the manuscript and its Supporting
Information files.
Funding: Funding for this international study was
made possible by unrestricted grants from the
research foundation budget of the City University of
New York (CUNY) Graduate School of Public
Health and Health Policy. In addition, grants were
received from Dr. Jonathan Fielding, the United
States Council for International Business
Foundation, Dr. Kenneth Rabin and Bocconi

Conclusions
The COVID-SCORE survey instrument demonstrated satisfactory validity. It may help gov-
ernments more effectively engage constituents in current and future efforts to control
COVID-19. Additional country-specific assessment should be undertaken to measure
trends over time and the public perceptions of key aspects of government responses in
other countries.
Introduction
COVID-19, the disease caused by severe acute respiratory syndrome coronavirus 2 (SARS--
CoV-2), has devastated communities, societies and economies worldwide since its emergence
in Wuhan, China, in December 2019. As of 30 June 2020, more than 10 million cases of
COVID-19 had been reported in 188 countries and territories, and more than 505,000 deaths
had been attributed to the disease [1].
Governments have sought to contain the COVID-19 pandemic by imposing restrictions on
activities that enable SARS-CoV-2 to spread rapidly through large networks of people. Com-
mon measures have included travel restrictions, closure of schools and places of worship, and
stay-at-home orders, although approaches and timetables have differed greatly [2]. Public offi-
cials also have promoted the uptake of preventive behaviours such as wearing masks, hand-
washing, and physical distancing. However, responses to these efforts have varied across
settings and age groups [3, 4]. Possible factors for limited or non-compliance include distrust
of government [3, 5] and confusion among some segments of the population about conflicting
or unclear COVID-19 information received from government sources [6–9].
The degree of public compliance with government orders and prevention recommenda-
tions can greatly affect the course of the pandemic, especially as COVID-19 vaccine research is
still in its early stages and no definitive treatments are available. The relationship between peo-
ple’s willingness to comply and their perceptions of how credibly and effectively their govern-
ments are responding to COVID-19 warrants careful investigation. Trust in government has
been correlated with willingness to adopt protective behaviours in the face of other health
threats such as the 2009 H1N1 pandemic [10, 11] and the 2014–2016 West African Ebola epi-
demic [12]. In the rapidly emerging body of COVID-19 research, a cross-sectional study on
Australians’ perceptions of COVID-19 found that individuals who reported higher trust in the
government and authorities were more likely to comply with recommended hygienic practices
and to avoid physical interaction by cancelling travel plans and staying away from crowds [5].
As this line of research continues to develop, validated instruments will be needed to mea-
sure perceptions of government responses to COVID-19 in relation to key domains of perfor-
mance such as health communication, social welfare and access to healthcare services. A single
general tool that can capture this information across multiple countries while being sensitive
to language and cultural differences would be of benefit to researchers and policymakers alike.
To that end, this paper seeks to validate the COVID-SCORE instrument and report findings
on public perception in 19 countries heavily affected by COVID-19.
Methods
Ethics statement
This study was approved by Emerson College, USA (IRB protocol number 20-023-F-E6/12)
with an expiration date of 11 June 2021. The online questionnaire was administered by
PLOS ONE COVID-SCORE-10
PLOS ONE | https://doi.org/10.1371/journal.pone.0240011 October 6, 2020 2 / 18
University (Italy). The authors are solely
responsible for all content, and non-authoring
funders played no role in study design, data
collection and analysis, decision to publish, or
preparation of the manuscript.
Competing interests: The authors have declared
that no competing interests exist.
Emerson College to gather information from respondents after obtaining their written,
informed consent about the survey and this project. Equitable compensation per survey was
applied ($2 per complete for Mturk data and increased up to US $3 in some countries) regard-
less of country being polled to comply with ethical compensation standards. No personally
identifiable information was collected or stored.
Survey instrument design
The instrument was modified from a longer COVID-SCORE-20 survey [13] by an expert
panel, following a comprehensive literature review regarding governmental responses to pan-
demics and other natural disasters. The specific items, although guided by the literature, are
original to this study. Each participant responded to a total of 22 items, including the ten
COVID-SCORE-10 items and demographic questions, with the US having an additional ques-
tion (23) on race/ethnicity. The information on age and income was collected through open-
ended responses and later coded. Prior to data collection, a pilot study was conducted to test
the validity of the content and reliability of the questions with both experts and members of
the general public. Data from this pilot study were used to revise the questions in terms of
semantics and comprehension.
The survey was presented in American English and Spanish to respondents in the United
States, and in British English in the United Kingdom, South Africa, and Singapore. It was pre-
sented in British English and Hindi in India, British English and French in Canada, and British
English and Hausa in Nigeria. It was presented in the national languages of Brazil, China
(Mandarin), Ecuador, France, Germany, Italy, Mexico, Poland, Russia, South Korea, Spain
and Sweden. All translators and proofreaders were native speakers who lived in the country to
be surveyed. Translated surveys are available in supplementary files. The 19 countries were
selected because they were amongst the 25 countries with the highest reported numbers of
COVID-19 cases at the time the study was launched (12 June 2020) or, to ensure geographical
representation, had the most cases in a WHO region but were not among the countries with
the highest number of reported cases worldwide.
Data collection instrument
COVID-SCORE-10 includes ten items. Each item was selected to assess public perceptions
of a key responsibility of government during the pandemic. Responses to each item ranged
from “completely disagree” for a minimum score of 1 to “completely agree” for a maxi-
mum score of 5. To calculate an overall COVID-SCORE, we summed the responses from
each of the ten items and then applied a min-max transformation [14] and multiplied the
values by 100 to obtain a score that ranged from 0 to 100. We then calculated the mean
score and the associated standard deviation for each country to produce a country-level
COVID score.
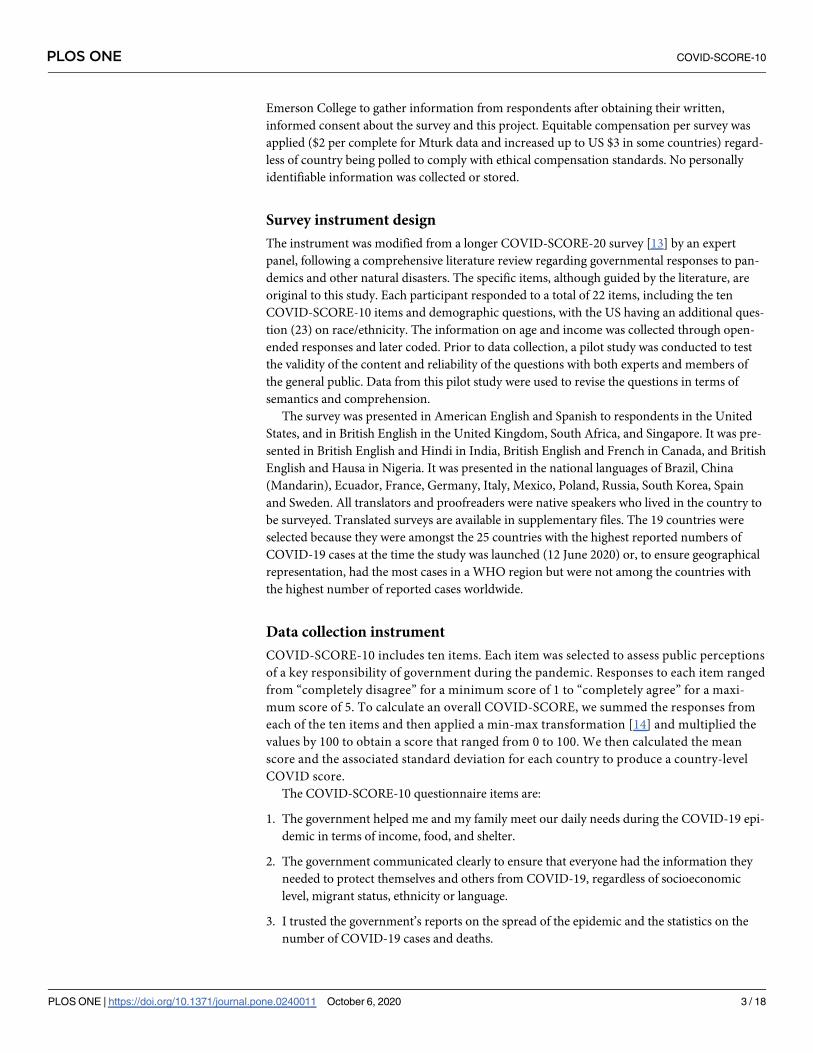
The COVID-SCORE-10 questionnaire items are:
1. The government helped me and my family meet our daily needs during the COVID-19 epi-
demic in terms of income, food, and shelter.
2. The government communicated clearly to ensure that everyone had the information they
needed to protect themselves and others from COVID-19, regardless of socioeconomic
level, migrant status, ethnicity or language.
3. I trusted the government’s reports on the spread of the epidemic and the statistics on the
number of COVID-19 cases and deaths.
PLOS ONE COVID-SCORE-10
PLOS ONE | https://doi.org/10.1371/journal.pone.0240011 October 6, 2020 3 / 18

4. The government had a strong pandemic preparedness team that included public health and
medical experts to manage our national response to the COVID-19 epidemic.
5. The government provided everyone with access to free, reliable COVID-19 testing if they
had symptoms.
6. The government made sure we always had full access to the healthcare services we needed
during the epidemic.
7. The government provided special protections to vulnerable groups at higher risk such as
the elderly, the poor, migrants, prisoners and the homeless during the COVID-19
epidemic.
8. The government made sure that healthcare workers had the personal protective equipment
they needed to protect them from COVID-19 at all times.
9. The government provided mental health services to help people suffering from loneliness,
depression and anxiety caused by the COVID-19 epidemic.
10. The government cooperated with other countries and international partners such as the
World Health Organization (WHO) to fight the COVID-19 pandemic.
Random stratified sampling
Strata were established by age (using the following age groups: 18–24, 25–54, 55–64 and 65
years and older); gender (male, female, transgender, and “other,”); and level of education
(based on each country’s educational system), which was calculated from data provided by
UNESCO, the Organisation for Economic Co-operation and Development, and country data
from Sweden, the United Kingdom, and the United States. Educational level was coded into
three groups of low, medium and high. “Low” included people who reported not finishing a
secondary education (high school); “medium” included those who had completed secondary,
vocational, technical, professional associate or high school degree; the “high” group consisted
of those who had completed a tertiary or bachelor’s degree and postgraduate work. Each coun-
try was divided into regions based on city/town, province or state unit of analysis. The number
of participants who could enrol in each of these strata was calculated to reflect the distribution
in the general population based on census/survey estimates provided by the World Bank and
CIA World Factbook. Data were weighted by strata with each stratum requiring a minimum
of 50 participants. These parameters and sources are available in S1 Appendix: Parameters,
Sources and External Variables. For the US, race/ethnicity was included in the weighting
based on 2018 US Census American Community Survey data (Hispanic, white, black or Afri-
can American, Asian or Asian Indian, mixed, or “other”) [15].
Study participants
Participants were recruited through multiple international online panel providers for each
country to avoid coverage bias: Dynata provided 6,891 respondents from 19 countries; Opin-
ion Access provided 3,391 respondents from 14 countries; Survey Monkey provided 2,239
responses from 12 countries, and Amazon MTurk provided 905 respondents from 8 large
countries to avoid demographic skew. Respondents’ identities were verified using IP addresses
and their mobile phones were verified to ensure that each participant was real and unique
upon initial registration. Participants were recruited for the panels via a variety of methods,
including online, telephone and direct mail solicitation, and equtiably compensated regardless
of country being polled in order to comply with ethical compensation standards.
PLOS ONE COVID-SCORE-10
PLOS ONE | https://doi.org/10.1371/journal.pone.0240011 October 6, 2020 4 / 18

Data collection
Survey data were collected from 16 to 20 June 2020 from an online panel of 13,426 respondents
aged 18 years and older from 19 different countries, ranging between 619 and 773 participants
per country. Sample sizes were based on country studies comparing results by demographic
characteristic groups (eg age and income groups). The margins of error ranged between 3.5
and 3.9 percentage points. The study utilized a minimum of two online panel providers per
country to reduce the coverage bias produced by the proprietary nature of each online panel
(except in Sweden where all data were collected by Dynata). In order to reduce the impact of
the question order effect, i.e. to limit potential bias influencing answer choices, the order of the
ten items of the COVID-SCORE-10, was randomized for each respondent.
Description of variables
This study employed eight country-specific external variables to further validate the country
scores (see S1 Appendix). The three external COVID-19-related variables were:
• Total SARS-CoV-2 positive cases per million persons as reported by Worldometer on 18
June 2020. Worldometer collects COVID-19 data daily from over 5,000 sources, including
ministries of health, other government institutions, and local media sources in real-time,
and the website’s data have been cited in more than 6,000 peer-reviewed journal articles [16,
17].
• Total SARS-CoV-2 deaths per million persons as reported by Worldometer on 18 June 2020
[16, 17].
• The proportion of “yes” responses per country to a study instrument item asking whether
the respondent or a family member had been sick with COVID-19, measured as “yes”, “no”,
and “unsure.”
For further external validation of country scores, three variables were included to measure
the socioeconomic and democratic performance of each country:
• The World Bank country income level was chosen as it provides an indication of the coun-
try’s overall economic performance relative to all other national economies. The World
Bank classifies national economies based on their gross national income per capita, con-
verted to US$ for global comparison using the Atlas method [18], according to thresholds
adjusted for annual inflation representing high, upper-middle, lower-middle, and low-
income economies [19].
• The 2019 Economist Intelligence Unit (EIU) Democracy Index score for each country,
which is measured on a continuous scale from 0 to 10, was included to assess how more and
less democratic societies evaluate their government’s COVID-19 response. This index’s val-
ues correspond to four types of regimes: full democracies (scores greater than 8), flawed
democracies (scores greater than 6 and less than or equal to 8), hybrid regimes (scores
greater than 4, and less than or equal to 6), and authoritarian regimes (scores less than or
equal to 4) [20].
• The country’s Human Development Index (HDI) score for 2019 from the United Nations
Development Programme, which is measured on a continuous scale of 0–1. The HDI is a
composite index that combines health (life expectancy at birth), education (expected and
mean years of schooling) and economic performance (per capita gross national income)
indicators to measure a country’s average human development [21].
PLOS ONE COVID-SCORE-10
PLOS ONE | https://doi.org/10.1371/journal.pone.0240011 October 6, 2020 5 / 18

Two additional variables were included to estimate the level of public trust in the
government:
• The proportion of those surveyed in each country who responded having either “a lot” or
“some” trust in the national government (as opposed to “not much” and “not at all”)
reported in the Wellcome Global Monitor 2018 report, which was used for external valida-
tion of COVID-SCORE-10. This global annual survey measures public perceptions of key
health system actors, including governments, regarding science and health challenges.
Responses from China were not available, and China was therefore excluded from analyses
using this variable [22].
• The proportion of those surveyed responding “yes” to an item in the study instrument that
assesses trust in the government to successfully address unexpected health threats, including
COVID-19,which was used in this study to internally validate COVID-SCORE-10.
Analysis plan
We evaluated the distribution of the country score and the items that constitute the score
descriptively by country. We then examined whether the results varied by gender, age group,
education level, and monthly income above/below the median. We also examined the internal
and external validity of the index using the appropriate predefined variables.
To test the internal validity of COVID-SCORE-10, we measured Cronbach’s alpha for the
ten items that comprised the final score. To test for dimensionality of the results, we used a
principal factor analysis (PCA) for the ten survey items. Through univariate regression and
correlation analyses, we also considered the association of the score with the country-level pro-
portion of people responding “yes” to having trust in their government to successfully address
unexpected health threats, including COVID-19.
To test the external validity, we considered the association between the score and prede-
fined variables to evaluate how the score varied with established indicators and associative
questions. The independent variables that were used for external validation were the World
Bank income classification level, the EIU Democracy Index score, the HDI score, country
mean trust in the national government as measured by responses to the Wellcome Global
Monitor score, the proportion of individuals who report themselves and/or their family mem-
bers as having been sick with COVID-19, cases per million from Worldometer.com, and mor-
tality per million from Worldometer.com.
We fit a univariate regression model for each of these variables with the country COVID--
SCORE-10 as the dependent variable and report the beta coefficient with 95% confidence
intervals. We also present the Pearson correlation coefficients for all validating variables that
are continuous. All data used for the associations with the external and internal validation are
measured at the country level as we sought to validate the instrument for measurement at a
country level.
Results
Average COVID-SCORE by country and item
Overall, average country-level scores (SD) ranged from 35.76 (SD = 23.05) points to 80.48
(SD = 16.31) points out of 100, with higher scores indicating that, on average, respondents
across the country perceived their government’s response to COVID-19 as more adequate
(Table 1). China had the highest score, 80.48 (SD = 16.31), followed by South Korea with 74.54
(SD = 18.61) and South Africa with 64.62 (SD = 22.94). The three lowest-scoring countries
PLOS ONE COVID-SCORE-10
PLOS ONE | https://doi.org/10.1371/journal.pone.0240011 October 6, 2020 6 / 18

Ta
ble
1.
Av
era
ge
sco
re(s
tan
da
rdd
evia
tio
n)
by
cou
ntr
y(n
=1
9)
for
each
CO
VID
-SC
OR
E(n
=1
0)
item
.
Item
s
Co
un
try
1.
Th
e
Go
ver
nm
ent
hel
ped
me
an
dm
y
fam
ily
mee
t
ou
rd
ail
y
nee
ds
du
rin
g
the
CO
VID
-
19
epid
emic
inte
rms
of
inco
me,
foo
d,
an
dsh
elte
r.
2.
Th
e
go
ver
nm
ent
com
mu
nic
ate
d
clea
rly
toen
sure
tha
tev
ery
on
e
ha
dth
e
info
rma
tio
n
they
nee
ded
to
pro
tect
them
selv
esa
nd
oth
ers
fro
m
CO
VID
-19
,
reg
ard
less
of
soci
oec
on
om
ic
lev
el,
mig
ran
t
sta
tus,
eth
nic
ity
or
lan
gu
ag
e.
3.
Itr
ust
edth
e
go
ver
nm
ent’
s
rep
ort
so
nth
e
spre
ad
of
the
epid
emic
an
d
the
sta
tist
ics
on
the
nu
mb
er
of
CO
VID
-19
case
sa
nd
dea
ths.
4.
Th
e
go
ver
nm
ent
ha
da
stro
ng
pa
nd
emic
pre
pa
red
nes
s
tea
mth
at
incl
ud
ed
pu
bli
ch
ealt
h
an
dm
edic
al
exp
erts
to
ma
na
ge
ou
r
na
tio
na
l
resp
on
seto
CO
VID
-19
epid
emic
.
5.
Th
e
go
ver
nm
ent
pro
vid
ed
ever
yo
ne
wit
ha
cces
s
tofr
ee,
reli
ab
le
CO
VID
-19
test
ing
if
they
ha
d
sym
pto
ms.
6.
Th
e
go
ver
nm
ent
ma
de
sure
we
alw
ay
s
ha
dfu
ll
acc
ess
toth
e
hea
lth
care
serv
ices
we
nee
ded
du
rin
gth
e
epid
emic
.
7.
Th
e
go
ver
nm
ent
pro
vid
ed
spec
ial
pro
tect
ion
s
tov
uln
era
ble
gro
up
sa
t
hig
her
risk
such
as
the
eld
erly
,th
e
po
or,
mig
ran
ts,
pri
son
ers
an
dth
e
ho
mel
ess
du
rin
gth
e
CO
VID
-19
epid
emic
.
8.
Th
e
go
ver
nm
ent
ma
de
sure
tha
t
hea
lth
care
wo
rker
sh
ad
the
per
son
al
pro
tect
ive
equ
ipm
ent
they
nee
ded
top
rote
ct
them
fro
m
CO
VID
-19
at
all
tim
es.
9.
Th
e
go
ver
nm
ent
pro
vid
ed
men
tal
hea
lth
serv
ices
to
hel
pp
eop
le
suff
erin
g
fro
m
lon
elin
ess,
dep
ress
ion
an
da
nx
iety
cau
sed
by
the
CO
VID
-19
epid
emic
.
10
.T
he
go
ver
nm
ent
coo
per
ate
d
wit
ho
ther
cou
ntr
ies
an
d
inte
rna
tio
na
l
pa
rtn
ers
such
as
the
Wo
rld
Hea
lth
Org
an
iza
tio
n
(WH
O)
to
fig
ht
the
CO
VID
-19
pa
nd
emic
.
Mea
n
CO
VID
-SC
OR
E
(SD
)
Bra
zil
(n=
71
7)
2.6
4(1
.30
)2
.68
(1.4
5)
2.5
3(1
.31
)2
.50
(1.3
5)
2.1
5(1
.29
)2
.52
(1.3
2)
2.4
3(1
.31
)2
.61
(1.3
5)
2.1
1(1
.21
)2
.38
(1.3
1)
36
.35
(24
.59
)
Can
ada
(n=
70
7)
3.4
3(1
.22
)3
.68
(1.3
6)
3.6
2(1
.21
)3
.49
(1.2
2)
3.4
7(1
.26
)3
.55
(1.2
1)
3.1
2(1
.22
)3
.26
(1.2
2)
3.1
0(1
.11
)3
.67
(1.0
7)
61
.00
(21
.88
)
Ch
ina
(n=
71
2)
4.0
4(0
.97
)4
.28
(0.9
0)
4.2
5(0
.89
)4
.37
(0.8
5)
4.2
9(0
.90
)4
.26
(0.8
7)
4.0
5(0
.93
)4
.23
(0.8
9)
4.0
0(0
.95
)4
.40
(0.7
7)
80
.48
(16
.31
)
Ecu
ado
r
(n=
74
1)
2.0
8(1
.19
)2
.90
(1.3
6)
2.1
7(1
.24
)2
.18
(1.2
6)
2.2
7(1
.37
)2
.64
(1.3
7)
2.5
9(1
.32
)2
.31
(1.3
2)
2.3
2(1
.27
)2
.85
(1.2
8)
35
.76
(23
.05
)
Fra
nce
(n=
66
9)
2.7
6(1
.26
)3
.06
(1.2
9)
3.0
3(1
.32
)3
.10
(1.2
4)
2.8
9(1
.29
)3
.20
(1.2
5)
2.9
6(1
.26
)2
.42
(1.2
9)
2.7
9(1
.06
)3
.48
(1.0
8)
49
.20
(22
.07
)
Ger
man
y
(n=
72
2)
3.1
9(1
.33
)3
.70
(1.1
9)
3.7
0(1
.30
)3
.64
(1.2
1)
3.2
4(1
.35
)3
.64
(1.2
4)
3.3
2(1
.22
)3
.22
(1.2
5)
2.9
3(1
.20
)3
.95
(1.0
9)
61
.32
(22
.20
)
Ind
ia(n
=7
42
)3
.38
(1.2
7)
3.6
5(1
.22
)3
.61
(1.2
6)
3.5
9(1
.21
)3
.43
(1.3
0)
3.5
9(1
.22
)3
.49
(1.2
9)
3.6
4(1
.21
)3
.33
(1.2
8)
3.8
4(1
.78
)6
3.8
8(2
4.0
7)
Ital
y(n
=7
36
)2
.89
(1.2
2)
3.3
6(1
.21
)3
.43
(1.1
7)
3.3
5(1
.15
)2
.75
(1.3
0)
3.0
2(1
.22
)2
.71
(1.1
8)
2.8
9(1
.24
)2
.71
(1.1
9)
3.5
8(1
.08
)5
1.7
1(2
1.2
5)
Mex
ico
(n=
69
9)
2.2
4(1
.32
)3
.28
(1.4
5)
2.9
0(1
.45
)3
.12
(1.4
0)
2.3
1(1
.41
)3
.06
(1.4
4)
2.8
1(1
.45
)2
.71
(1.4
5)
2.7
5(1
.39
)3
.41
(1.3
0)
46
.48
(26
.84
)
Nig
eria
(n=
67
0)
1.9
7(1
.30
)3
.78
(1.3
0)
2.7
7(1
.37
)2
.90
(1.4
1)
2.8
7(1
.53
)2
.66
(1.4
5)
2.4
4(1
.40
)3
.04
(1.4
1)
2.3
1(1
.37
)3
.80
(1.2
4)
46
.32
(22
.71
)
Po
lan
d(n
=6
66
)2
.67
(1.2
8)
3.0
3(1
.37
)2
.41
(1.3
8)
2.8
6(1
.31
)2
.48
(1.3
7)
2.3
7(1
.36
)2
.61
(1.4
1)
2.4
6(1
.37
)2
.28
(1.2
5)
3.3
2(1
.21
)4
1.2
8(2
5.3
0)
Ru
ssia
(n=
68
0)
2.6
5(1
.27
)3
.48
(1.2
5)
2.9
5(1
.32
)3
.08
(1.3
2)
2.7
0(1
.33
)2
.63
(1.3
3)
2.9
0(1
.35
)2
.94
(1.3
2)
2.6
0(1
.18
)3
.64
(1.0
4)
48
.85
(24
.03
)
Sin
gap
ore
(n=
75
2)
2.6
8(1
.33
)3
.91
(1.2
3)
3.3
1(1
.35
)3
.46
(1.2
8)
3.1
4(1
.44
)3
.30
(1.3
1)
3.1
6(1
.31
)3
.27
(1.3
1)
2.6
4(1
.31
)4
.14
(1.0
0)
57
.55
(21
.76
)
So
uth
Afr
ica
(n=
65
5)
3.4
9(1
.37
)3
.63
(1.1
4)
3.8
5(1
.16
)3
.93
(1.0
4)
3.7
5(1
.14
)3
.71
(1.1
5)
3.4
0(1
.11
)3
.39
(1.2
1)
3.0
7(1
.13
)3
.63
(1.1
1)
64
.62
(22
.94
)
So
uth
Ko
rea
(n=
61
9)
3.6
7(1
.02
)3
.98
(1.0
1)
4.0
1(0
.99
)3
.93
(1.0
5)
3.9
3(1
.07
)4
.19
(0.8
7)
3.9
4(1
.01
)4
.34
(0.8
2)
3.7
0(1
.05
)4
.12
(0.8
7)
74
.54
(18
.61
)
Sp
ain
(n=
74
8)
2.6
3(1
.33
)3
.11
(1.4
8)
2.8
3(1
.44
)3
.01
(1.4
9)
2.0
9(1
.33
)3
.06
(1.4
1)
2.6
5(1
.39
)2
.41
(1.3
5)
2.6
1(1
.33
)3
.46
(1.2
7)
44
.68
(25
.91
)
Sw
eden
(n=
65
0)
2.5
6(1
.21
)3
.10
(1.3
1)
3.4
2(1
.41
)2
.86
(1.3
2)
2.1
1(1
.28
)2
.65
(1.3
4)
2.3
0(1
.21
)2
.30
(1.2
4)
2.3
7(1
.44
)3
.14
(1.2
3)
42
.07
(23
.14
)
UK
(n=
76
8)
3.0
4(1
.24
)3
.17
(1.3
0)
3.0
4(1
.33
)2
.83
(1.3
2)
2.6
3(1
.36
)3
.09
(1.3
0)
3.0
0(1
.29
)2
.65
(1.3
5)
2.7
0(1
.20
)3
.31
(1.1
9)
48
.66
(24
.28
)
US
(n=
77
3)
3.1
6(1
.34
)3
.14
(1.3
5)
3.1
0(1
.33
)3
.05
(1.4
0)
2.9
2(1
.45
)3
.01
(1.3
9)
2.9
7(1
.41
)3
.03
(1.4
4)
2.8
2(1
.40
)3
.03
(1.3
9)
50
.57
(28
.99
)
(Con
tinued)
PLOS ONE COVID-SCORE-10
PLOS ONE | https://doi.org/10.1371/journal.pone.0240011 October 6, 2020 7 / 18

Ta
ble
1.
(Co
nti
nu
ed)
Item
s
Co
un
try
1.
Th
e
Go
ver
nm
ent
hel
ped
me
an
dm
y
fam
ily
mee
t
ou
rd
ail
y
nee
ds
du
rin
g
the
CO
VID
-
19
epid
emic
inte
rms
of
inco
me,
foo
d,
an
dsh
elte
r.
2.
Th
e
go
ver
nm
ent
com
mu
nic
ate
d
clea
rly
toen
sure
tha
tev
ery
on
e
ha
dth
e
info
rma
tio
n
they
nee
ded
to
pro
tect
them
selv
esa
nd
oth
ers
fro
m
CO
VID
-19
,
reg
ard
less
of
soci
oec
on
om
ic
lev
el,
mig
ran
t
sta
tus,
eth
nic
ity
or
lan
gu
ag
e.
3.
Itr
ust
edth
e
go
ver
nm
ent’
s
rep
ort
so
nth
e
spre
ad
of
the
epid
emic
an
d
the
sta
tist
ics
on
the
nu
mb
er
of
CO
VID
-19
case
sa
nd
dea
ths.
4.
Th
e
go
ver
nm
ent
ha
da
stro
ng
pa
nd
emic
pre
pa
red
nes
s
tea
mth
at
incl
ud
ed
pu
bli
ch
ealt
h
an
dm
edic
al
exp
erts
to
ma
na
ge
ou
r
na
tio
na
l
resp
on
seto
CO
VID
-19
epid
emic
.
5.
Th
e
go
ver
nm
ent
pro
vid
ed
ever
yo
ne
wit
ha
cces
s
tofr
ee,
reli
ab
le
CO
VID
-19
test
ing
if
they
ha
d
sym
pto
ms.
6.
Th
e
go
ver
nm
ent
ma
de
sure
we
alw
ay
s
ha
dfu
ll
acc
ess
toth
e
hea
lth
care
serv
ices
we
nee
ded
du
rin
gth
e
epid
emic
.
7.
Th
e
go
ver
nm
ent
pro
vid
ed
spec
ial
pro
tect
ion
s
tov
uln
era
ble
gro
up
sa
t
hig
her
risk
such
as
the
eld
erly
,th
e
po
or,
mig
ran
ts,
pri
son
ers
an
dth
e
ho
mel
ess
du
rin
gth
e
CO
VID
-19
epid
emic
.
8.
Th
e
go
ver
nm
ent
ma
de
sure
tha
t
hea
lth
care
wo
rker
sh
ad
the
per
son
al
pro
tect
ive
equ
ipm
ent
they
nee
ded
top
rote
ct
them
fro
m
CO
VID
-19
at
all
tim
es.
9.
Th
e
go
ver
nm
ent
pro
vid
ed
men
tal
hea
lth
serv
ices
to
hel
pp
eop
le
suff
erin
g
fro
m
lon
elin
ess,
dep
ress
ion
an
da
nx
iety
cau
sed
by
the
CO
VID
-19
epid
emic
.
10
.T
he
go
ver
nm
ent
coo
per
ate
d
wit
ho
ther
cou
ntr
ies
an
d
inte
rna
tio
na
l
pa
rtn
ers
such
as
the
Wo
rld
Hea
lth
Org
an
iza
tio
n
(WH
O)
to
fig
ht
the
CO
VID
-19
pa
nd
emic
.
Mea
n
CO
VID
-SC
OR
E
(SD
)
Av
erag
esc
ore
per
item
and
ov
eral
l
CO
VID
-SC
OR
E
(SD
)
2.9
1(1
.35
)3
.41
(1.3
3)
3.2
0(1
.39
)3
.22
(1.3
6)
2.9
1(1
.45
)3
.16
(1.3
8)
2.9
9(1
.36
)3
.00
(1.4
0)
2.7
9(1
.31
)3
.53
(1.2
5)
52
.95
(26
.20
)
htt
ps:
//doi.o
rg/1
0.1
371/jo
urn
al.p
one.
0240011.t001
PLOS ONE COVID-SCORE-10
PLOS ONE | https://doi.org/10.1371/journal.pone.0240011 October 6, 2020 8 / 18

were Ecuador with a score of 35.76 (SD = 0.68), Brazil with 36.35 (SD = 024.59) and Poland
with 41.28 (SD = 25.30). Higher-scoring countries were primarily located in Asia while lower-
scoring countries were found in Latin America and Europe.
Of the ten individual COVID-SCORE items (see Table 1), the highest-scoring item across
all countries was item 10 (Perceived multilateral (WHO) and international cooperation) with
an average score of 3.53 (1.24) on the scale of 1 to 5. The lowest-scoring item was item 9
(addressing mental health service availability during the pandemic) with an average score
across all countries of 2.79 (1.31).
Demographic factors
Although there were important differences in the distribution of COVID-SCORE values across
countries (Fig 1A), scores did not vary significantly across gender, age group, education, or
income level, as illustrated in the boxplots in Fig 1B–1E respectively.
Fig 1A summarizes the distribution of individual responses to COVID-SCORE that make
up the group means presented in Table 1. Greater heterogeneity among responses was
observed in seven countries with wider boxplots (Brazil, Ecuador, Mexico, Poland, Sweden,
the UK, and the US). The country with the most variability in its responses was the US as there
is a uniform distribution of people rating the government response well and a similar distribu-
tion scoring it poorly. Compared to this apparent lack of population consensus about the qual-
ity of government response, the lowest amount of variability in scores was seen in China and
South Korea, indicating greater homogeneity in perceptions among responses, which tended
to be very positive. The scores for the stratifying variables (i.e. age, gender, education and
income levels) are tightly grouped (Fig 1B–1E) with some within-country variation for educa-
tion and income. For example, in India those with middle and high education levels scored the
government higher, whereas those with a low education level had greater variability in their
scores, and in the United States those earning above the monthly median income scored the
government higher than those earning below.
The line through each box is the median, the limits of the box are the interquartile range,
and the whiskers on each box show the 5th and 95th percentile of the data. Panel a is the distri-
bution of all responses for each country. Panel b stratifies the scores by gender, Panel c by age
group, Panel d by education level, and Panel e by the respondents’ variance from the national
median income.
Validation of the score
Examining the internal validity of the score, we found that Cronbach’s alpha was 0.92 and that
the first component of the PCA explained 60% of variance with the remaining factors having
eigenvalues below 1, strongly indicating that the tool is both reliable and unidimensional. The
PCA found that items 6, 4, and 7, respectively, contributed the most weight to the first compo-
nent with items 1, 10, and 2, respectively, contributing the least weight. Additional correlations
and outputs from simple regressions are presented in Table 2. From the perspective of internal
validity, we also found that the proportion of “yes” responses to the survey item assessing
“trust in the government to successfully address unexpected health threats, including COVID-
19” had a strong correlation with the mean country score (r = 0.64, β = 45.8 [20.0, 71.7]). In
assessing external validity, we found that there were moderate and negative associations
between the country score and the proportion of participants who reported that “they and/or
their family members had been sick with COVID-19” (r = -0.34, β = -51.2 [-120.3, 17.9]) as
well as for COVID-19 cases per million (r = -0.37, β = -0.0019 [-0.004, 0.0005]). A weak and
negative correlation was found for the mortality from COVID-19 per million (r = -0.16, β =
PLOS ONE COVID-SCORE-10
PLOS ONE | https://doi.org/10.1371/journal.pone.0240011 October 6, 2020 9 / 18
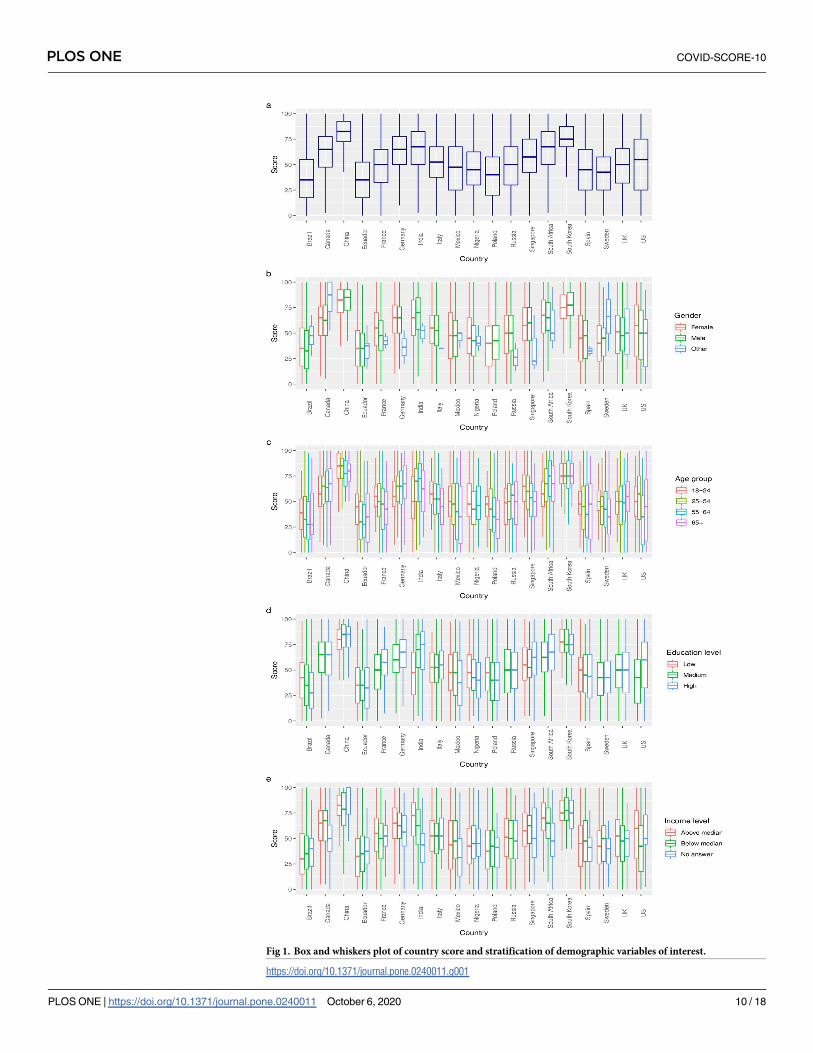
Fig 1. Box and whiskers plot of country score and stratification of demographic variables of interest.
https://doi.org/10.1371/journal.pone.0240011.g001
PLOS ONE COVID-SCORE-10
PLOS ONE | https://doi.org/10.1371/journal.pone.0240011 October 6, 2020 10 / 18

-0.01 (-0.003, 0.02). A moderately strong positive correlation was found for the measure of
general trust in the national government (Wellcome) (r = 0.58, β = 37.6 [10.1, 65.1]). The
country score did not have any observed correlations with the country HDI score (r = 0.07, β =
7.3 [-43.5, 58.1]) or with the EIU Democracy Index score (r = 0.04, β = 0.26 [-2.7, 3.2]). No
relationship was found between World Bank income level and the mean country score.
Discussion
Governmental responses to the COVID-19 pandemic have varied widely across countries. We
set out to measure public perceptions of government COVID-19 pandemic response efforts in
19 of the most heavily affected countries and to identify the key factors associated with those
perceptions. Our goal was to provide governments with a survey instrument that they could
use to support the upgrade of measures to improve public commitment to disease prevention
and control, and to mitigate the social, health and economic impacts of COVID-19. To that
end, we developed and applied a novel instrument, COVID-SCORE-10, to measure public
perception of ten key responsibilities of government.
We found that COVID-SCORE-10 is reliable and unidimensional. At the country level,
age, gender, education, income, World Bank income level, level of human development, and
degree to which a country is democratic were not associated with the overall country score.
Mortality per million from COVID-19, the proportion of respondents who reported that they
or a family member had become sick with COVID-19, trust in the national government, as
measured by the Wellcome Global Monitor, and trust in the government to successfully
address unexpected health threats, as measured in this study, were associated with the COV-
ID-SCORE in expected directions.
For example, we found there was a negative correlation between a country’s median score
and both its number of COVID-19 cases per million (-0.36) and the proportion of survey
respondents and family members who had COVID-19 (-0.34). Conversely, we observed that
higher mean country scores were associated with fewer cases per million and a smaller per-
centage of people who said they or a family member had been affected by COVID-19.
Table 2. Association between external validation variables (n = 8) and the overall country score.
Variable beta coefficients from univariate
regressions (95% CI)
Pearson Correlation
coefficient (r)
Population trust in govt to successfully respond to
unexpected health threats (survey question)a45.8 (20.0, 71.7) 0.64
Percentage of respondents reporting COVID-19
illness for themselves and/or family
-51.2 (-120.3, 17.9) -0.34
Country-specific COVID-19 cases per million
(Worldometer data)
-0.0019 (-0.004, 0.0005) -0.37
Country-specific COVID-19 mortality per million
(Worldometer data)
-0.01 (-0.03, 0.02) -0.16
General trust in the national government (Wellcome
Global Monitor)
37.6 (10.1, 65.1) 0.58
Human Development Index score 2019 7.3 (-43.5, 58.1) 0.07
EIU Democracy Index score 2019 0.26 (-2.7, 3.2) 0.04
World Bank country income level 2019 Low vs middle 2.0 (-17.4, 21.4) NA
middle vs high -1.5 (-14.3, 11.3)
a The variable “Population trust in govt to successfully respond to unexpected health threats” was collected via the
study survey and evaluated as an external validation variable, being external to the COVID-SCORE instrument itself.
https://doi.org/10.1371/journal.pone.0240011.t002
PLOS ONE COVID-SCORE-10
PLOS ONE | https://doi.org/10.1371/journal.pone.0240011 October 6, 2020 11 / 18

Overall, a higher mean country score was strongly associated with measures of trust. Gen-
eral trust in the national government and trust in the government to successfully address unex-
pected health threats were clearly associated with country scores for COVID-SCORE-10. This
finding is consistent with data from 19 European countries which show in a non-peer-
reviewed preprint that, in geographical regions where higher levels of trust in government had
been documented prior to the COVID-19 pandemic, there were greater reductions in behav-
iour such as non-essential local travel during March 2020, perhaps indicative of increased
compliance with the lockdowns that European countries were imposing in response to sharp
increases in COVID-19 cases at that time [23].
In published studies of previous health emergencies, trust in the credibility of public health
experts, health systems and scientific evidence has been shown to encourage appropriate utili-
zation of medical services (e.g. voluntary medical testing), compliance with lockdowns, and
adoption of preventive public health measures, such as physical distancing and mask-wearing,
all of which are difficult and costly to implement without public support and commitment.
However, managing a pandemic successfully requires large-scale behavioural changes individ-
ually, organizationally and societally, and these extend beyond handwashing, facemasks, and
self-isolation. Moreover, crises, and particularly epidemics, raise real barriers to efforts to align
individual and collective interests, which challenge the adoption of behavioural changes that
are essential to prevent the spread of disease [24]. In this context, governments bear great
responsibility to communicate effectively the collective benefits of adhering to evidence-based
measures, and public trust in government is an essential component of this process [25]. Lack
of trust during the COVID-19 pandemic has been associated with poorer mental health [26]
and has historically undermined the health and health-seeking behaviours of ethnic minorities
and others who have experienced discrimination in the health system [27–29].
Within the literature on policy, trust is related to cultural norms, values, and beliefs, and it
is regarded as a component of key social and economic policy outcomes [30–32]. These factors
may help explain the geographical differences in the country scores reported here. For exam-
ple, citizens of many Asian countries, including those in this study, trusted more in the govern-
ment [33]. Countries in Asia initially better contained COVID-19 compared to countries in
Europe and the Americas, utilising massive testing campaigns, contact tracing, and aggressive
lockdown policies [34]. In contrast, some countries in Latin and North America and Europe
substantially delayed imposing any restrictions at all and were heavily criticized for their
response to the pandemic [35, 36]. It is noteworthy that the Democracy Index did not correlate
with the overall score of populations’ perception of the governmental response, but trust in
government did, which appears to be independent of system of governance in that regard [37].
Effective, credible, consistent and culturally informed health communication is vital in
influencing positive health behaviours [32, 38, 39], especially in terms of encouraging people
to adhere to COVID-19 control measures. Failure by governments to implement targeted pub-
lic health communication measures can undermine their and the health system’s pandemic
responses. During the course of this pandemic, it has too often been difficult for the public to
distinguish between evidence-based and less scientifically reliable information, in part due to
poor messaging by health authorities and other officials [40, 41] and uncertain and evolving
scientific information, including high-profile retractions of research papers [42, 43] and con-
flicting modelling analyses [44]. Of the 10 items in our study, item 2, which directly measures
government communication responsibilities, scored as the second highest-rated item across all
countries. Other items indirectly related to communication responsibilities also scored well.
The item assessing public perception of government reports and statistics, key components of
a responsible government communication strategy, scored above average globally. Participants
gave the highest score to the belief that their government was cooperating with WHO and
PLOS ONE COVID-SCORE-10
PLOS ONE | https://doi.org/10.1371/journal.pone.0240011 October 6, 2020 12 / 18

other countries, though it is an item from which they are far removed. Our results indicate
that, in these countries, the public perceives that their government is collaborating with inter-
national partners, including WHO, and it is important insofar as these organizations play a
major role by providing clear, unbiased guidance [45, 46].
Disease control measures are further challenged by the unequal risks and burdens of
COVID-19 as well as access to resources to prevent the spread of the disease. For example,
families without running water cannot wash hands, the homeless cannot shelter in place, those
in prisons and high-density urban slums cannot physically distance, low-wage and essential
workers cannot telework, and overcrowding in reception and detention centres may increase
exposure of migrants and refugees to the disease [47, 48]. Absence of health insurance or
reduced access to healthcare in disadvantaged and marginalized and distrustful communities,
even in countries with universal healthcare, may prevent individuals from seeking treatment.
Restrictions on public transport to achieve physical distancing may consequently prevent indi-
viduals from being able to pick up prescription medications or access necessary health services.
The absence of adequate protection measures will continue to disproportionately affect minor-
ity groups [48]. Moreover, there is a need to protect people living in long-term health facilities,
especially the elderly, and their caregivers, who are also disproportionately affected [49].
As COVID-19 quickly and inexorably spread around the world and the economic crisis
deepened, public health services were overwhelmed and health gaps grew within and among
countries [50]. Study results of the items comprising COVID-SCORE-10 support the need to
strengthen health system functions during the pandemic. Globally, item 6 (assessing continued
access to necessary services) was scored (3.16) closest to the mean of all items (3.11) and was
scored above 4.00 only in China and Singapore. Other responsibilities related to health systems
functions such as item 5 (assessing access to free, reliable COVID-19 testing) (2.91) and item 8
(assessing the provision of personal protective equipment to healthcare workers) (3.00)
received among the lowest scores. It is understandable that meeting the mental health needs of
the population was scored the lowest (2.79), given the increase in anxiety and depression dur-
ing the pandemic [51], but it also exposes the underlying weaknesses of mental health services
in a number of settings, as well the global challenges of fragmented health systems to reach
populations that need mental health services [52].
While lockdown strategies may be effective in reducing the spread of COVID-19 and main-
taining general health system responsiveness, this single-disease response compromises care
for a range of other health conditions. The effects of health service disruption have already
been reported for HIV, TB, and malaria care in high-burden settings [53]. Reinvestment in
public health and outreach services is warranted to better prepare for and manage future crises
[54] as a wide range of services have been impacted by recent budget cuts in several countries
[55].
In our study, the global mean for item 7 (assessing socioeconomic and health protections
for vulnerable groups) (2.99), and item 1 (assessing assistance meeting daily needs in terms of
income, food, and shelter) (2.90) were scored substantially below the means for all other items.
These findings underscore the need to give special attention to vulnerable groups as many
countries attempt to reopen their economies, although SARS-CoV-2 continues to spread glob-
ally, and the risk of recurrence in countries that have controlled transmission remains.
The apparent reliability of this new instrument suggests that it may be a new tool that gov-
ernments can refine and use to monitor how individuals and communities perceive their
country’s response to COVID-19. The internal validity of the instrument is strongly supported
by the value of Cronbach’s alpha for the survey instrument and the results of the PCA indicat-
ing that it is unidimensional. The external validity of the score is also supported by the results
as the score was correlated with valid external indicators in the expected direction. Our data
PLOS ONE COVID-SCORE-10
PLOS ONE | https://doi.org/10.1371/journal.pone.0240011 October 6, 2020 13 / 18

suggest that both the overall ratings and the degree of variability in responses offer valuable
guidance to decisionmakers. These scores are not meant to compare countries to one another,
but rather to help governments track and measure changes within their country over time and
identify regions or groups that may require additional investment or modified interventions.
Longitudinal studies using this instrument at recurring intervals could measure variations in
public perceptions over time as a country’s epidemiological trajectory and response strategies
change. Such studies would also provide insight to the instrument’s potential for continuous
use as a monitoring tool. COVID-SCORE-10 could help governments to improve their health
care system’s resilience by identifying potential sources of communication breakdown,
strengthening their capacity to respond in future crises, and evaluating the efficacy and poten-
tial replicability of pandemic management strategies used to promote physical and mental
health system resilience in other countries [56].
The findings of this study are limited due to cross-sectional data, which do not permit
causal claims to be made between these scores and external variables. Interpretation of “gov-
ernment responses” must be broadly considered given that governance structures (including
subnational governments) vary in their pandemic responsibilities. Furthermore, although we
have taken precautions to achieve representative samples from each country, the methodologi-
cal limitations of inadequate representation of some segments of a society, such as those most
marginalized, may have introduced a response bias that could have altered their country’s
summative score or its associations with other variables.
Conclusion
Effective control of COVID-19 requires governments and their constituencies to engage in
mutually trusting relationships with a shared understanding of what is expected by both sets of
actors. The ability of government and public health leaders to gauge how the population per-
ceives the effectiveness of government responses to COVID-19, both generally and on specific
responsibilities, is essential for identifying potential obstacles to achieving disease control
objectives. The 10-item instrument that we have validated in this study is easy to administer
and yields simple scores that can inform policy debates and can guide the design and imple-
mentation of COVID-19 prevention, testing and treatment initiatives including communica-
tions initiatives. COVID-SCORE also has a wide range of research applications as political and
social scientists continue to explore how trust in government influences public behavior in the
context of major health threats. Although the instrument was used for cross-sectional data col-
lection in this study, we see value in applying it longitudinally as both the COVID-19 pan-
demic and policy responses to the pandemic continue to evolve in different national contexts.
Given the importance of how subnational governments are responding to COVID-19 in large
countries with multiple geographically distinct pandemic trajectories, further research should
also explore how COVID-SCORE can contribute to subnational knowledge generation and
policy-making.
Supporting information
S1 Checklist. STROBE checklist.
(DOCX)
S1 Appendix. Parameters, sources and external variables. This file contains the population
parameters for each country used to ensure a stratified sampling of respondents by gender,
age, education level, region, and income level. It also contains the country data for each of the
PLOS ONE COVID-SCORE-10
PLOS ONE | https://doi.org/10.1371/journal.pone.0240011 October 6, 2020 14 / 18

external variables considered in the analysis.
(XLSX)
S2 Appendix. Respondent characteristics. This file contains the population characteristics
stratified by age, education, gender and income (and race in the United States) as well as raw
responses to each COVID-SCORE item per country.
(XLSX)
S1 Study questionnaire. This file contains the 22 items (23 for United States) that com-
posed the online survey, including the 10 items of COVID-SCORE.
(DOCX)
Acknowledgments
The authors would like to acknolwedge Kelly Safreed-Harmon and Sonia Hajo for their contri-
butions to this study.
Author Contributions
Conceptualization: Jeffrey V. Lazarus, Scott Ratzan, Spencer Kimball, Kenneth Rabin, Ayman
El-Mohandes.
Data curation: Adam Palayew, Spencer Kimball, Trenton M. White.
Formal analysis: Jeffrey V. Lazarus, Scott Ratzan, Adam Palayew, Francesco C. Billari, Alessia
Melegaro, Kenneth Rabin.
Funding acquisition: Jeffrey V. Lazarus, Scott Ratzan, Kenneth Rabin, Ayman El-Mohandes.
Investigation: Spencer Kimball.
Methodology: Jeffrey V. Lazarus, Adam Palayew, Francesco C. Billari, Alessia Melegaro, Tren-
ton M. White, Ayman El-Mohandes.
Project administration: Jeffrey V. Lazarus.
Supervision: Jeffrey V. Lazarus, Ayman El-Mohandes.
Validation: Francesco C. Billari, Spencer Kimball, Alessia Melegaro, Trenton M. White,
Ayman El-Mohandes.
Writing – original draft: Jeffrey V. Lazarus, Adam Palayew, Kenneth Rabin, Trenton M.
White, Ayman El-Mohandes.
Writing – review & editing: Jeffrey V. Lazarus, Scott Ratzan, Adam Palayew, Francesco C.
Billari, Agnes Binagwaho, Spencer Kimball, Heidi J. Larson, Alessia Melegaro, Kenneth
Rabin, Trenton M. White, Ayman El-Mohandes.
References
1. Johns Hopkins Coronavirus Resource Center. COVID-19 Map [Internet]. 2020 [cited 2020 May 11].
Available from: https://coronavirus.jhu.edu/map.html
2. Hale T, Angrist N, Kira B, Petherick A, Phillips T, Webster S. Variation in government responses to
COVID-19 [Internet]. 2020 [cited 2020 Jul 9]. Available from: www.bsg.ox.ac.uk/covidtracker
3. Muto K, Yamamoto I, Nagasu M, Tanaka M, Wada K. Japanese citizens’ behavioral changes and pre-
paredness against COVID-19: An online survey during the early phase of the pandemic. Ojima T, editor.
PLoS One [Internet]. 2020 [cited 2020 Jun 17]; 15(6):e0234292. Available from: https://dx.plos.org/10.
1371/journal.pone.0234292 PMID: 32525881
PLOS ONE COVID-SCORE-10
PLOS ONE | https://doi.org/10.1371/journal.pone.0240011 October 6, 2020 15 / 18

4. Sibley CG, Greaves LM, Satherley N, Wilson MS, Overall NC, Lee CHJ, et al. Effects of the COVID-19
Pandemic and Nationwide Lockdown on Trust, Attitudes Toward Government, and Well-Being. Am
Psychol [Internet]. 2020 [cited 2020 Jul 9]; Available from: https://pubmed.ncbi.nlm.nih.gov/32496074/
5. Seale H, Heywood AE, Leask J, Sheel M, Thomas S, Durrheim DN, et al. COVID-19 is rapidly changing:
Examining public perceptions and behaviors in response to this evolving pandemic. Tu W-J, editor.
PLoS One [Internet]. 2020 Jun 23 [cited 2020 Jul 9]; 15(6):e0235112. Available from: https://dx.plos.
org/10.1371/journal.pone.0235112 PMID: 32574184
6. Garrett L. COVID-19: the medium is the message. Lancet [Internet]. 2020 Mar 21 [cited 2020 Jul 3]; 395
(10228):942–3. Available from: https://www. https://doi.org/10.1016/S0140-6736(20)30600-0 PMID:
32171075
7. Gollust SE, Nagler RH, Fowler EF. The Emergence of COVID-19 in the U.S.: A Public Health and Politi-
cal Communication Crisis. J Health Polit Policy Law [Internet]. 2020 May 28 [cited 2020 Jul 8]; Available
from: https://read.dukeupress.edu/jhppl/article/doi/10.1215/03616878-8641506/165291/The-
Emergence-of-COVID19-in-the-US-A-Public-Health
8. Ruiu ML. Mismanagement of Covid-19: lessons learned from Italy. J Risk Res [Internet]. 2020 [cited
2020 Jul 8]; Available from: https://www.tandfonline.com/action/journalInformation?journalCode=rjrr20
9. Vaccine Confidence Project. Social media conversations and attitudes in the UK towards COVID-19
[Internet]. 2020 [cited 2020 Jul 9]. Available from: https://www.vaccineconfidence.org/research-feed/
social-media-conversations-and-attitudes-in-the-uk-towards-covid-19
10. Freimuth VS, Musa D, Hilyard K, Quinn SC, Kim K. Trust during the early stages of the 2009 H1N1 pan-
demic. J Health Commun [Internet]. 2014 Mar 1 [cited 2020 Jun 30]; 19(3):321–39. Available from:
https://www.tandfonline.com/doi/abs/10.1080/10810730.2013.811323 PMID: 24117390
11. Siegrist M, Zingg A. The role of public trust during pandemics: Implications for crisis communication.
Eur Psychol [Internet]. 2014 [cited 2020 Jun 30]; 19(1):23–32. Available from: https://psycnet.apa.org/
record/2013-34232-001
12. Blair RA, Morse BS, Tsai LL. Public health and public trust: Survey evidence from the Ebola Virus Dis-
ease epidemic in Liberia. Soc Sci Med [Internet]. 2017 Jan 1 [cited 2020 Jul 9]; 172:89–97. Available
from: https://pubmed.ncbi.nlm.nih.gov/27914936/ https://doi.org/10.1016/j.socscimed.2016.11.016
PMID: 27914936
13. Lazarus J V, Binagwaho A, El-Mohandes AAE, Fielding JE, Larson HJ, Plasència A, et al. Keeping gov-
ernments accountable: the COVID-19 Assessment Scorecard (COVID-SCORE). Nat Med [Internet].
2020 [cited 2020 Jul 8]; Available from: www.nature.com/naturemedicine
14. Jain A, Nandakumar K, Ross A. Score normalization in multimodal biometric systems. Pattern Recog-
nit. 2005 Dec 1; 38(12):2270–85.
15. United States Census Bureau. American Community Survey Demographic and Housing Estimates
[Internet]. 2018 [cited 2020 Jul 10]. Available from: https://data.census.gov/cedsci/table?d=ACS5-
YearEstimatesDataProfiles&table=DP05&tid=ACSDP5Y2018.DP05
16. Worldometer. COVID-19 Coronavirus Pandemic. 2020. p. 1–22.
17. Worldometer. COVID-19 data [Internet]. 2020 [cited 2020 Jun 30]. Available from: https://www.
worldometers.info/coronavirus/about/#sources
18. World Bank Group. The World Bank Atlas method—detailed methodology [Internet]. 2020 [cited 2020
Jun 30]. Available from: https://datahelpdesk.worldbank.org/knowledgebase/articles/378832-what-is-
the-world-bank-atlas-method
19. World Bank Group. World Bank Country and Lending Groups [Internet]. 2020 [cited 2020 Jun 30]. Avail-
able from: https://datahelpdesk.worldbank.org/knowledgebase/articles/906519-world-bank-country-
and-lending-groups
20. Economist Intelligence Unit. EIU Democracy Index 2019—World Democracy Report [Internet]. 2019
[cited 2020 Jun 30]. Available from: https://www.eiu.com/topic/democracy-index
21. United Nations Devlopment Programme. Human Development Index (HDI) [Internet]. 2019 [cited 2020
Jun 30]. Available from: http://hdr.undp.org/en/content/human-development-index-hdi
22. Wellcome. Wellcome Global Monitor 2018 [Internet]. 2019 [cited 2020 Jun 30]. Available from: https://
wellcome.ac.uk/reports/wellcome-global-monitor/2018
23. Bargain O, Aminjonov U. Trust and Compliance to Public Health Policies in Times of COVID-19 [Inter-
net]. 2020 May [cited 2020 Jul 9]. Available from: https://www.iza.org/publications/dp/13205/trust-and-
compliance-to-public-health-policies-in-times-of-covid-19
24. Bavel JJV, Baicker K, Boggio PS, Capraro V, Cichocka A, Cikara M, et al. Using social and behavioural
science to support COVID-19 pandemic response. Nat Hum Behav. 2020 Apr 30; 4(5):460–71.
PLOS ONE COVID-SCORE-10
PLOS ONE | https://doi.org/10.1371/journal.pone.0240011 October 6, 2020 16 / 18
https://datahelpdesk.worldbank.org/knowledgebase/articles/378832-what-is-the-world-bank-atlas-method

25. Ratzan SC, Sommariva S, Rauh L. Enhancing global health communication during a crisis: lessons
from the COVID-19 pandemic Article history. Public Heal Res Pr [Internet]. 2020 [cited 2020 Jul 8]; 30
(2):e3022010. Available from: https://doi.org/10.17061/phrp3022010www.phrp.com.au
26. Fetzer T, Witte M, Hensel L, Jachimowicz JM, Haushofer J, Ivchenko A, et al. Perceptions of an Insuffi-
cient Government Response at the Onset of the COVID-19 Pandemic are Associated with Lower Men-
tal Well-Being (pre-print) [Internet]. 2020 [cited 2020 Jul 8]. Available from: https://psyarxiv.com/3kfmh/
27. Demaris A, Yang R. Race, alienation, and interpersonal mistrust. Sociol Spectr [Internet]. 1994 [cited
2020 Jul 8]; 14(4):327–49. Available from: https://www.tandfonline.com/doi/abs/10.1080/02732173.
1994.9982075
28. Alesina A, La Ferrara E. Who trusts others? J Public Econ. 2002 Aug 1; 85(2):207–34.
29. Taylor-Clark K, Blendon RJ, Zaslavsky A, Benson J. Confidence in Crisis? Understanding Trust in Gov-
ernment and Public Attitudes Toward Mandatory State Health Powers. Biosecurity Bioterrorism Biode-
fense Strateg Pract Sci [Internet]. 2005 Jun 6 [cited 2020 Jul 8]; 3(2):138–47. Available from: http://
www.liebertpub.com/doi/10.1089/bsp.2005.3.138
30. Organisation for Economic Co-operation and Development. Trust in government, policy effectiveness
and the governance agenda. Government at a Glance 2013. 2013.
31. Mishler W, Rose R. What Are the Origins of Political Trust?: Testing Institutional and Cultural Theories
in Post-communist Societies. Comp Polit Stud [Internet]. 2001 Feb [cited 2020 Jul 8]; 34(1):30–62.
Available from: http://journals.sagepub.com/doi/10.1177/0010414001034001002
32. Quinn SC, Parmer J, Freimuth VS, Hilyard KM, Musa D, Kim KH. Exploring communication, trust in gov-
ernment, and vaccination intention later in the 2009 H1N1 pandemic: Results of a national survey. Bio-
security and Bioterrorism [Internet]. 2013 Jun 1 [cited 2020 Jul 9]; 11(2):96–106. Available from: http://
www.knowledgenetworks.com https://doi.org/10.1089/bsp.2012.0048 PMID: 23617721
33. Ma D, Yang F. Authoritarian Orientations and Political Trust in East Asian Societies. East Asia. 2014
Nov 29; 31(4):323–41.
34. Gawande A. Keeping the Coronavirus from Infecting Health-Care Workers. The New Yorker [Internet].
2020 Mar 21 [cited 2020 May 18]; Available from: https://www.newyorker.com/news/news-desk/
keeping-the-coronavirus-from-infecting-health-care-workers?itm_content=footer-recirc
35. Paterlini M. “Closing borders is ridiculous”: the epidemiologist behind Sweden’s controversial coronavi-
rus strategy. Nature. 2020 Apr 1.
36. Morgan A. Coronavirus: Brazil President Jair Bolsonaro’s deadly gamble with COVID-19. Euronews
[Internet]. 2020 May 22 [cited 2020 Jul 9]; Available from: https://www.euronews.com/2020/05/22/
coronavirus-brazil-president-jair-bolsonaro-s-deadly-gamble-with-covid-19-culture-clash
37. Fukuyama F. The Pandemic and Political Order. Foreign Affairs [Internet]. 2020 Aug [cited 2020 Jul 6];
Available from: https://www.foreignaffairs.com/articles/world/2020-06-09/pandemic-and-political-order
38. Shore DA. Communicating in times of uncertainty: The need for trust. J Health Commun [Internet]. 2003
[cited 2020 Jul 8]; 8:13–4. Available from: https://pubmed.ncbi.nlm.nih.gov/14692568/ https://doi.org/
10.1080/713851977 PMID: 14692568
39. Meredith LS, Eisenman DP, Rhodes H, Ryan G, Long A. Trust Influences Response to Public Health
Messages during a Bioterrorist Event. J Health Commun [Internet]. 2007 Apr [cited 2020 Jul 8]; 12
(3):217–32. Available from: https://pubmed.ncbi.nlm.nih.gov/17497377/ https://doi.org/10.1080/
10810730701265978 PMID: 17497377
40. Battiston P, Kashyap R, Rotondi V. Trust in science and experts during the COVID-19 outbreak in Italy
(pre-print) [Internet]. 2020 May [cited 2020 Jul 8]. Available from: https://osf.io/preprints/socarxiv/5tch8/
41. Yong E. Why the Coronavirus Is So Confusing [Internet]. The Atlantic. 2020 [cited 2020 Jul 6]. Available
from: https://www.theatlantic.com/health/archive/2020/04/pandemic-confusing-uncertainty/610819/
42. Mehra MR, Ruschitzka F, Patel AN. Retraction- Hydroxychloroquine or chloroquine with or without a
macrolide for treatment of COVID-19: a multinational registry analysis. Lancet [Internet]. 2020 [cited
2020 Jul 8]; 395:1820. Available from: https://doi.org/10.1016/S0140-6736 PMID: 32511943
43. Mehra MR, Desai SS, Kuy S, Henry TD, Patel AN. Retraction: Cardiovascular Disease, Drug Therapy,
and Mortality in Covid-19. N Engl J Med. doi: 10.1056/NEJMoa2007621. N Engl J Med [Internet]. 2020
Jun 4 [cited 2020 Jun 5];NEJMc2021225. Available from: http://www.nejm.org/doi/10.1056/
NEJMc2021225 PMID: 32356626
44. Bertozzi AL, Franco E, Mohler G, Short MB, Sledge D. The challenges of modeling and forecasting the
spread of COVID-19. Proc Natl Acad Sci [Internet]. 2020 Jul 2 [cited 2020 Jul 6]; Available from: https://
www.pnas.org/content/early/2020/07/01/2006520117
45. Gostin LO. COVID-19 Reveals Urgent Need to Strengthen the World Health Organization. JAMA [Inter-
net]. 2020 Jun 16 [cited 2020 Jul 8]; 323(23):2361–2. Available from: https://jamanetwork.com/ https://
doi.org/10.1001/jama.2020.8486 PMID: 32543675
PLOS ONE COVID-SCORE-10
PLOS ONE | https://doi.org/10.1371/journal.pone.0240011 October 6, 2020 17 / 18

46. Nay O, Kieny M-P, Marmora L, Kazatchkine M. The WHO we want. Lancet [Internet]. 2020 [cited 2020
Jul 8]; 395:1818–20. Available from: https://www.cfr.org/blog/who-and-china- https://doi.org/10.1016/
S0140-6736(20)31298-8 PMID: 32511944
47. European Centre for Disease Prevention. Guidance on infection prevention and control of coronavirus
disease (COVID-19) in migrant and refugee reception and detention centres in the EU/EEA and the
United Kingdom. Stockholm; 2020 Jun.
48. Bambra C, Riordan R, Ford J, Matthews F. The COVID-19 pandemic and health inequalities. BMJ
[Internet]. 2020 [cited 2020 Jul 8]; Available from: http://jech.bmj.com/
49. World Health Organization. Strengthening the Health Systems Response to COVID-19—Technical
guidance #6 [Internet]. Geneva: World Health Organization; 2020 May [cited 2020 Jul 8]. Available
from: https://www.euro.who.int/en/health-topics/health-emergencies/coronavirus-covid-19/technical-
guidance/strengthening-the-health-system-response-to-covid-19/technical-guidance-and-check-lists/
strengthening-the-health-systems-response-to-covid-19-technical-gu
50. Azzopardi-Muscat N, Kluge HHP. Public health in the eye of the storm: what can we learn from the
COVID-19 pandemic experience to strengthen public health services in Europe? Eur J Public Heal
[Internet]. 2020 Jun [cited 2020 Jul 8]; 30(3):394–5. Available from: https://www.ncbi.nlm.nih.gov/pmc/
articles/PMC7314016/
51. Holmes EA, O’Connor RC, Perry VH, Tracey I, Wessely S, Arseneault L, et al. Multidisciplinary
research priorities for the COVID-19 pandemic: a call for action for mental health science. The Lancet
Psychiatry [Internet]. 2020 Jun 1 [cited 2020 Jul 8]; 7(6):547–60. Available from: www.thelancet.com/
psychiatry https://doi.org/10.1016/S2215-0366(20)30168-1 PMID: 32304649
52. Wainberg ML, Scorza P, Shultz JM, Helpman L, Mootz JJ, Johnson KA, et al. Challenges and Opportu-
nities in Global Mental Health: a Research-to-Practice Perspective. Curr Psychiatry Rep [Internet].
2017 May 1 [cited 2020 Jul 8]; 19(5). Available from: https://pubmed.ncbi.nlm.nih.gov/28425023/
53. WHO Collaborating Centre for Infectious Disease Modelling, MRC Centre for Global Infectious Disease
Analysis Abdul Latif Jameel Institute for Disease, Emergency Analytics ICL. The Potential Impact of the
COVID-19 Epidemic on HIV, TB and Malaria in Low- and Middle-Income Countries | Faculty of Medicine
| Imperial College London [Internet]. 2020 [cited 2020 Jul 8]. Available from: http://www.imperial.ac.uk/
mrc-global-infectious-disease-analysis/covid-19/report-19-hiv-tb-malaria/
54. Kluge HHP. Statement–Recovery must lead to a different economy, an economy of well-being [Inter-
net]. World Health Organization; 2020 [cited 2020 Jun 5]. Available from: http://www.euro.who.int/en/
media-centre/sections/statements/2020/statement-recovery-must-lead-to-a-different-economy,-an-
economy-of-well-being
55. Rechel B, Maresso A, Sagan A, Hernandez-Quevedo C, Williams G, Richardson E, et al. Organization
and financing of public health services in Europe: country reports [Internet]. Geneva: World Health
Organization; 2018 May [cited 2020 Jul 8]. Available from: https://www.euro.who.int/en/publications/
abstracts/organization-and-financing-of-public-health-services-in-europe-country-reports-2018
56. Thomas S, Sagan A, Larkin J, Cylus J, Figueras J, Karanikolos M. Strengthening health systems resil-
ience: key concepts and strategies [Internet]. Copenhagen: World Health Organization; 2020 Jun
[cited 2020 Jul 8]. Available from: https://www.euro.who.int/en/about-us/partners/observatory/
publications/policy-briefs-and-summaries/strengthening-health-systems-resilience-key-concepts-and-
strategies-2020
PLOS ONE COVID-SCORE-10
PLOS ONE | https://doi.org/10.1371/journal.pone.0240011 October 6, 2020 18 / 18