COVID-19 Impact on Consumer Behavior - convenience
2
During the last four weeks, convenience store dollars have seen an increase, from +2.0% 4WE 1/3/21 to +10.0% 4WE 1/31/21. This increase was driven by both trips (up -10.2% from -13.2%) and spend (up +22.5% from +17.5%). On a dollar basis, almost every category saw in increase in YoY dollars, with lottery/gaming being the greatest contributor due to record-breaking lottery jackpots. Morning rush (7-9:59am) trips remained unchanged at 85% of prior year trips; however, all other key dayparts saw 4-6 pt increases, with late evening (7pm-10:59pm) seeing the greatest (6.3 pts). A monthly look at trips and basket-level data in convenience retail. Powered by PDI Insights Cloud, our monthly report provides consumer trip and basket-level data and analysis that will enable essential businesses around the country to deliver what their customers want and need right now. COVID-19 Impact on Consumer Behavior Key Insights This Report: +8% Dollars Spent PDI Insights Cloud is proud to partner with NACS & NACS Daily to provide you with these reports. PDI Report: Week Ending 1.31.21 © 2021 Professional Datasolutions, Inc., All rights reserved.
Transcript of COVID-19 Impact on Consumer Behavior - convenience
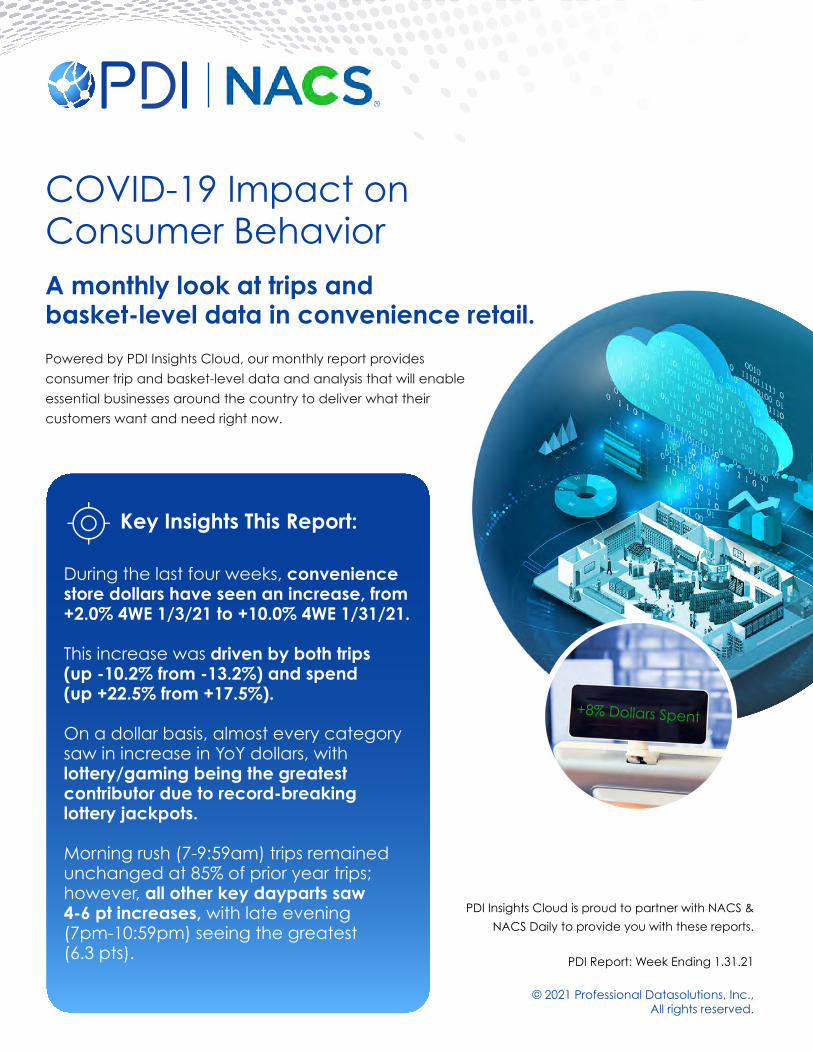
During the last four weeks, convenience store dollars have seen an increase, from +2.0% 4WE 1/3/21 to +10.0% 4WE 1/31/21.
This increase was driven by both trips (up -10.2% from -13.2%) and spend (up +22.5% from +17.5%).
On a dollar basis, almost every category saw in increase in YoY dollars, with lottery/gaming being the greatest contributor due to record-breaking lottery jackpots.
Morning rush (7-9:59am) trips remained unchanged at 85% of prior year trips; however, all other key dayparts saw 4-6 pt increases, with late evening (7pm-10:59pm) seeing the greatest (6.3 pts).
A monthly look at trips and basket-level data in convenience retail. Powered by PDI Insights Cloud, our monthly report provides consumer trip and basket-level data and analysis that will enable essential businesses around the country to deliver what their customers want and need right now.
COVID-19 Impact on Consumer Behavior
Key Insights This Report:
+8% Dollars Spent
PDI Insights Cloud is proud to partner with NACS & NACS Daily to provide you with these reports.
PDI Report: Week Ending 1.31.21
© 2021 Professional Datasolutions, Inc., All rights reserved.

Weekly Trip & Basket Spend BehaviorOver the last several weeks, dollar sales at convenience stores increased around the country. Both spend and trips contributed to the improvement, with spend per transaction seeing a considerable increase over the previous period. With the exception of the morning rush, all key dayparts saw increased consumer traffic.
In addition, most categories improved in year-over-year dollars and trips. Lottery/gaming saw the largest increase with a double-digit jump that was likely due to record-breaking jackpots.
Dollars per TransactionWeekly % Change vs Year Ago
Prior four-week average per store transactions (trips)
3,876
$38,401Prior four-week average per store dollars
$9.91 Prior four-week average basket dollar amount
Per Store Transactions (Trips) Weekly % Change vs Year Ago
Per-Store Dollars Weekly % Change vs Year Ago
2
Weekly Trip & Basket Spend Behavior
Get the full report www.pdisoftware.com
Week Ending1/31/21