COVID-19 Facts and Insights - McKinsey & Company | Global ...
129
Copyright @ 2020 McKinsey & Company. All rights reserved. Updated: October 30, 2020 Global health and crisis response COVID-19: Briefing materials
Transcript of COVID-19 Facts and Insights - McKinsey & Company | Global ...

Copyright @ 2020 McKinsey & Company. All rights reserved.
Updated: October 30, 2020
Global health and crisis response
COVID-19:Briefing materials
BRIEFING PACK
COVID-19 is, first and foremost, a global humanitarian challenge. Thousands of health professionals are heroically battling the virus, putting their own lives at risk. Governments and industry are working together to understand and address the challenge, support victims and their families and communities, and search for treatments and a vaccine.
Companies around the world need to act promptly. This document is meant to help senior leaders understand the COVID-19 situation and how it may unfold, and take steps to protect their employees, customers, supply chains, and financial results.
Read more on McKinsey.com
Current as of October 7, 2020
McKinsey & Company 2
BRIEFING PACK
DOCUMENT INTENDED TO PROVIDE INSIGHT BASED ON CURRENTLY AVAILABLE INFORMATION FOR CONSIDERATION AND NOT SPECIFIC ADVICE
BRIEFING PACK
Contents
McKinsey & Company 3
COVID-19:The situation now
01Therapeutics and vaccines landscape overview
02
Appendix: Scenarios deep-dives
03Pathways towards a COVID-19-Exit
06The ‘Return to Work checklist’
05The ‘Emerging Resilients’: Achieving escape velocity
04
BRIEFING PACK
DOCUMENT INTENDED TO PROVIDE INSIGHT BASED ON CURRENTLY AVAILABLE INFORMATION FOR CONSIDERATION AND NOT SPECIFIC ADVICE
McKinsey & Company
BRIEFING PACK
DOCUMENT INTENDED TO PROVIDE INSIGHT BASED ON CURRENTLY AVAILABLE INFORMATION FOR CONSIDERATION AND NOT SPECIFIC ADVICE
4
Contents Snapshot of the present: COVID-19 pandemic in numbers
Outlook: when the epidemic might functionally end
McKinsey & Company 4
BRIEFING PACK
DOCUMENT INTENDED TO PROVIDE INSIGHT BASED ON CURRENTLY AVAILABLE INFORMATION FOR CONSIDERATION AND NOT SPECIFIC ADVICE
50-99
<10
10-49
Propagation trend1
100-199
200-499
500-999
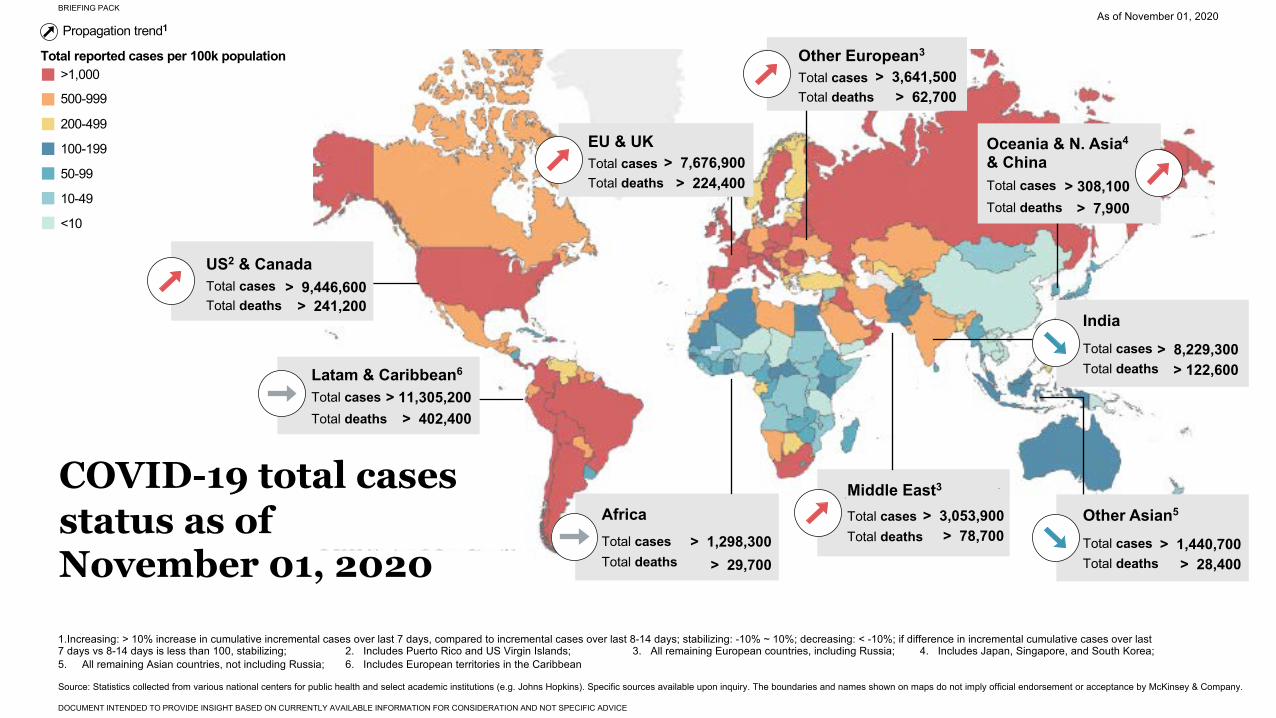
Middle East3
Total casesTotal deaths
> 3,053,900> 78,700
EU & UKTotal casesTotal deaths
> 7,676,900> 224,400
Latam & Caribbean6
Total casesTotal deaths
> 11,305,200> 402,400
US2 & CanadaTotal casesTotal deaths
> 9,446,600> 241,200
Oceania & N. Asia4
& ChinaTotal casesTotal deaths
> 308,100> 7,900
AfricaTotal casesTotal deaths
> 1,298,300> 29,700
As of November 01, 2020
>1,000Other European3
Total casesTotal deaths
> 3,641,500> 62,700
COVID-19 total cases status as of November 01, 2020
Total reported cases per 100k population
1.Increasing: > 10% increase in cumulative incremental cases over last 7 days, compared to incremental cases over last 8-14 days; stabilizing: -10% ~ 10%; decreasing: < -10%; if difference in incremental cumulative cases over last 7 days vs 8-14 days is less than 100, stabilizing; 2. Includes Puerto Rico and US Virgin Islands; 3. All remaining European countries, including Russia; 4. Includes Japan, Singapore, and South Korea; 5. All remaining Asian countries, not including Russia; 6. Includes European territories in the Caribbean
Other Asian5
Total casesTotal deaths
> 1,440,700> 28,400
IndiaTotal casesTotal deaths
> 8,229,300> 122,600
Source: Statistics collected from various national centers for public health and select academic institutions (e.g. Johns Hopkins). Specific sources available upon inquiry. The boundaries and names shown on maps do not imply official endorsement or acceptance by McKinsey & Company.
BRIEFING PACK
DOCUMENT INTENDED TO PROVIDE INSIGHT BASED ON CURRENTLY AVAILABLE INFORMATION FOR CONSIDERATION AND NOT SPECIFIC ADVICE
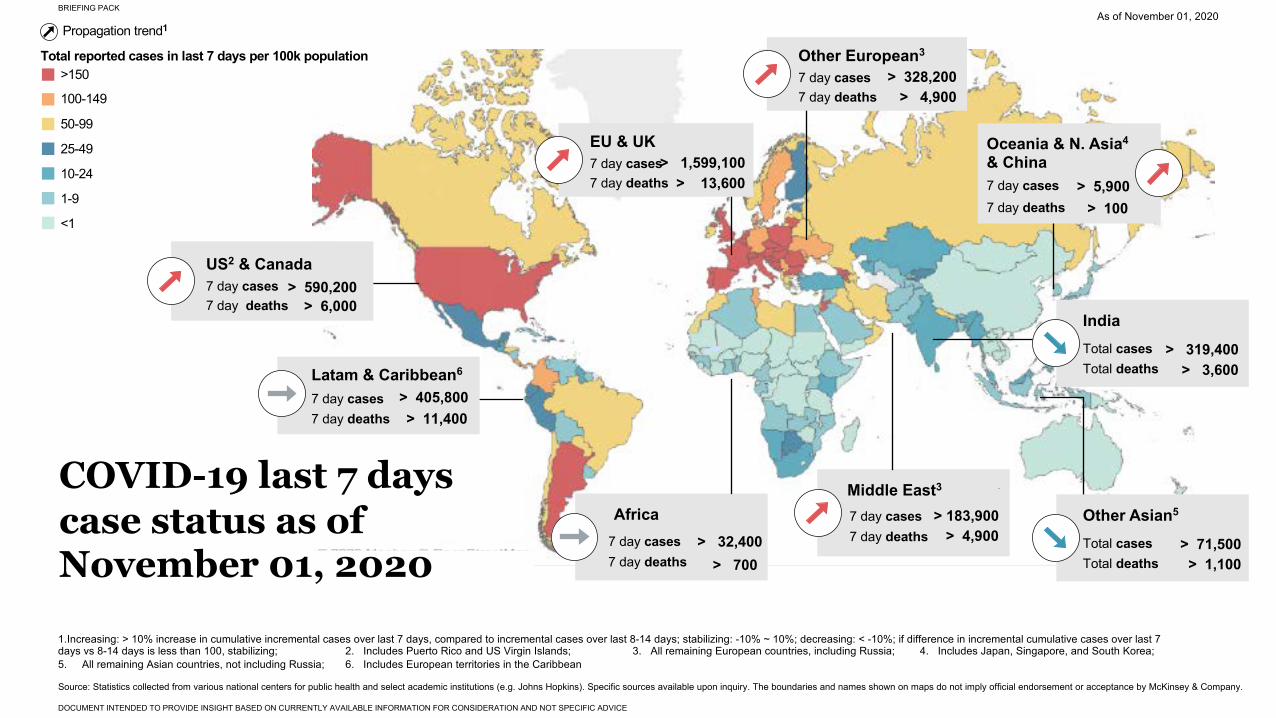
10-24
<1
1-9
25-49
50-99
100-149
>150Total reported cases in last 7 days per 100k population
Source: Statistics collected from various national centers for public health and select academic institutions (e.g. Johns Hopkins). Specific sources available upon inquiry. The boundaries and names shown on maps do not imply official endorsement or acceptance by McKinsey & Company.
Propagation trend1
Middle East3
7 day cases7 day deaths
> 183,900> 4,900
EU & UK7 day cases7 day deaths
> 1,599,100> 13,600
Latam & Caribbean6
7 day cases7 day deaths
> 405,800> 11,400
US2 & Canada7 day cases7 day deaths
> 590,200> 6,000
Oceania & N. Asia4
& China7 day cases7 day deaths
> 5,900> 100
Africa7 day cases7 day deaths
> 32,400> 700
As of November 01, 2020
Other European3
7 day cases7 day deaths
> 328,200> 4,900
1.Increasing: > 10% increase in cumulative incremental cases over last 7 days, compared to incremental cases over last 8-14 days; stabilizing: -10% ~ 10%; decreasing: < -10%; if difference in incremental cumulative cases over last 7 days vs 8-14 days is less than 100, stabilizing; 2. Includes Puerto Rico and US Virgin Islands; 3. All remaining European countries, including Russia; 4. Includes Japan, Singapore, and South Korea; 5. All remaining Asian countries, not including Russia; 6. Includes European territories in the Caribbean
COVID-19 last 7 days case status as of November 01, 2020
Other Asian5
Total casesTotal deaths
> 71,500> 1,100
IndiaTotal casesTotal deaths
> 319,400> 3,600
McKinsey & Company
BRIEFING PACK
DOCUMENT INTENDED TO PROVIDE INSIGHT BASED ON CURRENTLY AVAILABLE INFORMATION FOR CONSIDERATION AND NOT SPECIFIC ADVICE
7
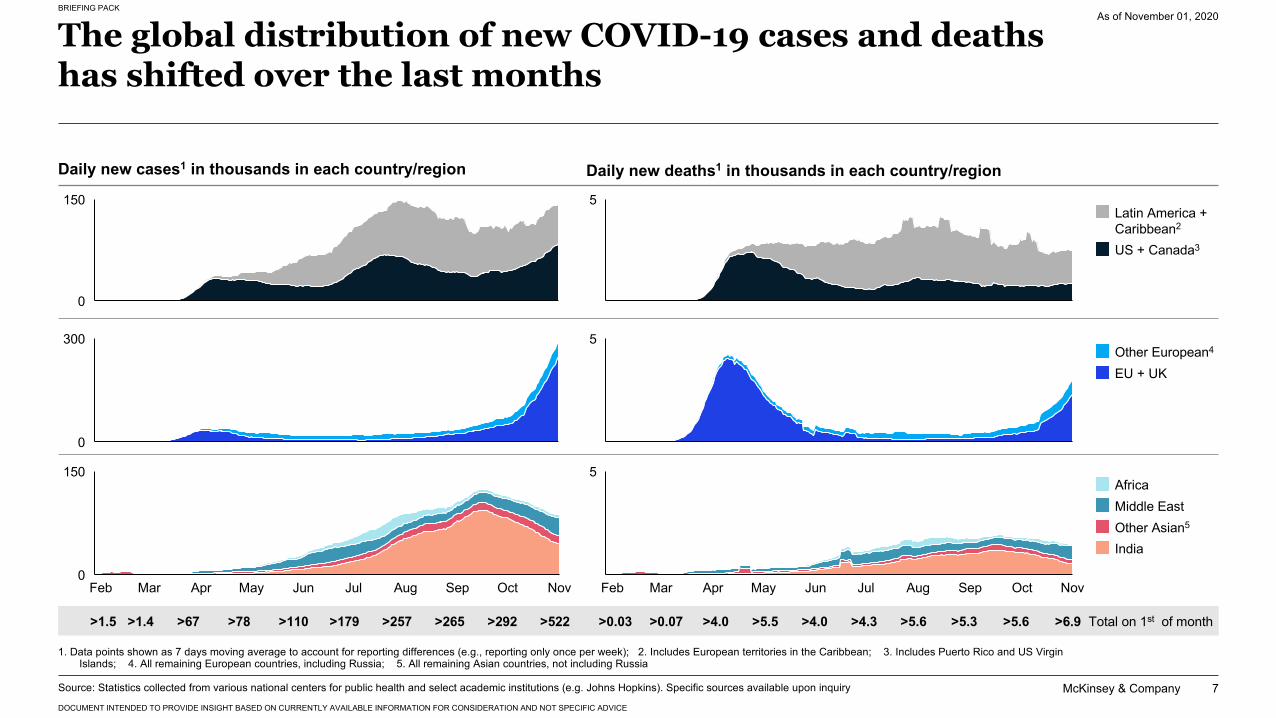
The global distribution of new COVID-19 cases and deaths has shifted over the last months
As of November 01, 2020
1. Data points shown as 7 days moving average to account for reporting differences (e.g., reporting only once per week); 2. Includes European territories in the Caribbean; 3. Includes Puerto Rico and US Virgin Islands; 4. All remaining European countries, including Russia; 5. All remaining Asian countries, not including Russia
Source: Statistics collected from various national centers for public health and select academic institutions (e.g. Johns Hopkins). Specific sources available upon inquiry
Total on 1st of month>1.4 >179>110>67 >78 >257>1.5 >265
5
5
Latin America + Caribbean2
US + Canada3
EU + UKOther European4
5
Mar SepFeb Apr May JulJun Aug Oct Nov
Other Asian5
Africa
India
Middle East
>5.3>4.3>4.0>4.0 >5.5 >5.6>0.03 >0.07
Daily new cases1 in thousands in each country/region Daily new deaths1 in thousands in each country/region
>292 >5.6
0
150
0
150
May Jul AugAprFeb Mar Jun Sep Oct Nov
0
300
>522 >6.9
McKinsey & Company
BRIEFING PACK
DOCUMENT INTENDED TO PROVIDE INSIGHT BASED ON CURRENTLY AVAILABLE INFORMATION FOR CONSIDERATION AND NOT SPECIFIC ADVICE
8
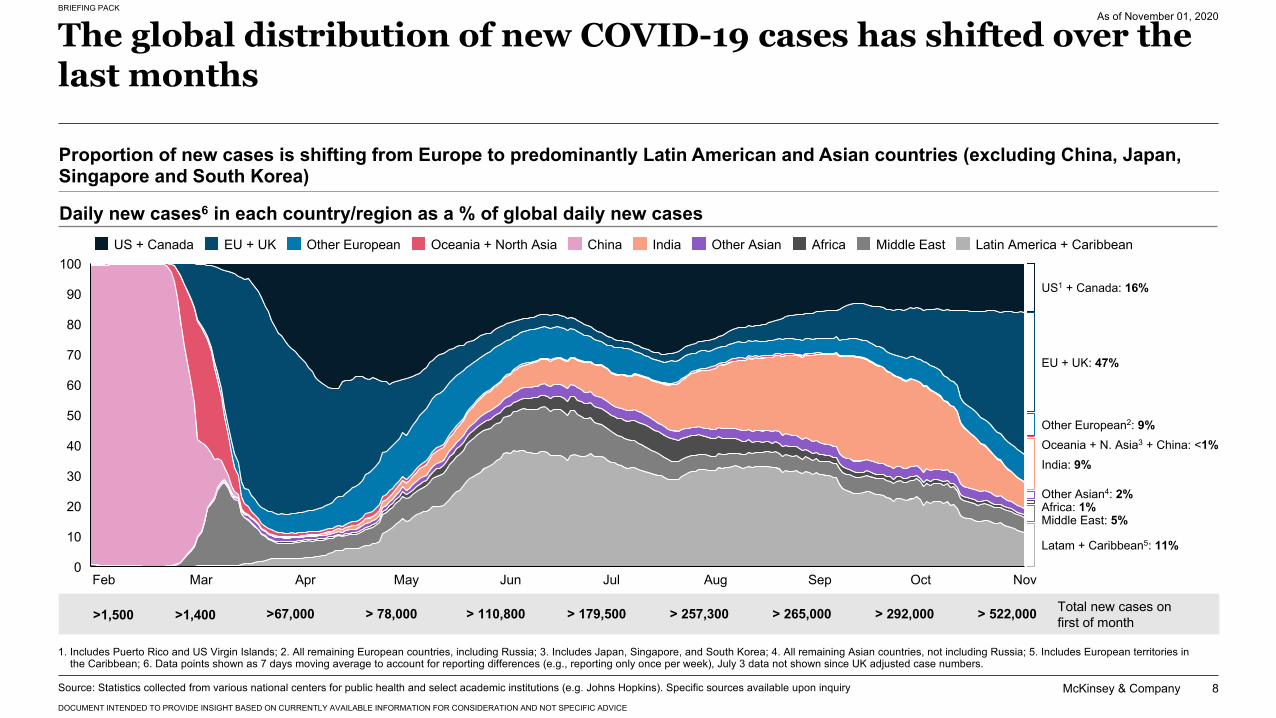
The global distribution of new COVID-19 cases has shifted over the last months
As of November 01, 2020
1. Includes Puerto Rico and US Virgin Islands; 2. All remaining European countries, including Russia; 3. Includes Japan, Singapore, and South Korea; 4. All remaining Asian countries, not including Russia; 5. Includes European territories in the Caribbean; 6. Data points shown as 7 days moving average to account for reporting differences (e.g., reporting only once per week), July 3 data not shown since UK adjusted case numbers.
60
20
0
10
70
30
100
40
50
80
90
Aug SepJulFeb Mar Apr May Jun Oct Nov
Proportion of new cases is shifting from Europe to predominantly Latin American and Asian countries (excluding China, Japan, Singapore and South Korea)
Daily new cases6 in each country/region as a % of global daily new casesUS + Canada EU + UK Other European ChinaOceania + North Asia India AfricaOther Asian Middle East Latin America + Caribbean
Source: Statistics collected from various national centers for public health and select academic institutions (e.g. Johns Hopkins). Specific sources available upon inquiry
US1 + Canada: 16%
Other Asian4: 2%
Middle East: 5%
EU + UK: 47%
Other European2: 9%Oceania + N. Asia3 + China: <1%
Africa: 1%
Total new cases on first of month >1,400 > 110,800>67,000 > 78,000 > 179,500>1,500 > 257,300
Latam + Caribbean5: 11%
> 292,000
India: 9%
> 265,000 > 522,000

McKinsey & Company
BRIEFING PACK
DOCUMENT INTENDED TO PROVIDE INSIGHT BASED ON CURRENTLY AVAILABLE INFORMATION FOR CONSIDERATION AND NOT SPECIFIC ADVICE
9
Total new deaths on first of month
COVID-19 global death distribution shows differential outcomes across regions
As of November 01, 2020
1. Includes Puerto Rico and US Virgin Islands; 2. All remaining European countries, including Russia; 3. Includes Japan, Singapore, and South Korea; 4. All remaining Asian countries, not including Russia; 5. Includes European territories in the Caribbean; 6. Data points shown as 7 days moving average to account for reporting differences (e.g., reporting only once per week), April 22 and 28 were excluded since major number adjustments were carried out on those days.
50
40
0
20
10
60
30
100
70
80
90
OctAugFeb Mar Apr JunMay Jul Sep Nov
> 4,300> 4,000> 3,900 > 5,500 > 5,600
Oceania + North AsiaUS + Canada Other EuropeanEU + UK China India Other Asian Africa Middle East Latin America + Caribbean
Source: Statistics collected from various national centers for public health and select academic institutions (e.g. Johns Hopkins). Specific sources available upon inquiry
> 75> 30 > 5,300
US1 + Canada: 12%
Other Asian4: 2%
Middle East: 10%
EU + UK: 33%
Other European2: 10%Oceania + N. Asia3 + China: <1%
Africa: 2%
Latam + Caribbean5: 23%
> 5,600
India: 7%
> 6,900
Latam/Caribbean, US/Canada, and Asian countries (excluding China, Japan, Singapore and South Korea) display an increased share of daily new deaths
Daily new cases6 in each country/region as a % of global daily new cases
McKinsey & Company
BRIEFING PACK
DOCUMENT INTENDED TO PROVIDE INSIGHT BASED ON CURRENTLY AVAILABLE INFORMATION FOR CONSIDERATION AND NOT SPECIFIC ADVICE
10
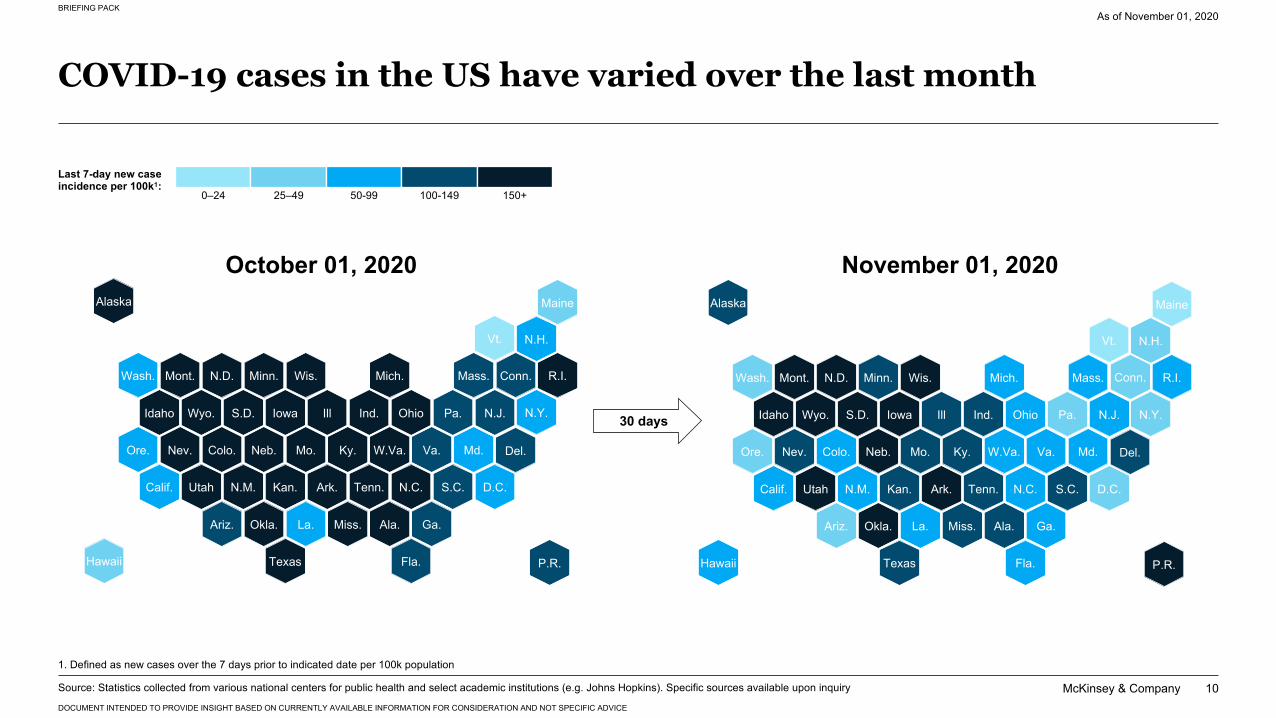
COVID-19 cases in the US have varied over the last month
As of November 01, 2020
1. Defined as new cases over the 7 days prior to indicated date per 100k population
30 days
Last 7-day new case incidence per 100k1:
0–24 25–49 50-99 100-149 150+
October 01, 2020 November 01, 2020
Source: Statistics collected from various national centers for public health and select academic institutions (e.g. Johns Hopkins). Specific sources available upon inquiry
D.C.
Mass.
N.J.
R.I.Minn.
Pa.
Colo.
S.D.
Kan.
La.
N.M.
Miss.
Ind.
Va.
Conn.
N.Y.
Neb. Md.
Iowa Ill
Del.
Calif.
N.D. Mich.Wash. Wis.
Ohio
Ky.
Texas
Nev.
Utah Tenn. N.C.
Ala.
N.H.
Ariz. Ga.
Wyo.
Mo.
Mont.
Ore.
S.C.
Okla.
Fla.
Maine
Ark.
Vt.
Hawaii
Idaho
W.Va.
Alaska
P.R.
D.C.
Mass.
N.J.
R.I.Minn.
Pa.
Colo.
S.D.
Kan.
La.
N.M.
Miss.
Ind.
Va.
Conn.
N.Y.
Neb. Md.
Iowa Ill
Del.
Calif.
N.D. Mich.Wash. Wis.
Ohio
Ky.
Texas
Nev.
Utah Tenn. N.C.
Ala.
N.H.
Ariz. Ga.
Wyo.
Mo.
Mont.
Ore.
S.C.
Okla.
Fla.
Maine
Ark.
Vt.
Hawaii
Idaho
W.Va.
Alaska
P.R.
McKinsey & Company
BRIEFING PACK
DOCUMENT INTENDED TO PROVIDE INSIGHT BASED ON CURRENTLY AVAILABLE INFORMATION FOR CONSIDERATION AND NOT SPECIFIC ADVICE
11
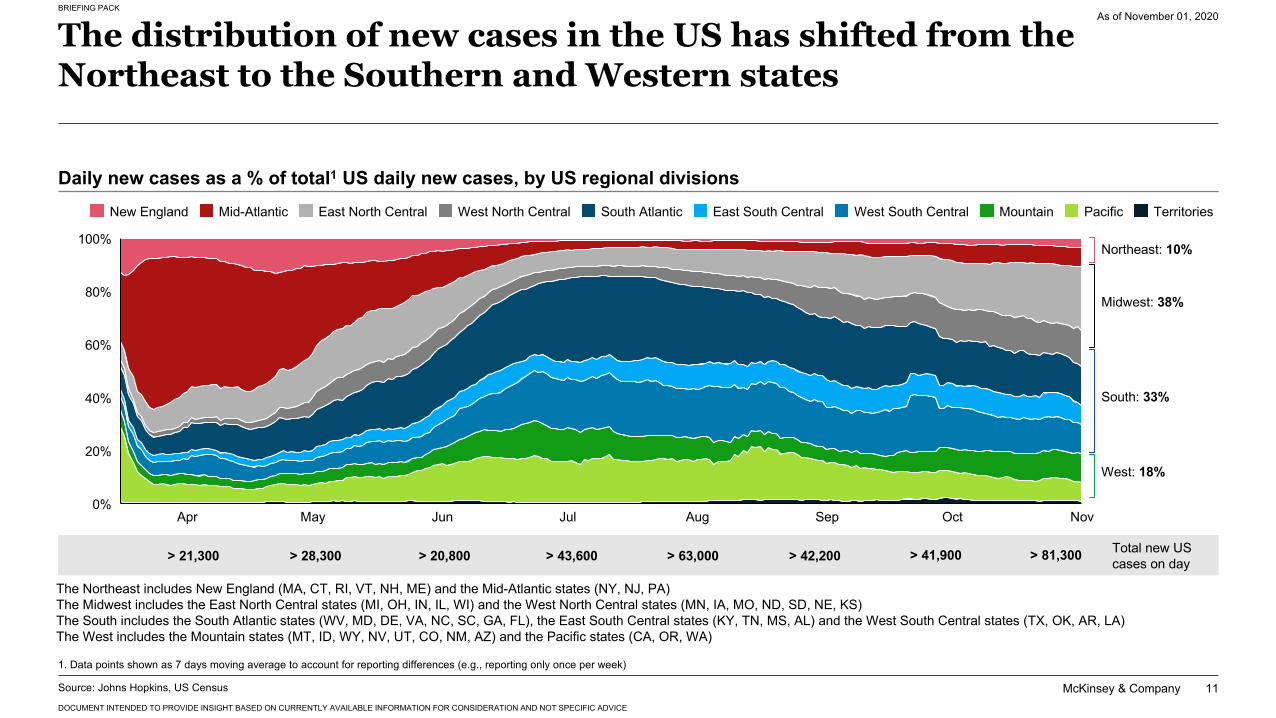
The distribution of new cases in the US has shifted from the Northeast to the Southern and Western states
As of November 01, 2020
Daily new cases as a % of total1 US daily new cases, by US regional divisions
The Northeast includes New England (MA, CT, RI, VT, NH, ME) and the Mid-Atlantic states (NY, NJ, PA)The Midwest includes the East North Central states (MI, OH, IN, IL, WI) and the West North Central states (MN, IA, MO, ND, SD, NE, KS)The South includes the South Atlantic states (WV, MD, DE, VA, NC, SC, GA, FL), the East South Central states (KY, TN, MS, AL) and the West South Central states (TX, OK, AR, LA)The West includes the Mountain states (MT, ID, WY, NV, UT, CO, NM, AZ) and the Pacific states (CA, OR, WA)
Source: Johns Hopkins, US Census
Total new US cases on day
0%
40%
20%
60%
80%
100%
Apr May Jun Jul Aug Sep Oct Nov
New England West North Central South AtlanticEast North CentralMid-Atlantic East South Central West South Central Mountain Pacific Territories
> 41,900
Northeast: 10%
Midwest: 38%
South: 33%
West: 18%
> 43,600> 20,800> 21,300 > 28,300 > 63,000 > 42,200 > 81,300
1. Data points shown as 7 days moving average to account for reporting differences (e.g., reporting only once per week)
McKinsey & Company
BRIEFING PACK
DOCUMENT INTENDED TO PROVIDE INSIGHT BASED ON CURRENTLY AVAILABLE INFORMATION FOR CONSIDERATION AND NOT SPECIFIC ADVICE
12
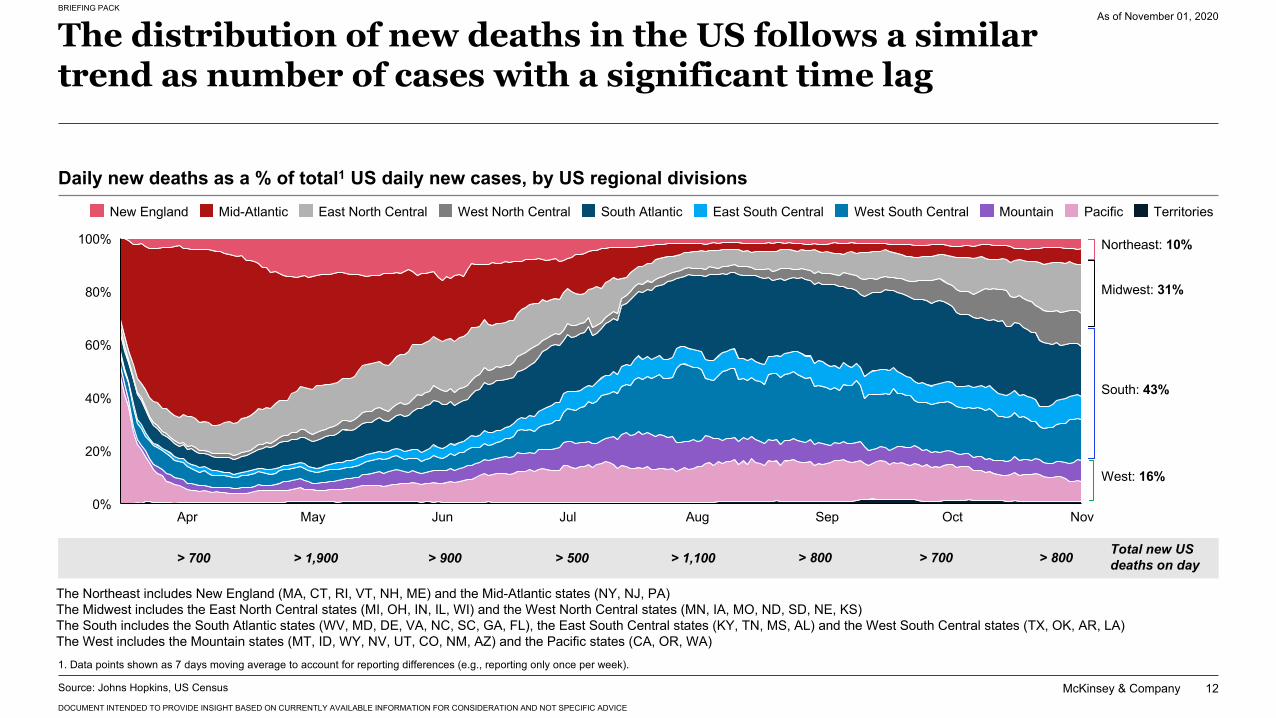
The distribution of new deaths in the US follows a similar trend as number of cases with a significant time lag
As of November 01, 2020
80%
0%
20%
40%
60%
100%
MayApr Jun OctJul Aug Sep Nov
Daily new deaths as a % of total1 US daily new cases, by US regional divisions
The Northeast includes New England (MA, CT, RI, VT, NH, ME) and the Mid-Atlantic states (NY, NJ, PA)The Midwest includes the East North Central states (MI, OH, IN, IL, WI) and the West North Central states (MN, IA, MO, ND, SD, NE, KS)The South includes the South Atlantic states (WV, MD, DE, VA, NC, SC, GA, FL), the East South Central states (KY, TN, MS, AL) and the West South Central states (TX, OK, AR, LA)The West includes the Mountain states (MT, ID, WY, NV, UT, CO, NM, AZ) and the Pacific states (CA, OR, WA)
New England South AtlanticEast North CentralMid-Atlantic West North Central East South Central West South Central Mountain Pacific Territories
Total new US deaths on day
Northeast: 10%
Midwest: 31%
South: 43%
West: 16%
> 700> 500> 900> 700 > 1,900 > 1,100 > 800 > 800
Source: Johns Hopkins, US Census
1. Data points shown as 7 days moving average to account for reporting differences (e.g., reporting only once per week).
McKinsey & Company
BRIEFING PACK
DOCUMENT INTENDED TO PROVIDE INSIGHT BASED ON CURRENTLY AVAILABLE INFORMATION FOR CONSIDERATION AND NOT SPECIFIC ADVICE
13Source: COVID-19: US CDC; Flu: US CDC; US CDC Nursing homes
1. Data quality and reporting practices vary by geography - total number of COVID-19 deaths by age scaled proportionally to equal total number of COVID-19 reported deaths
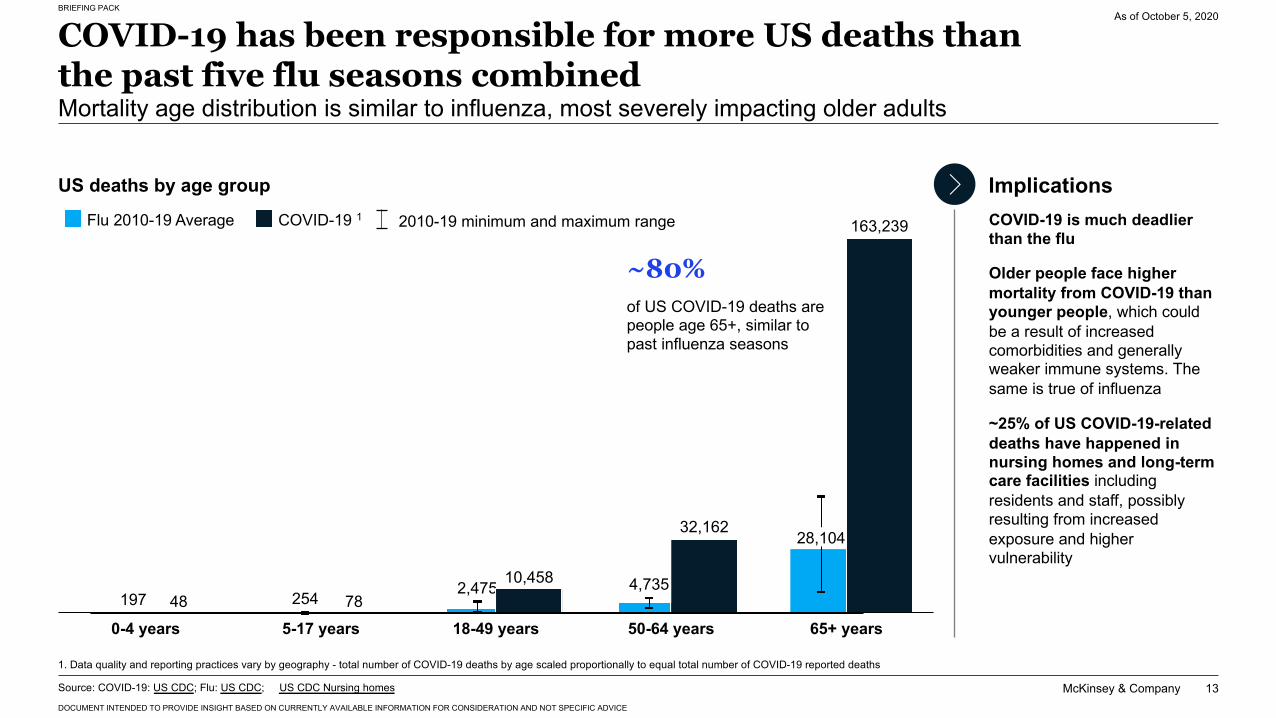
197 254 2,475 4,735
28,104
COVID-19 is much deadlier than the flu
Older people face higher mortality from COVID-19 than younger people, which could be a result of increased comorbidities and generally weaker immune systems. The same is true of influenza
~25% of US COVID-19-related deaths have happened in nursing homes and long-term care facilities including residents and staff, possibly resulting from increased exposure and higher vulnerability
10,458
32,162
163,239
18-49 years0-4 years 5-17 years 50-64 years78
65+ years48
COVID-19 has been responsible for more US deaths than the past five flu seasons combinedMortality age distribution is similar to influenza, most severely impacting older adults
As of October 5, 2020
US deaths by age group ImplicationsFlu 2010-19 Average
~80%of US COVID-19 deaths are people age 65+, similar to past influenza seasons
2010-19 minimum and maximum range COVID-19 1
McKinsey & Company
BRIEFING PACK
DOCUMENT INTENDED TO PROVIDE INSIGHT BASED ON CURRENTLY AVAILABLE INFORMATION FOR CONSIDERATION AND NOT SPECIFIC ADVICE
14
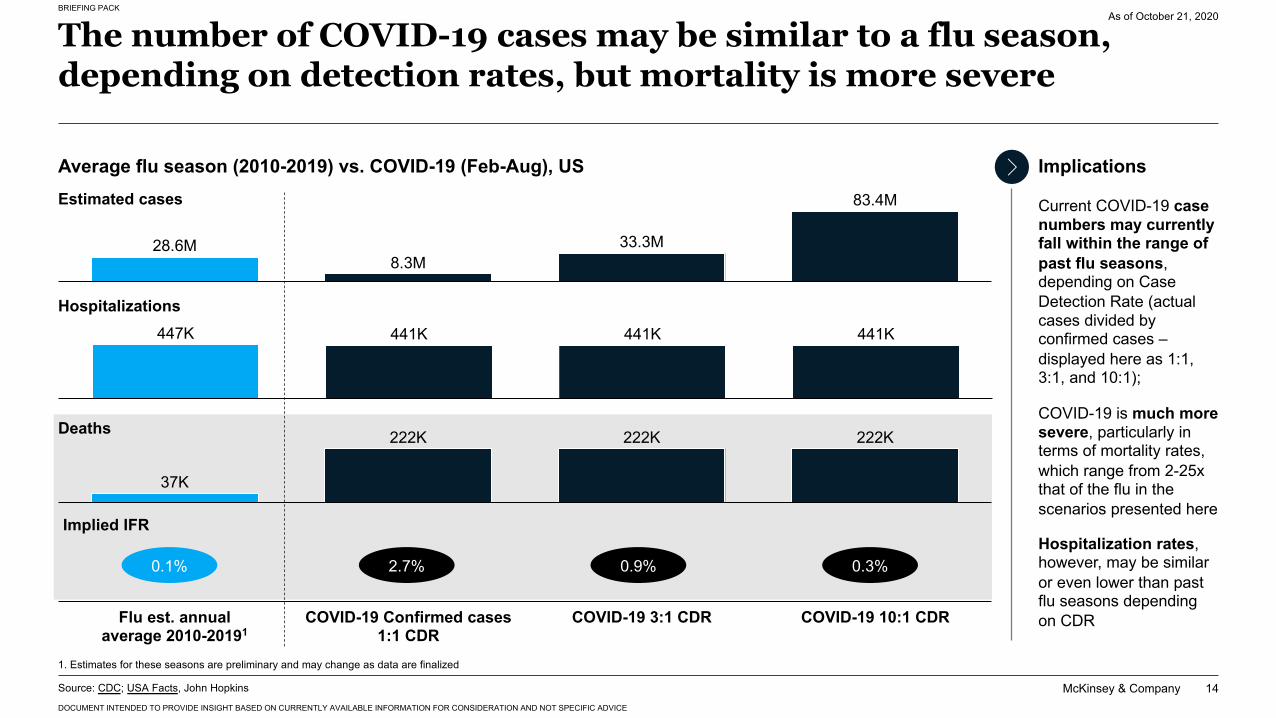
The number of COVID-19 cases may be similar to a flu season, depending on detection rates, but mortality is more severe
As of October 21, 2020
Source: CDC; USA Facts, John Hopkins
1. Estimates for these seasons are preliminary and may change as data are finalized
Average flu season (2010-2019) vs. COVID-19 (Feb-Aug), US Implications
Current COVID-19 case numbers may currently fall within the range of past flu seasons, depending on Case Detection Rate (actual cases divided by confirmed cases –displayed here as 1:1, 3:1, and 10:1);
COVID-19 is much more severe, particularly in terms of mortality rates, which range from 2-25x that of the flu in the scenarios presented here
Hospitalization rates, however, may be similar or even lower than past flu seasons depending on CDR
28.6M
83.4M
8.3M33.3M
Estimated cases
Hospitalizations
Deaths
COVID-19 Confirmed cases1:1 CDR
Flu est. annual average 2010-20191
COVID-19 10:1 CDRCOVID-19 3:1 CDR
441K447K 441K 441K
222K
37K
222K 222K
Implied IFR
0.1% 2.7% 0.9% 0.3%
McKinsey & Company
BRIEFING PACK
DOCUMENT INTENDED TO PROVIDE INSIGHT BASED ON CURRENTLY AVAILABLE INFORMATION FOR CONSIDERATION AND NOT SPECIFIC ADVICE
15
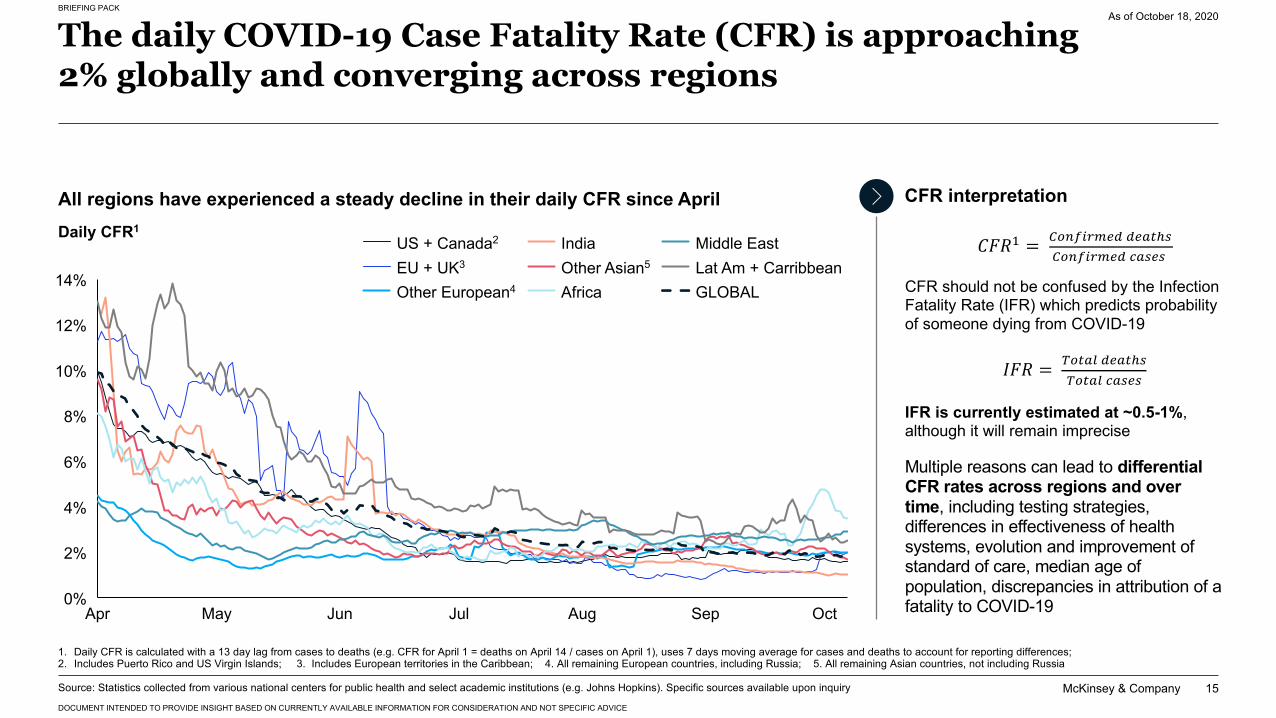
The daily COVID-19 Case Fatality Rate (CFR) is approaching 2% globally and converging across regions
As of October 18, 2020
6%
10%
0%
4%
8%
2%
14%
12%
OctApr May Jun Jul Aug Sep
CFR interpretation
Multiple reasons can lead to differential CFR rates across regions and over time, including testing strategies, differences in effectiveness of health systems, evolution and improvement of standard of care, median age of population, discrepancies in attribution of a fatality to COVID-19
Daily CFR1
1. Daily CFR is calculated with a 13 day lag from cases to deaths (e.g. CFR for April 1 = deaths on April 14 / cases on April 1), uses 7 days moving average for cases and deaths to account for reporting differences; 2. Includes Puerto Rico and US Virgin Islands; 3. Includes European territories in the Caribbean; 4. All remaining European countries, including Russia; 5. All remaining Asian countries, not including Russia
All regions have experienced a steady decline in their daily CFR since April
Source: Statistics collected from various national centers for public health and select academic institutions (e.g. Johns Hopkins). Specific sources available upon inquiry
CFR should not be confused by the Infection Fatality Rate (IFR) which predicts probability of someone dying from COVID-19
IFR is currently estimated at ~0.5-1%, although it will remain imprecise
𝐶𝐹𝑅! = "#$%&'()* *)+,-."#$%&'()* /+.).
𝐼𝐹𝑅 = 0#,+1 *)+,-.0#,+1 /+.).
EU + UK3
US + Canada2
Other Asian5
India
Other European4 Africa
Middle EastLat Am + CarribbeanGLOBAL
McKinsey & Company
BRIEFING PACK
DOCUMENT INTENDED TO PROVIDE INSIGHT BASED ON CURRENTLY AVAILABLE INFORMATION FOR CONSIDERATION AND NOT SPECIFIC ADVICE
16
8%
10%
0%
2%
4%
6%
AugMayApr Jun OctJul Sep
400
2
0
100
2004
300
0
6
8
10
May Jul OctApr Jun Aug Sep
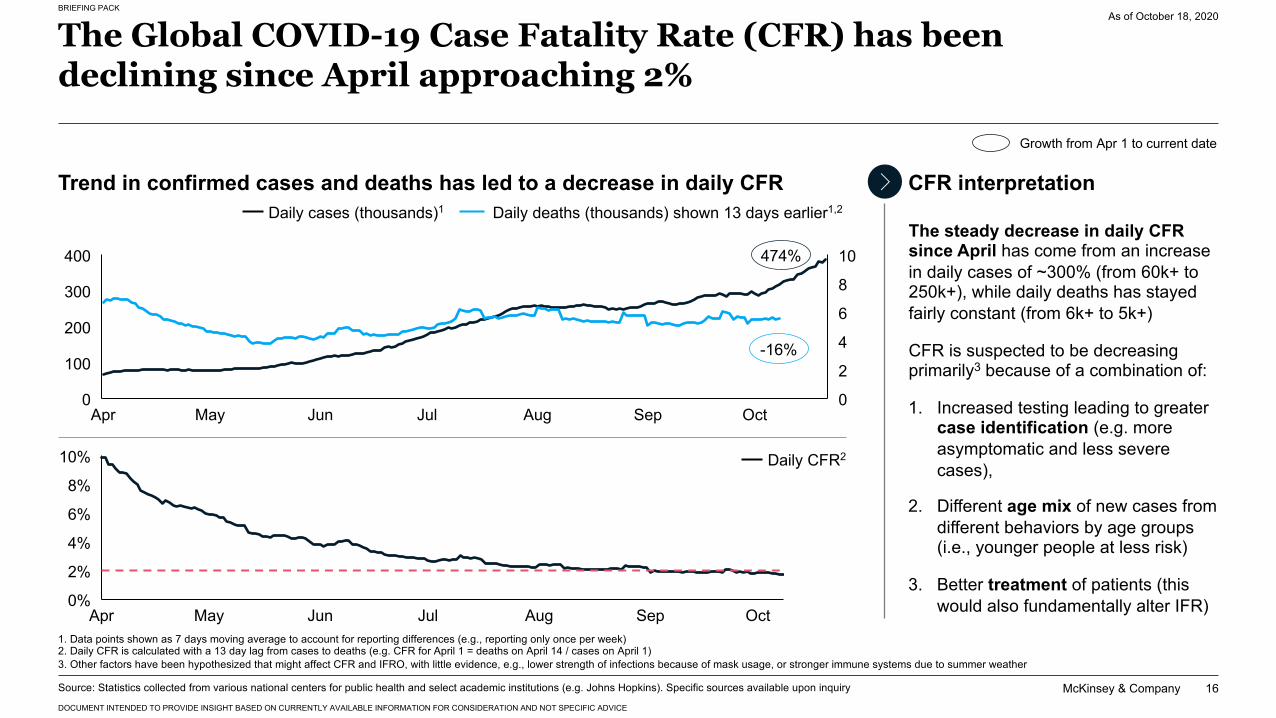
The Global COVID-19 Case Fatality Rate (CFR) has been declining since April approaching 2%
As of October 18, 2020
Source: Statistics collected from various national centers for public health and select academic institutions (e.g. Johns Hopkins). Specific sources available upon inquiry
1. Data points shown as 7 days moving average to account for reporting differences (e.g., reporting only once per week)2. Daily CFR is calculated with a 13 day lag from cases to deaths (e.g. CFR for April 1 = deaths on April 14 / cases on April 1)3. Other factors have been hypothesized that might affect CFR and IFRO, with little evidence, e.g., lower strength of infections because of mask usage, or stronger immune systems due to summer weather
474%
-16%
Growth from Apr 1 to current date
CFR interpretationDaily cases (thousands)1 Daily deaths (thousands) shown 13 days earlier1,2
Daily CFR2
The steady decrease in daily CFR since April has come from an increase in daily cases of ~300% (from 60k+ to 250k+), while daily deaths has stayed fairly constant (from 6k+ to 5k+)
CFR is suspected to be decreasing primarily3 because of a combination of:
1. Increased testing leading to greater case identification (e.g. more asymptomatic and less severe cases),
2. Different age mix of new cases from different behaviors by age groups (i.e., younger people at less risk)
3. Better treatment of patients (this would also fundamentally alter IFR)
Trend in confirmed cases and deaths has led to a decrease in daily CFR
McKinsey & Company
BRIEFING PACK
DOCUMENT INTENDED TO PROVIDE INSIGHT BASED ON CURRENTLY AVAILABLE INFORMATION FOR CONSIDERATION AND NOT SPECIFIC ADVICE
17
10%
Apr JunMay AugJul Sep
50,000
5,000
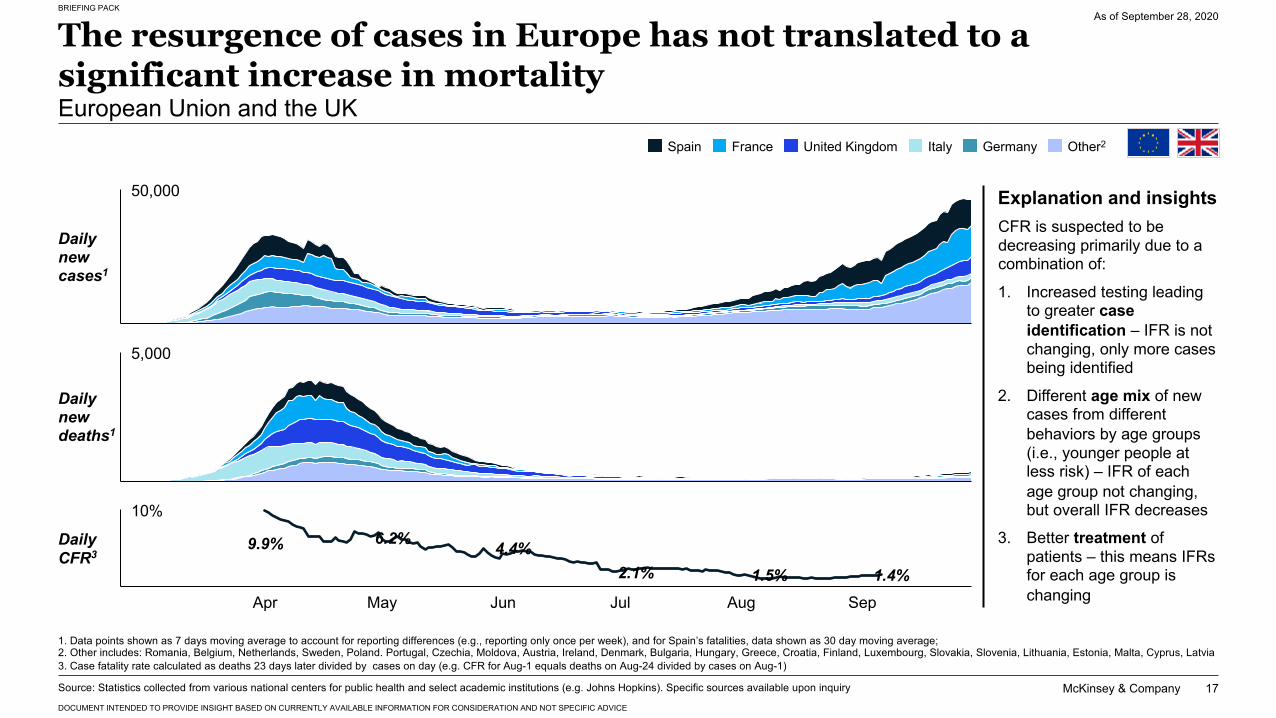
The resurgence of cases in Europe has not translated to a significant increase in mortalityEuropean Union and the UK
As of September 28, 2020
1. Data points shown as 7 days moving average to account for reporting differences (e.g., reporting only once per week), and for Spain’s fatalities, data shown as 30 day moving average; 2. Other includes: Romania, Belgium, Netherlands, Sweden, Poland. Portugal, Czechia, Moldova, Austria, Ireland, Denmark, Bulgaria, Hungary, Greece, Croatia, Finland, Luxembourg, Slovakia, Slovenia, Lithuania, Estonia, Malta, Cyprus, Latvia3. Case fatality rate calculated as deaths 23 days later divided by cases on day (e.g. CFR for Aug-1 equals deaths on Aug-24 divided by cases on Aug-1)
Spain France United Kingdom Italy Germany Other2
Daily CFR3
Daily new deaths1
Daily new cases1
4.4%6.2%9.9%
2.1% 1.5% 1.4%
CFR is suspected to be decreasing primarily due to a combination of:
1. Increased testing leading to greater case identification – IFR is not changing, only more cases being identified
2. Different age mix of new cases from different behaviors by age groups (i.e., younger people at less risk) – IFR of each age group not changing, but overall IFR decreases
3. Better treatment of patients – this means IFRs for each age group is changing
Explanation and insights
Source: Statistics collected from various national centers for public health and select academic institutions (e.g. Johns Hopkins). Specific sources available upon inquiry
McKinsey & Company
BRIEFING PACK
DOCUMENT INTENDED TO PROVIDE INSIGHT BASED ON CURRENTLY AVAILABLE INFORMATION FOR CONSIDERATION AND NOT SPECIFIC ADVICE
18
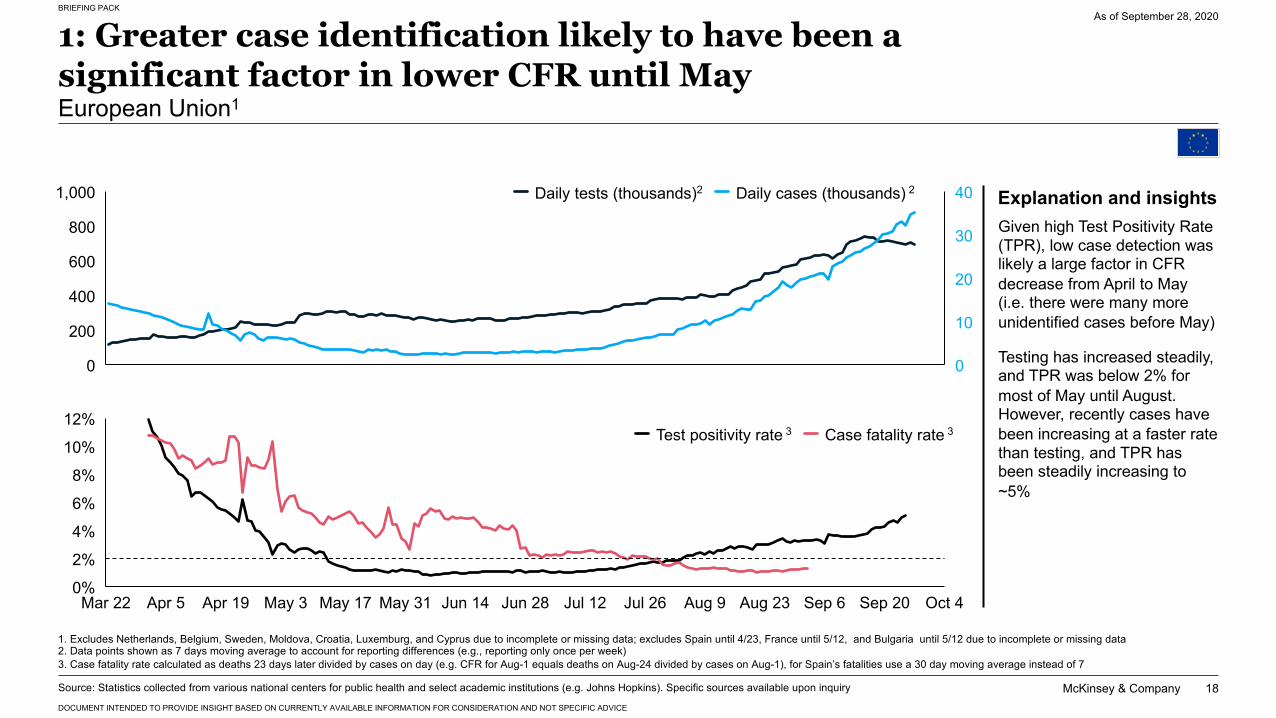
1: Greater case identification likely to have been a significant factor in lower CFR until MayEuropean Union1
As of September 28, 2020
12%
0%
2%
4%
6%
10%
8%
May 31 Jul 26Mar 22 Apr 5 Apr 19 Sep 6Jun 14May 3 May 17 Jun 28 Jul 12 Aug 9 Aug 23 Sep 20 Oct 4
20
1,000
0
400
800
200
600
0
10
30
40Daily tests (thousands)2 Daily cases (thousands) 2
Test positivity rate 3 Case fatality rate 3
1. Excludes Netherlands, Belgium, Sweden, Moldova, Croatia, Luxemburg, and Cyprus due to incomplete or missing data; excludes Spain until 4/23, France until 5/12, and Bulgaria until 5/12 due to incomplete or missing data 2. Data points shown as 7 days moving average to account for reporting differences (e.g., reporting only once per week)3. Case fatality rate calculated as deaths 23 days later divided by cases on day (e.g. CFR for Aug-1 equals deaths on Aug-24 divided by cases on Aug-1), for Spain’s fatalities use a 30 day moving average instead of 7
Source: Statistics collected from various national centers for public health and select academic institutions (e.g. Johns Hopkins). Specific sources available upon inquiry
Given high Test Positivity Rate (TPR), low case detection was likely a large factor in CFR decrease from April to May (i.e. there were many more unidentified cases before May)
Testing has increased steadily, and TPR was below 2% for most of May until August. However, recently cases have been increasing at a faster rate than testing, and TPR has been steadily increasing to ~5%
Explanation and insights
McKinsey & Company
BRIEFING PACK
DOCUMENT INTENDED TO PROVIDE INSIGHT BASED ON CURRENTLY AVAILABLE INFORMATION FOR CONSIDERATION AND NOT SPECIFIC ADVICE
19
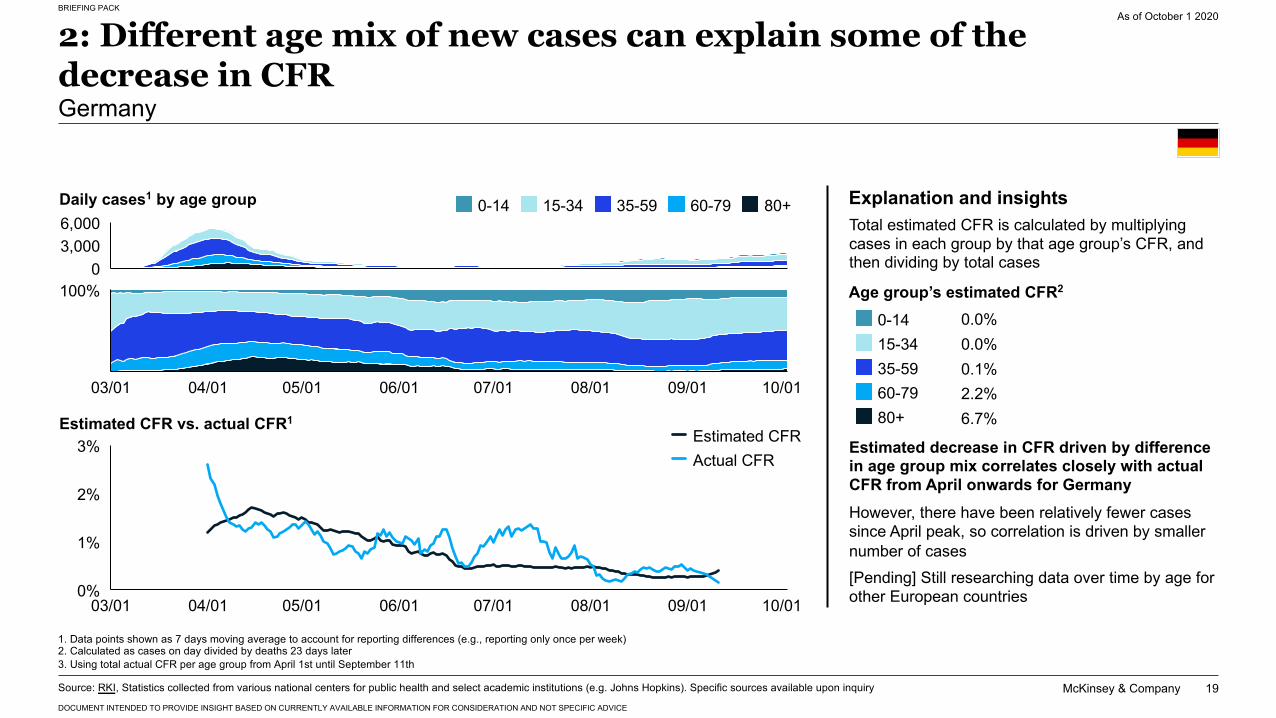
2: Different age mix of new cases can explain some of the decrease in CFRGermany
As of October 1 2020
03,0006,000
0.0%0.0%0.1%2.2%
Age group’s estimated CFR2
Daily cases1 by age group Explanation and insightsTotal estimated CFR is calculated by multiplying cases in each group by that age group’s CFR, and then dividing by total cases
Estimated decrease in CFR driven by difference in age group mix correlates closely with actual CFR from April onwards for GermanyHowever, there have been relatively fewer cases since April peak, so correlation is driven by smaller number of cases[Pending] Still researching data over time by age for other European countries
100%
03/01 04/01 05/01 07/0106/01 08/01 09/01 10/01
1%
0%
3%
2%
03/01 05/01 06/01 07/0104/01 08/01 09/01 10/01
Estimated CFRActual CFR
60-790-14 15-34 35-59 80+
Estimated CFR vs. actual CFR1
0-14
80+
15-34
60-7935-59
1. Data points shown as 7 days moving average to account for reporting differences (e.g., reporting only once per week)2. Calculated as cases on day divided by deaths 23 days later3. Using total actual CFR per age group from April 1st until September 11th
6.7%
Source: RKI, Statistics collected from various national centers for public health and select academic institutions (e.g. Johns Hopkins). Specific sources available upon inquiry
McKinsey & Company
BRIEFING PACK
DOCUMENT INTENDED TO PROVIDE INSIGHT BASED ON CURRENTLY AVAILABLE INFORMATION FOR CONSIDERATION AND NOT SPECIFIC ADVICE
20
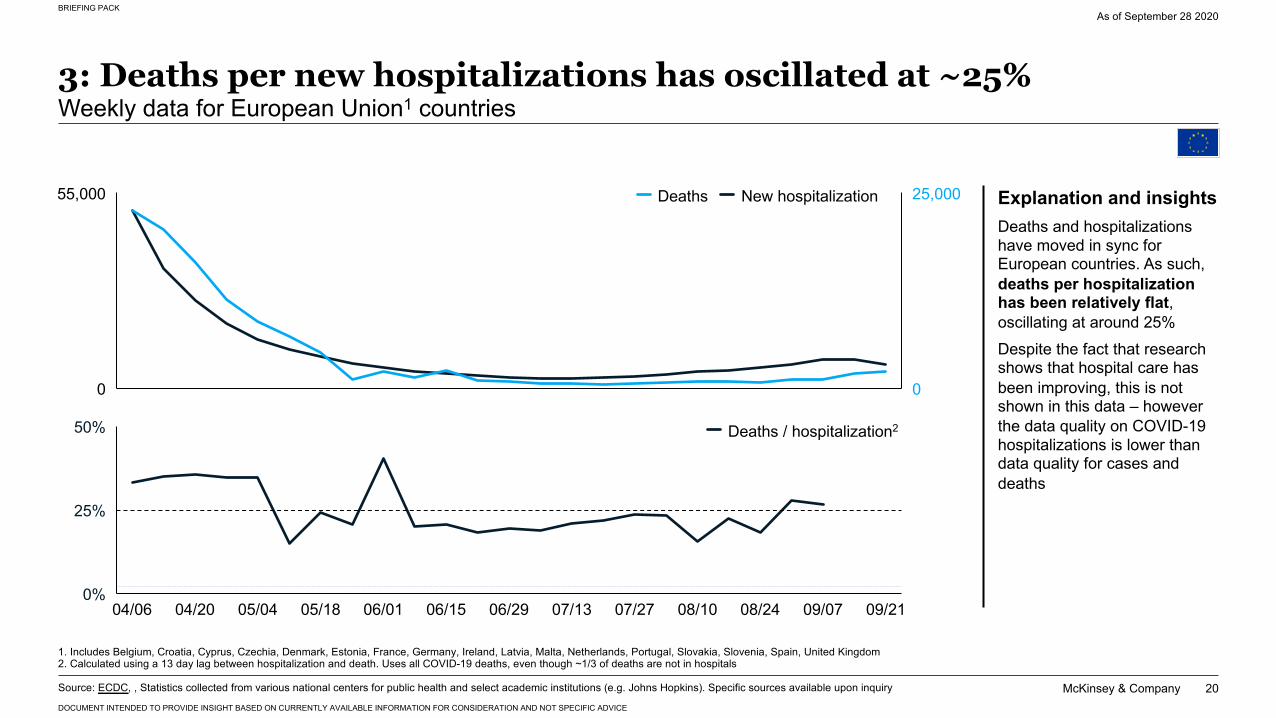
3: Deaths per new hospitalizations has oscillated at ~25%Weekly data for European Union1 countries
As of September 28 2020
0
55,000 25,000
0
0%
25%
50%
06/0105/1805/0404/06 04/20 06/15 07/1306/29 07/27 09/2108/2408/10 09/07
Deaths New hospitalization
Deaths / hospitalization2
1. Includes Belgium, Croatia, Cyprus, Czechia, Denmark, Estonia, France, Germany, Ireland, Latvia, Malta, Netherlands, Portugal, Slovakia, Slovenia, Spain, United Kingdom2. Calculated using a 13 day lag between hospitalization and death. Uses all COVID-19 deaths, even though ~1/3 of deaths are not in hospitals
Source: ECDC, , Statistics collected from various national centers for public health and select academic institutions (e.g. Johns Hopkins). Specific sources available upon inquiry
Deaths and hospitalizations have moved in sync for European countries. As such, deaths per hospitalization has been relatively flat, oscillating at around 25%Despite the fact that research shows that hospital care has been improving, this is not shown in this data – however the data quality on COVID-19 hospitalizations is lower than data quality for cases and deaths
Explanation and insights
McKinsey & Company
BRIEFING PACK
DOCUMENT INTENDED TO PROVIDE INSIGHT BASED ON CURRENTLY AVAILABLE INFORMATION FOR CONSIDERATION AND NOT SPECIFIC ADVICE
21
AugApr May Jun Jul Sep
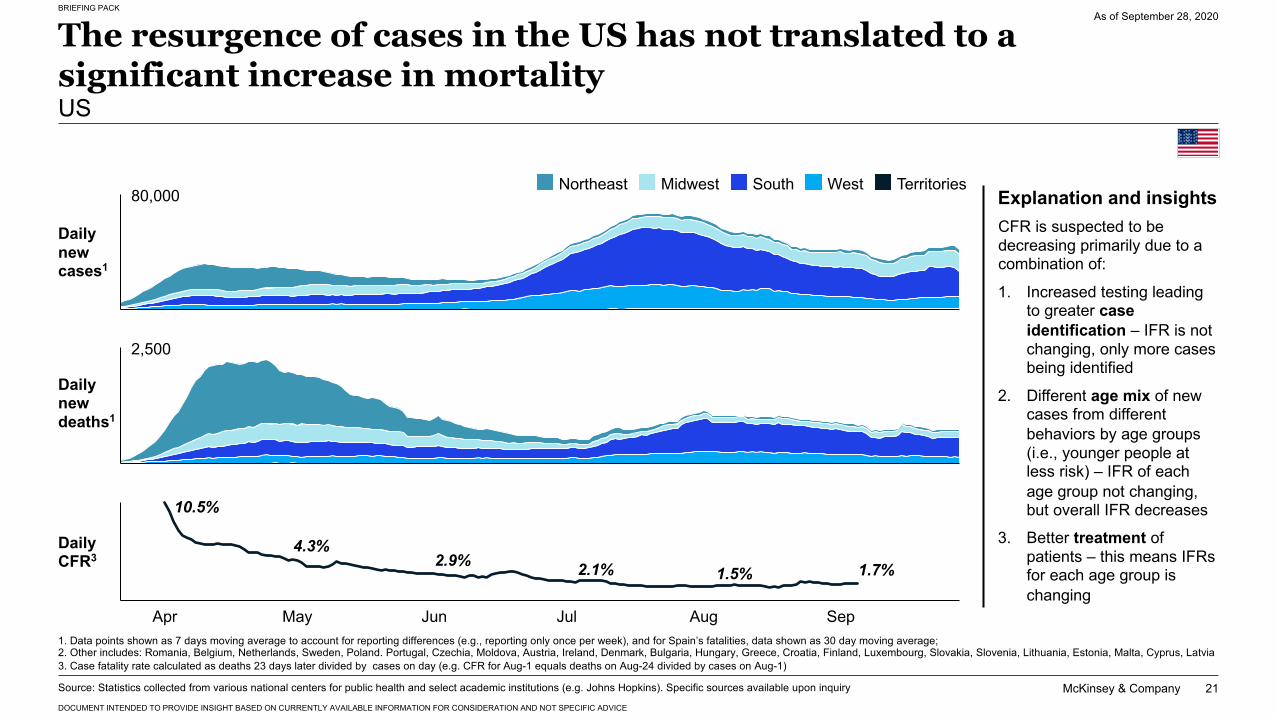
The resurgence of cases in the US has not translated to a significant increase in mortalityUS
As of September 28, 2020
1. Data points shown as 7 days moving average to account for reporting differences (e.g., reporting only once per week), and for Spain’s fatalities, data shown as 30 day moving average; 2. Other includes: Romania, Belgium, Netherlands, Sweden, Poland. Portugal, Czechia, Moldova, Austria, Ireland, Denmark, Bulgaria, Hungary, Greece, Croatia, Finland, Luxembourg, Slovakia, Slovenia, Lithuania, Estonia, Malta, Cyprus, Latvia3. Case fatality rate calculated as deaths 23 days later divided by cases on day (e.g. CFR for Aug-1 equals deaths on Aug-24 divided by cases on Aug-1)
Daily CFR3
Daily new deaths1
Daily new cases1
2.9%4.3%
10.5%
2.1% 1.5% 1.7%
CFR is suspected to be decreasing primarily due to a combination of:
1. Increased testing leading to greater case identification – IFR is not changing, only more cases being identified
2. Different age mix of new cases from different behaviors by age groups (i.e., younger people at less risk) – IFR of each age group not changing, but overall IFR decreases
3. Better treatment of patients – this means IFRs for each age group is changing
80,000Northeast Midwest South West Territories
2,500
Source: Statistics collected from various national centers for public health and select academic institutions (e.g. Johns Hopkins). Specific sources available upon inquiry
Explanation and insights
McKinsey & Company
BRIEFING PACK
DOCUMENT INTENDED TO PROVIDE INSIGHT BASED ON CURRENTLY AVAILABLE INFORMATION FOR CONSIDERATION AND NOT SPECIFIC ADVICE
22
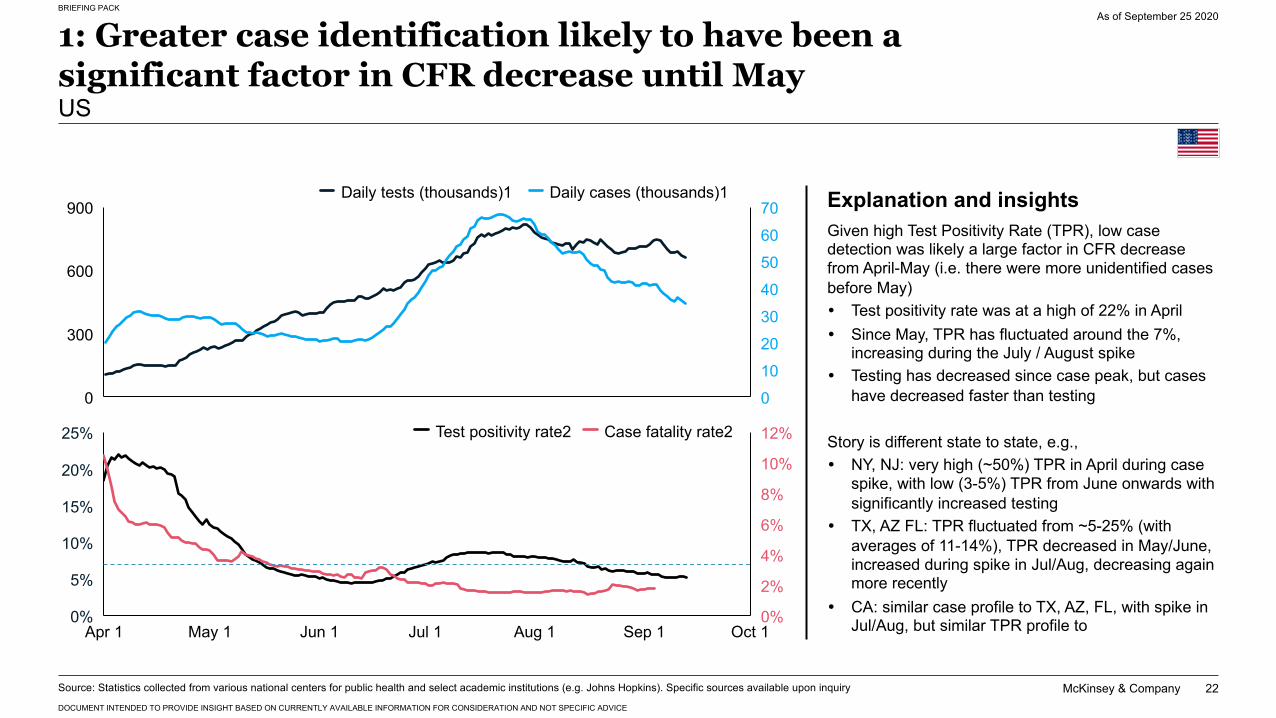
1: Greater case identification likely to have been a significant factor in CFR decrease until MayUS
As of September 25 2020
6%
Oct 1
5%
Apr 1 May 1
10%
Sep 1
25%
Aug 1Jun 1 Jul 1
4%10%
20%
2%
8%
0%
15%
0%
12%
20
600
900
300
0100
3040506070
Daily tests (thousands)1 Daily cases (thousands)1
Test positivity rate2 Case fatality rate2
Explanation and insightsGiven high Test Positivity Rate (TPR), low case detection was likely a large factor in CFR decrease from April-May (i.e. there were more unidentified cases before May)� Test positivity rate was at a high of 22% in April� Since May, TPR has fluctuated around the 7%,
increasing during the July / August spike� Testing has decreased since case peak, but cases
have decreased faster than testing
Story is different state to state, e.g.,� NY, NJ: very high (~50%) TPR in April during case
spike, with low (3-5%) TPR from June onwards with significantly increased testing
� TX, AZ FL: TPR fluctuated from ~5-25% (with averages of 11-14%), TPR decreased in May/June, increased during spike in Jul/Aug, decreasing again more recently
� CA: similar case profile to TX, AZ, FL, with spike in Jul/Aug, but similar TPR profile to
Source: Statistics collected from various national centers for public health and select academic institutions (e.g. Johns Hopkins). Specific sources available upon inquiry
McKinsey & Company
BRIEFING PACK
DOCUMENT INTENDED TO PROVIDE INSIGHT BASED ON CURRENTLY AVAILABLE INFORMATION FOR CONSIDERATION AND NOT SPECIFIC ADVICE
23
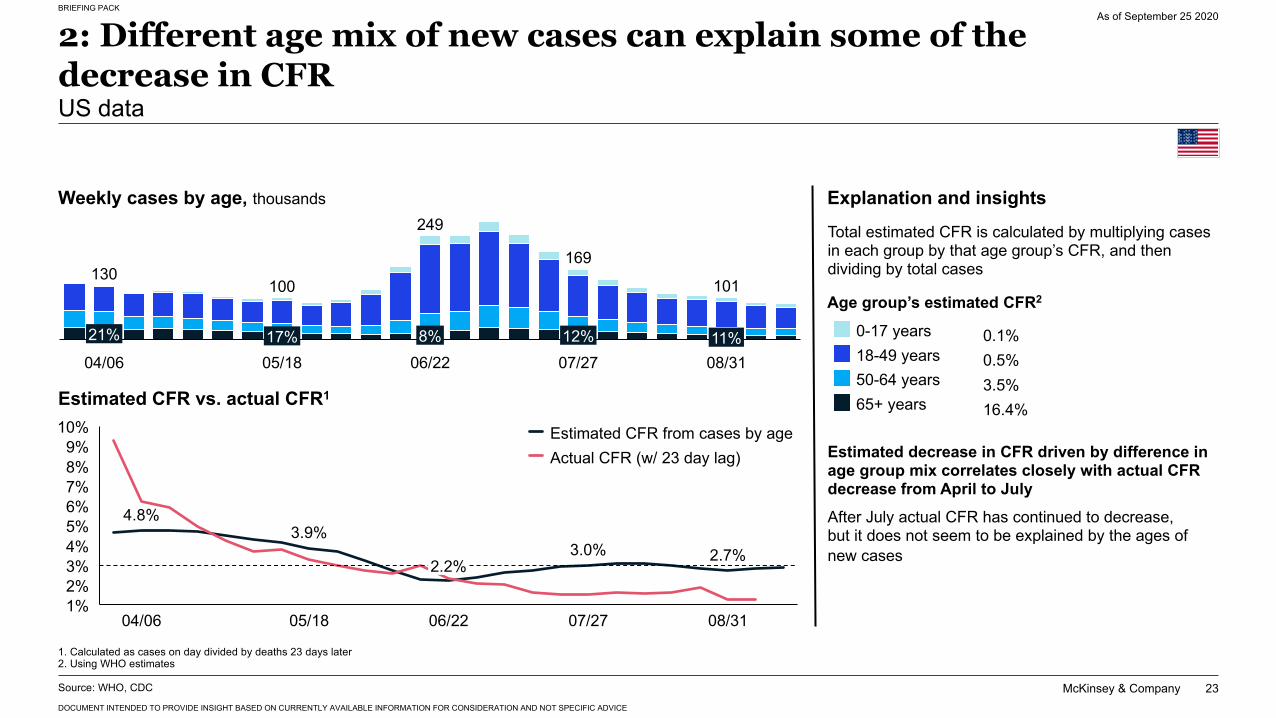
2: Different age mix of new cases can explain some of the decrease in CFRUS data
As of September 25 2020
21%
05/1817%
04/068%
169
06/2212%07/27
11%08/31
130100
249
101
0-17 years
50-64 years18-49 years
65+ years
0.1%0.5%3.5%16.4%
Age group’s estimated CFR2
4.8%3.9%
3.0% 2.7%4%
9%
1%
7%
2%3%
10%
8%
5%6%
05/1804/06
2.2%
06/22 07/27 08/31
Weekly cases by age, thousands
Estimated CFR vs. actual CFR1
Estimated CFR from cases by ageActual CFR (w/ 23 day lag)
Explanation and insightsTotal estimated CFR is calculated by multiplying cases in each group by that age group’s CFR, and then dividing by total cases
Estimated decrease in CFR driven by difference in age group mix correlates closely with actual CFR decrease from April to JulyAfter July actual CFR has continued to decrease, but it does not seem to be explained by the ages of new cases
1. Calculated as cases on day divided by deaths 23 days later2. Using WHO estimates
Source: WHO, CDC
McKinsey & Company
BRIEFING PACK
DOCUMENT INTENDED TO PROVIDE INSIGHT BASED ON CURRENTLY AVAILABLE INFORMATION FOR CONSIDERATION AND NOT SPECIFIC ADVICE
24
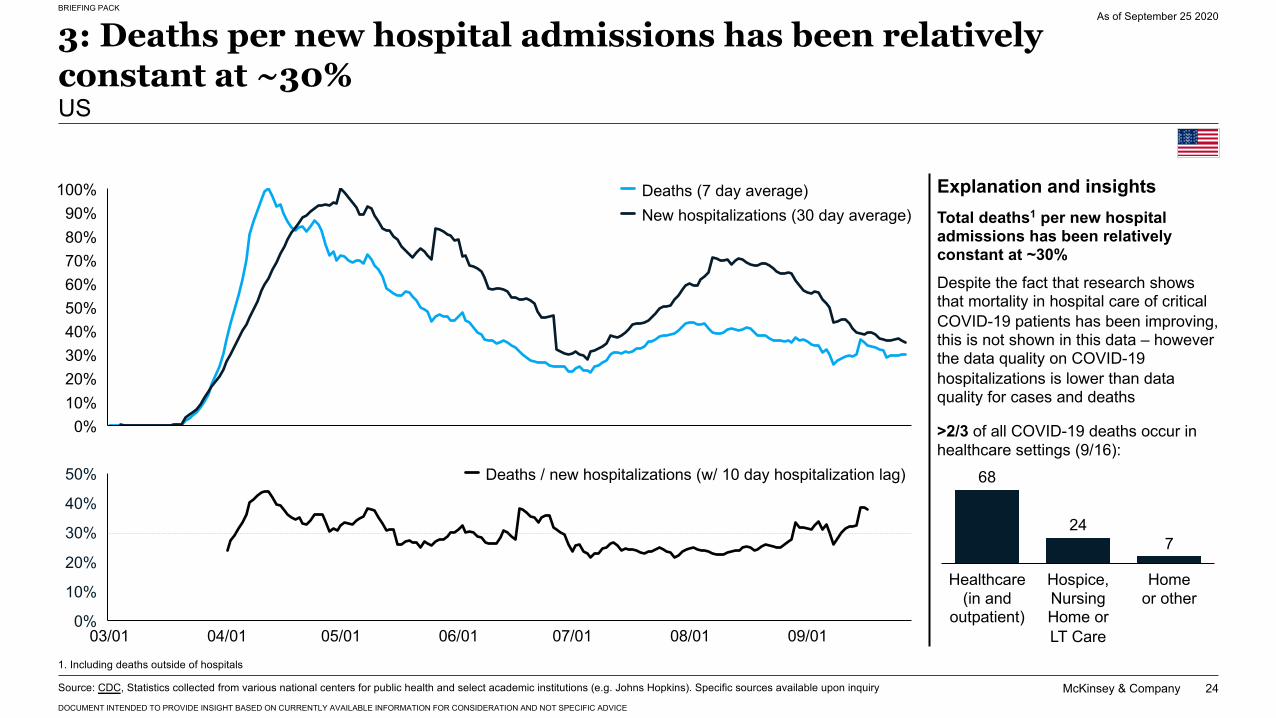
3: Deaths per new hospital admissions has been relatively constant at ~30% US
As of September 25 2020
10%0%
20%
60%
30%40%50%
70%80%90%
100% Deaths (7 day average)New hospitalizations (30 day average)
>2/3 of all COVID-19 deaths occur in healthcare settings (9/16):
68
247
Home or other
Hospice, Nursing Home or LT Care
Healthcare (in and
outpatient)0%
10%
20%
30%
50%
40%
03/01 04/01 05/01 06/01 07/01 08/01 09/01
Deaths / new hospitalizations (w/ 10 day hospitalization lag)
Explanation and insightsTotal deaths1 per new hospital admissions has been relatively constant at ~30% Despite the fact that research shows that mortality in hospital care of critical COVID-19 patients has been improving, this is not shown in this data – however the data quality on COVID-19 hospitalizations is lower than data quality for cases and deaths
Source: CDC, Statistics collected from various national centers for public health and select academic institutions (e.g. Johns Hopkins). Specific sources available upon inquiry
1. Including deaths outside of hospitals
McKinsey & Company 25
BRIEFING PACK
DOCUMENT INTENDED TO PROVIDE INSIGHT BASED ON CURRENTLY AVAILABLE INFORMATION FOR CONSIDERATION AND NOT SPECIFIC ADVICE
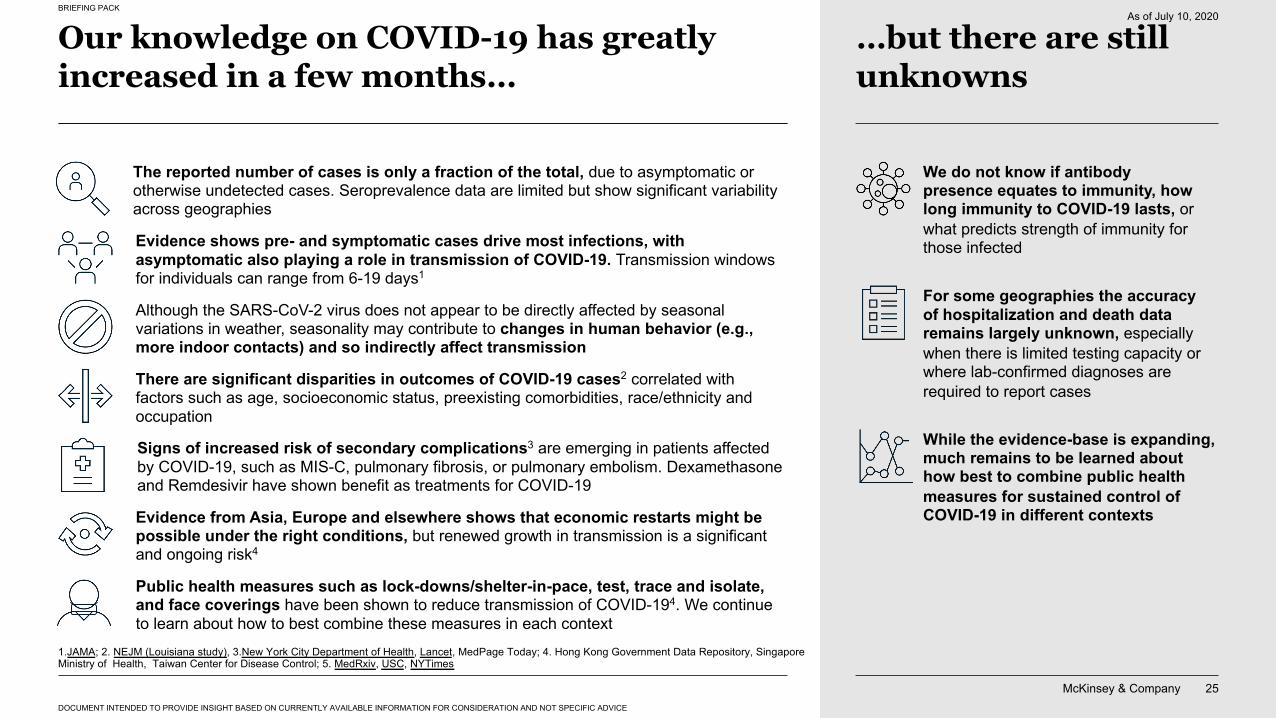
Our knowledge on COVID-19 has greatly increased in a few months…
…but there are still unknowns
Evidence shows pre- and symptomatic cases drive most infections, with asymptomatic also playing a role in transmission of COVID-19. Transmission windows for individuals can range from 6-19 days1
Although the SARS-CoV-2 virus does not appear to be directly affected by seasonal variations in weather, seasonality may contribute to changes in human behavior (e.g., more indoor contacts) and so indirectly affect transmission
There are significant disparities in outcomes of COVID-19 cases2 correlated with factors such as age, socioeconomic status, preexisting comorbidities, race/ethnicity and occupation
Evidence from Asia, Europe and elsewhere shows that economic restarts might be possible under the right conditions, but renewed growth in transmission is a significant and ongoing risk4
While the evidence-base is expanding, much remains to be learned about how best to combine public health measures for sustained control of COVID-19 in different contexts
We do not know if antibody presence equates to immunity, how long immunity to COVID-19 lasts, or what predicts strength of immunity for those infected
For some geographies the accuracy of hospitalization and death data remains largely unknown, especially when there is limited testing capacity or where lab-confirmed diagnoses are required to report cases
1.JAMA; 2. NEJM (Louisiana study), 3.New York City Department of Health, Lancet, MedPage Today; 4. Hong Kong Government Data Repository, Singapore Ministry of Health, Taiwan Center for Disease Control; 5. MedRxiv, USC, NYTimes
The reported number of cases is only a fraction of the total, due to asymptomatic or otherwise undetected cases. Seroprevalence data are limited but show significant variability across geographies
Signs of increased risk of secondary complications3 are emerging in patients affected by COVID-19, such as MIS-C, pulmonary fibrosis, or pulmonary embolism. Dexamethasone and Remdesivir have shown benefit as treatments for COVID-19
As of July 10, 2020
Public health measures such as lock-downs/shelter-in-pace, test, trace and isolate, and face coverings have been shown to reduce transmission of COVID-194. We continue to learn about how to best combine these measures in each context
McKinsey & Company
BRIEFING PACK
DOCUMENT INTENDED TO PROVIDE INSIGHT BASED ON CURRENTLY AVAILABLE INFORMATION FOR CONSIDERATION AND NOT SPECIFIC ADVICE
26
Contents Snapshot of the present: COVID-19 pandemic in numbers
Outlook: when the epidemic might functionally end
McKinsey & Company 26
McKinsey & Company
BRIEFING PACK
DOCUMENT INTENDED TO PROVIDE INSIGHT BASED ON CURRENTLY AVAILABLE INFORMATION FOR CONSIDERATION AND NOT SPECIFIC ADVICE
27
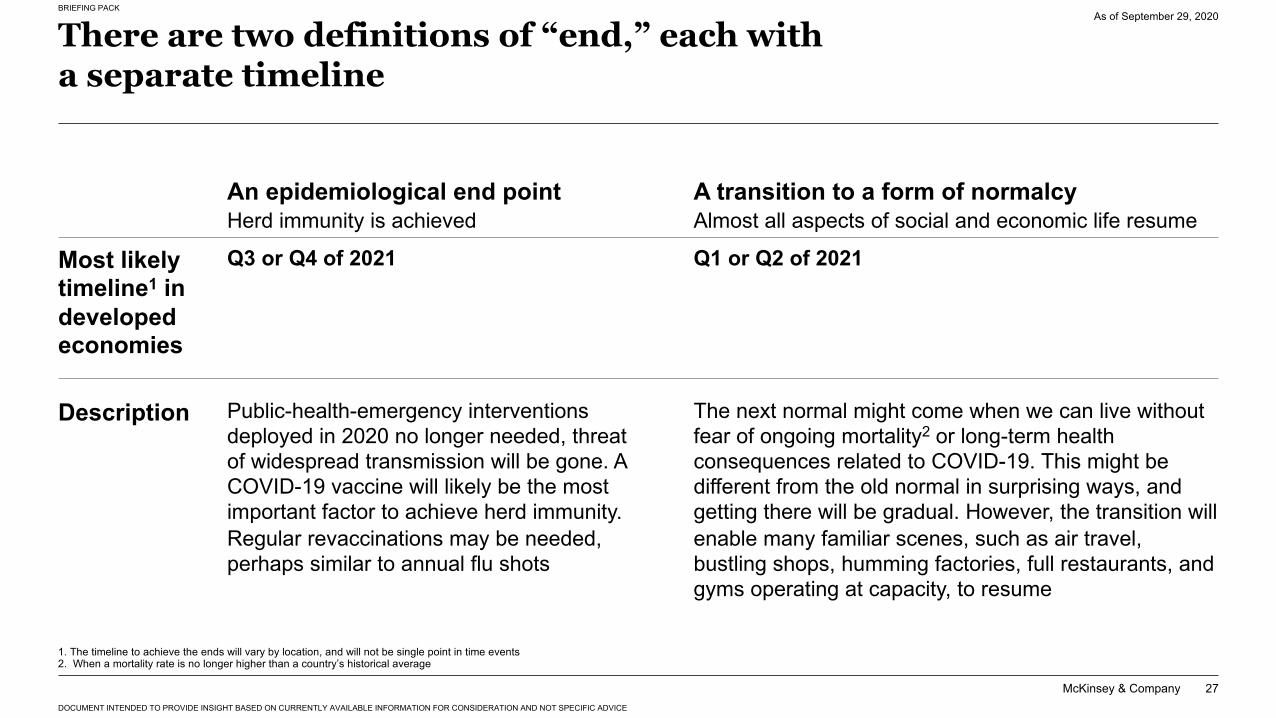
There are two definitions of “end,” each with a separate timeline
As of September 29, 2020
1. The timeline to achieve the ends will vary by location, and will not be single point in time events2. When a mortality rate is no longer higher than a country’s historical average
A transition to a form of normalcy Almost all aspects of social and economic life resume
An epidemiological end point Herd immunity is achieved
Most likely timeline1 in developed economies
Q1 or Q2 of 2021Q3 or Q4 of 2021
Description The next normal might come when we can live without fear of ongoing mortality2 or long-term health consequences related to COVID-19. This might be different from the old normal in surprising ways, and getting there will be gradual. However, the transition will enable many familiar scenes, such as air travel, bustling shops, humming factories, full restaurants, and gyms operating at capacity, to resume
Public-health-emergency interventions deployed in 2020 no longer needed, threat of widespread transmission will be gone. A COVID-19 vaccine will likely be the most important factor to achieve herd immunity. Regular revaccinations may be needed, perhaps similar to annual flu shots
McKinsey & Company
BRIEFING PACK
DOCUMENT INTENDED TO PROVIDE INSIGHT BASED ON CURRENTLY AVAILABLE INFORMATION FOR CONSIDERATION AND NOT SPECIFIC ADVICE
28
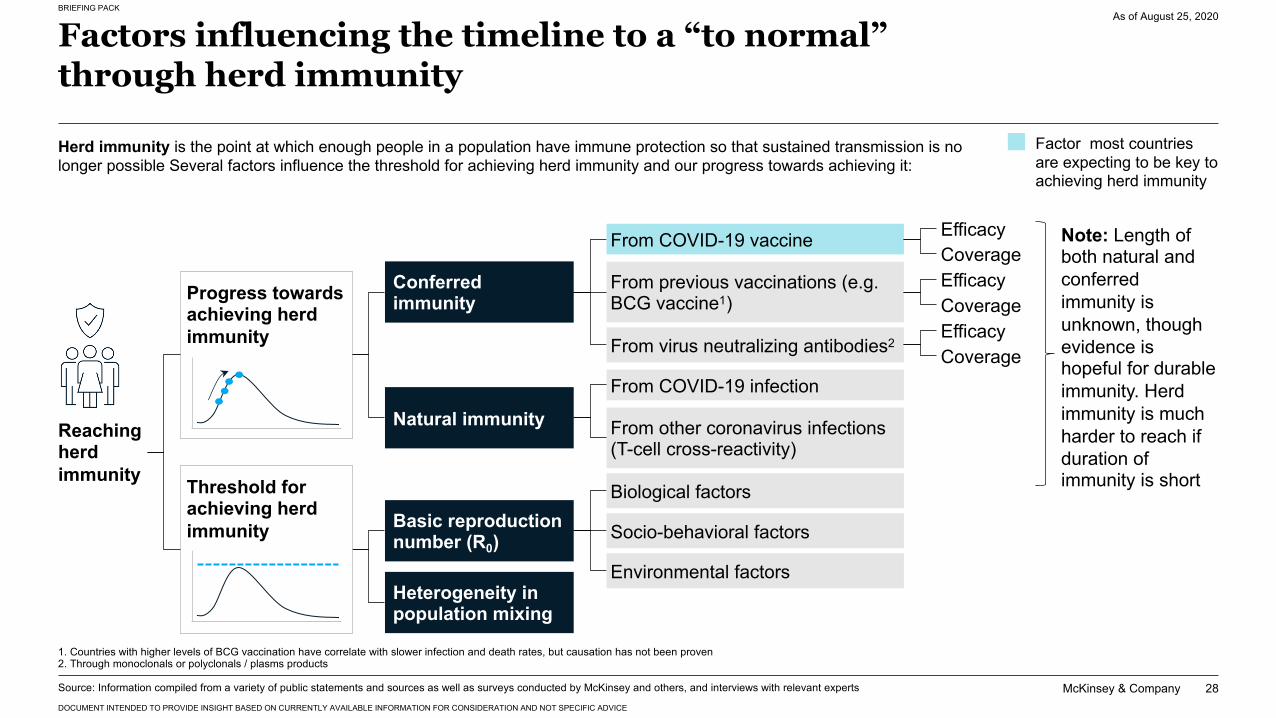
Factors influencing the timeline to a “to normal”through herd immunity
As of August 25, 2020
1. Countries with higher levels of BCG vaccination have correlate with slower infection and death rates, but causation has not been proven2. Through monoclonals or polyclonals / plasms products
Herd immunity is the point at which enough people in a population have immune protection so that sustained transmission is no longer possible Several factors influence the threshold for achieving herd immunity and our progress towards achieving it:
Note: Length of both natural and conferred immunity is unknown, though evidence is hopeful for durable immunity. Herd immunity is much harder to reach if duration of immunity is short
Reaching herd immunity Threshold for
achieving herd immunity
Progress towards achieving herd immunity
Heterogeneity in population mixing
Basic reproduction number (R0)
Conferred immunity
Natural immunity
From previous vaccinations (e.g. BCG vaccine1)
Socio-behavioral factors
Biological factors
Environmental factors
From virus neutralizing antibodies2
From COVID-19 vaccine
From other coronavirus infections (T-cell cross-reactivity)
From COVID-19 infection
EfficacyCoverage
EfficacyCoverage
EfficacyCoverage
Factor most countries are expecting to be key to achieving herd immunity
Source: Information compiled from a variety of public statements and sources as well as surveys conducted by McKinsey and others, and interviews with relevant experts
McKinsey & Company
BRIEFING PACK
DOCUMENT INTENDED TO PROVIDE INSIGHT BASED ON CURRENTLY AVAILABLE INFORMATION FOR CONSIDERATION AND NOT SPECIFIC ADVICE
29
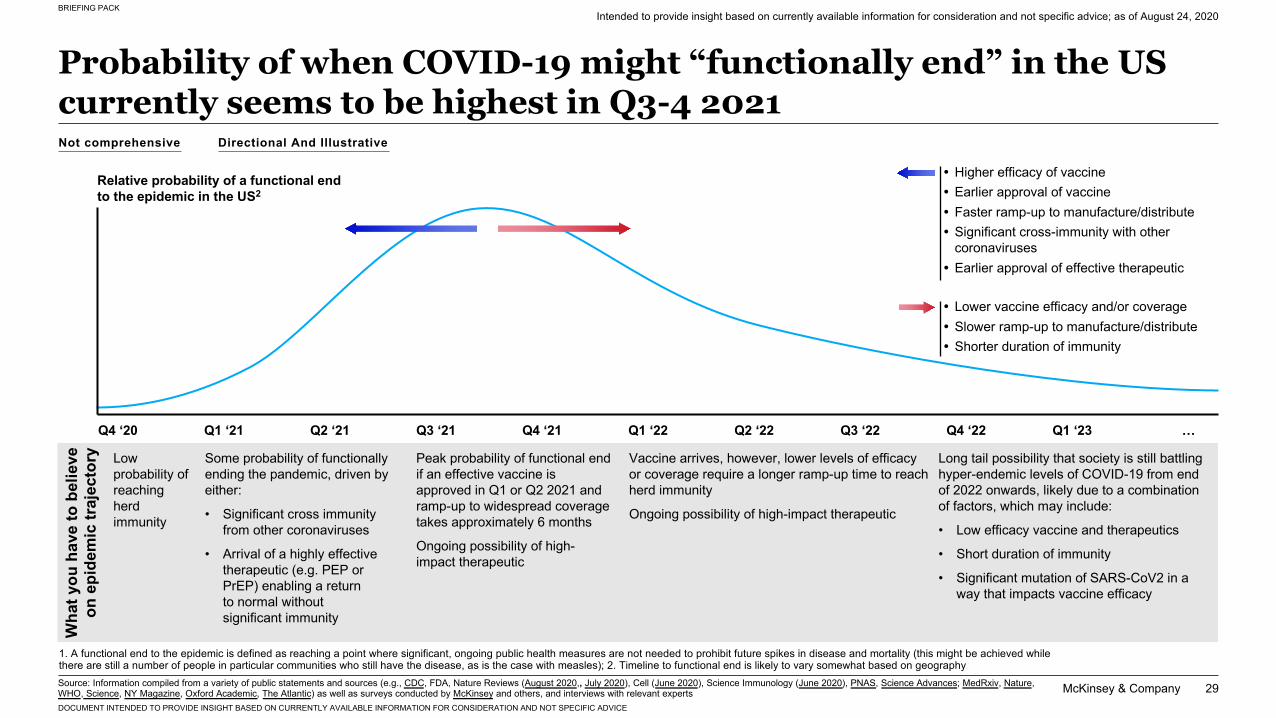
Probability of when COVID-19 might “functionally end” in the US currently seems to be highest in Q3-4 2021
Intended to provide insight based on currently available information for consideration and not specific advice; as of August 24, 2020
Relative probability of a functional end to the epidemic in the US2
Q4 ‘20 Q1 ‘21 Q2 ‘21 Q3 ‘21 Q4 ‘21 Q1 ‘22 Q2 ‘22 Q3 ‘22 Q4 ‘22 Q1 ‘23 …
Low probability of reaching herd immunity
Some probability of functionally ending the pandemic, driven by either:
• Significant cross immunity from other coronaviruses
• Arrival of a highly effective therapeutic (e.g. PEP or PrEP) enabling a return to normal without significant immunity
Peak probability of functional end if an effective vaccine is approved in Q1 or Q2 2021 and ramp-up to widespread coverage takes approximately 6 months
Ongoing possibility of high-impact therapeutic
Long tail possibility that society is still battling hyper-endemic levels of COVID-19 from end of 2022 onwards, likely due to a combination of factors, which may include:
• Low efficacy vaccine and therapeutics
• Short duration of immunity
• Significant mutation of SARS-CoV2 in a way that impacts vaccine efficacy
Vaccine arrives, however, lower levels of efficacy or coverage require a longer ramp-up time to reach herd immunity
Ongoing possibility of high-impact therapeutic
Wha
t you
hav
e to
bel
ieve
on
epi
dem
ic tr
ajec
tory
Source: Information compiled from a variety of public statements and sources (e.g., CDC, FDA, Nature Reviews (August 2020,, July 2020), Cell (June 2020), Science Immunology (June 2020), PNAS, Science Advances; MedRxiv, Nature, WHO, Science, NY Magazine, Oxford Academic, The Atlantic) as well as surveys conducted by McKinsey and others, and interviews with relevant experts
� Higher efficacy of vaccine� Earlier approval of vaccine� Faster ramp-up to manufacture/distribute� Significant cross-immunity with other
coronaviruses� Earlier approval of effective therapeutic
� Lower vaccine efficacy and/or coverage� Slower ramp-up to manufacture/distribute� Shorter duration of immunity
1. A functional end to the epidemic is defined as reaching a point where significant, ongoing public health measures are not needed to prohibit future spikes in disease and mortality (this might be achieved while there are still a number of people in particular communities who still have the disease, as is the case with measles); 2. Timeline to functional end is likely to vary somewhat based on geography
Not comprehensive Directional And Illustrative
McKinsey & Company
BRIEFING PACK
DOCUMENT INTENDED TO PROVIDE INSIGHT BASED ON CURRENTLY AVAILABLE INFORMATION FOR CONSIDERATION AND NOT SPECIFIC ADVICE
30
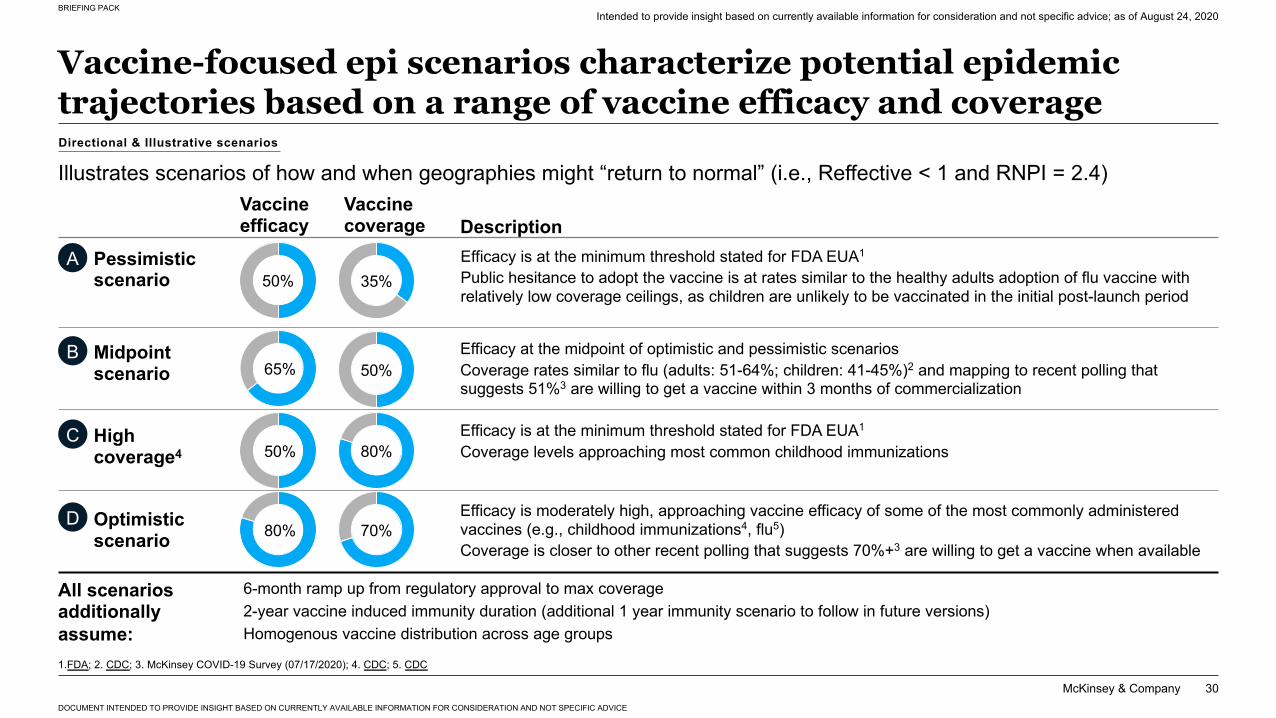
Vaccine-focused epi scenarios characterize potential epidemic trajectories based on a range of vaccine efficacy and coverage
Illustrates scenarios of how and when geographies might “return to normal” (i.e., Reffective < 1 and RNPI = 2.4)
Intended to provide insight based on currently available information for consideration and not specific advice; as of August 24, 2020
Pessimistic scenario
Midpoint scenario
Optimistic scenario
Vaccine efficacy
Vaccine coverage Description
Efficacy at the midpoint of optimistic and pessimistic scenariosCoverage rates similar to flu (adults: 51-64%; children: 41-45%)2 and mapping to recent polling that suggests 51%3 are willing to get a vaccine within 3 months of commercialization
Efficacy is at the minimum threshold stated for FDA EUA1
Public hesitance to adopt the vaccine is at rates similar to the healthy adults adoption of flu vaccine with relatively low coverage ceilings, as children are unlikely to be vaccinated in the initial post-launch period
Efficacy is at the minimum threshold stated for FDA EUA1
Coverage levels approaching most common childhood immunizations
6-month ramp up from regulatory approval to max coverage2-year vaccine induced immunity duration (additional 1 year immunity scenario to follow in future versions)Homogenous vaccine distribution across age groups
All scenarios additionally assume:
A
B
D Efficacy is moderately high, approaching vaccine efficacy of some of the most commonly administered vaccines (e.g., childhood immunizations4, flu5)Coverage is closer to other recent polling that suggests 70%+3 are willing to get a vaccine when available
High coverage4
C
1.FDA; 2. CDC; 3. McKinsey COVID-19 Survey (07/17/2020); 4. CDC; 5. CDC
65%
50%
35%
70%
50%
80%
80%
50%
Directional & Illustrative scenarios
McKinsey & Company
BRIEFING PACK
DOCUMENT INTENDED TO PROVIDE INSIGHT BASED ON CURRENTLY AVAILABLE INFORMATION FOR CONSIDERATION AND NOT SPECIFIC ADVICE
31
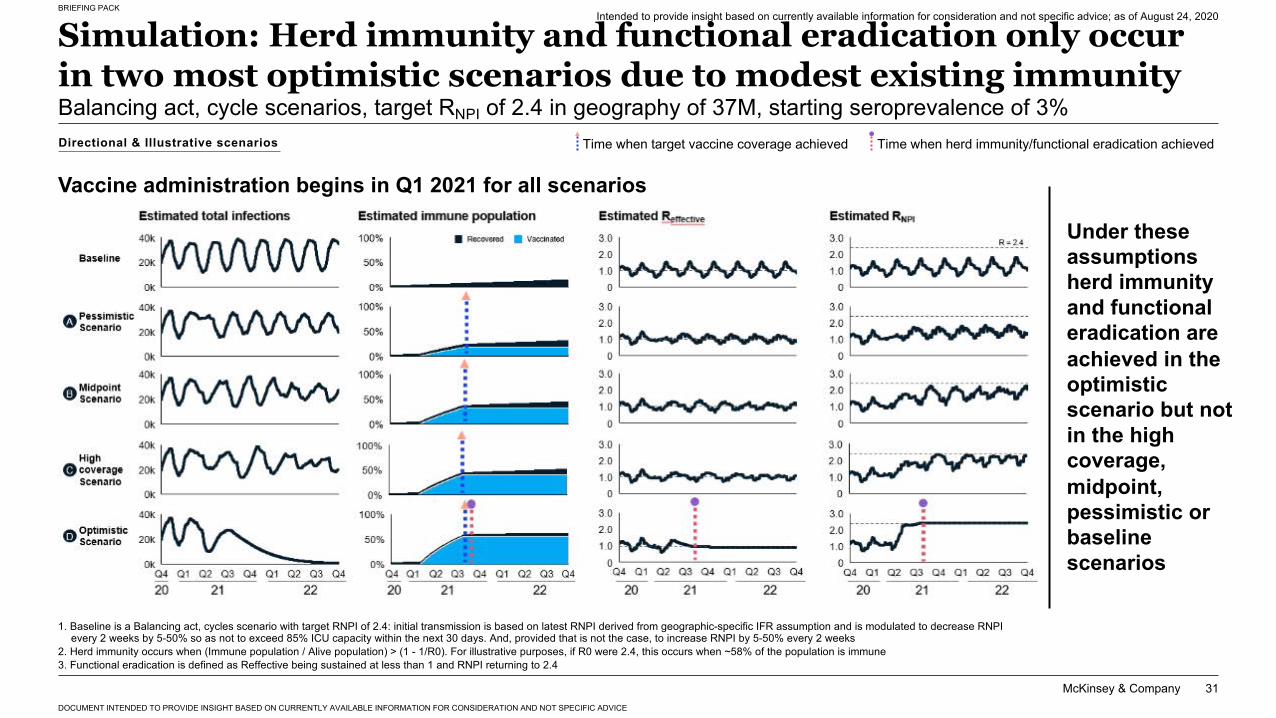
Simulation: Herd immunity and functional eradication only occur in two most optimistic scenarios due to modest existing immunityBalancing act, cycle scenarios, target RNPI of 2.4 in geography of 37M, starting seroprevalence of 3%
Intended to provide insight based on currently available information for consideration and not specific advice; as of August 24, 2020
1. Baseline is a Balancing act, cycles scenario with target RNPI of 2.4: initial transmission is based on latest RNPI derived from geographic-specific IFR assumption and is modulated to decrease RNPI every 2 weeks by 5-50% so as not to exceed 85% ICU capacity within the next 30 days. And, provided that is not the case, to increase RNPI by 5-50% every 2 weeks
2. Herd immunity occurs when (Immune population / Alive population) > (1 - 1/R0). For illustrative purposes, if R0 were 2.4, this occurs when ~58% of the population is immune3. Functional eradication is defined as Reffective being sustained at less than 1 and RNPI returning to 2.4
Under these assumptions herd immunity and functional eradication are achieved in the optimistic scenario but not in the high coverage, midpoint, pessimistic or baseline scenarios
Time when herd immunity/functional eradication achieved
Vaccine administration begins in Q1 2021 for all scenarios
Time when target vaccine coverage achievedDirectional & Illustrative scenarios
McKinsey & Company
BRIEFING PACK
DOCUMENT INTENDED TO PROVIDE INSIGHT BASED ON CURRENTLY AVAILABLE INFORMATION FOR CONSIDERATION AND NOT SPECIFIC ADVICE
32
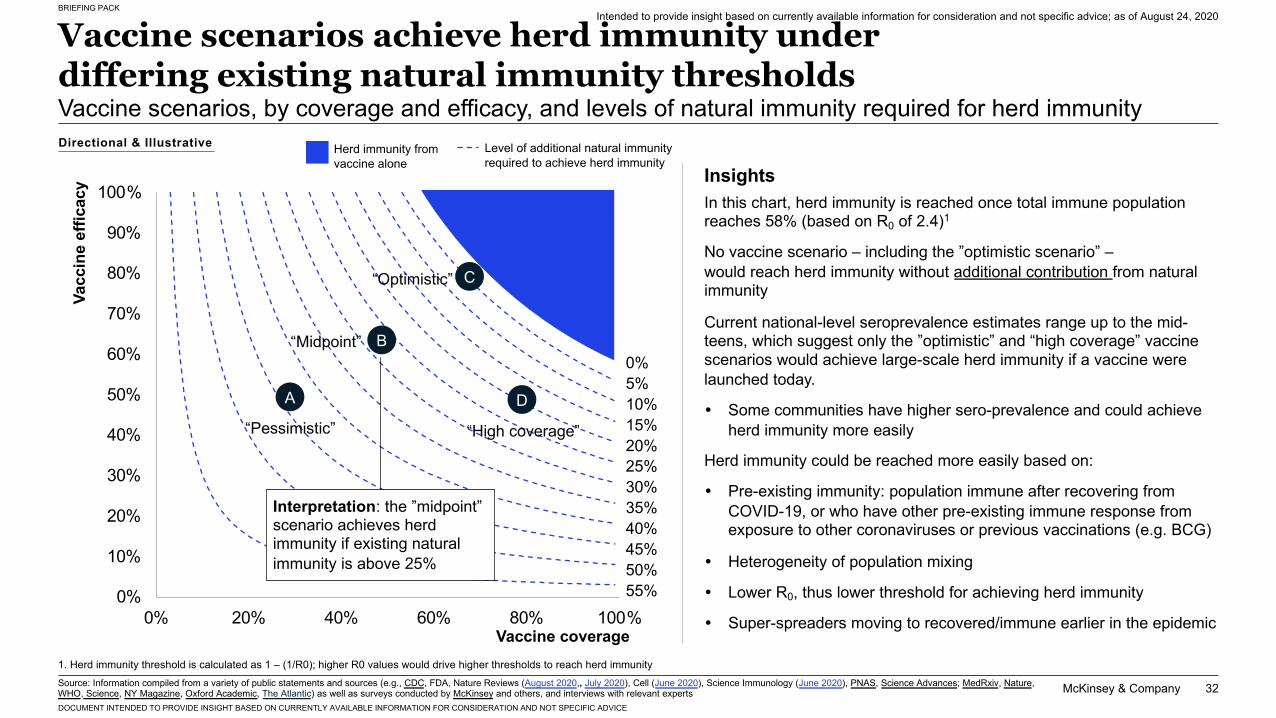
Vaccine scenarios achieve herd immunity under differing existing natural immunity thresholdsVaccine scenarios, by coverage and efficacy, and levels of natural immunity required for herd immunity
InsightsIn this chart, herd immunity is reached once total immune population reaches 58% (based on R0 of 2.4)1
No vaccine scenario – including the ”optimistic scenario” –would reach herd immunity without additional contribution from natural immunity
Current national-level seroprevalence estimates range up to the mid-teens, which suggest only the ”optimistic” and “high coverage” vaccine scenarios would achieve large-scale herd immunity if a vaccine were launched today.
� Some communities have higher sero-prevalence and could achieve herd immunity more easily
Herd immunity could be reached more easily based on:
� Pre-existing immunity: population immune after recovering from COVID-19, or who have other pre-existing immune response from exposure to other coronaviruses or previous vaccinations (e.g. BCG)
� Heterogeneity of population mixing
� Lower R0, thus lower threshold for achieving herd immunity
� Super-spreaders moving to recovered/immune earlier in the epidemic0%
10%
20%
30%
40%
50%
60%
70%
80%
90%
100%
0% 20% 40% 60% 80% 100%
0%5%10%15%20%25%30%35%40%45%50%55%
Vaccine coverage
Vacc
ine
effic
acy
A
B
D
“Midpoint”
“Pessimistic” “High coverage”
C“Optimistic”
Interpretation: the ”midpoint” scenario achieves herd immunity if existing natural immunity is above 25%
Level of additional natural immunity required to achieve herd immunity
Herd immunity from vaccine alone
Source: Information compiled from a variety of public statements and sources (e.g., CDC, FDA, Nature Reviews (August 2020,, July 2020), Cell (June 2020), Science Immunology (June 2020), PNAS, Science Advances; MedRxiv, Nature, WHO, Science, NY Magazine, Oxford Academic, The Atlantic) as well as surveys conducted by McKinsey and others, and interviews with relevant experts
1. Herd immunity threshold is calculated as 1 – (1/R0); higher R0 values would drive higher thresholds to reach herd immunity
Directional & Illustrative
Intended to provide insight based on currently available information for consideration and not specific advice; as of August 24, 2020
McKinsey & Company
BRIEFING PACK
DOCUMENT INTENDED TO PROVIDE INSIGHT BASED ON CURRENTLY AVAILABLE INFORMATION FOR CONSIDERATION AND NOT SPECIFIC ADVICE
33
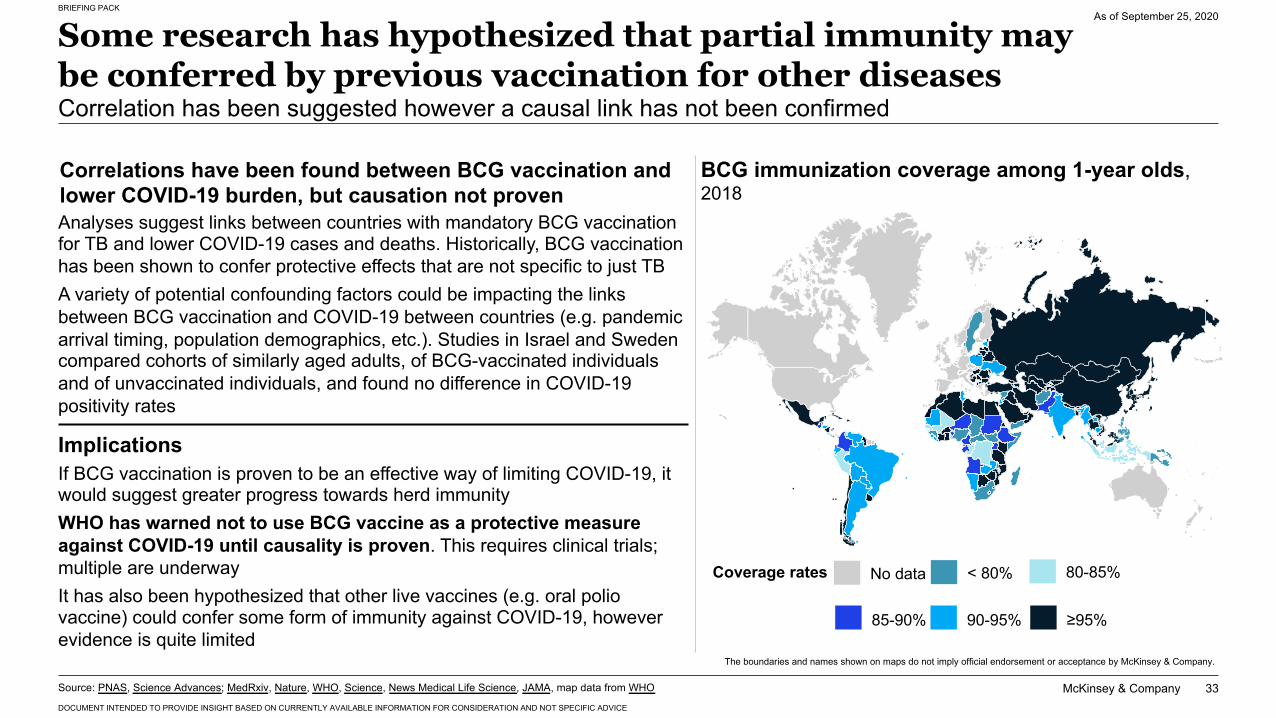
Some research has hypothesized that partial immunity may be conferred by previous vaccination for other diseasesCorrelation has been suggested however a causal link has not been confirmed
As of September 25, 2020
Source: PNAS, Science Advances; MedRxiv, Nature, WHO, Science, News Medical Life Science, JAMA, map data from WHO
< 80%Coverage rates
BCG immunization coverage among 1-year olds, 2018
No data 80-85%
85-90% 90-95% ≥95%
Analyses suggest links between countries with mandatory BCG vaccination for TB and lower COVID-19 cases and deaths. Historically, BCG vaccination has been shown to confer protective effects that are not specific to just TBA variety of potential confounding factors could be impacting the links between BCG vaccination and COVID-19 between countries (e.g. pandemic arrival timing, population demographics, etc.). Studies in Israel and Sweden compared cohorts of similarly aged adults, of BCG-vaccinated individuals and of unvaccinated individuals, and found no difference in COVID-19 positivity rates
Implications
Correlations have been found between BCG vaccination and lower COVID-19 burden, but causation not proven
If BCG vaccination is proven to be an effective way of limiting COVID-19, it would suggest greater progress towards herd immunityWHO has warned not to use BCG vaccine as a protective measure against COVID-19 until causality is proven. This requires clinical trials; multiple are underwayIt has also been hypothesized that other live vaccines (e.g. oral polio vaccine) could confer some form of immunity against COVID-19, however evidence is quite limited
The boundaries and names shown on maps do not imply official endorsement or acceptance by McKinsey & Company.
McKinsey & Company 34
BRIEFING PACK
DOCUMENT INTENDED TO PROVIDE INSIGHT BASED ON CURRENTLY AVAILABLE INFORMATION FOR CONSIDERATION AND NOT SPECIFIC ADVICE
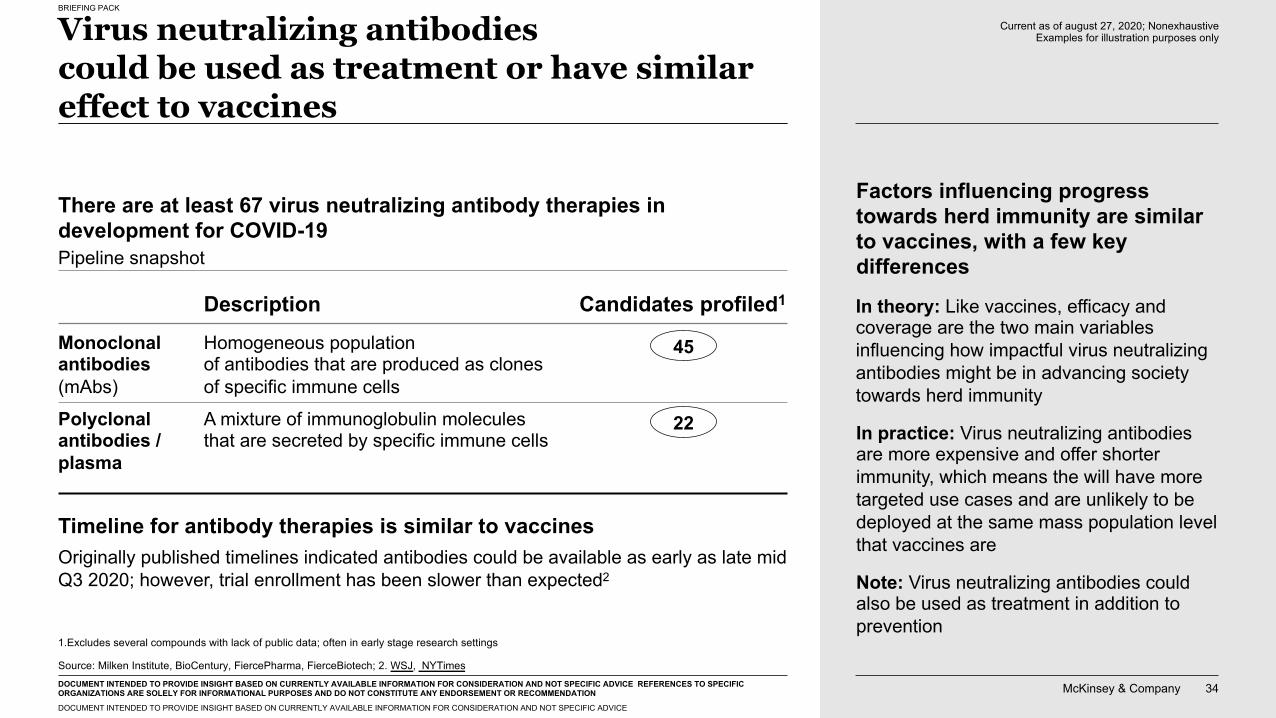
Virus neutralizing antibodies could be used as treatment or have similar effect to vaccines
There are at least 67 virus neutralizing antibody therapies in development for COVID-19
Timeline for antibody therapies is similar to vaccinesOriginally published timelines indicated antibodies could be available as early as late mid Q3 2020; however, trial enrollment has been slower than expected2
Source: Milken Institute, BioCentury, FiercePharma, FierceBiotech; 2. WSJ, NYTimes
1.Excludes several compounds with lack of public data; often in early stage research settings
Current as of august 27, 2020; Nonexhaustive Examples for illustration purposes only
DOCUMENT INTENDED TO PROVIDE INSIGHT BASED ON CURRENTLY AVAILABLE INFORMATION FOR CONSIDERATION AND NOT SPECIFIC ADVICE REFERENCES TO SPECIFIC ORGANIZATIONS ARE SOLELY FOR INFORMATIONAL PURPOSES AND DO NOT CONSTITUTE ANY ENDORSEMENT OR RECOMMENDATION
Factors influencing progress towards herd immunity are similar to vaccines, with a few key differencesPipeline snapshot
Description Candidates profiled1
Polyclonalantibodies / plasma
A mixture of immunoglobulin molecules that are secreted by specific immune cells
22
Monoclonalantibodies (mAbs)
Homogeneous population of antibodies that are produced as clones of specific immune cells
45
In theory: Like vaccines, efficacy and coverage are the two main variables influencing how impactful virus neutralizing antibodies might be in advancing society towards herd immunity
In practice: Virus neutralizing antibodies are more expensive and offer shorter immunity, which means the will have more targeted use cases and are unlikely to be deployed at the same mass population level that vaccines are
Note: Virus neutralizing antibodies could also be used as treatment in addition to prevention
McKinsey & Company 35
BRIEFING PACK
DOCUMENT INTENDED TO PROVIDE INSIGHT BASED ON CURRENTLY AVAILABLE INFORMATION FOR CONSIDERATION AND NOT SPECIFIC ADVICE
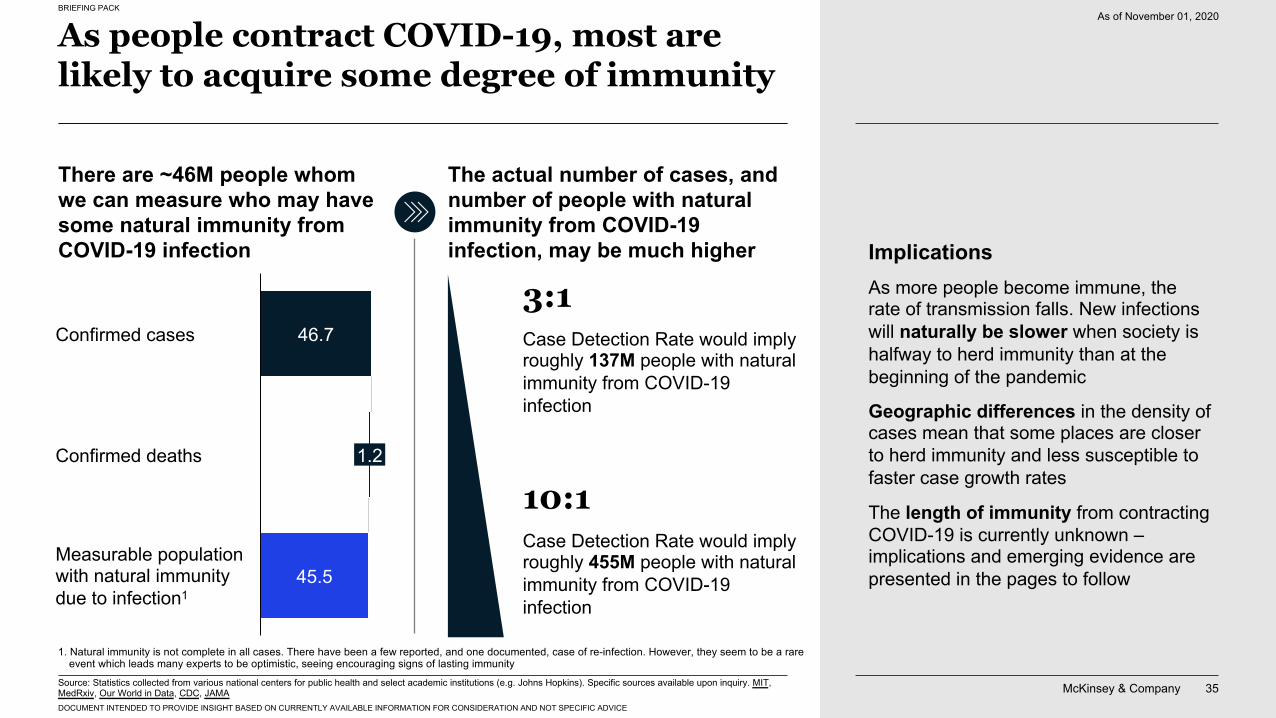
As people contract COVID-19, most are likely to acquire some degree of immunity
As of November 01, 2020
Confirmed deaths
Confirmed cases
Measurable population with natural immunity due to infection1
46.7
1.2
45.5
There are ~46M people whom we can measure who may have some natural immunity from COVID-19 infection
The actual number of cases, and number of people with natural immunity from COVID-19 infection, may be much higher
10:1Case Detection Rate would imply roughly 455M people with natural immunity from COVID-19 infection
3:1Case Detection Rate would imply roughly 137M people with natural immunity from COVID-19 infection
ImplicationsAs more people become immune, the rate of transmission falls. New infections will naturally be slower when society is halfway to herd immunity than at the beginning of the pandemic
Geographic differences in the density of cases mean that some places are closer to herd immunity and less susceptible to faster case growth rates
The length of immunity from contracting COVID-19 is currently unknown –implications and emerging evidence are presented in the pages to follow
Source: Statistics collected from various national centers for public health and select academic institutions (e.g. Johns Hopkins). Specific sources available upon inquiry. MIT, MedRxiv, Our World in Data, CDC, JAMA
1. Natural immunity is not complete in all cases. There have been a few reported, and one documented, case of re-infection. However, they seem to be a rare event which leads many experts to be optimistic, seeing encouraging signs of lasting immunity
McKinsey & Company
BRIEFING PACK
DOCUMENT INTENDED TO PROVIDE INSIGHT BASED ON CURRENTLY AVAILABLE INFORMATION FOR CONSIDERATION AND NOT SPECIFIC ADVICE
36
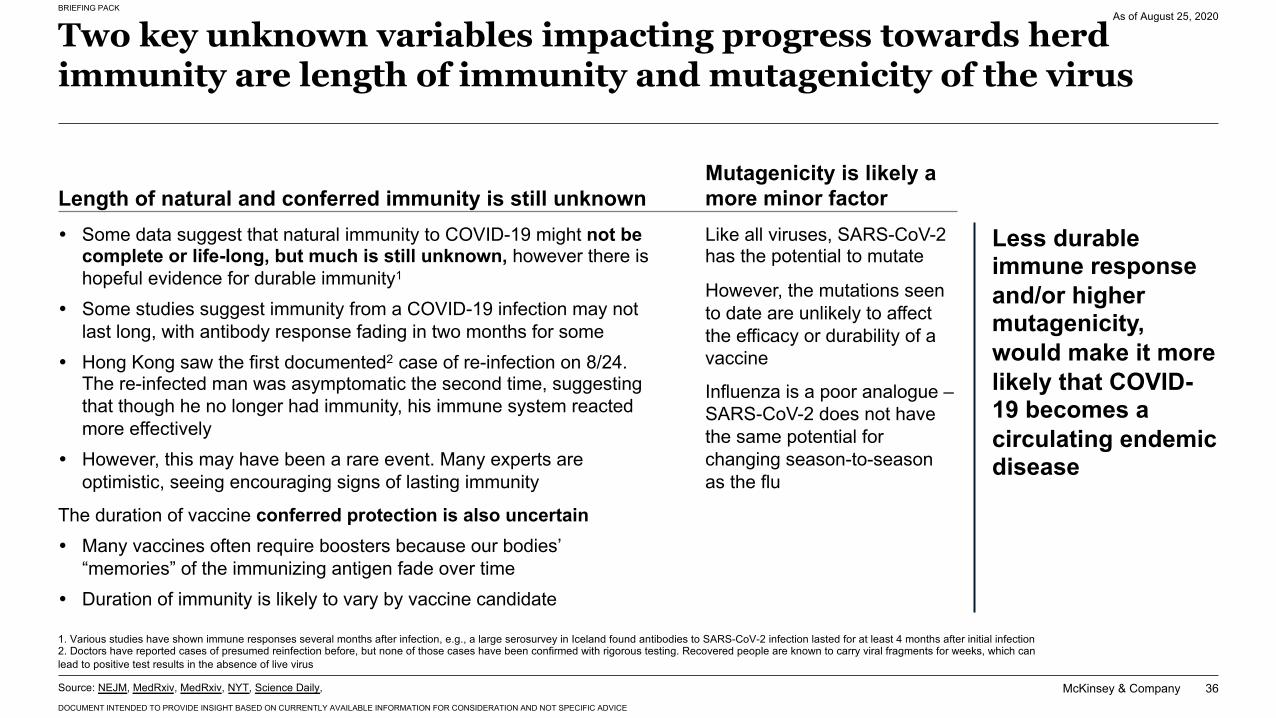
Two key unknown variables impacting progress towards herd immunity are length of immunity and mutagenicity of the virus
1. Various studies have shown immune responses several months after infection, e.g., a large serosurvey in Iceland found antibodies to SARS-CoV-2 infection lasted for at least 4 months after initial infection 2. Doctors have reported cases of presumed reinfection before, but none of those cases have been confirmed with rigorous testing. Recovered people are known to carry viral fragments for weeks, which can lead to positive test results in the absence of live virus
As of August 25, 2020
Like all viruses, SARS-CoV-2 has the potential to mutate
However, the mutations seen to date are unlikely to affect the efficacy or durability of a vaccine
Influenza is a poor analogue –SARS-CoV-2 does not have the same potential for changing season-to-season as the flu
� Some data suggest that natural immunity to COVID-19 might not be complete or life-long, but much is still unknown, however there is hopeful evidence for durable immunity1
� Some studies suggest immunity from a COVID-19 infection may not last long, with antibody response fading in two months for some
� Hong Kong saw the first documented2 case of re-infection on 8/24. The re-infected man was asymptomatic the second time, suggesting that though he no longer had immunity, his immune system reacted more effectively
� However, this may have been a rare event. Many experts are optimistic, seeing encouraging signs of lasting immunity
The duration of vaccine conferred protection is also uncertain� Many vaccines often require boosters because our bodies’
“memories” of the immunizing antigen fade over time� Duration of immunity is likely to vary by vaccine candidate
Less durable immune response and/or higher mutagenicity, would make it more likely that COVID-19 becomes a circulating endemic disease
Mutagenicity is likely a more minor factorLength of natural and conferred immunity is still unknown
Source: NEJM, MedRxiv, MedRxiv, NYT, Science Daily,
McKinsey & Company
BRIEFING PACK
DOCUMENT INTENDED TO PROVIDE INSIGHT BASED ON CURRENTLY AVAILABLE INFORMATION FOR CONSIDERATION AND NOT SPECIFIC ADVICE
37
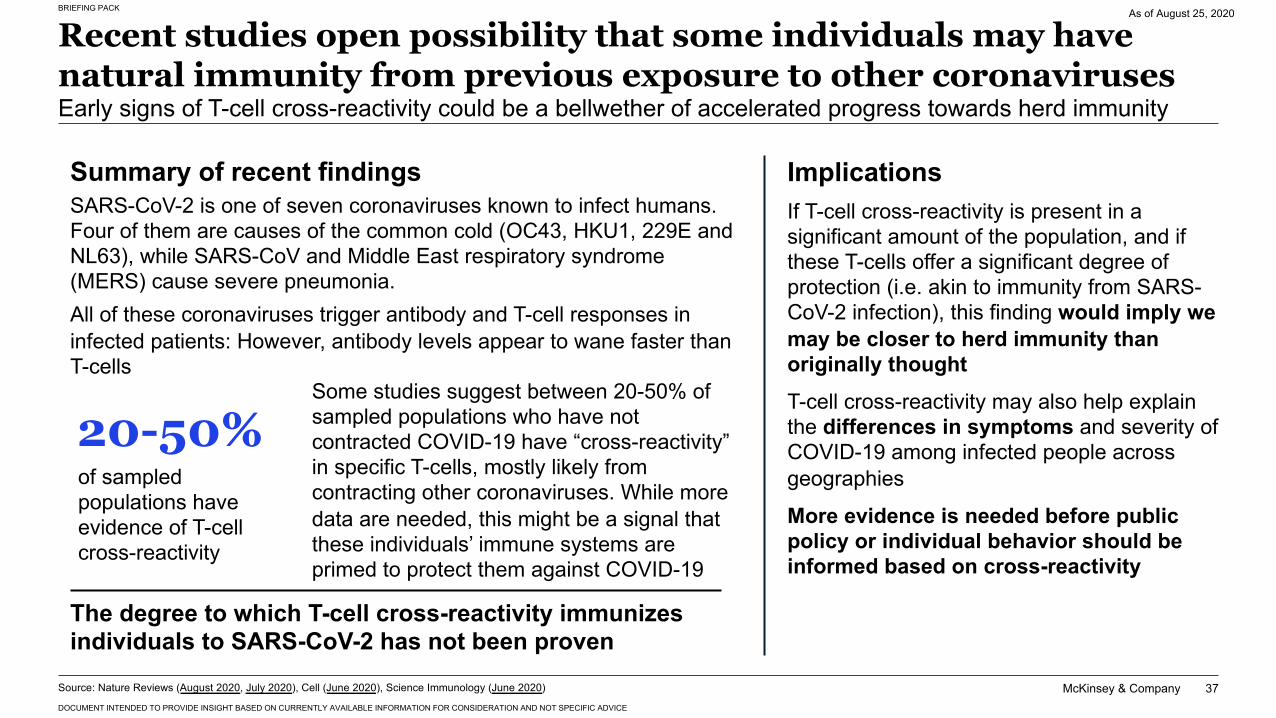
Recent studies open possibility that some individuals may have natural immunity from previous exposure to other coronavirusesEarly signs of T-cell cross-reactivity could be a bellwether of accelerated progress towards herd immunity
ImplicationsIf T-cell cross-reactivity is present in a significant amount of the population, and if these T-cells offer a significant degree of protection (i.e. akin to immunity from SARS-CoV-2 infection), this finding would imply we may be closer to herd immunity than originally thought T-cell cross-reactivity may also help explain the differences in symptoms and severity of COVID-19 among infected people across geographies
More evidence is needed before public policy or individual behavior should be informed based on cross-reactivity
Some studies suggest between 20-50% of sampled populations who have not contracted COVID-19 have “cross-reactivity” in specific T-cells, mostly likely from contracting other coronaviruses. While more data are needed, this might be a signal that these individuals’ immune systems are primed to protect them against COVID-19
SARS-CoV-2 is one of seven coronaviruses known to infect humans. Four of them are causes of the common cold (OC43, HKU1, 229E and NL63), while SARS-CoV and Middle East respiratory syndrome (MERS) cause severe pneumonia. All of these coronaviruses trigger antibody and T-cell responses in infected patients: However, antibody levels appear to wane faster than T-cells
Summary of recent findings
The degree to which T-cell cross-reactivity immunizes individuals to SARS-CoV-2 has not been proven
20-50%of sampled populations have evidence of T-cell cross-reactivity
Source: Nature Reviews (August 2020, July 2020), Cell (June 2020), Science Immunology (June 2020)
As of August 25, 2020
McKinsey & Company
BRIEFING PACK
DOCUMENT INTENDED TO PROVIDE INSIGHT BASED ON CURRENTLY AVAILABLE INFORMATION FOR CONSIDERATION AND NOT SPECIFIC ADVICE
38
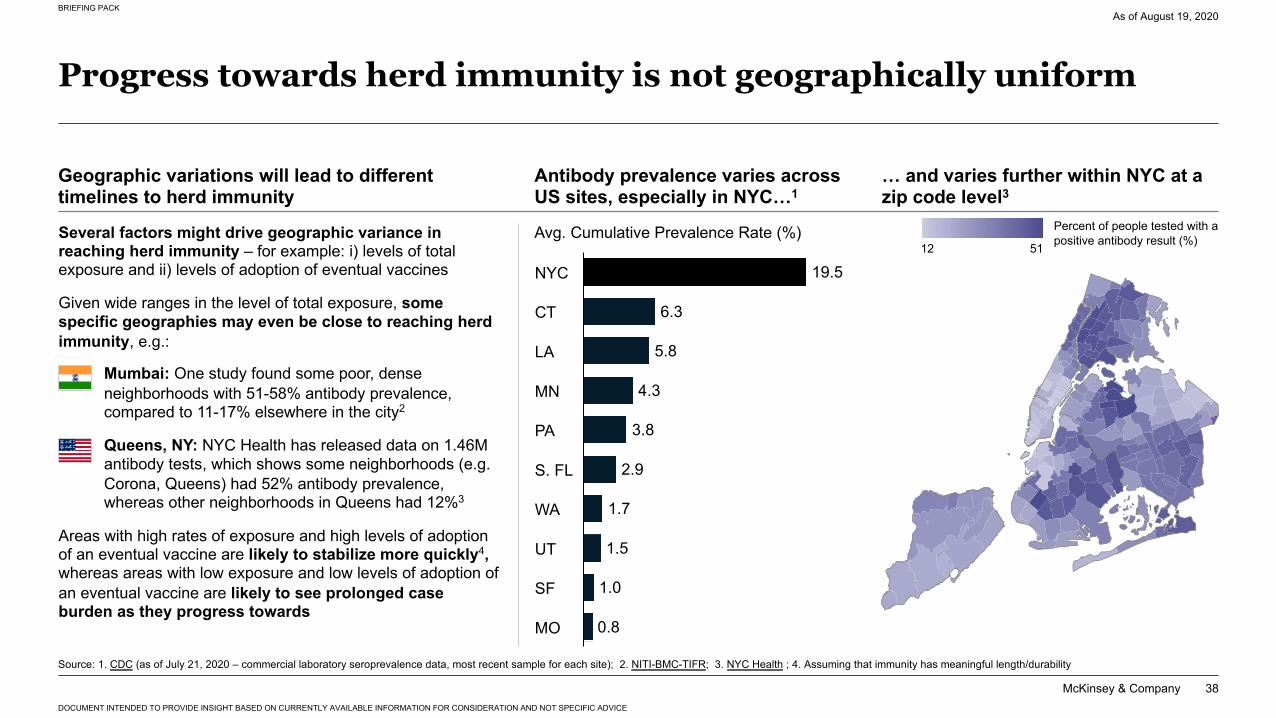
Progress towards herd immunity is not geographically uniform
As of August 19, 2020
Geographic variations will lead to different timelines to herd immunity
Several factors might drive geographic variance in reaching herd immunity – for example: i) levels of total exposure and ii) levels of adoption of eventual vaccines
Given wide ranges in the level of total exposure, some specific geographies may even be close to reaching herd immunity, e.g.:
• Mumbai: One study found some poor, dense neighborhoods with 51-58% antibody prevalence, compared to 11-17% elsewhere in the city2
• Queens, NY: NYC Health has released data on 1.46M antibody tests, which shows some neighborhoods (e.g. Corona, Queens) had 52% antibody prevalence, whereas other neighborhoods in Queens had 12%3
Areas with high rates of exposure and high levels of adoption of an eventual vaccine are likely to stabilize more quickly4, whereas areas with low exposure and low levels of adoption of an eventual vaccine are likely to see prolonged case burden as they progress towards
Source: 1. CDC (as of July 21, 2020 – commercial laboratory seroprevalence data, most recent sample for each site); 2. NITI-BMC-TIFR; 3. NYC Health ; 4. Assuming that immunity has meaningful length/durability
… and varies further within NYC at a zip code level3
Antibody prevalence varies across US sites, especially in NYC…1
19.5
6.3
5.8
4.3
3.8
2.9
1.7
1.5
1.0
0.8
WA
PA
NYC
MN
CT
S. FL
LA
UT
SF
MO
Avg. Cumulative Prevalence Rate (%)12 51
Percent of people tested with a positive antibody result (%)
McKinsey & Company
BRIEFING PACK
DOCUMENT INTENDED TO PROVIDE INSIGHT BASED ON CURRENTLY AVAILABLE INFORMATION FOR CONSIDERATION AND NOT SPECIFIC ADVICE
39
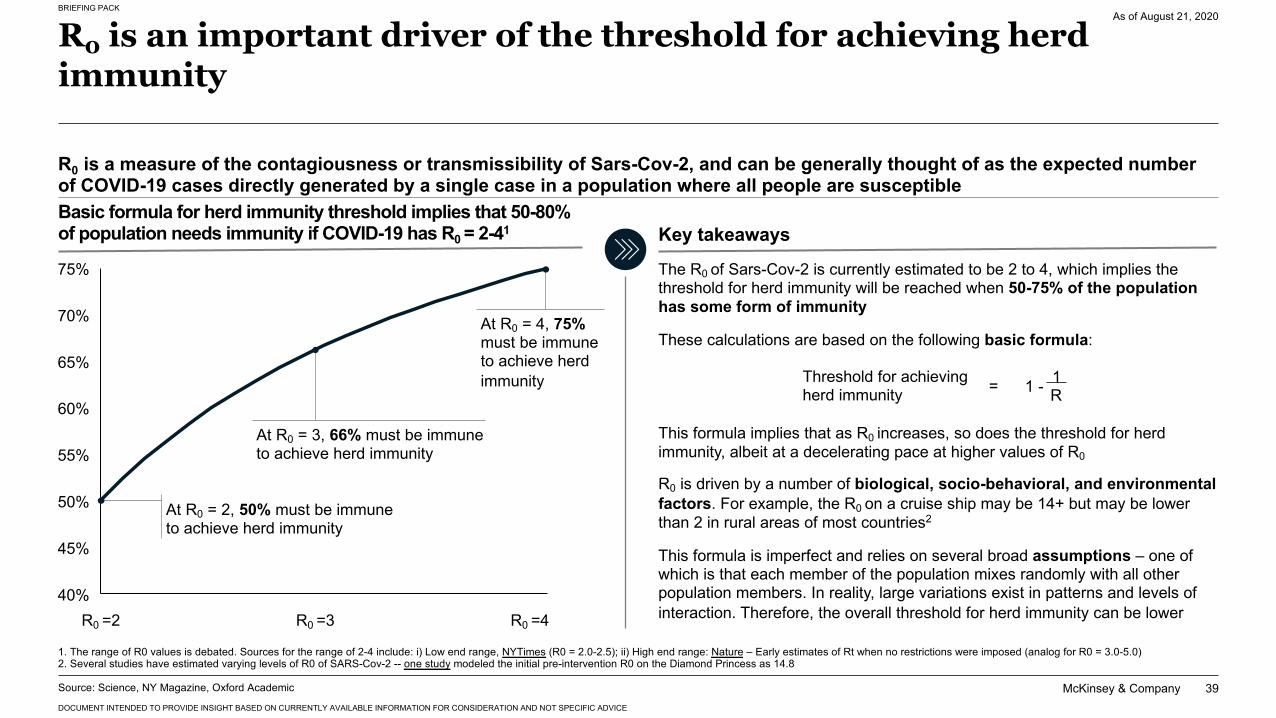
R0 is an important driver of the threshold for achieving herd immunity
As of August 21, 2020
1. The range of R0 values is debated. Sources for the range of 2-4 include: i) Low end range, NYTimes (R0 = 2.0-2.5); ii) High end range: Nature – Early estimates of Rt when no restrictions were imposed (analog for R0 = 3.0-5.0)2. Several studies have estimated varying levels of R0 of SARS-Cov-2 -- one study modeled the initial pre-intervention R0 on the Diamond Princess as 14.8
Basic formula for herd immunity threshold implies that 50-80% of population needs immunity if COVID-19 has R0 = 2-41
70%
60%
55%
45%
75%
40%
50%
65%
R0 is a measure of the contagiousness or transmissibility of Sars-Cov-2, and can be generally thought of as the expected number of COVID-19 cases directly generated by a single case in a population where all people are susceptible
1 - 1R
Threshold for achieving herd immunity =
Key takeaways
The R0 of Sars-Cov-2 is currently estimated to be 2 to 4, which implies the threshold for herd immunity will be reached when 50-75% of the population has some form of immunity
These calculations are based on the following basic formula:
This formula implies that as R0 increases, so does the threshold for herd immunity, albeit at a decelerating pace at higher values of R0
R0 is driven by a number of biological, socio-behavioral, and environmental factors. For example, the R0 on a cruise ship may be 14+ but may be lower than 2 in rural areas of most countries2
This formula is imperfect and relies on several broad assumptions – one of which is that each member of the population mixes randomly with all other population members. In reality, large variations exist in patterns and levels of interaction. Therefore, the overall threshold for herd immunity can be lower
At R0 = 3, 66% must be immune to achieve herd immunity
At R0 = 4, 75%must be immune to achieve herd immunity
At R0 = 2, 50% must be immune to achieve herd immunity
R0 =2 R0 =3 R0 =4
Source: Science, NY Magazine, Oxford Academic
McKinsey & Company 40
BRIEFING PACK
DOCUMENT INTENDED TO PROVIDE INSIGHT BASED ON CURRENTLY AVAILABLE INFORMATION FOR CONSIDERATION AND NOT SPECIFIC ADVICE
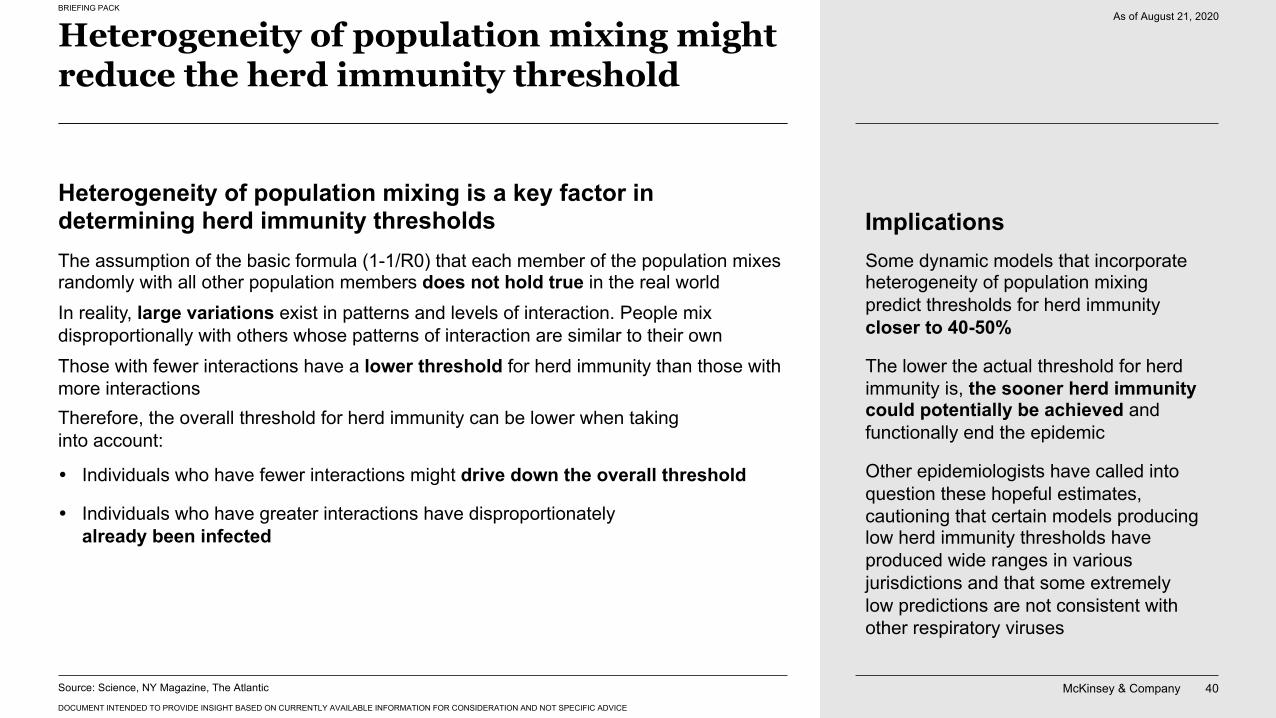
Heterogeneity of population mixing might reduce the herd immunity threshold
As of August 21, 2020
Heterogeneity of population mixing is a key factor in determining herd immunity thresholds Implications
Some dynamic models that incorporate heterogeneity of population mixing predict thresholds for herd immunity closer to 40-50%
The lower the actual threshold for herd immunity is, the sooner herd immunity could potentially be achieved and functionally end the epidemic
Other epidemiologists have called into question these hopeful estimates, cautioning that certain models producing low herd immunity thresholds have produced wide ranges in various jurisdictions and that some extremely low predictions are not consistent with other respiratory viruses
The assumption of the basic formula (1-1/R0) that each member of the population mixes randomly with all other population members does not hold true in the real worldIn reality, large variations exist in patterns and levels of interaction. People mix disproportionally with others whose patterns of interaction are similar to their ownThose with fewer interactions have a lower threshold for herd immunity than those with more interactionsTherefore, the overall threshold for herd immunity can be lower when taking into account:
� Individuals who have fewer interactions might drive down the overall threshold
� Individuals who have greater interactions have disproportionately already been infected
Source: Science, NY Magazine, The Atlantic
McKinsey & Company
BRIEFING PACK
DOCUMENT INTENDED TO PROVIDE INSIGHT BASED ON CURRENTLY AVAILABLE INFORMATION FOR CONSIDERATION AND NOT SPECIFIC ADVICE
41
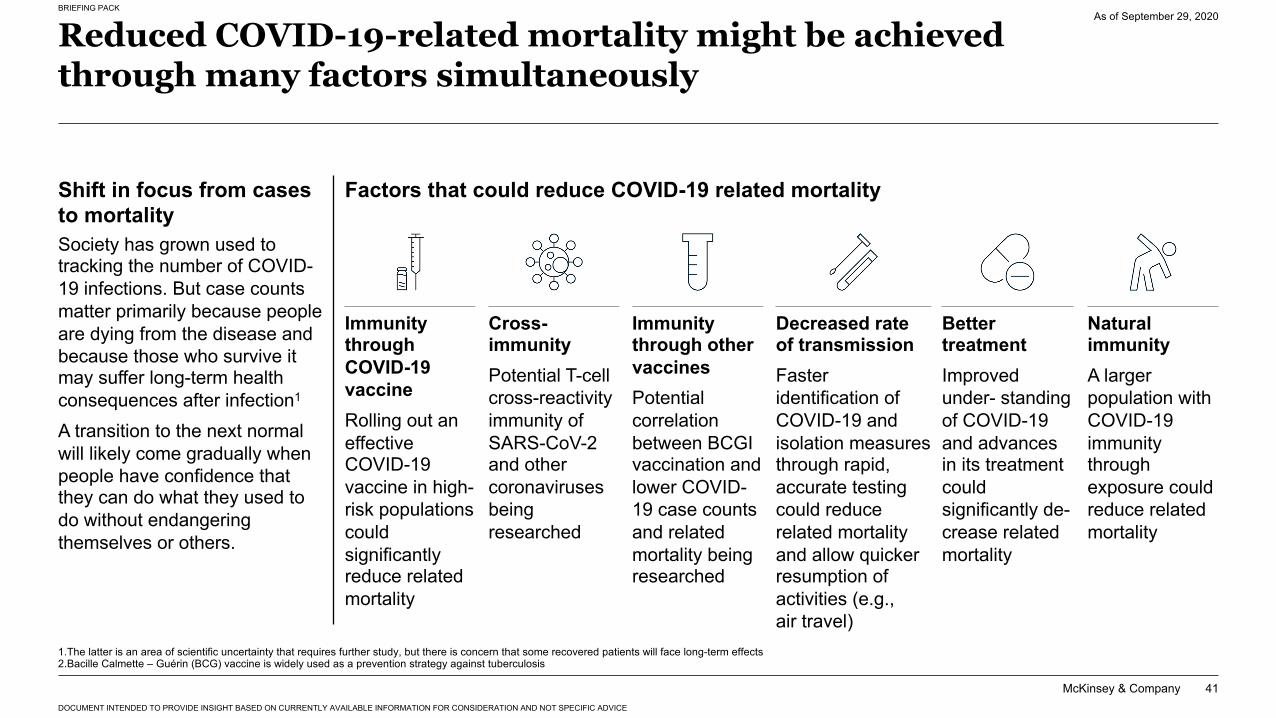
Reduced COVID-19-related mortality might be achieved through many factors simultaneously
1.The latter is an area of scientific uncertainty that requires further study, but there is concern that some recovered patients will face long-term effects2.Bacille Calmette – Guérin (BCG) vaccine is widely used as a prevention strategy against tuberculosis
Society has grown used to tracking the number of COVID-19 infections. But case counts matter primarily because people are dying from the disease and because those who survive it may suffer long-term health consequences after infection1
A transition to the next normal will likely come gradually when people have confidence that they can do what they used to do without endangering themselves or others.
Shift in focus from cases to mortality
Factors that could reduce COVID-19 related mortality
Immunity through COVID-19 vaccine Rolling out an effective COVID-19 vaccine in high-risk populations could significantly reduce related mortality
Cross-immunity Potential T-cell cross-reactivity immunity of SARS-CoV-2 and other coronaviruses being researched
Immunity through other vaccines Potential correlation between BCGI vaccination and lower COVID-19 case counts and related mortality being researched
Decreased rate of transmission Faster identification of COVID-19 and isolation measures through rapid, accurate testing could reduce related mortality and allow quicker resumption of activities (e.g., air travel)
Better treatment Improved under- standing of COVID-19 and advances in its treatment could significantly de-crease related mortality
Natural immunity A larger population with COVID-19 immunity through exposure could reduce related mortality
As of September 29, 2020
McKinsey & Company
BRIEFING PACK
DOCUMENT INTENDED TO PROVIDE INSIGHT BASED ON CURRENTLY AVAILABLE INFORMATION FOR CONSIDERATION AND NOT SPECIFIC ADVICE
42
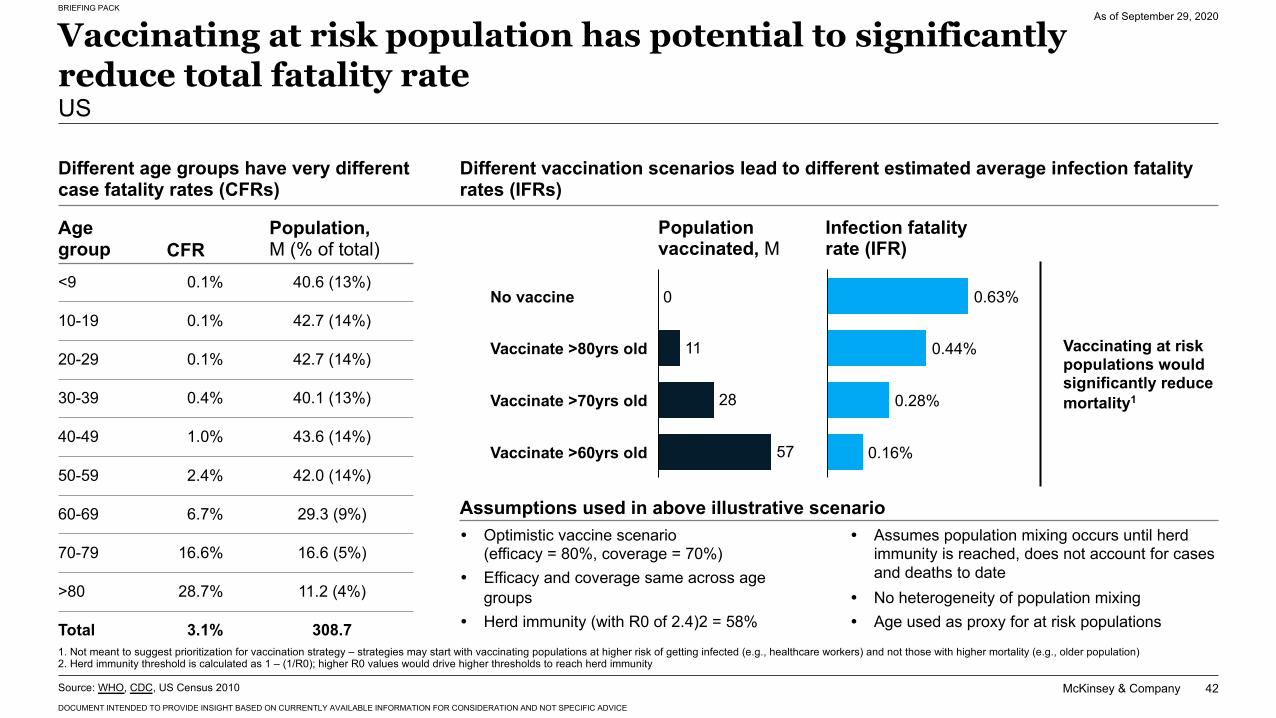
Vaccinating at risk population has potential to significantly reduce total fatality rateUS
Different age groups have very different case fatality rates (CFRs)
Age group<9
10-19
20-29
30-39
40-49
50-59
60-69
70-79
>80
Total
CFR0.1%
0.1%
0.1%
0.4%
1.0%
2.4%
6.7%
16.6%
28.7%
3.1%
Population, M (% of total)
40.6 (13%)
42.7 (14%)
42.7 (14%)
40.1 (13%)
43.6 (14%)
42.0 (14%)
29.3 (9%)
16.6 (5%)
11.2 (4%)
308.7
Different vaccination scenarios lead to different estimated average infection fatality rates (IFRs)
Vaccinating at risk populations would significantly reduce mortality1
Population vaccinated, M
Infection fatality rate (IFR)
Assumptions used in above illustrative scenario
0.28%
0.63%
0.44%
0.16%
11
28
57
No vaccine
Vaccinate >80yrs old
Vaccinate >70yrs old
0
Vaccinate >60yrs old
Source: WHO, CDC, US Census 2010
1. Not meant to suggest prioritization for vaccination strategy – strategies may start with vaccinating populations at higher risk of getting infected (e.g., healthcare workers) and not those with higher mortality (e.g., older population)2. Herd immunity threshold is calculated as 1 – (1/R0); higher R0 values would drive higher thresholds to reach herd immunity
As of September 29, 2020
� Optimistic vaccine scenario (efficacy = 80%, coverage = 70%)
� Efficacy and coverage same across age groups
� Herd immunity (with R0 of 2.4)2 = 58%
� Assumes population mixing occurs until herd immunity is reached, does not account for cases and deaths to date
� No heterogeneity of population mixing� Age used as proxy for at risk populations
McKinsey & Company
BRIEFING PACK
DOCUMENT INTENDED TO PROVIDE INSIGHT BASED ON CURRENTLY AVAILABLE INFORMATION FOR CONSIDERATION AND NOT SPECIFIC ADVICE
43
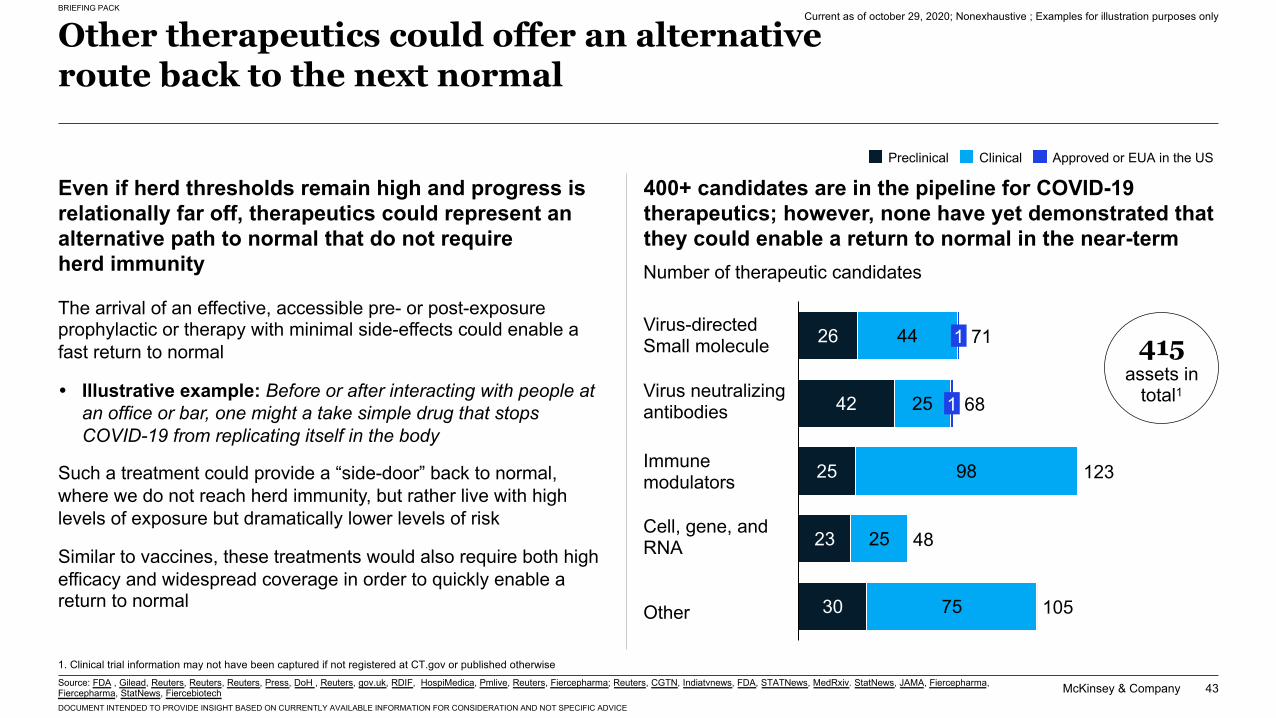
Other therapeutics could offer an alternative route back to the next normal
400+ candidates are in the pipeline for COVID-19 therapeutics; however, none have yet demonstrated that they could enable a return to normal in the near-termNumber of therapeutic candidates
26
42
25
23
30
44
25
98
25
75
1
1
105
71
48
68
123
Preclinical Clinical Approved or EUA in the US
415assets in
total1
Virus-directed Small molecule
Virus neutralizing antibodies
Immune modulators
Cell, gene, and RNA
Other
Even if herd thresholds remain high and progress is relationally far off, therapeutics could represent an alternative path to normal that do not require herd immunity
The arrival of an effective, accessible pre- or post-exposure prophylactic or therapy with minimal side-effects could enable a fast return to normal
� Illustrative example: Before or after interacting with people at an office or bar, one might a take simple drug that stops COVID-19 from replicating itself in the body
Such a treatment could provide a “side-door” back to normal, where we do not reach herd immunity, but rather live with high levels of exposure but dramatically lower levels of risk
Similar to vaccines, these treatments would also require both high efficacy and widespread coverage in order to quickly enable a return to normal
1. Clinical trial information may not have been captured if not registered at CT.gov or published otherwiseSource: FDA , Gilead, Reuters, Reuters, Reuters, Press, DoH , Reuters, gov.uk, RDIF, HospiMedica, Pmlive, Reuters, Fiercepharma; Reuters, CGTN, Indiatvnews, FDA, STATNews, MedRxiv. StatNews, JAMA, Fiercepharma, Fiercepharma, StatNews, Fiercebiotech
Current as of october 29, 2020; Nonexhaustive ; Examples for illustration purposes only
McKinsey & Company
BRIEFING PACK
DOCUMENT INTENDED TO PROVIDE INSIGHT BASED ON CURRENTLY AVAILABLE INFORMATION FOR CONSIDERATION AND NOT SPECIFIC ADVICE
44
Oct 1Apr 1Mar 1 Aug 1 Dec 1May 1 Jun 1 Jul 1 Sep 1 Nov 10
3,000
6,000
1,000
2,000
4,000
5,000
7,000
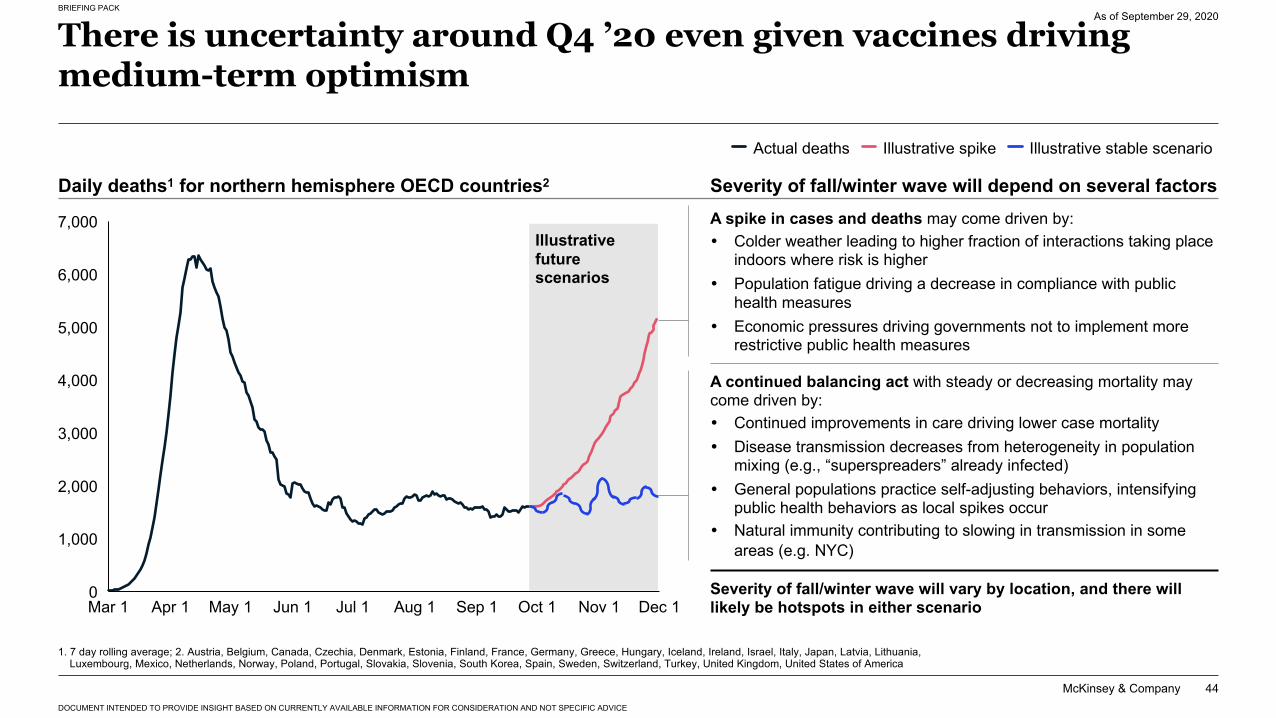
There is uncertainty around Q4 ’20 even given vaccines driving medium-term optimism
As of September 29, 2020
Daily deaths1 for northern hemisphere OECD countries2
1. 7 day rolling average; 2. Austria, Belgium, Canada, Czechia, Denmark, Estonia, Finland, France, Germany, Greece, Hungary, Iceland, Ireland, Israel, Italy, Japan, Latvia, Lithuania, Luxembourg, Mexico, Netherlands, Norway, Poland, Portugal, Slovakia, Slovenia, South Korea, Spain, Sweden, Switzerland, Turkey, United Kingdom, United States of America
Actual deaths Illustrative spike Illustrative stable scenario
Severity of fall/winter wave will depend on several factors
Severity of fall/winter wave will vary by location, and there will likely be hotspots in either scenario
A continued balancing act with steady or decreasing mortality may come driven by:� Continued improvements in care driving lower case mortality� Disease transmission decreases from heterogeneity in population
mixing (e.g., “superspreaders” already infected)� General populations practice self-adjusting behaviors, intensifying
public health behaviors as local spikes occur� Natural immunity contributing to slowing in transmission in some
areas (e.g. NYC)
A spike in cases and deaths may come driven by:� Colder weather leading to higher fraction of interactions taking place
indoors where risk is higher� Population fatigue driving a decrease in compliance with public
health measures� Economic pressures driving governments not to implement more
restrictive public health measures
Illustrative future scenarios
BRIEFING PACK
Contents
McKinsey & Company 45
COVID-19:The situation now
01Therapeutics and vaccines landscape overview
02
Appendix: Scenarios deep-dives
03Pathways towards a COVID-19-Exit
06The ‘Return to Work checklist’
05The ‘Emerging Resilients’: Achieving escape velocity
04
BRIEFING PACK
DOCUMENT INTENDED TO PROVIDE INSIGHT BASED ON CURRENTLY AVAILABLE INFORMATION FOR CONSIDERATION AND NOT SPECIFIC ADVICE
BRIEFING PACK
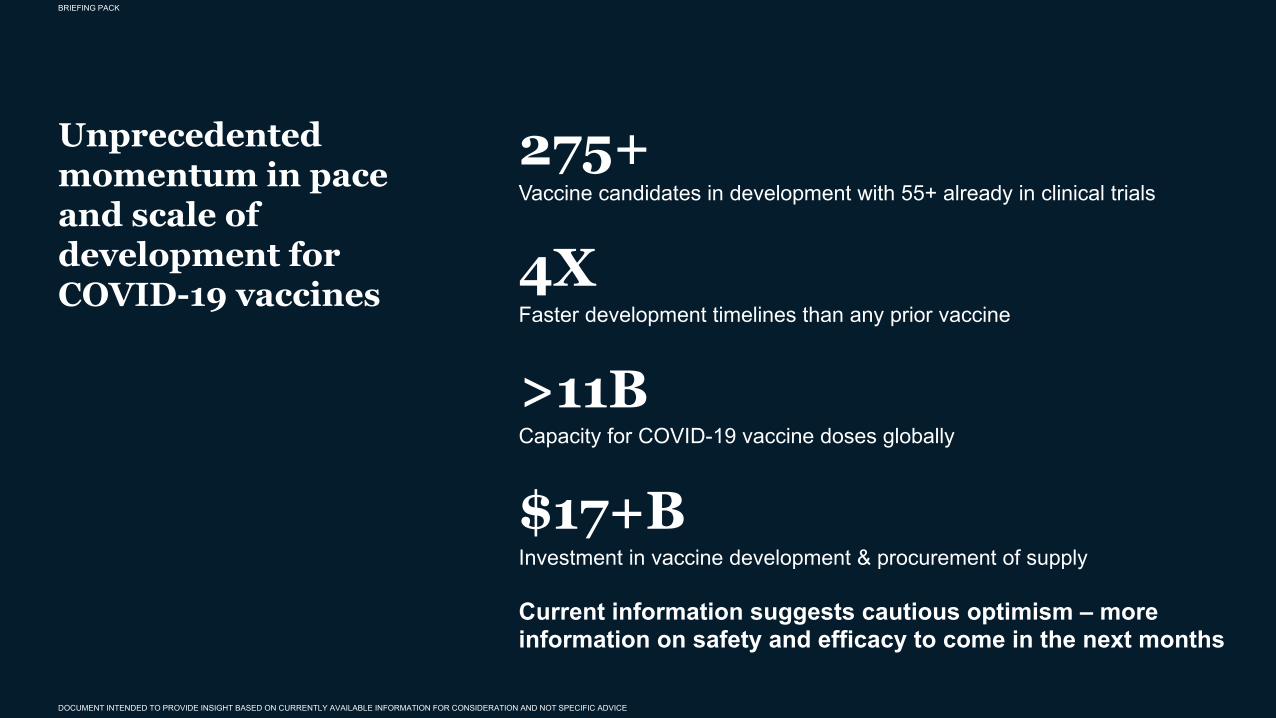
Unprecedented momentum in pace and scale of development for COVID-19 vaccines
275+Vaccine candidates in development with 55+ already in clinical trials
4XFaster development timelines than any prior vaccine
>11BCapacity for COVID-19 vaccine doses globally
$17+BInvestment in vaccine development & procurement of supply
Current information suggests cautious optimism – more information on safety and efficacy to come in the next months
DOCUMENT INTENDED TO PROVIDE INSIGHT BASED ON CURRENTLY AVAILABLE INFORMATION FOR CONSIDERATION AND NOT SPECIFIC ADVICE
McKinsey & Company
BRIEFING PACK
DOCUMENT INTENDED TO PROVIDE INSIGHT BASED ON CURRENTLY AVAILABLE INFORMATION FOR CONSIDERATION AND NOT SPECIFIC ADVICE
47
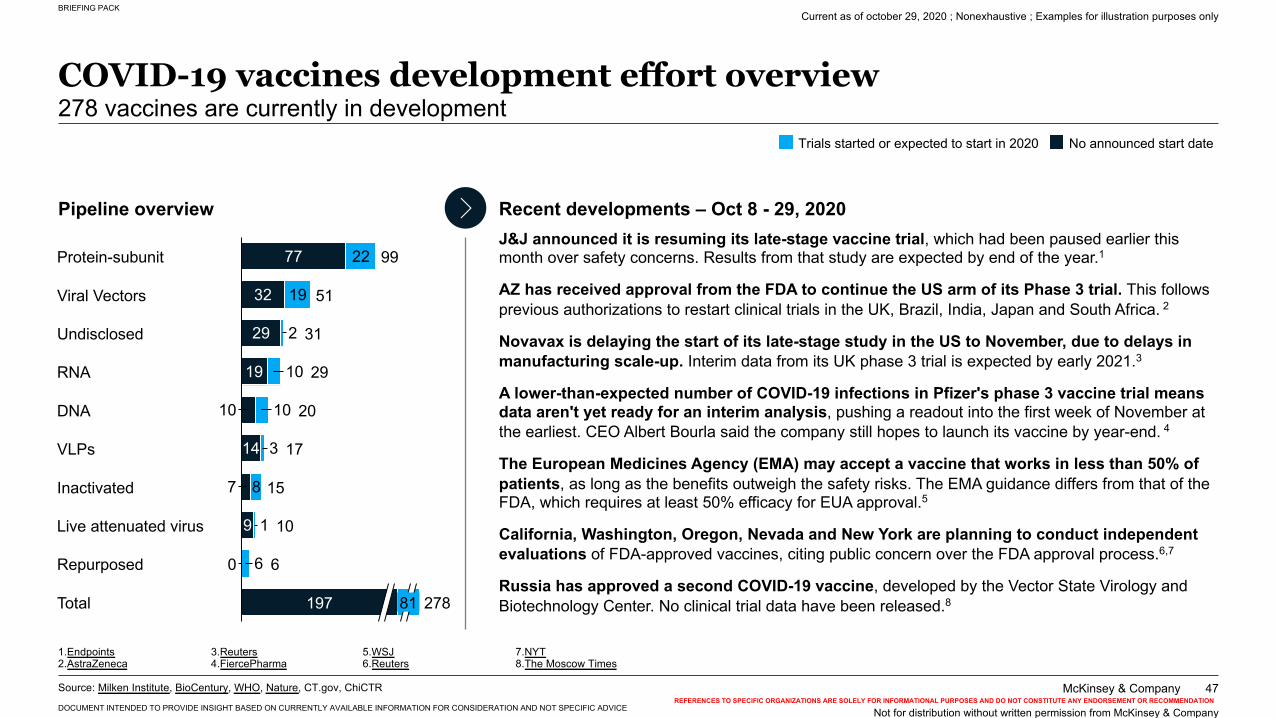
COVID-19 vaccines development effort overview278 vaccines are currently in development
Pipeline overview Recent developments – Oct 8 - 29, 2020
77
32
29
19
10
14
7
9
22
19
2
10
10
3
8
1
6
VLPs
Undisclosed
Viral Vectors
RNA
15
DNA
99
60Repurposed
197 81Total
31
29
20
17
10
278
51
Inactivated
Live attenuated virus
Protein-subunit
Trials started or expected to start in 2020 No announced start date
J&J announced it is resuming its late-stage vaccine trial, which had been paused earlier this month over safety concerns. Results from that study are expected by end of the year.1
AZ has received approval from the FDA to continue the US arm of its Phase 3 trial. This follows previous authorizations to restart clinical trials in the UK, Brazil, India, Japan and South Africa. 2
Novavax is delaying the start of its late-stage study in the US to November, due to delays in manufacturing scale-up. Interim data from its UK phase 3 trial is expected by early 2021.3
A lower-than-expected number of COVID-19 infections in Pfizer's phase 3 vaccine trial means data aren't yet ready for an interim analysis, pushing a readout into the first week of November at the earliest. CEO Albert Bourla said the company still hopes to launch its vaccine by year-end. 4
The European Medicines Agency (EMA) may accept a vaccine that works in less than 50% of patients, as long as the benefits outweigh the safety risks. The EMA guidance differs from that of the FDA, which requires at least 50% efficacy for EUA approval.5
California, Washington, Oregon, Nevada and New York are planning to conduct independent evaluations of FDA-approved vaccines, citing public concern over the FDA approval process.6,7
Russia has approved a second COVID-19 vaccine, developed by the Vector State Virology and Biotechnology Center. No clinical trial data have been released.8
Source: Milken Institute, BioCentury, WHO, Nature, CT.gov, ChiCTRREFERENCES TO SPECIFIC ORGANIZATIONS ARE SOLELY FOR INFORMATIONAL PURPOSES AND DO NOT CONSTITUTE ANY ENDORSEMENT OR RECOMMENDATION
Not for distribution without written permission from McKinsey & Company
1.Endpoints 2.AstraZeneca
3.Reuters 4.FiercePharma
5.WSJ6.Reuters
7.NYT 8.The Moscow Times
Current as of october 29, 2020 ; Nonexhaustive ; Examples for illustration purposes only
McKinsey & Company
BRIEFING PACK
DOCUMENT INTENDED TO PROVIDE INSIGHT BASED ON CURRENTLY AVAILABLE INFORMATION FOR CONSIDERATION AND NOT SPECIFIC ADVICE
48
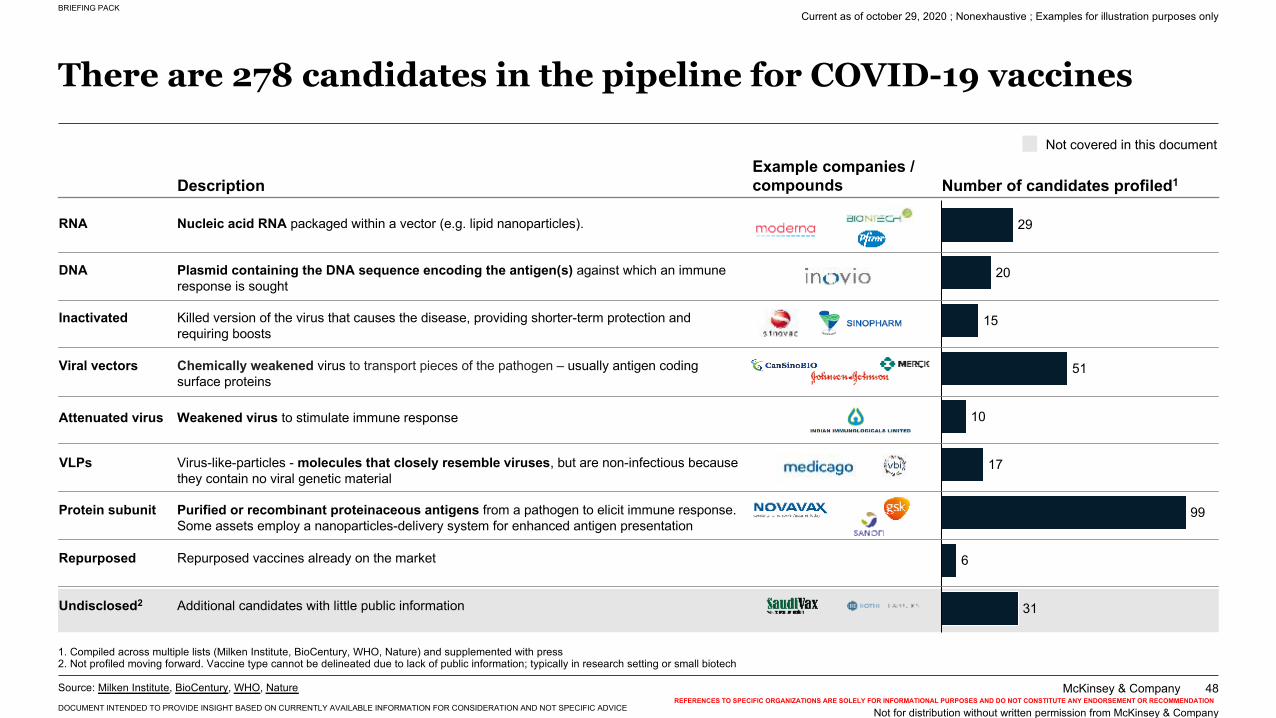
There are 278 candidates in the pipeline for COVID-19 vaccines
Source: Milken Institute, BioCentury, WHO, Nature
1. Compiled across multiple lists (Milken Institute, BioCentury, WHO, Nature) and supplemented with press2. Not profiled moving forward. Vaccine type cannot be delineated due to lack of public information; typically in research setting or small biotech
Not covered in this document
29
20
15
51
10
17
99
6
31
Example companies / compounds Number of candidates profiled1Description
Repurposed vaccines already on the marketRepurposed
Nucleic acid RNA packaged within a vector (e.g. lipid nanoparticles). RNA
Plasmid containing the DNA sequence encoding the antigen(s) against which an immune response is sought
DNA
Killed version of the virus that causes the disease, providing shorter-term protection and requiring boosts
Inactivated
Chemically weakened virus to transport pieces of the pathogen – usually antigen coding surface proteins
Viral vectors
Weakened virus to stimulate immune responseAttenuated virus
Virus-like-particles - molecules that closely resemble viruses, but are non-infectious because they contain no viral genetic material
VLPs
Additional candidates with little public informationUndisclosed2
Purified or recombinant proteinaceous antigens from a pathogen to elicit immune response. Some assets employ a nanoparticles-delivery system for enhanced antigen presentation
Protein subunit
Current as of october 29, 2020 ; Nonexhaustive ; Examples for illustration purposes only
Not for distribution without written permission from McKinsey & CompanyREFERENCES TO SPECIFIC ORGANIZATIONS ARE SOLELY FOR INFORMATIONAL PURPOSES AND DO NOT CONSTITUTE ANY ENDORSEMENT OR RECOMMENDATION
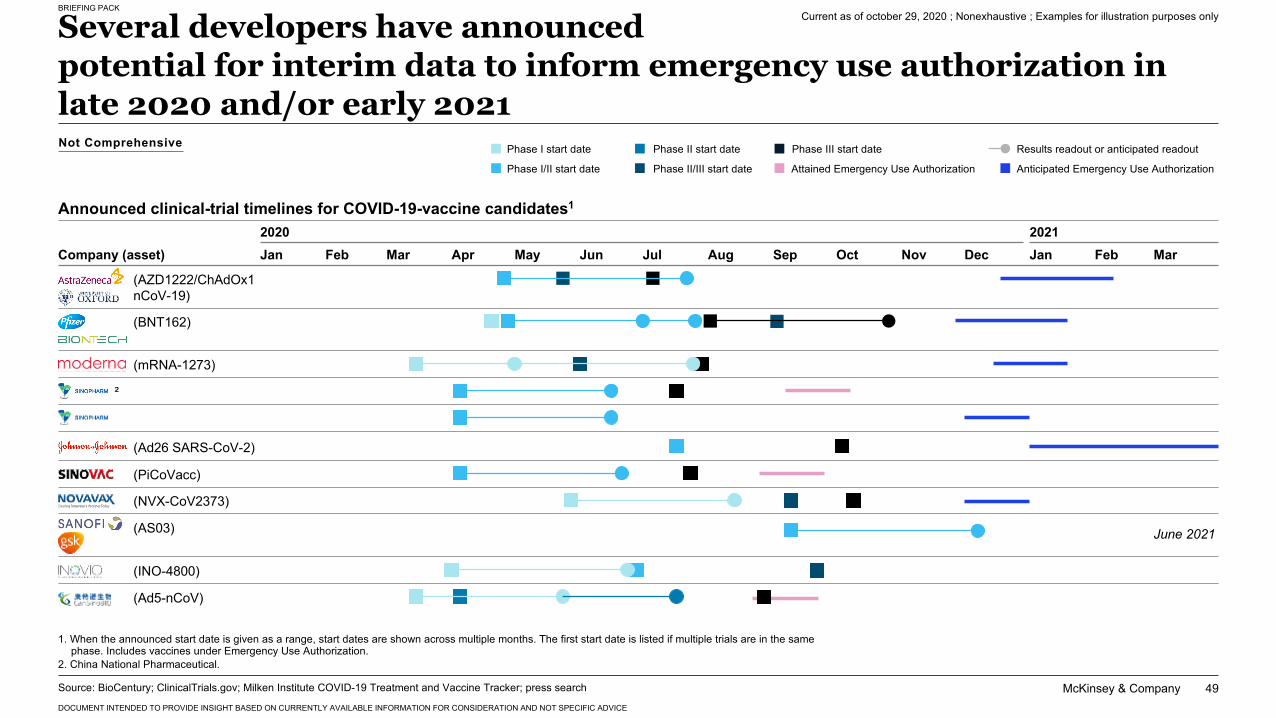
McKinsey & Company 49
BRIEFING PACK
DOCUMENT INTENDED TO PROVIDE INSIGHT BASED ON CURRENTLY AVAILABLE INFORMATION FOR CONSIDERATION AND NOT SPECIFIC ADVICE
Several developers have announced potential for interim data to inform emergency use authorization in late 2020 and/or early 2021
Announced clinical-trial timelines for COVID-19-vaccine candidates1
Source: BioCentury; ClinicalTrials.gov; Milken Institute COVID-19 Treatment and Vaccine Tracker; press search
2020 2021Jan Feb Mar Apr May Jun Jul Aug Sep Oct Nov Dec Jan Feb Mar
(Ad5-nCoV)
(AS03)
(AZD1222/ChAdOx1nCoV-19)
(BNT162)
(NVX-CoV2373)
(PiCoVacc)
Company (asset)
(INO-4800)
(Ad26 SARS-CoV-2)
(mRNA-1273)
²
Phase I start date Phase II start date Phase III start date Results readout or anticipated readout
1. When the announced start date is given as a range, start dates are shown across multiple months. The first start date is listed if multiple trials are in the same phase. Includes vaccines under Emergency Use Authorization.
2. China National Pharmaceutical.
Phase I/II start date Phase II/III start date Attained Emergency Use Authorization Anticipated Emergency Use Authorization
June 2021
Not Comprehensive
Current as of october 29, 2020 ; Nonexhaustive ; Examples for illustration purposes only
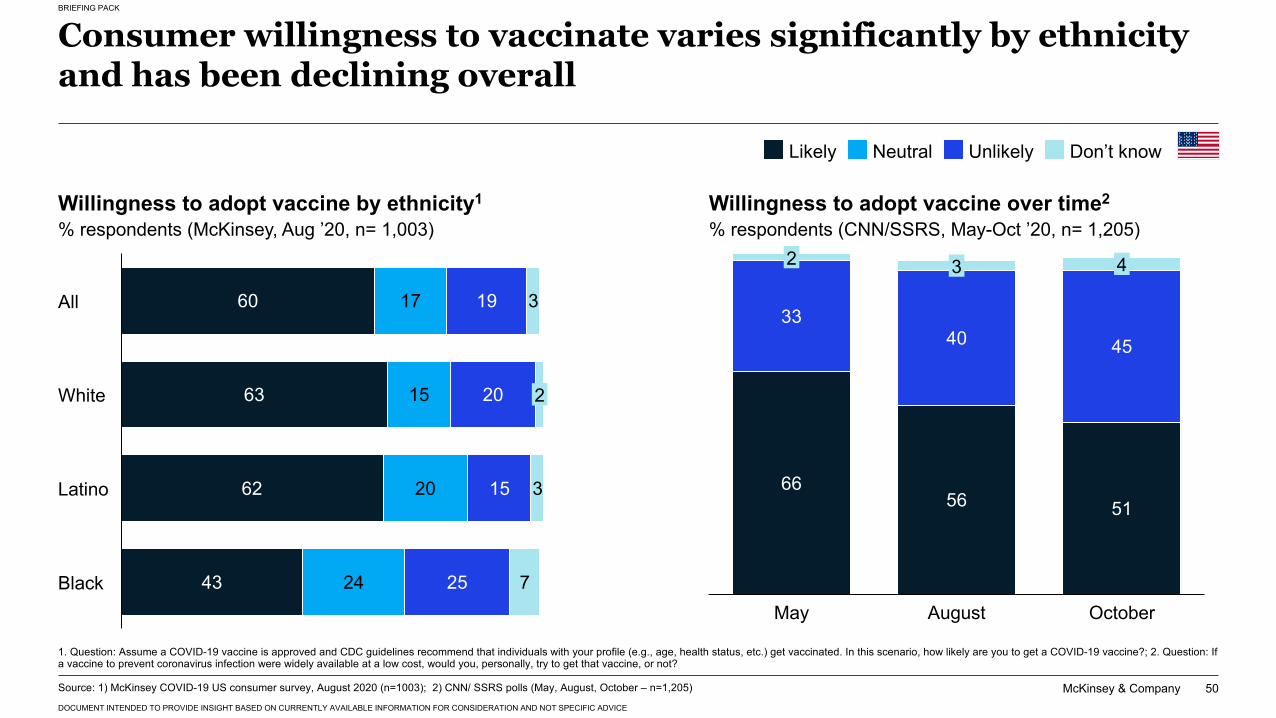
McKinsey & Company
BRIEFING PACK
DOCUMENT INTENDED TO PROVIDE INSIGHT BASED ON CURRENTLY AVAILABLE INFORMATION FOR CONSIDERATION AND NOT SPECIFIC ADVICE
50
Consumer willingness to vaccinate varies significantly by ethnicity and has been declining overall
60
63
62
43
17
15
20
24
19
20
15
25
3
3
7
All
2White
Latino
Black
Willingness to adopt vaccine by ethnicity1
% respondents (McKinsey, Aug ’20, n= 1,003)
Source: 1) McKinsey COVID-19 US consumer survey, August 2020 (n=1003); 2) CNN/ SSRS polls (May, August, October – n=1,205)
Likely Don’t knowUnlikelyNeutral
6656 51
3340 45
42
AugustMay October
3
Willingness to adopt vaccine over time2
% respondents (CNN/SSRS, May-Oct ’20, n= 1,205)
1. Question: Assume a COVID-19 vaccine is approved and CDC guidelines recommend that individuals with your profile (e.g., age, health status, etc.) get vaccinated. In this scenario, how likely are you to get a COVID-19 vaccine?; 2. Question: If a vaccine to prevent coronavirus infection were widely available at a low cost, would you, personally, try to get that vaccine, or not?
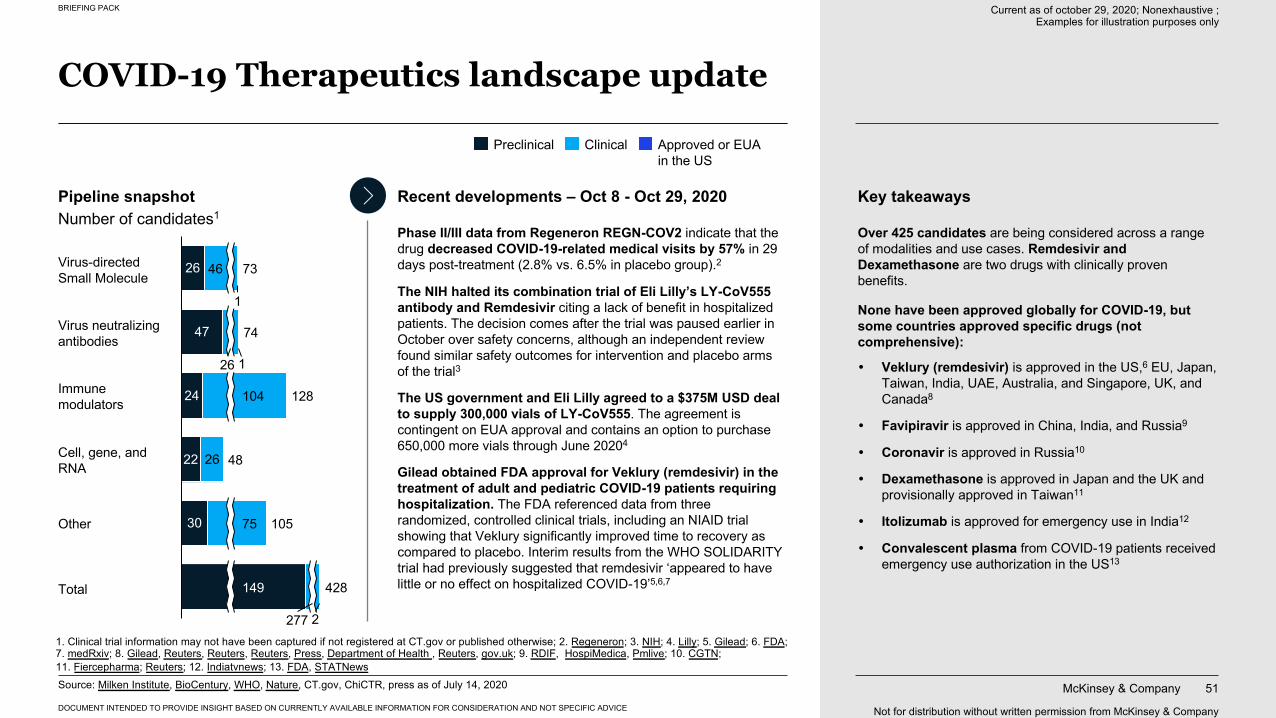
McKinsey & Company 51
BRIEFING PACK
DOCUMENT INTENDED TO PROVIDE INSIGHT BASED ON CURRENTLY AVAILABLE INFORMATION FOR CONSIDERATION AND NOT SPECIFIC ADVICE
Pipeline snapshotNumber of candidates1
26
47
24
22
30
26
1
2
48
105
428
46 73
104
74
128
277
26
149
75
1
Preclinical Clinical Approved or EUA in the US
Source: Milken Institute, BioCentury, WHO, Nature, CT.gov, ChiCTR, press as of July 14, 2020
1. Clinical trial information may not have been captured if not registered at CT.gov or published otherwise; 2. Regeneron; 3. NIH; 4. Lilly; 5. Gilead; 6. FDA; 7. medRxiv; 8. Gilead, Reuters, Reuters, Reuters, Press, Department of Health , Reuters, gov.uk; 9. RDIF, HospiMedica, Pmlive; 10. CGTN; 11. Fiercepharma; Reuters; 12. Indiatvnews; 13. FDA, STATNews
Key takeaways
Over 425 candidates are being considered across a range of modalities and use cases. Remdesivir and Dexamethasone are two drugs with clinically proven benefits.
None have been approved globally for COVID-19, but some countries approved specific drugs (not comprehensive):
� Veklury (remdesivir) is approved in the US,6 EU, Japan, Taiwan, India, UAE, Australia, and Singapore, UK, and Canada8
� Favipiravir is approved in China, India, and Russia9
� Coronavir is approved in Russia10
� Dexamethasone is approved in Japan and the UK and provisionally approved in Taiwan11
� Itolizumab is approved for emergency use in India12
� Convalescent plasma from COVID-19 patients received emergency use authorization in the US13
Recent developments – Oct 8 - Oct 29, 2020
Phase II/III data from Regeneron REGN-COV2 indicate that the drug decreased COVID-19-related medical visits by 57% in 29 days post-treatment (2.8% vs. 6.5% in placebo group).2
The NIH halted its combination trial of Eli Lilly’s LY-CoV555 antibody and Remdesivir citing a lack of benefit in hospitalized patients. The decision comes after the trial was paused earlier in October over safety concerns, although an independent review found similar safety outcomes for intervention and placebo arms of the trial3
The US government and Eli Lilly agreed to a $375M USD deal to supply 300,000 vials of LY-CoV555. The agreement is contingent on EUA approval and contains an option to purchase 650,000 more vials through June 20204
Gilead obtained FDA approval for Veklury (remdesivir) in the treatment of adult and pediatric COVID-19 patients requiring hospitalization. The FDA referenced data from three randomized, controlled clinical trials, including an NIAID trial showing that Veklury significantly improved time to recovery as compared to placebo. Interim results from the WHO SOLIDARITY trial had previously suggested that remdesivir ‘appeared to have little or no effect on hospitalized COVID-19’5,6,7
Not for distribution without written permission from McKinsey & Company
Virus-directed Small Molecule
Virus neutralizing antibodies
Immune modulators
Cell, gene, and RNA
Other
Total
Current as of october 29, 2020; Nonexhaustive ; Examples for illustration purposes only
COVID-19 Therapeutics landscape update
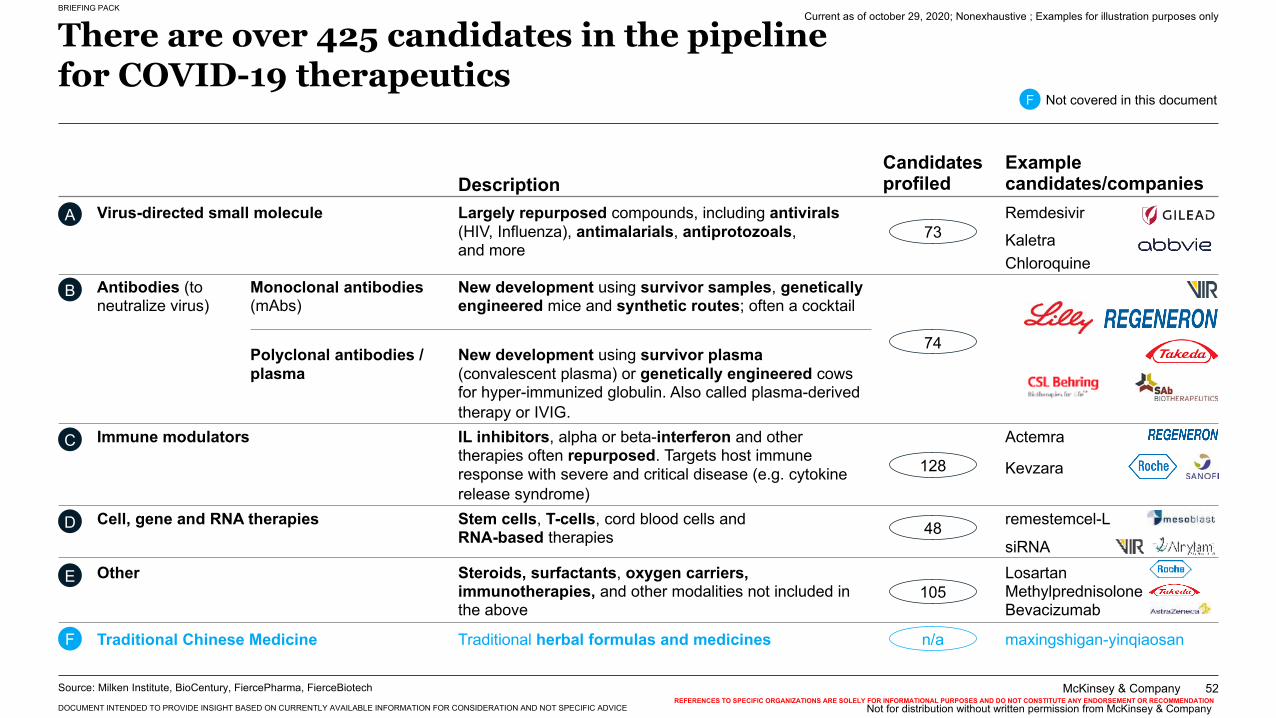
McKinsey & Company
BRIEFING PACK
DOCUMENT INTENDED TO PROVIDE INSIGHT BASED ON CURRENTLY AVAILABLE INFORMATION FOR CONSIDERATION AND NOT SPECIFIC ADVICE
52
There are over 425 candidates in the pipeline for COVID-19 therapeutics
Source: Milken Institute, BioCentury, FiercePharma, FierceBiotech
DescriptionCandidates profiled
Example candidates/companies
Not for distribution without written permission from McKinsey & Company
Current as of october 29, 2020; Nonexhaustive ; Examples for illustration purposes only
Virus-directed small molecule Largely repurposed compounds, including antivirals(HIV, Influenza), antimalarials, antiprotozoals, and more
Remdesivir
Kaletra Chloroquine
73A
Immune modulators IL inhibitors, alpha or beta-interferon and other therapies often repurposed. Targets host immune response with severe and critical disease (e.g. cytokine release syndrome)
Kevzara
Actemra
128C
Cell, gene and RNA therapies Stem cells, T-cells, cord blood cells and RNA-based therapies siRNA
remestemcel-L48D
Other Steroids, surfactants, oxygen carriers, immunotherapies, and other modalities not included in the above
LosartanMethylprednisoloneBevacizumab
105E
Traditional Chinese Medicine Traditional herbal formulas and medicines maxingshigan-yinqiaosann/aF
Polyclonal antibodies / plasma
New development using survivor plasma (convalescent plasma) or genetically engineered cows for hyper-immunized globulin. Also called plasma-derived therapy or IVIG.
Antibodies (to neutralize virus)
Monoclonal antibodies (mAbs)
New development using survivor samples, genetically engineered mice and synthetic routes; often a cocktail
74
B
Not covered in this documentF
REFERENCES TO SPECIFIC ORGANIZATIONS ARE SOLELY FOR INFORMATIONAL PURPOSES AND DO NOT CONSTITUTE ANY ENDORSEMENT OR RECOMMENDATION
BRIEFING PACK
Contents
McKinsey & Company 53
COVID-19:The situation now
01Therapeutics and vaccines landscape overview
02
Appendix: Scenarios deep-dives
03Pathways towards a COVID-19-Exit
06The ‘Return to Work checklist’
05The ‘Emerging Resilients’: Achieving escape velocity
04
BRIEFING PACK
DOCUMENT INTENDED TO PROVIDE INSIGHT BASED ON CURRENTLY AVAILABLE INFORMATION FOR CONSIDERATION AND NOT SPECIFIC ADVICE
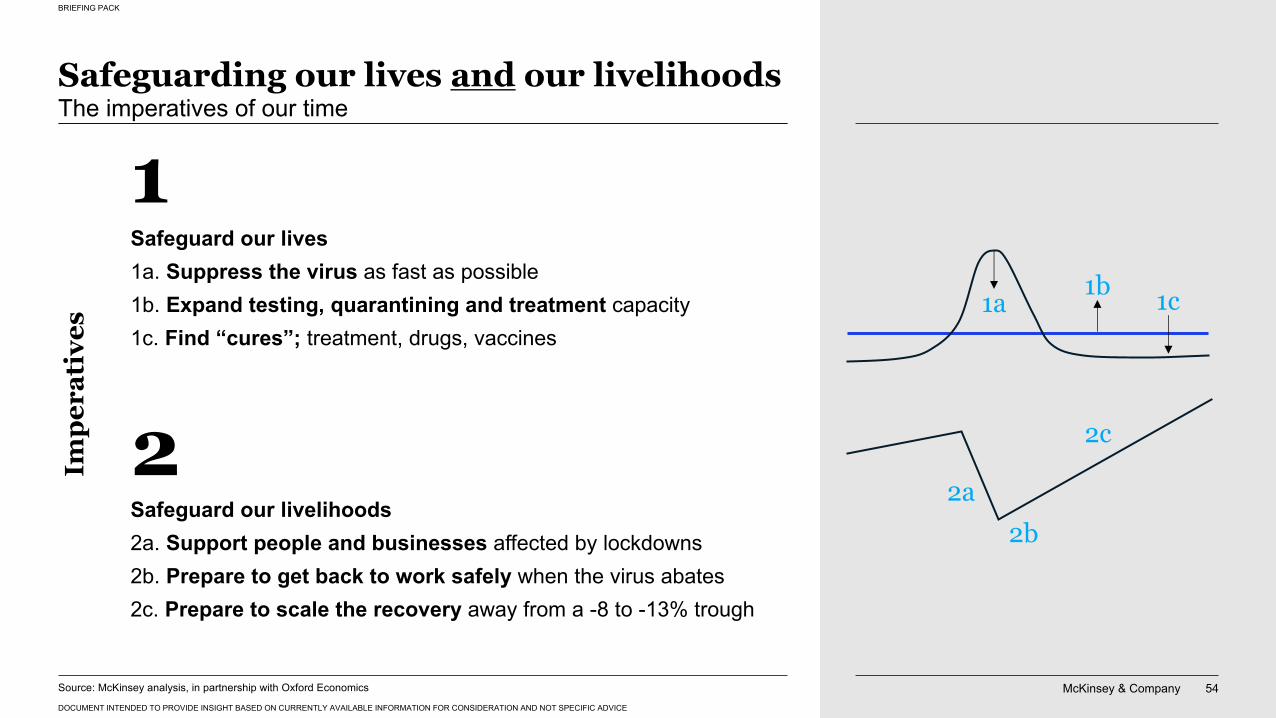
McKinsey & Company 54
BRIEFING PACK
DOCUMENT INTENDED TO PROVIDE INSIGHT BASED ON CURRENTLY AVAILABLE INFORMATION FOR CONSIDERATION AND NOT SPECIFIC ADVICE
Safeguarding our lives and our livelihoodsThe imperatives of our time
Safeguard our lives1a. Suppress the virus as fast as possible1b. Expand testing, quarantining and treatment capacity1c. Find “cures”; treatment, drugs, vaccines
Impe
rati
ves
2Safeguard our livelihoods2a. Support people and businesses affected by lockdowns2b. Prepare to get back to work safely when the virus abates2c. Prepare to scale the recovery away from a -8 to -13% trough
1
Source: McKinsey analysis, in partnership with Oxford Economics
1a1b 1c
2a2b
2c
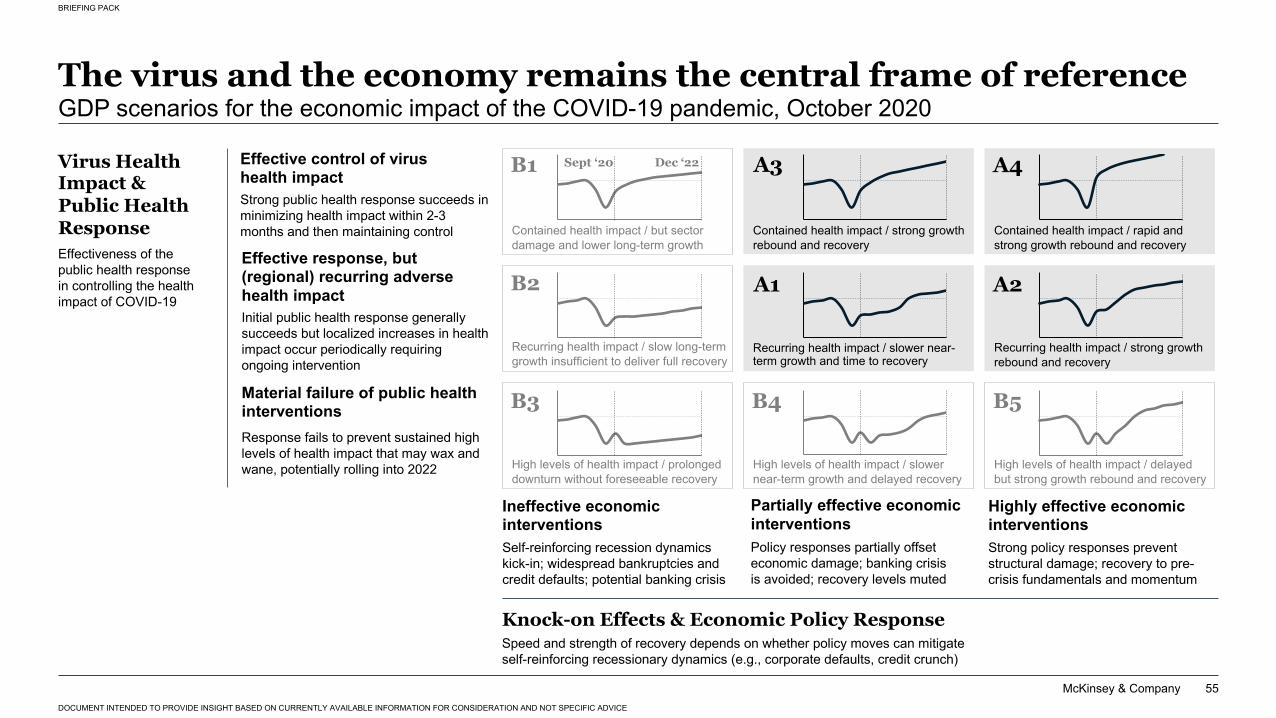
McKinsey & Company
BRIEFING PACK
DOCUMENT INTENDED TO PROVIDE INSIGHT BASED ON CURRENTLY AVAILABLE INFORMATION FOR CONSIDERATION AND NOT SPECIFIC ADVICE
55
Recurring health impact / slower near-term growth and time to recovery
Contained health impact / strong growth rebound and recovery
Contained health impact / but sector damage and lower long-term growth
Recurring health impact / slow long-term growth insufficient to deliver full recovery
High levels of health impact / prolonged downturn without foreseeable recovery
High levels of health impact / slower near-term growth and delayed recovery
Contained health impact / rapid and strong growth rebound and recovery
Recurring health impact / strong growth rebound and recovery
High levels of health impact / delayed but strong growth rebound and recovery
A3
A1 A2
A4B1
B2
B3 B4 B5
The virus and the economy remains the central frame of referenceGDP scenarios for the economic impact of the COVID-19 pandemic, October 2020
Effective control of virus health impactStrong public health response succeeds in minimizing health impact within 2-3 months and then maintaining control
Virus Health Impact & Public Health ResponseEffectiveness of the public health response in controlling the health impact of COVID-19
Effective response, but (regional) recurring adverse health impactInitial public health response generally succeeds but localized increases in health impact occur periodically requiring ongoing intervention
Material failure of public health interventionsResponse fails to prevent sustained high levels of health impact that may wax and wane, potentially rolling into 2022
Knock-on Effects & Economic Policy ResponseSpeed and strength of recovery depends on whether policy moves can mitigate self-reinforcing recessionary dynamics (e.g., corporate defaults, credit crunch)
Ineffective economic interventions
Policy responses partially offset economic damage; banking crisisis avoided; recovery levels muted
Partially effective economic interventions
Self-reinforcing recession dynamics kick-in; widespread bankruptcies and credit defaults; potential banking crisis
Strong policy responses prevent structural damage; recovery to pre-crisis fundamentals and momentum
Highly effective economic interventions
Sept ‘20 Dec ‘22
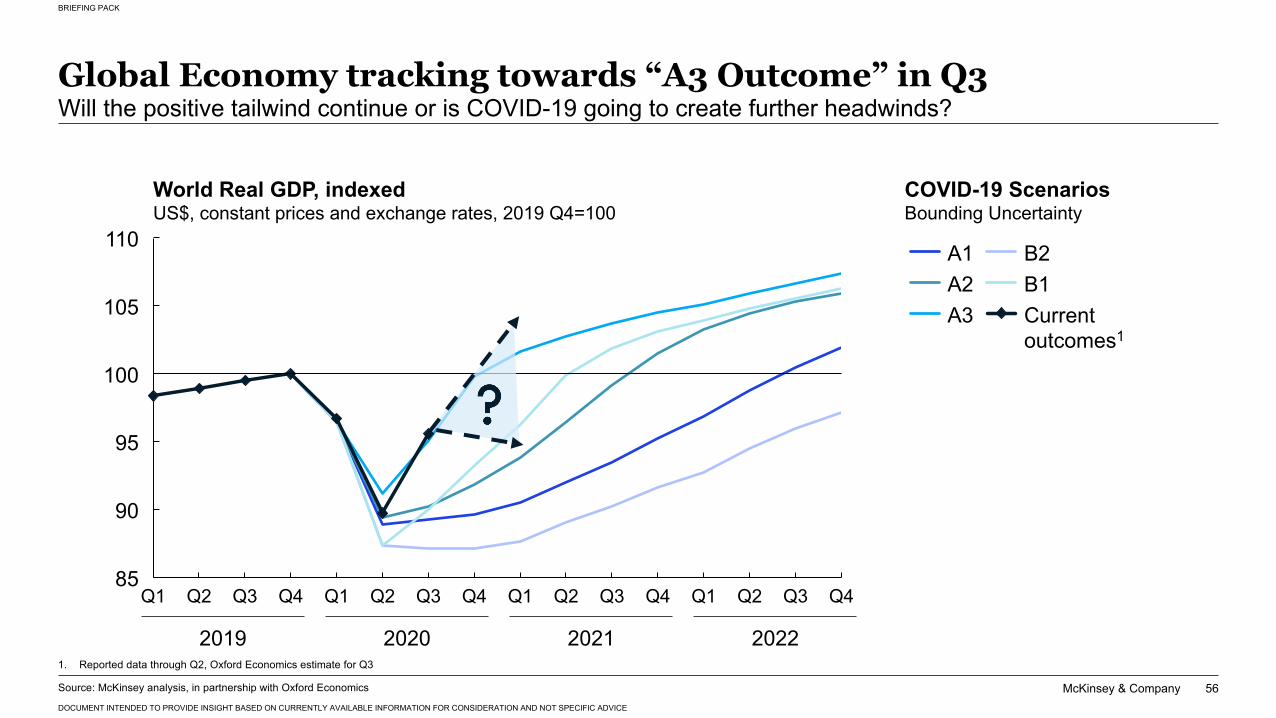
McKinsey & Company
BRIEFING PACK
DOCUMENT INTENDED TO PROVIDE INSIGHT BASED ON CURRENTLY AVAILABLE INFORMATION FOR CONSIDERATION AND NOT SPECIFIC ADVICE
56
Global Economy tracking towards “A3 Outcome” in Q3Will the positive tailwind continue or is COVID-19 going to create further headwinds?
105
110
85
95
90
100
Q4Q4Q1 Q2 Q3 Q1 Q2 Q3 Q4 Q1 Q2 Q3 Q1 Q2 Q3 Q4
World Real GDP, indexedUS$, constant prices and exchange rates, 2019 Q4=100
A1
Current outcomes1
A2A3
B2B1
2019 2020 2021 20221. Reported data through Q2, Oxford Economics estimate for Q3
Source: McKinsey analysis, in partnership with Oxford Economics
COVID-19 ScenariosBounding Uncertainty
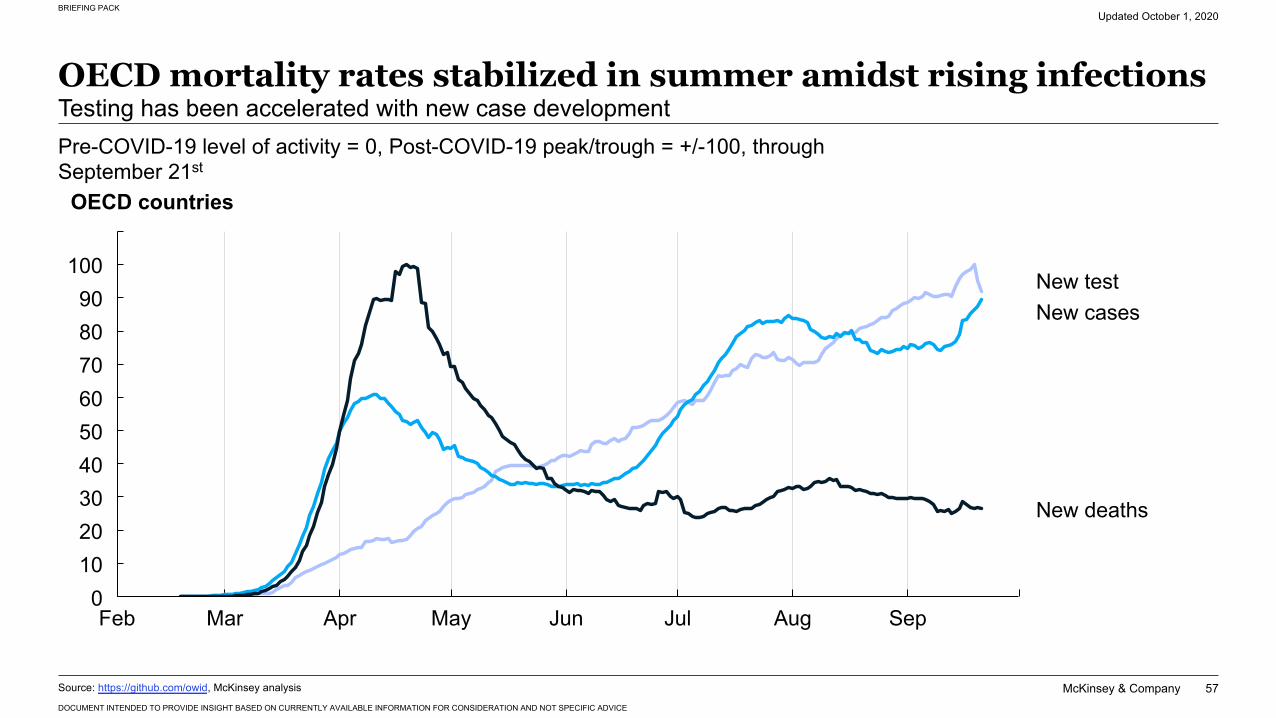
McKinsey & Company
BRIEFING PACK
DOCUMENT INTENDED TO PROVIDE INSIGHT BASED ON CURRENTLY AVAILABLE INFORMATION FOR CONSIDERATION AND NOT SPECIFIC ADVICE
57
OECD mortality rates stabilized in summer amidst rising infectionsTesting has been accelerated with new case development
Updated October 1, 2020
OECD countries
Feb Mar
60
AugJulJun
80
SepMay0
1020304050
70
90100
Apr
New testNew cases
New deaths
Pre-COVID-19 level of activity = 0, Post-COVID-19 peak/trough = +/-100, through September 21st
Source: https://github.com/owid, McKinsey analysis
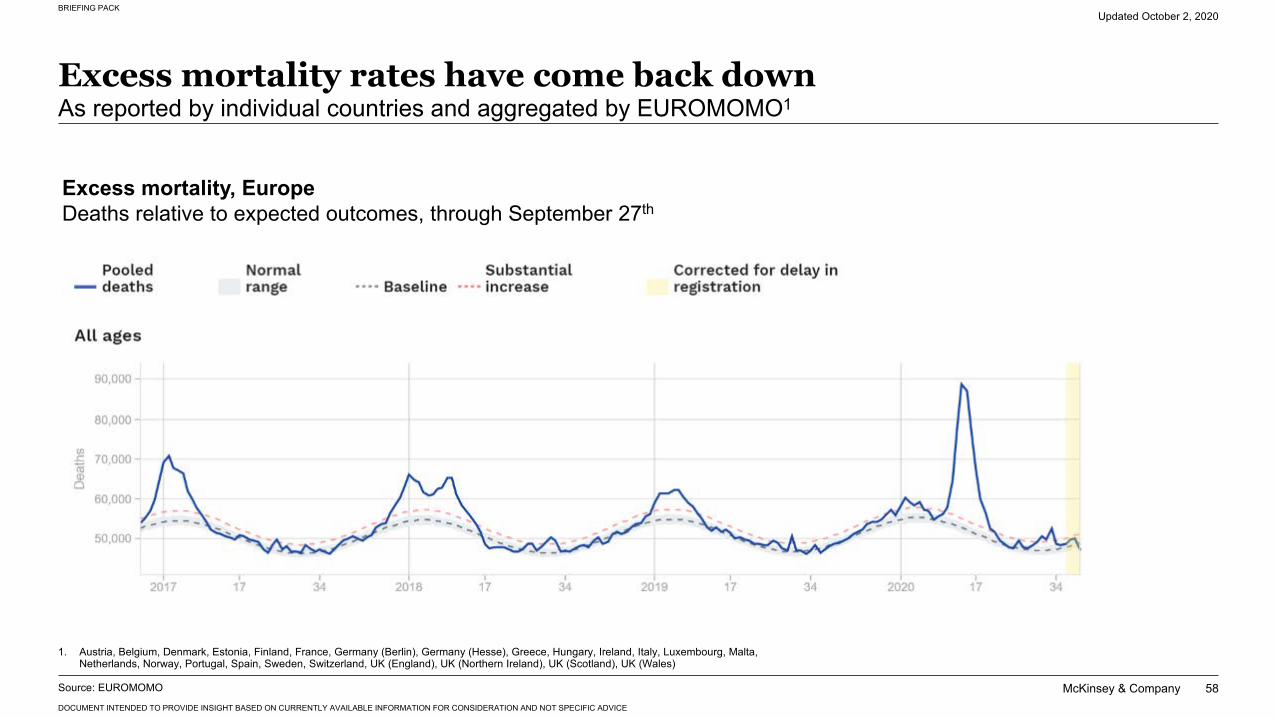
McKinsey & Company
BRIEFING PACK
DOCUMENT INTENDED TO PROVIDE INSIGHT BASED ON CURRENTLY AVAILABLE INFORMATION FOR CONSIDERATION AND NOT SPECIFIC ADVICE
58
Excess mortality rates have come back downAs reported by individual countries and aggregated by EUROMOMO1
Updated October 2, 2020
Excess mortality, EuropeDeaths relative to expected outcomes, through September 27th
1. Austria, Belgium, Denmark, Estonia, Finland, France, Germany (Berlin), Germany (Hesse), Greece, Hungary, Ireland, Italy, Luxembourg, Malta, Netherlands, Norway, Portugal, Spain, Sweden, Switzerland, UK (England), UK (Northern Ireland), UK (Scotland), UK (Wales)
Source: EUROMOMO
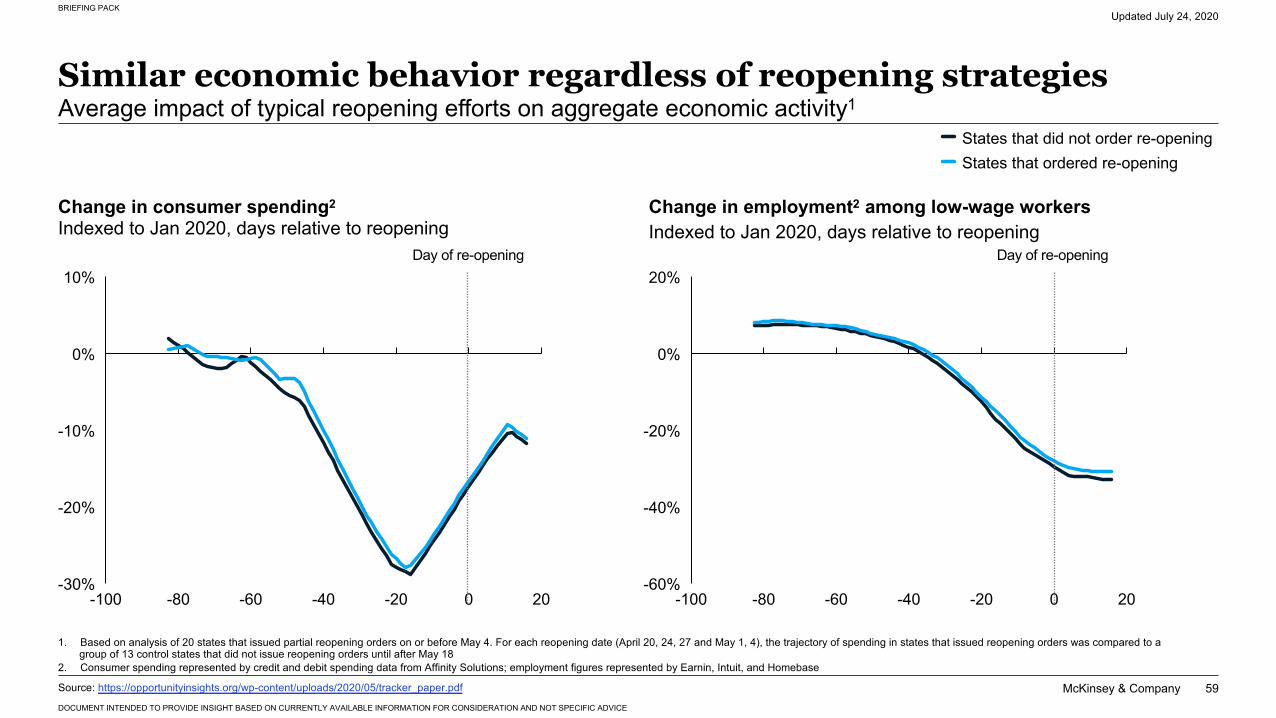
McKinsey & Company
BRIEFING PACK
DOCUMENT INTENDED TO PROVIDE INSIGHT BASED ON CURRENTLY AVAILABLE INFORMATION FOR CONSIDERATION AND NOT SPECIFIC ADVICE
59
Similar economic behavior regardless of reopening strategiesAverage impact of typical reopening efforts on aggregate economic activity1
Updated July 24, 2020
-60-100 -80
-20%
-40 -20 0
10%
20-30%
-10%
0% 0%
-40%
-60-100 -80 -40-60%
-20 0 20
-20%
20%
States that did not order re-openingStates that ordered re-opening
Source: https://opportunityinsights.org/wp-content/uploads/2020/05/tracker_paper.pdf
Change in consumer spending2
Indexed to Jan 2020, days relative to reopeningChange in employment2 among low-wage workers Indexed to Jan 2020, days relative to reopening
Day of re-opening Day of re-opening
1. Based on analysis of 20 states that issued partial reopening orders on or before May 4. For each reopening date (April 20, 24, 27 and May 1, 4), the trajectory of spending in states that issued reopening orders was compared to a group of 13 control states that did not issue reopening orders until after May 18
2. Consumer spending represented by credit and debit spending data from Affinity Solutions; employment figures represented by Earnin, Intuit, and Homebase
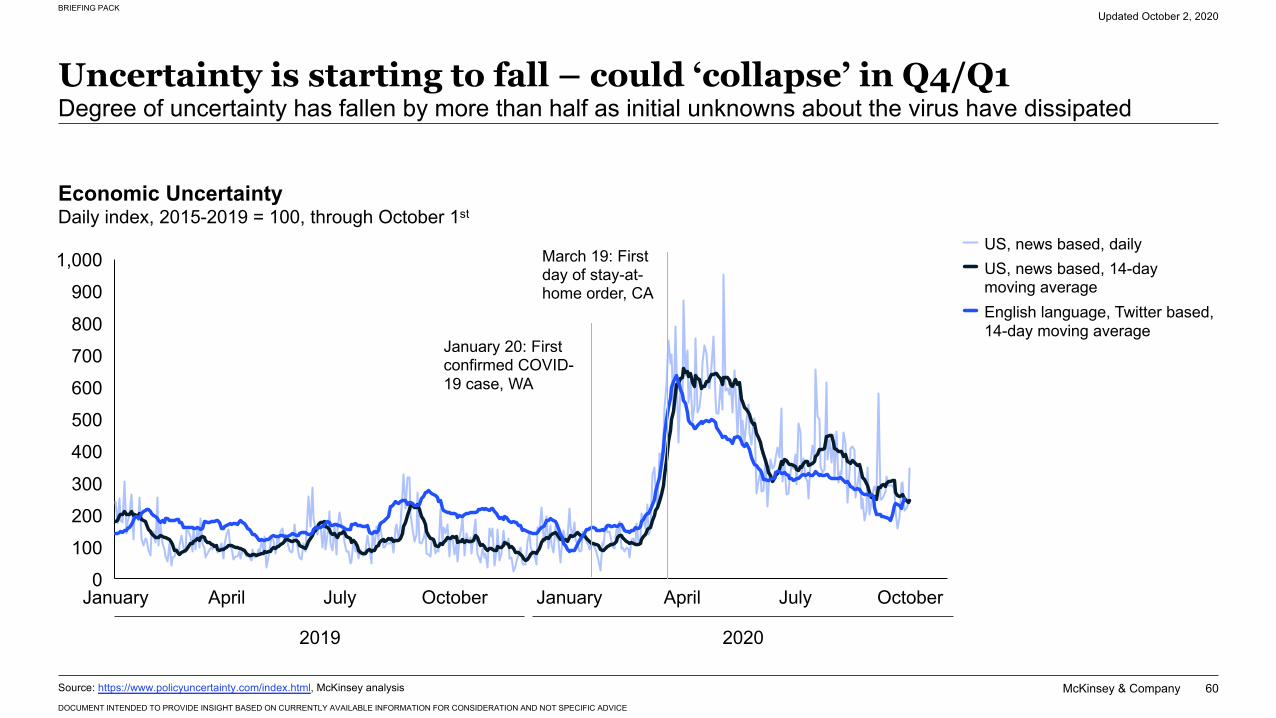
McKinsey & Company
BRIEFING PACK
DOCUMENT INTENDED TO PROVIDE INSIGHT BASED ON CURRENTLY AVAILABLE INFORMATION FOR CONSIDERATION AND NOT SPECIFIC ADVICE
60
600
500
400
0
900
200
700
100
1,000
300
800
January April July October January April July October
January 20: First confirmed COVID-19 case, WA
Economic UncertaintyDaily index, 2015-2019 = 100, through October 1st
Uncertainty is starting to fall – could ‘collapse’ in Q4/Q1Degree of uncertainty has fallen by more than half as initial unknowns about the virus have dissipated
Updated October 2, 2020
English language, Twitter based,14-day moving average
US, news based, dailyUS, news based, 14-daymoving average
2019 2020
March 19: First day of stay-at-home order, CA
Source: https://www.policyuncertainty.com/index.html, McKinsey analysis
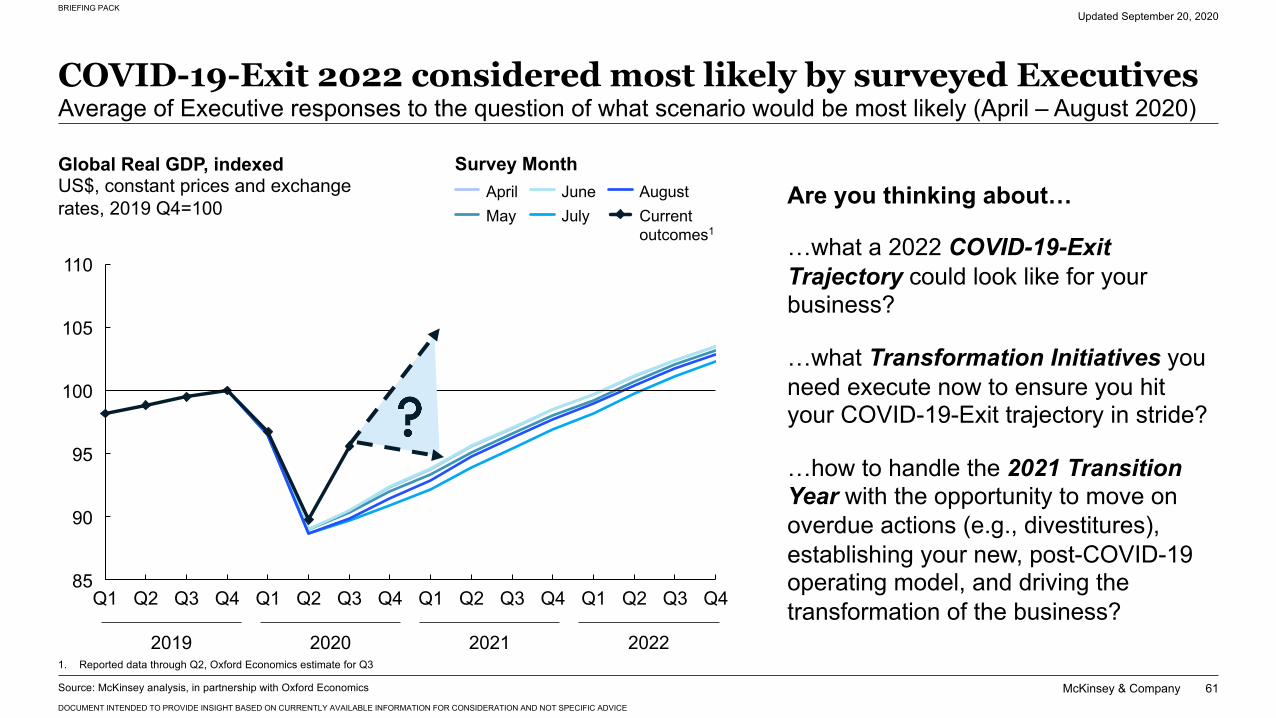
McKinsey & Company
BRIEFING PACK
DOCUMENT INTENDED TO PROVIDE INSIGHT BASED ON CURRENTLY AVAILABLE INFORMATION FOR CONSIDERATION AND NOT SPECIFIC ADVICE
61
105
90
85
100
95
110
Q3Q2Q3Q2 Q1Q4Q1 Q4Q2 Q3 Q4 Q1 Q1Q2 Q3 Q4
COVID-19-Exit 2022 considered most likely by surveyed ExecutivesAverage of Executive responses to the question of what scenario would be most likely (April – August 2020)
Updated September 20, 2020
Source: McKinsey analysis, in partnership with Oxford Economics
JulyAprilMay
June AugustCurrentoutcomes1
Are you thinking about…
…what a 2022 COVID-19-Exit Trajectory could look like for your business?
…what Transformation Initiatives you need execute now to ensure you hit your COVID-19-Exit trajectory in stride?
…how to handle the 2021 Transition Year with the opportunity to move on overdue actions (e.g., divestitures), establishing your new, post-COVID-19 operating model, and driving the transformation of the business?
Survey Month
2019 2020 2021 2022
Global Real GDP, indexedUS$, constant prices and exchange rates, 2019 Q4=100
1. Reported data through Q2, Oxford Economics estimate for Q3
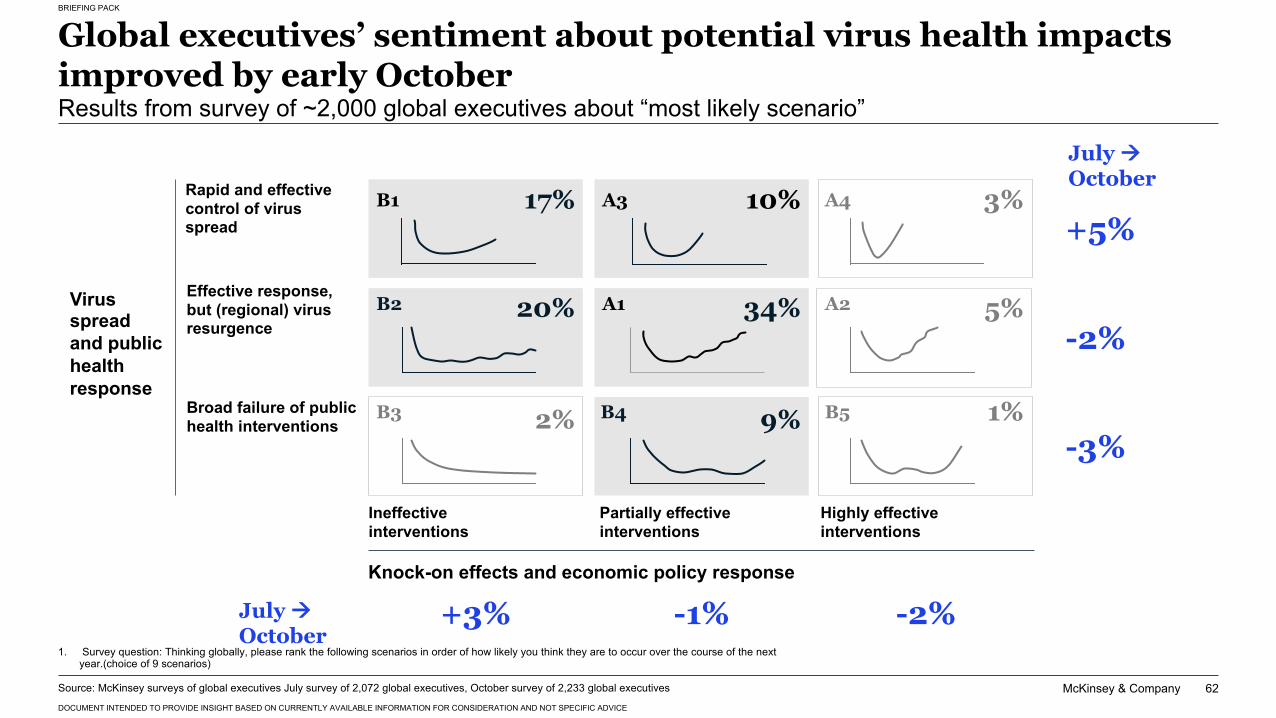
McKinsey & Company
BRIEFING PACK
DOCUMENT INTENDED TO PROVIDE INSIGHT BASED ON CURRENTLY AVAILABLE INFORMATION FOR CONSIDERATION AND NOT SPECIFIC ADVICE
62Source: McKinsey surveys of global executives July survey of 2,072 global executives, October survey of 2,233 global executives
Global executives’ sentiment about potential virus health impacts improved by early OctoberResults from survey of ~2,000 global executives about “most likely scenario”
1. Survey question: Thinking globally, please rank the following scenarios in order of how likely you think they are to occur over the course of the next year.(choice of 9 scenarios)
9%
10% 3%
34%
17%
Virus spread and public health response
Effective response, but (regional) virus resurgence
Broad failure of public health interventions
Rapid and effective control of virus spread
Knock-on effects and economic policy response
Ineffective interventions
Partially effective interventions
Highly effective interventions
A3
A1 A2
A4B1
B2
B3 B4 B5
20%
2%
5%
1%
+5%
-2%
-3%
July àOctober
+3% -1% -2%July àOctober
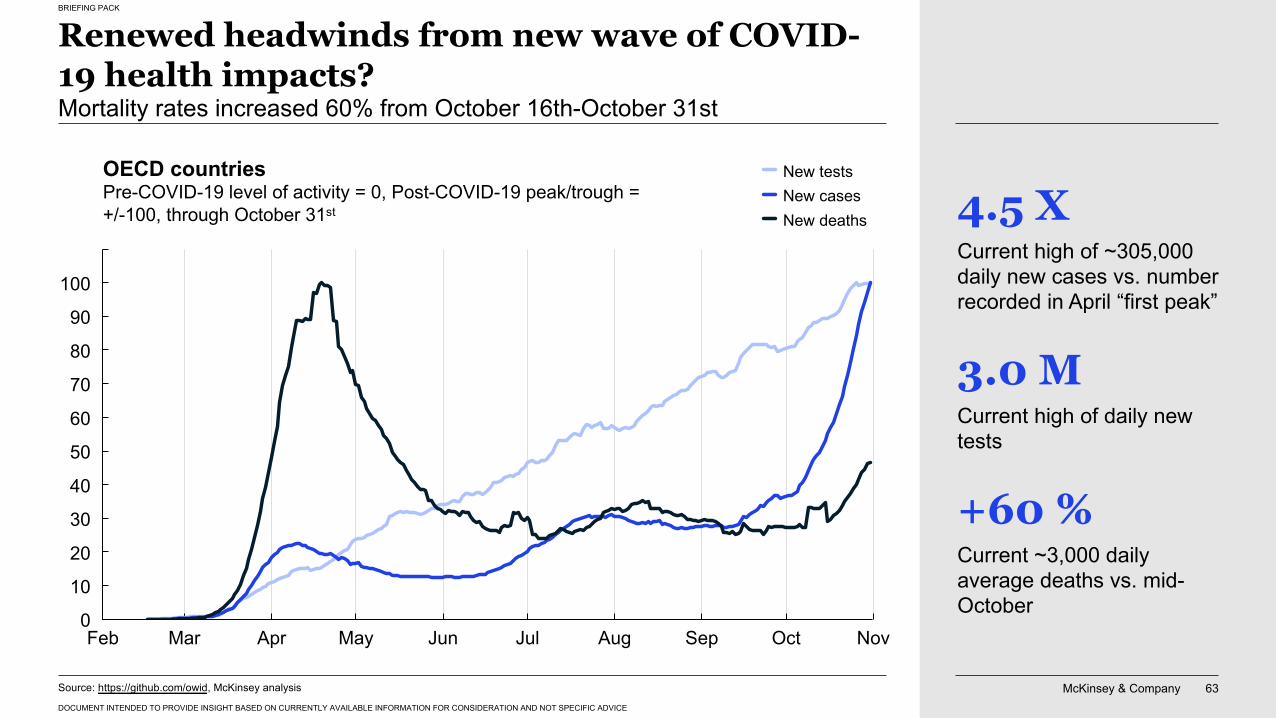
McKinsey & Company 63
BRIEFING PACK
DOCUMENT INTENDED TO PROVIDE INSIGHT BASED ON CURRENTLY AVAILABLE INFORMATION FOR CONSIDERATION AND NOT SPECIFIC ADVICE
Renewed headwinds from new wave of COVID-19 health impacts?Mortality rates increased 60% from October 16th-October 31st
OECD countriesPre-COVID-19 level of activity = 0, Post-COVID-19 peak/trough = +/-100, through October 31st
May Jun Jul
70
90
Apr Aug
30
100
MarFeb OctSep Nov0
10
20
50
60
80
40
Source: https://github.com/owid, McKinsey analysis
New tests
New deathsNew cases
+60 %Current ~3,000 daily average deaths vs. mid-October
4.5 XCurrent high of ~305,000 daily new cases vs. number recorded in April “first peak”
3.0 MCurrent high of daily new tests
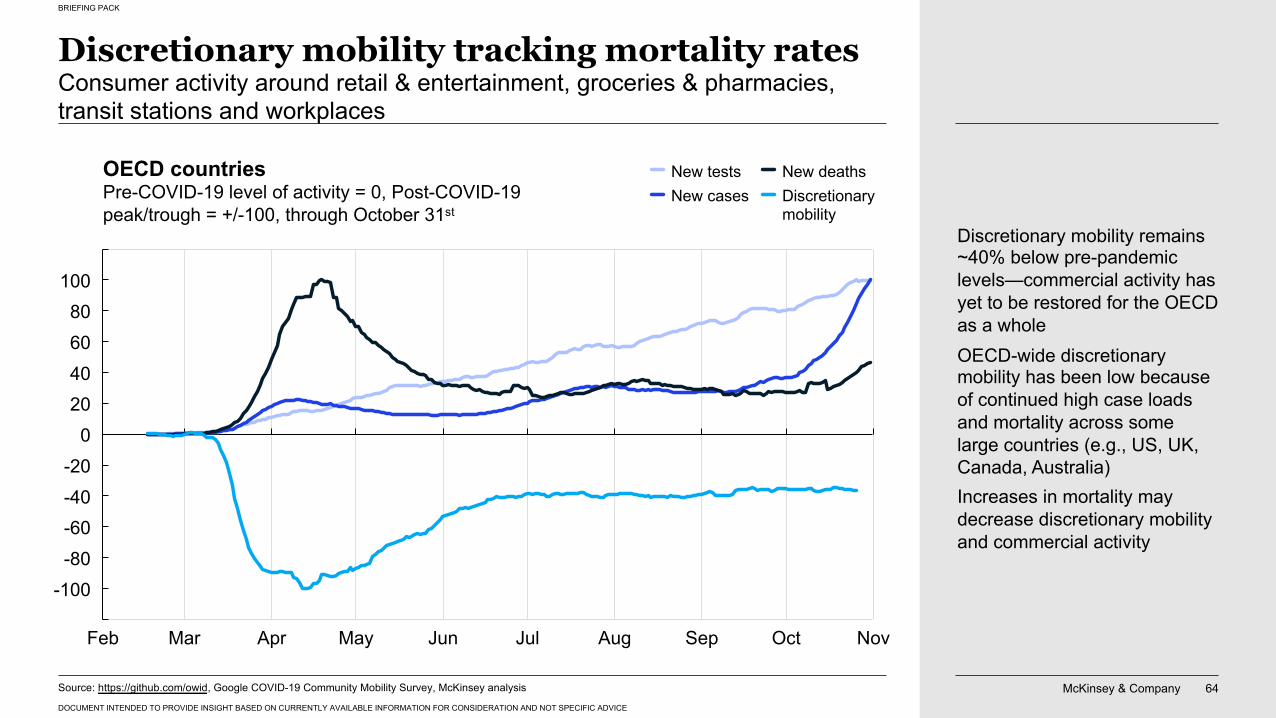
McKinsey & Company 64
BRIEFING PACK
DOCUMENT INTENDED TO PROVIDE INSIGHT BASED ON CURRENTLY AVAILABLE INFORMATION FOR CONSIDERATION AND NOT SPECIFIC ADVICE
Discretionary mobility tracking mortality ratesConsumer activity around retail & entertainment, groceries & pharmacies, transit stations and workplaces
OECD countriesPre-COVID-19 level of activity = 0, Post-COVID-19 peak/trough = +/-100, through October 31st
0
MarFeb
-80
SepJul
80
OctAugMay NovApr
100
Jun
-100
-20-40
204060
-60
Source: https://github.com/owid, Google COVID-19 Community Mobility Survey, McKinsey analysis
New testsNew cases
New deathsDiscretionarymobility
Discretionary mobility remains ~40% below pre-pandemic levels—commercial activity has yet to be restored for the OECD as a wholeOECD-wide discretionary mobility has been low because of continued high case loads and mortality across some large countries (e.g., US, UK, Canada, Australia)Increases in mortality may decrease discretionary mobility and commercial activity
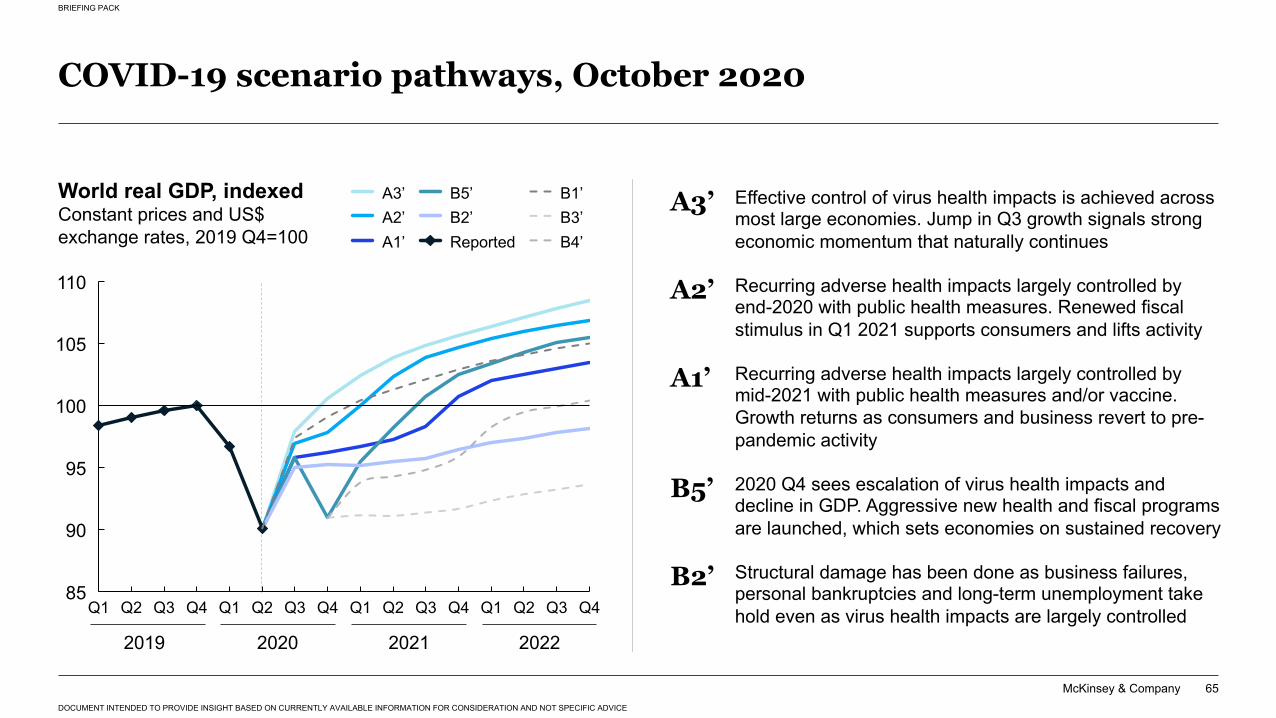
McKinsey & Company
BRIEFING PACK
DOCUMENT INTENDED TO PROVIDE INSIGHT BASED ON CURRENTLY AVAILABLE INFORMATION FOR CONSIDERATION AND NOT SPECIFIC ADVICE
65
COVID-19 scenario pathways, October 2020
A3’A2’ B2’A1’
B5’
Reported
B1’B3’B4’
2019 2020 2021 2022
World real GDP, indexedConstant prices and US$ exchange rates, 2019 Q4=100
A3’ Effective control of virus health impacts is achieved across most large economies. Jump in Q3 growth signals strong economic momentum that naturally continues
A2’ Recurring adverse health impacts largely controlled by end-2020 with public health measures. Renewed fiscal stimulus in Q1 2021 supports consumers and lifts activity
A1’ Recurring adverse health impacts largely controlled by mid-2021 with public health measures and/or vaccine. Growth returns as consumers and business revert to pre-pandemic activity
B5’ 2020 Q4 sees escalation of virus health impacts and decline in GDP. Aggressive new health and fiscal programs are launched, which sets economies on sustained recovery
B2’ Structural damage has been done as business failures, personal bankruptcies and long-term unemployment take hold even as virus health impacts are largely controlled
110
95
85
90
100
105
Q3Q1 Q2 Q4 Q1 Q2Q2 Q3 Q4 Q1 Q2 Q3 Q4 Q1 Q3 Q4
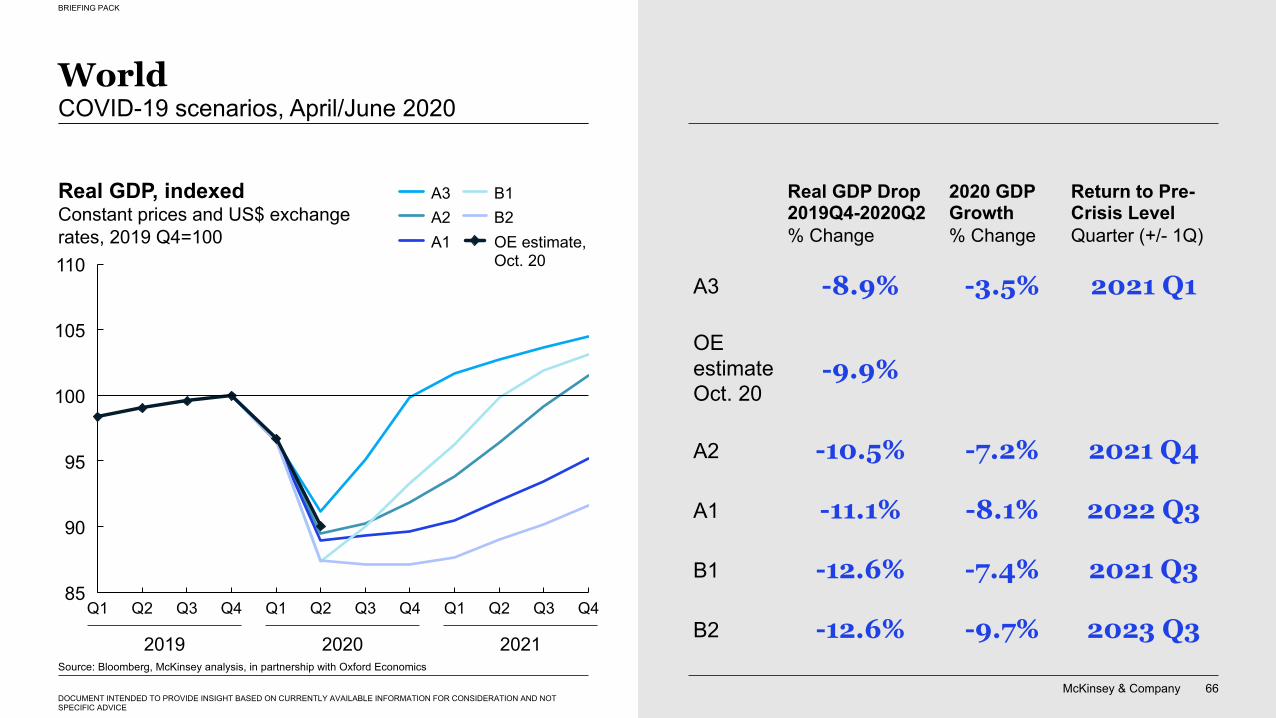
McKinsey & Company 66
BRIEFING PACK
DOCUMENT INTENDED TO PROVIDE INSIGHT BASED ON CURRENTLY AVAILABLE INFORMATION FOR CONSIDERATION AND NOT SPECIFIC ADVICE
WorldCOVID-19 scenarios, April/June 2020
2019 2020 2021Source: Bloomberg, McKinsey analysis, in partnership with Oxford Economics
Real GDP Drop 2019Q4-2020Q2 % Change
2020 GDP Growth% Change
Return to Pre-Crisis LevelQuarter (+/- 1Q)
A2A3 B1
A1B2OE estimate, Oct. 20
-8.9% 2021 Q1-3.5%A3
-10.5% 2021 Q4-7.2%A2
-11.1% 2022 Q3-8.1%A1
-12.6% 2021 Q3-7.4%B1
-12.6% 2023 Q3-9.7%B2
-9.9%OE estimateOct. 20
90
85
95
105
110
100
Q2Q1 Q2 Q3 Q4 Q1 Q3 Q4 Q1 Q2 Q3 Q4
Real GDP, indexedConstant prices and US$ exchange rates, 2019 Q4=100
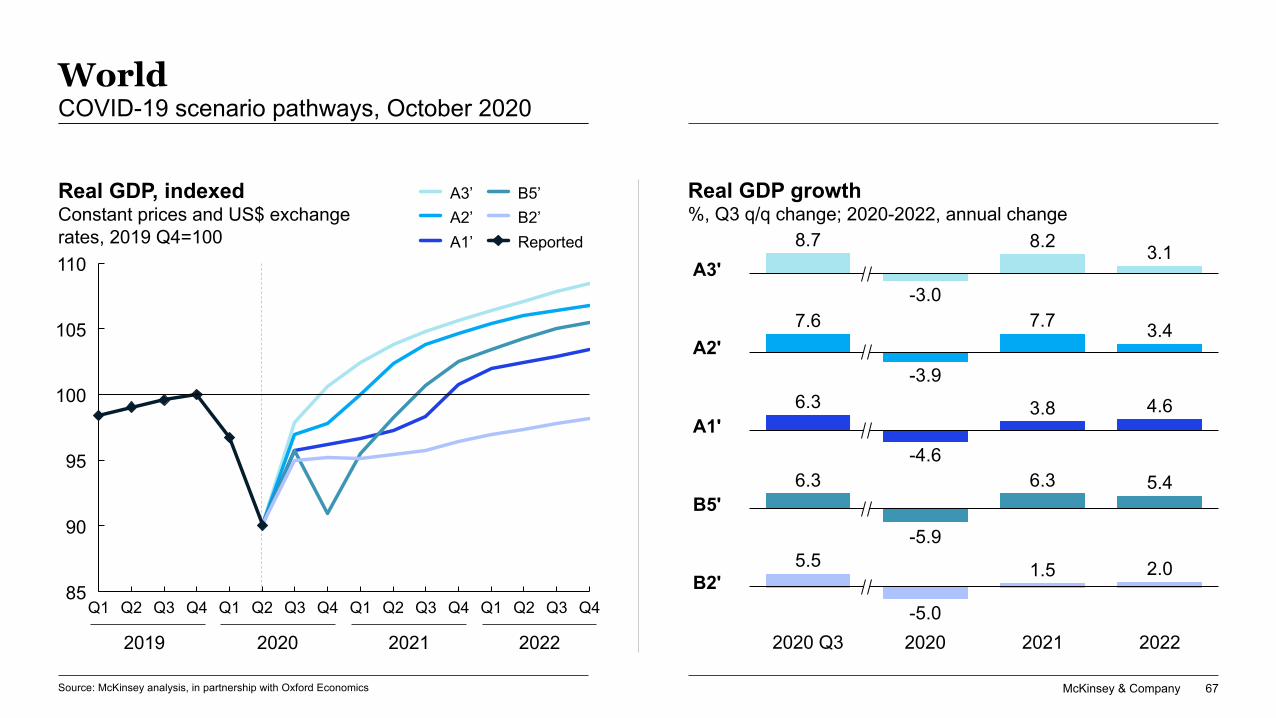
McKinsey & Company 67
WorldCOVID-19 scenario pathways, October 2020
Source: McKinsey analysis, in partnership with Oxford Economics
5.5
-5.0
1.5 2.0
6.3
-5.9
6.3 5.4
6.3
-4.6
3.8 4.6
7.6
-3.9
7.7 3.4
8.7
-3.0
8.2 3.1
Real GDP growth%, Q3 q/q change; 2020-2022, annual change
A3’
A1’A2’
B5’B2’Reported
A1'
A3'
A2'
B5'
B2'
2020 Q3 2020 2021 20222019 2020 2021 2022
Real GDP, indexedConstant prices and US$ exchange rates, 2019 Q4=100110
100
90
85
95
105
Q2 Q2 Q4Q1 Q3 Q4 Q2Q1 Q3 Q4 Q1 Q3 Q1 Q2 Q3 Q4
BRIEFING PACK
Contents
McKinsey & Company 68
COVID-19:The situation now
01Therapeutics and vaccines landscape overview
02
Appendix: Scenarios deep-dives
03Pathways towards a COVID-19-Exit
06The ‘Return to Work checklist’
05The ‘Emerging Resilients’: Achieving escape velocity
04
BRIEFING PACK
DOCUMENT INTENDED TO PROVIDE INSIGHT BASED ON CURRENTLY AVAILABLE INFORMATION FOR CONSIDERATION AND NOT SPECIFIC ADVICE
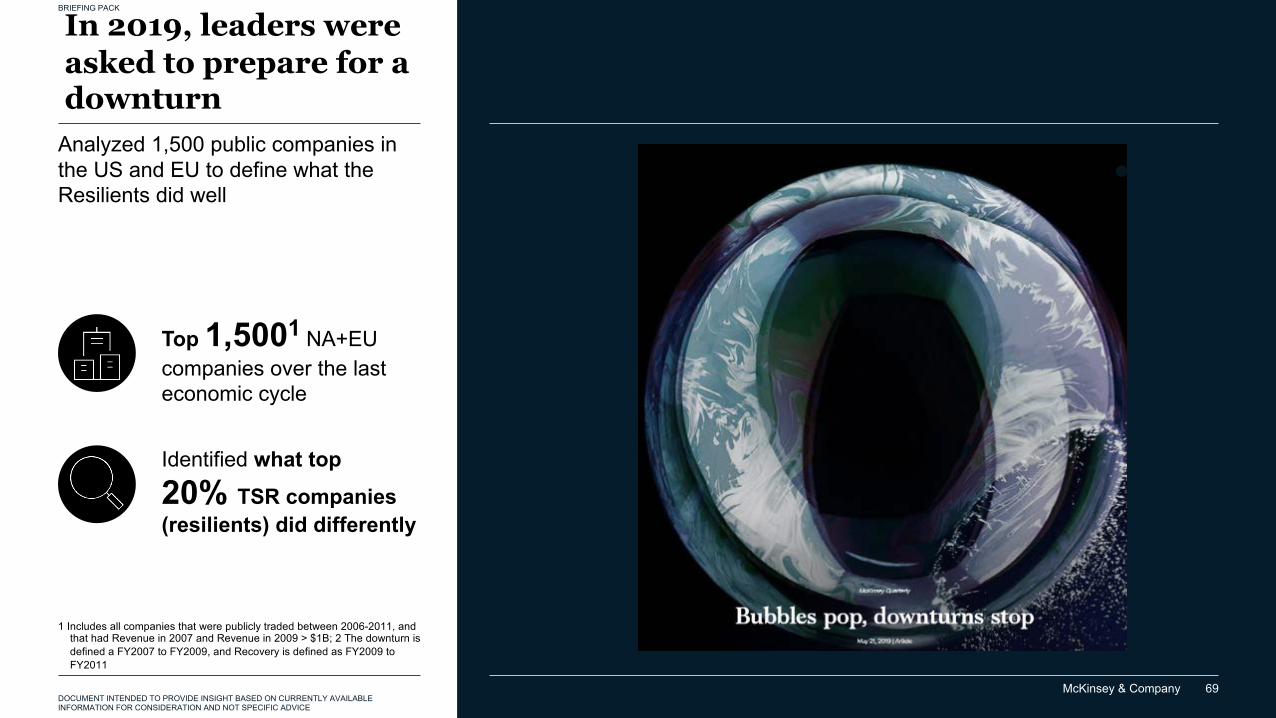
McKinsey & Company 69
BRIEFING PACK
DOCUMENT INTENDED TO PROVIDE INSIGHT BASED ON CURRENTLY AVAILABLE INFORMATION FOR CONSIDERATION AND NOT SPECIFIC ADVICE
In 2019, leaders were asked to prepare for a downturn
Analyzed 1,500 public companies in the US and EU to define what the Resilients did well
1 Includes all companies that were publicly traded between 2006-2011, and that had Revenue in 2007 and Revenue in 2009 > $1B; 2 The downturn is defined a FY2007 to FY2009, and Recovery is defined as FY2009 to FY2011
Top 1,5001 NA+EU companies over the last economic cycle
Identified what top 20% TSR companies (resilients) did differently
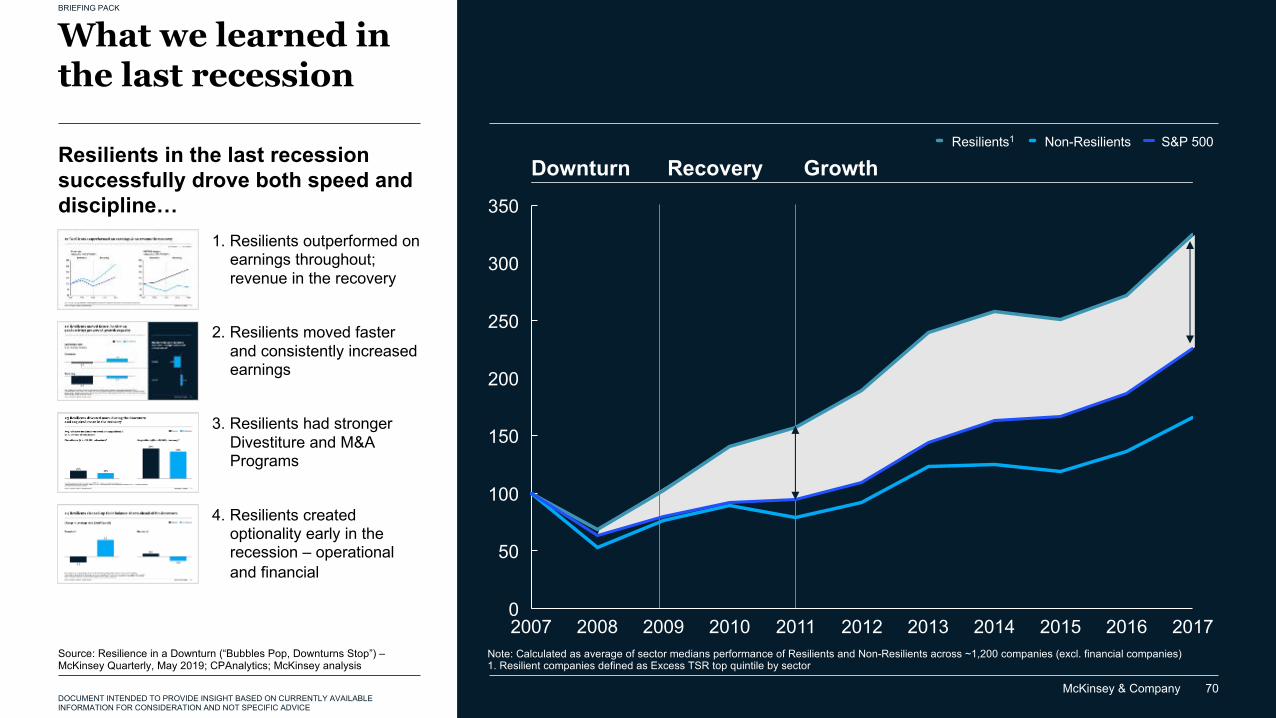
McKinsey & Company 70
BRIEFING PACK
DOCUMENT INTENDED TO PROVIDE INSIGHT BASED ON CURRENTLY AVAILABLE INFORMATION FOR CONSIDERATION AND NOT SPECIFIC ADVICE
What we learned in the last recession
2. Resilients moved faster and consistently increased earnings
1. Resilients outperformed on earnings throughout; revenue in the recovery
4. Resilients created optionality early in the recession – operationaland financial
3. Resilients had stronger Divestiture and M&A Programs
Source: Resilience in a Downturn (“Bubbles Pop, Downturns Stop”) –McKinsey Quarterly, May 2019; CPAnalytics; McKinsey analysis
Note: Calculated as average of sector medians performance of Resilients and Non-Resilients across ~1,200 companies (excl. financial companies)1. Resilient companies defined as Excess TSR top quintile by sector
Resilients in the last recession successfully drove both speed and discipline…
2012 20152007 2008 2010
250
201320112009 2014 2016 20170
50
100
150
200
300
350
Downturn Recovery GrowthResilients1 Non-Resilients S&P 500
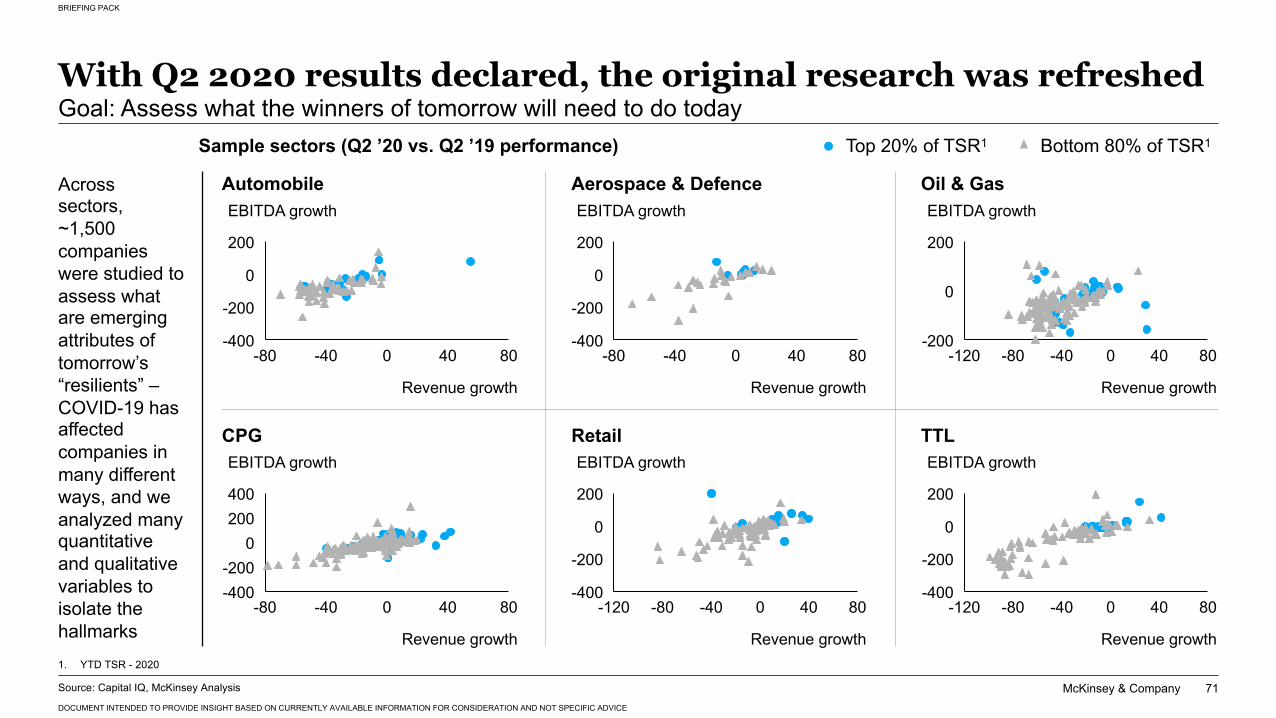
McKinsey & Company
BRIEFING PACK
DOCUMENT INTENDED TO PROVIDE INSIGHT BASED ON CURRENTLY AVAILABLE INFORMATION FOR CONSIDERATION AND NOT SPECIFIC ADVICE
71
With Q2 2020 results declared, the original research was refreshedGoal: Assess what the winners of tomorrow will need to do today
80-80 40-40 0-400
-200
0
200
Revenue growth
EBITDA growth
-200
-80-400
80-40 0 40
0
200
Revenue growth
EBITDA growth
-200-120 -80 0-40 8040
0
200
Revenue growth
EBITDA growth
-200
-80-400
0-40 40 80
0200400
EBITDA growth
Revenue growth
-120 -40-80 800 40-400
-200
0
200
Revenue growth
EBITDA growth
-400-120 -80 0-40 40 80
-200
0
200
Revenue growth
EBITDA growth
Automobile Aerospace & Defence Oil & Gas
CPG Retail TTL
Source: Capital IQ, McKinsey Analysis
Across sectors, ~1,500 companies were studied to assess what are emerging attributes of tomorrow’s “resilients” –COVID-19 has affected companies in many different ways, and we analyzed many quantitative and qualitative variables to isolate the hallmarks
Sample sectors (Q2 ’20 vs. Q2 ’19 performance) Top 20% of TSR1 Bottom 80% of TSR1
1. YTD TSR - 2020
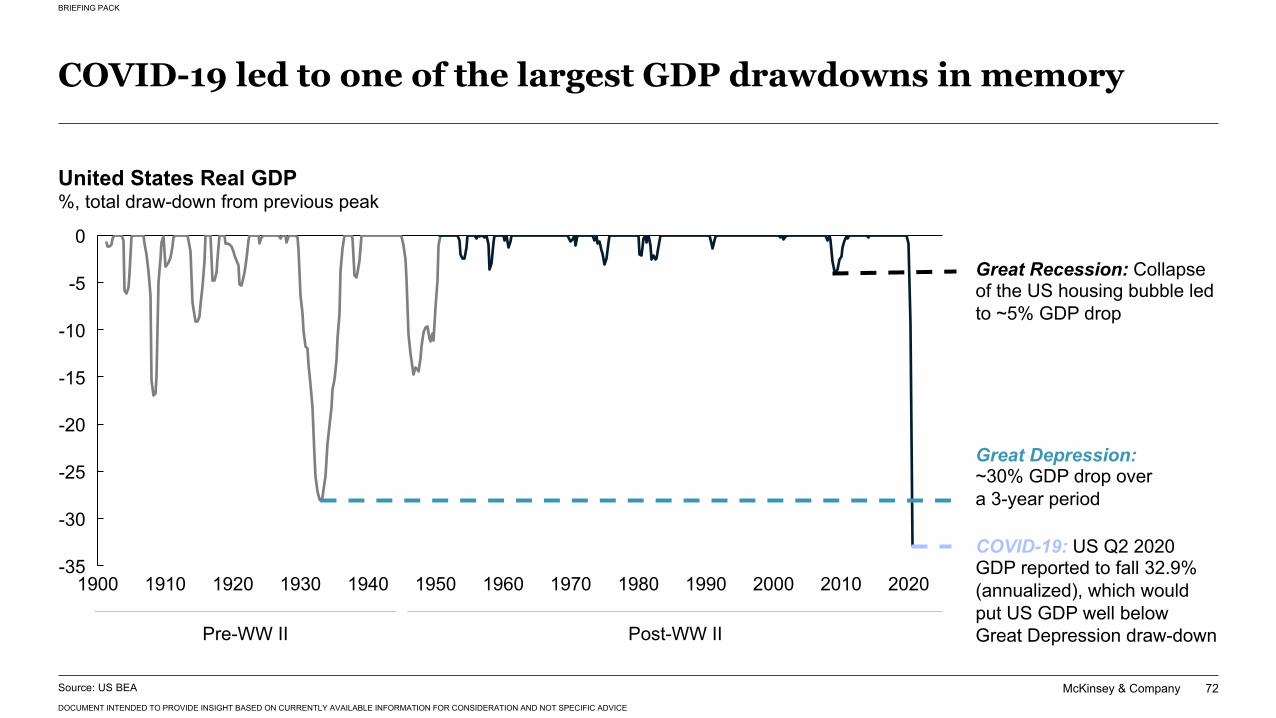
McKinsey & Company
BRIEFING PACK
DOCUMENT INTENDED TO PROVIDE INSIGHT BASED ON CURRENTLY AVAILABLE INFORMATION FOR CONSIDERATION AND NOT SPECIFIC ADVICE
72
COVID-19 led to one of the largest GDP drawdowns in memory
0
-20
-35
-30
-25
-10
-15
-5
20001900 1910 19401920 1930 1950 1960 1970 1980 1990 2010 2020
Pre-WW II Post-WW II
COVID-19: US Q2 2020 GDP reported to fall 32.9% (annualized), which would put US GDP well below Great Depression draw-down
United States Real GDP %, total draw-down from previous peak
Great Depression:~30% GDP drop over a 3-year period
Great Recession: Collapse of the US housing bubble led to ~5% GDP drop
Source: US BEA
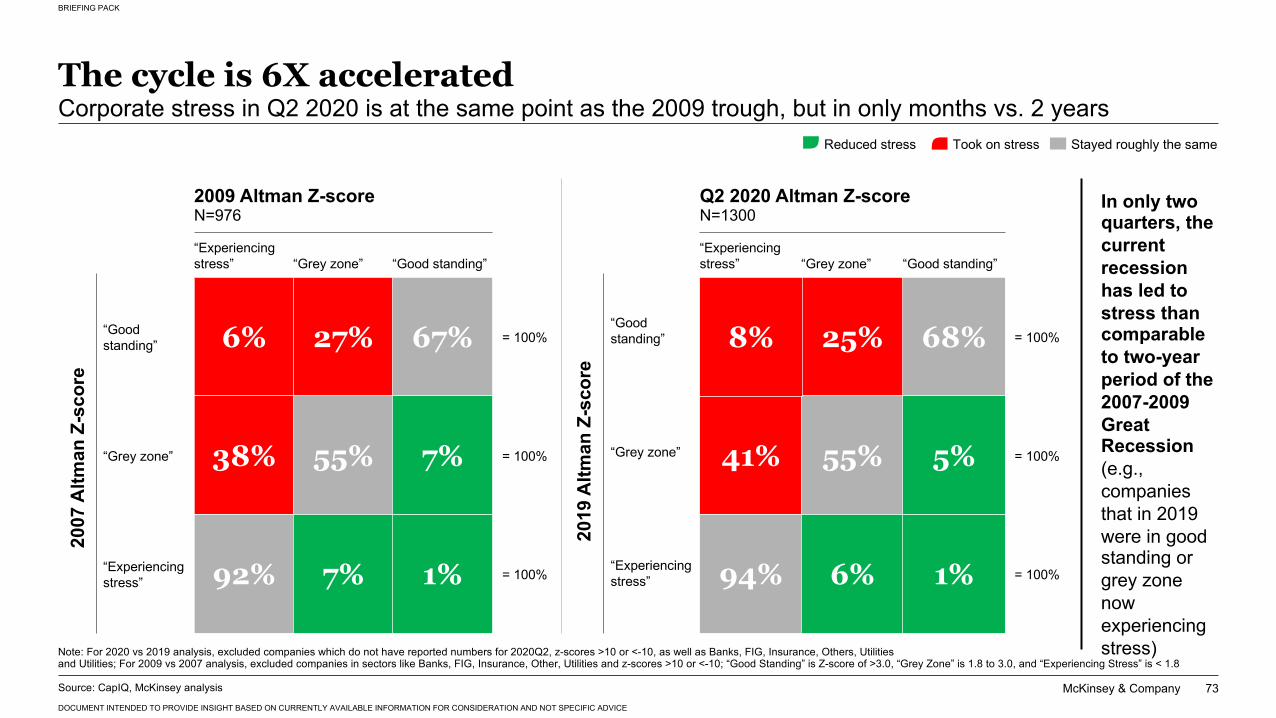
McKinsey & Company
BRIEFING PACK
DOCUMENT INTENDED TO PROVIDE INSIGHT BASED ON CURRENTLY AVAILABLE INFORMATION FOR CONSIDERATION AND NOT SPECIFIC ADVICE
73
The cycle is 6X acceleratedCorporate stress in Q2 2020 is at the same point as the 2009 trough, but in only months vs. 2 years
Note: For 2020 vs 2019 analysis, excluded companies which do not have reported numbers for 2020Q2, z-scores >10 or <-10, as well as Banks, FIG, Insurance and UtilitiesFor 2009 vs 2007 analysis, excluded companies in sectors like Banks, FIG, Insurance, Utilities and z-scores >10 or <-10
2007
Altm
an Z
-sco
re
“Good standing”
“Grey zone”
“Experiencing stress”
2007
Altm
an Z
-sco
re
2009 Altman Z-scoreN=976
“Experiencing stress” “Grey zone” “Good standing”
6% 27% 67%
38% 55% 7%
92% 7% 1%
“Good standing”
“Grey zone”
“Experiencing stress”
2019
Altm
an Z
-sco
re
“Experiencing stress” “Grey zone” “Good standing”
25% 68%
41% 55% 5%
Q2 2020 Altman Z-scoreN=1300
8%
94% 6% 1%
= 100%
= 100%
= 100%
= 100%
= 100%
= 100%
In only two quarters, the current recession has led to stress than comparable to two-year period of the 2007-2009 Great Recession (e.g., companies that in 2019 were in good standing or grey zone now experiencing stress)
Stayed roughly the sameTook on stressReduced stress
Note: For 2020 vs 2019 analysis, excluded companies which do not have reported numbers for 2020Q2, z-scores >10 or <-10, as well as Banks, FIG, Insurance, Others, Utilitiesand Utilities; For 2009 vs 2007 analysis, excluded companies in sectors like Banks, FIG, Insurance, Other, Utilities and z-scores >10 or <-10; “Good Standing” is Z-score of >3.0, “Grey Zone” is 1.8 to 3.0, and “Experiencing Stress” is < 1.8
Source: CapIQ, McKinsey analysis
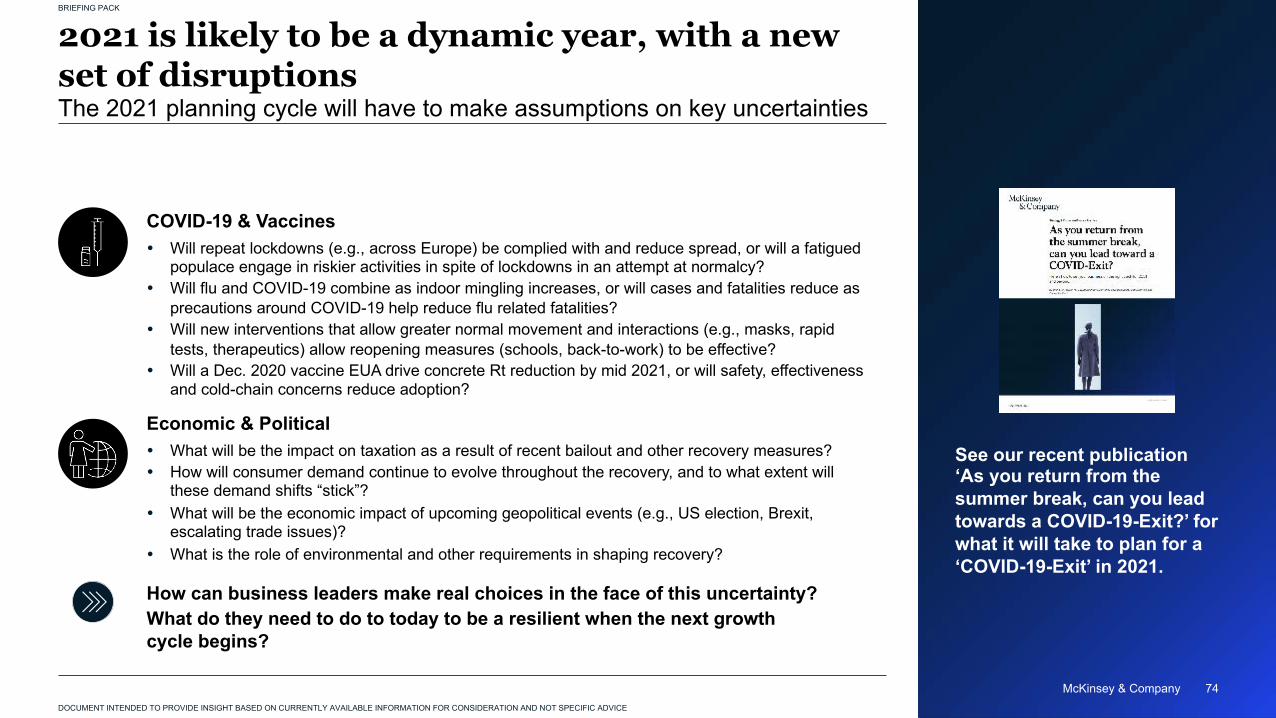
McKinsey & Company 74
BRIEFING PACK
DOCUMENT INTENDED TO PROVIDE INSIGHT BASED ON CURRENTLY AVAILABLE INFORMATION FOR CONSIDERATION AND NOT SPECIFIC ADVICE
McKinsey & Company 74
2021 is likely to be a dynamic year, with a new set of disruptionsThe 2021 planning cycle will have to make assumptions on key uncertainties
COVID-19 & Vaccines
Economic & Political
� Will repeat lockdowns (e.g., across Europe) be complied with and reduce spread, or will a fatigued populace engage in riskier activities in spite of lockdowns in an attempt at normalcy?
� Will flu and COVID-19 combine as indoor mingling increases, or will cases and fatalities reduce as precautions around COVID-19 help reduce flu related fatalities?
� Will new interventions that allow greater normal movement and interactions (e.g., masks, rapid tests, therapeutics) allow reopening measures (schools, back-to-work) to be effective?
� Will a Dec. 2020 vaccine EUA drive concrete Rt reduction by mid 2021, or will safety, effectiveness and cold-chain concerns reduce adoption?
� What will be the impact on taxation as a result of recent bailout and other recovery measures?� How will consumer demand continue to evolve throughout the recovery, and to what extent will
these demand shifts “stick”?� What will be the economic impact of upcoming geopolitical events (e.g., US election, Brexit,
escalating trade issues)?� What is the role of environmental and other requirements in shaping recovery?
How can business leaders make real choices in the face of this uncertainty?What do they need to do to today to be a resilient when the next growth cycle begins?
See our recent publication ‘As you return from the summer break, can you lead towards a COVID-19-Exit?’ for what it will take to plan for a ‘COVID-19-Exit’ in 2021.
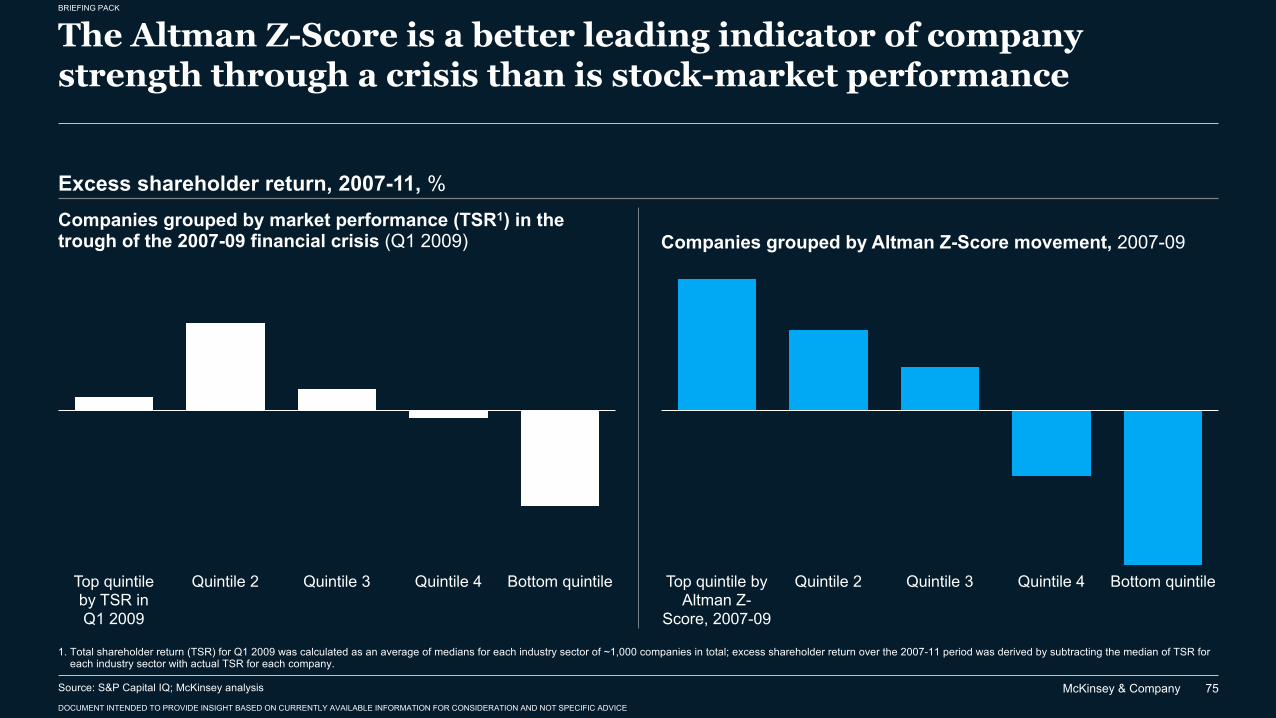
McKinsey & Company
BRIEFING PACK
DOCUMENT INTENDED TO PROVIDE INSIGHT BASED ON CURRENTLY AVAILABLE INFORMATION FOR CONSIDERATION AND NOT SPECIFIC ADVICE
75
The Altman Z-Score is a better leading indicator of company strength through a crisis than is stock-market performance
Excess shareholder return, 2007-11, %Companies grouped by market performance (TSR1) in the trough of the 2007-09 financial crisis (Q1 2009) Companies grouped by Altman Z-Score movement, 2007-09
Top quintile by TSR in Q1 2009
Bottom quintileQuintile 2 Quintile 3 Quintile 4 Bottom quintileQuintile 4Top quintile by Altman Z-
Score, 2007-09
Quintile 2 Quintile 3
1. Total shareholder return (TSR) for Q1 2009 was calculated as an average of medians for each industry sector of ~1,000 companies in total; excess shareholder return over the 2007-11 period was derived by subtracting the median of TSR for each industry sector with actual TSR for each company.
Source: S&P Capital IQ; McKinsey analysis
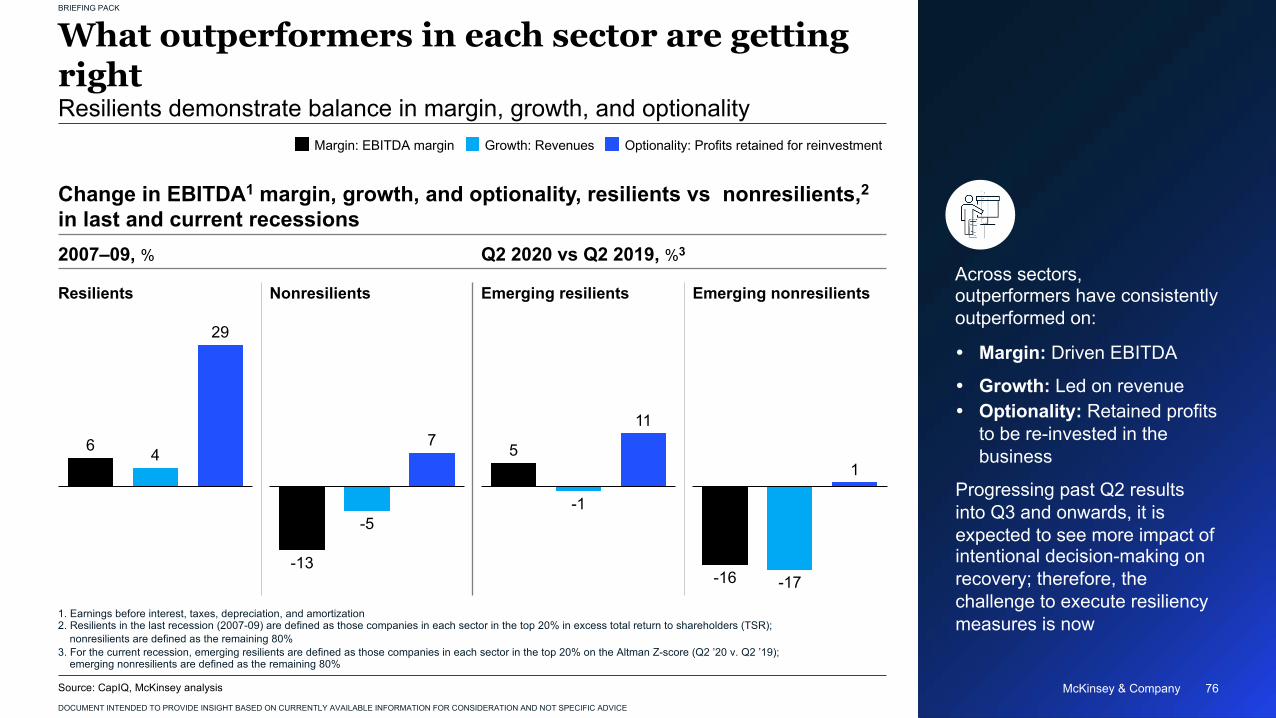
McKinsey & Company 76
BRIEFING PACK
DOCUMENT INTENDED TO PROVIDE INSIGHT BASED ON CURRENTLY AVAILABLE INFORMATION FOR CONSIDERATION AND NOT SPECIFIC ADVICE
McKinsey & Company 76
What outperformers in each sector are getting right
Across sectors, outperformers have consistently outperformed on:
� Margin: Driven EBITDA
� Growth: Led on revenue� Optionality: Retained profits
to be re-invested in the business
Progressing past Q2 results into Q3 and onwards, it is expected to see more impact of intentional decision-making on recovery; therefore, the challenge to execute resiliency measures is now
Source: CapIQ, McKinsey analysis
1. Earnings before interest, taxes, depreciation, and amortization2. Resilients in the last recession (2007-09) are defined as those companies in each sector in the top 20% in excess total return to shareholders (TSR);
nonresilients are defined as the remaining 80%3. For the current recession, emerging resilients are defined as those companies in each sector in the top 20% on the Altman Z-score (Q2 ’20 v. Q2 ’19);
emerging nonresilients are defined as the remaining 80%
Change in EBITDA1 margin, growth, and optionality, resilients vs nonresilients,2in last and current recessions2007–09, %
Resilients Nonresilients Emerging resilients Emerging nonresilients
Q2 2020 vs Q2 2019, %3
6 4
29
-13
-5
7 5
-1
11
-16 -17
1
Margin: EBITDA margin Growth: Revenues Optionality: Profits retained for reinvestment
Resilients demonstrate balance in margin, growth, and optionality
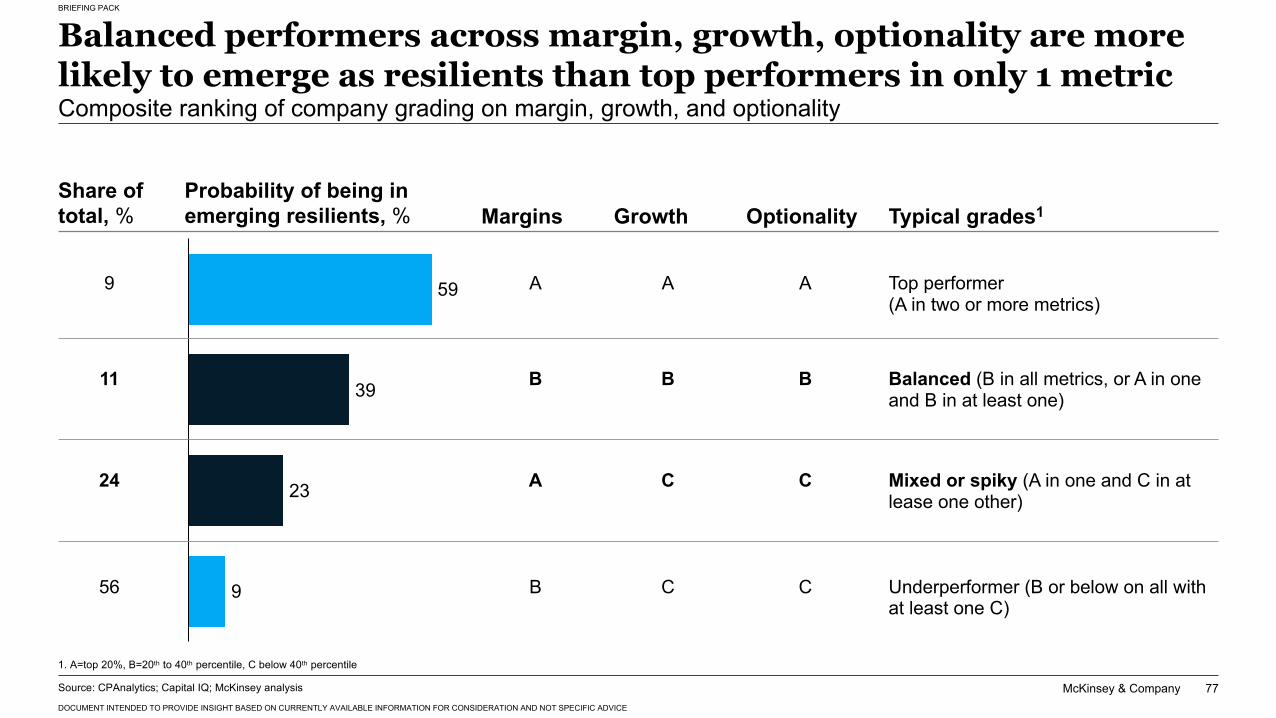
McKinsey & Company
BRIEFING PACK
DOCUMENT INTENDED TO PROVIDE INSIGHT BASED ON CURRENTLY AVAILABLE INFORMATION FOR CONSIDERATION AND NOT SPECIFIC ADVICE
77
Balanced performers across margin, growth, optionality are more likely to emerge as resilients than top performers in only 1 metricComposite ranking of company grading on margin, growth, and optionality
Share of total, %
Probability of being in emerging resilients, % Margins Growth Optionality Typical grades1
9 A A A Top performer (A in two or more metrics)
11 B B B Balanced (B in all metrics, or A in one and B in at least one)
24 A C C Mixed or spiky (A in one and C in at lease one other)
56 B C C Underperformer (B or below on all with at least one C)
59
39
23
9
1. A=top 20%, B=20th to 40th percentile, C below 40th percentile
Source: CPAnalytics; Capital IQ; McKinsey analysis
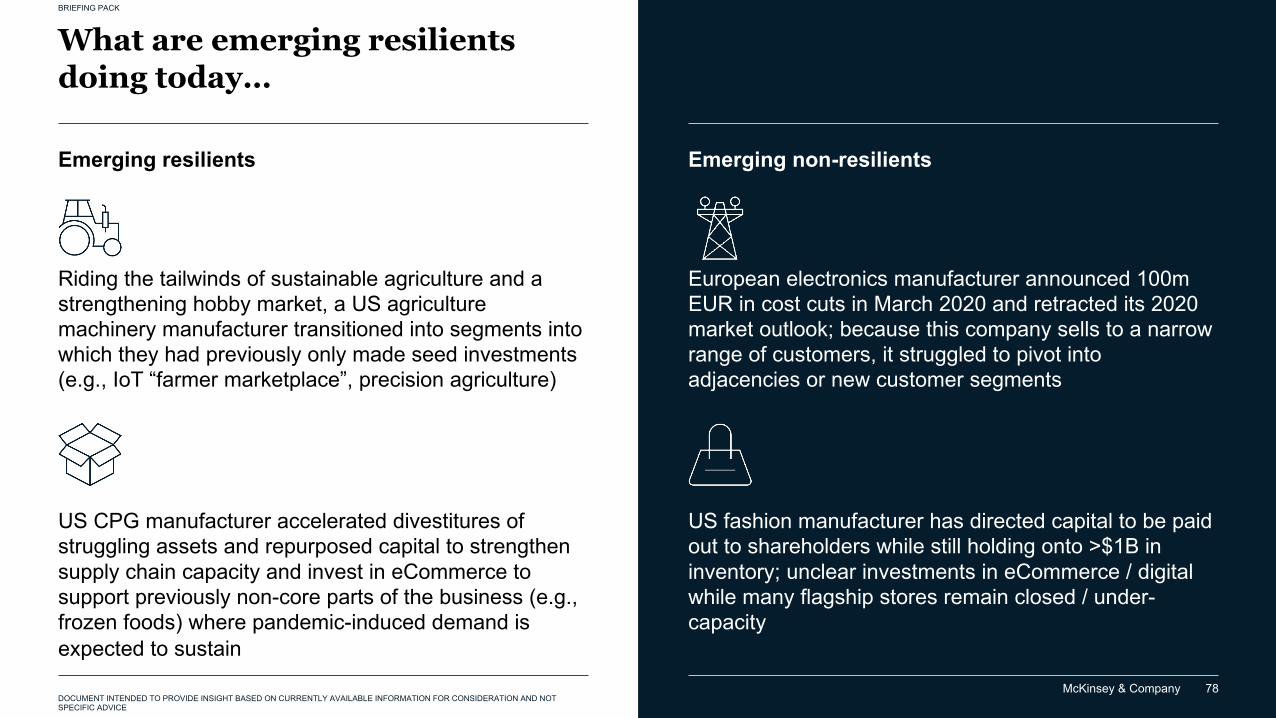
McKinsey & Company 78
BRIEFING PACK
DOCUMENT INTENDED TO PROVIDE INSIGHT BASED ON CURRENTLY AVAILABLE INFORMATION FOR CONSIDERATION AND NOT SPECIFIC ADVICE
What are emerging resilientsdoing today…
European electronics manufacturer announced 100m EUR in cost cuts in March 2020 and retracted its 2020 market outlook; because this company sells to a narrow range of customers, it struggled to pivot into adjacencies or new customer segments
US fashion manufacturer has directed capital to be paid out to shareholders while still holding onto >$1B in inventory; unclear investments in eCommerce / digital while many flagship stores remain closed / under-capacity
Riding the tailwinds of sustainable agriculture and a strengthening hobby market, a US agriculture machinery manufacturer transitioned into segments into which they had previously only made seed investments (e.g., IoT “farmer marketplace”, precision agriculture)
US CPG manufacturer accelerated divestitures of struggling assets and repurposed capital to strengthen supply chain capacity and invest in eCommerce to support previously non-core parts of the business (e.g., frozen foods) where pandemic-induced demand is expected to sustain
Emerging non-resilientsEmerging resilients
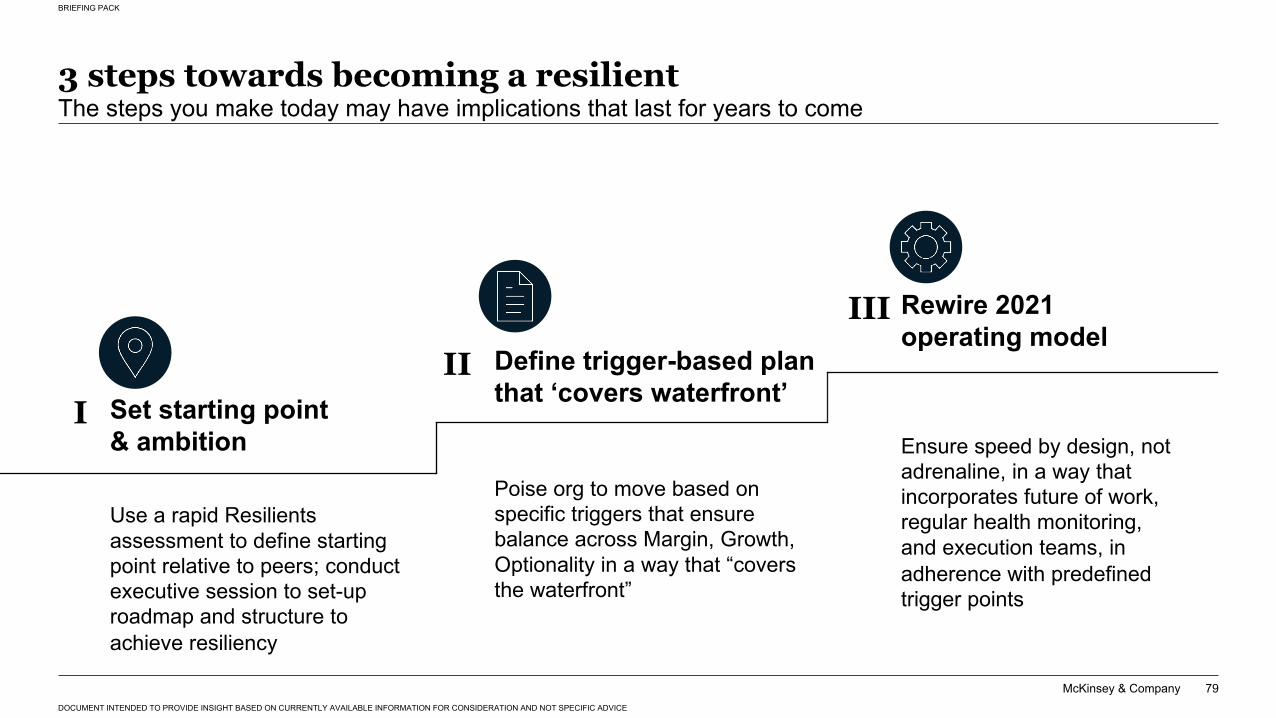
McKinsey & Company
BRIEFING PACK
DOCUMENT INTENDED TO PROVIDE INSIGHT BASED ON CURRENTLY AVAILABLE INFORMATION FOR CONSIDERATION AND NOT SPECIFIC ADVICE
79
3 steps towards becoming a resilientThe steps you make today may have implications that last for years to come
Ensure speed by design, not adrenaline, in a way that incorporates future of work, regular health monitoring, and execution teams, in adherence with predefined trigger points
Use a rapid Resilientsassessment to define starting point relative to peers; conduct executive session to set-up roadmap and structure to achieve resiliency
Poise org to move based on specific triggers that ensure balance across Margin, Growth, Optionality in a way that “covers the waterfront”
Rewire 2021 operating model
Define trigger-based plan that ‘covers waterfront’Set starting point
& ambitionI
II
III

McKinsey & Company 80
BRIEFING PACK
DOCUMENT INTENDED TO PROVIDE INSIGHT BASED ON CURRENTLY AVAILABLE INFORMATION FOR CONSIDERATION AND NOT SPECIFIC ADVICE
I: “Full potential” diagnostic starts with an Altman Z-score scorecard
Source: CPAnalytics; Capital IQ; McKinsey analysis
1. Below 1.8 = Experiencing Stress, between 1.8-3.0 = Grey zone, above 3.0 = Good standing; 2. Top quintile is computed based on individual metrices; 3. R&D not reported for all companies
Altman Z-score1
Below sector median At or above sector top quintileBetween sector median and top quintile
Current recession
Metrics
Margin
Growth
Optionality
EBIT
Retained earnings
Revenue
Working capital
R&D3
EBIT Margin
Sector median
-5%
-2%
-3%
-5%
-2%
-3%
Sector top2
quintile
+37%
+26%
+9%
+4%
+15%
+31%
+23%
-20%
-4%
+44%
NA
+29%
Company X
Current recession (Q2 ’20 vs. Q2 ’19) Last recession (FY2009 vs. FY2007)
Sector median
+1%
+14%
+5%
-6%
+6%
-5%
Sector top2
quintile
+43%
+47%
+25%
+22%
+36%
+20%
Company X
-10%
-6%
-8%
18%
NA
-2%
Is Company X a future resilient?Not likely, because:
� Although close to top quintile on margins, very little of Company X’s margin performance comes from growth – it is coming from cost-cutting
� However, Company X has highoptionality in the form of working capital relative to peers
McKinsey & Company 80
Company X1.8 3.2
Sector median(N = 189)
Q2 ’19:
1.6 2.7Q2 ’20:
Last recessionCompany X3.4 3.2
Sector median(N = 165)
FY07:
2.1 3.0FY09:
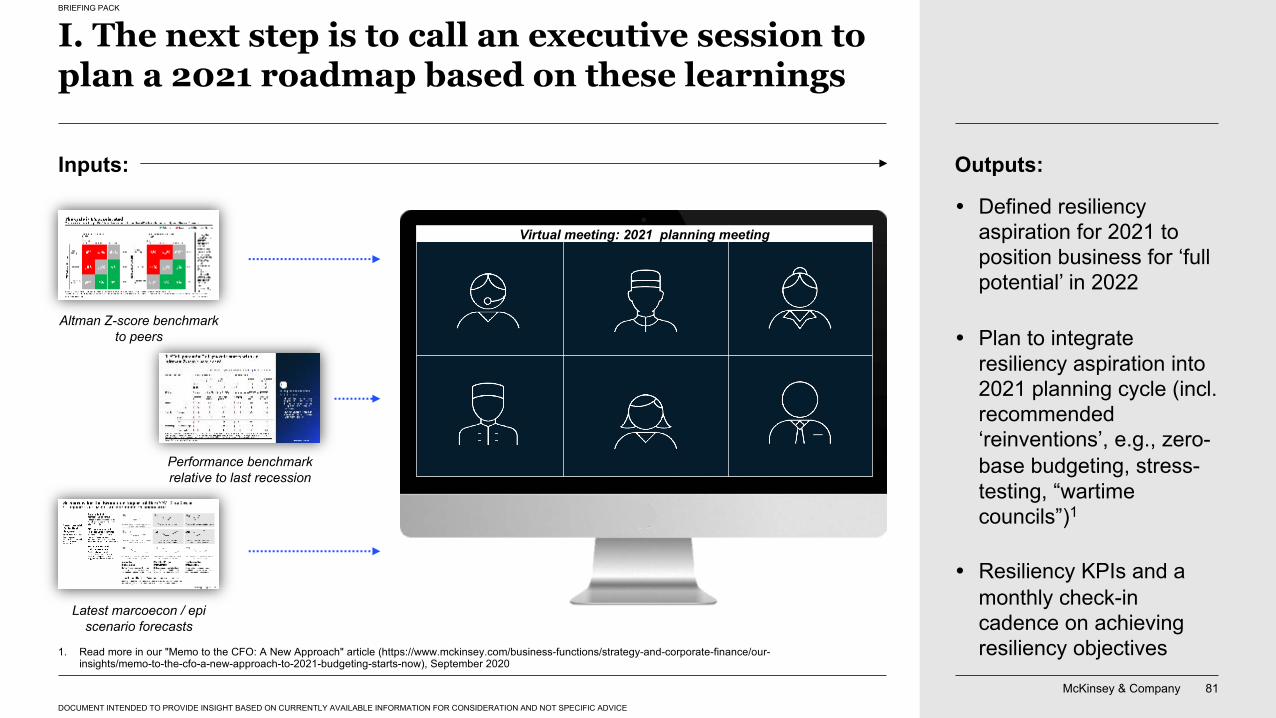
McKinsey & Company 81
BRIEFING PACK
DOCUMENT INTENDED TO PROVIDE INSIGHT BASED ON CURRENTLY AVAILABLE INFORMATION FOR CONSIDERATION AND NOT SPECIFIC ADVICE
I. The next step is to call an executive session to plan a 2021 roadmap based on these learnings
Outputs:Inputs:
Virtual meeting: 2021 planning meeting
Altman Z-score benchmark to peers
Performance benchmark relative to last recession
Latest marcoecon / epi scenario forecasts
� Defined resiliency aspiration for 2021 to position business for ‘full potential’ in 2022
� Plan to integrate resiliency aspiration into 2021 planning cycle (incl. recommended ‘reinventions’, e.g., zero-base budgeting, stress-testing, “wartime councils”)1
� Resiliency KPIs and a monthly check-in cadence on achieving resiliency objectives1. Read more in our "Memo to the CFO: A New Approach" article (https://www.mckinsey.com/business-functions/strategy-and-corporate-finance/our-
insights/memo-to-the-cfo-a-new-approach-to-2021-budgeting-starts-now), September 2020
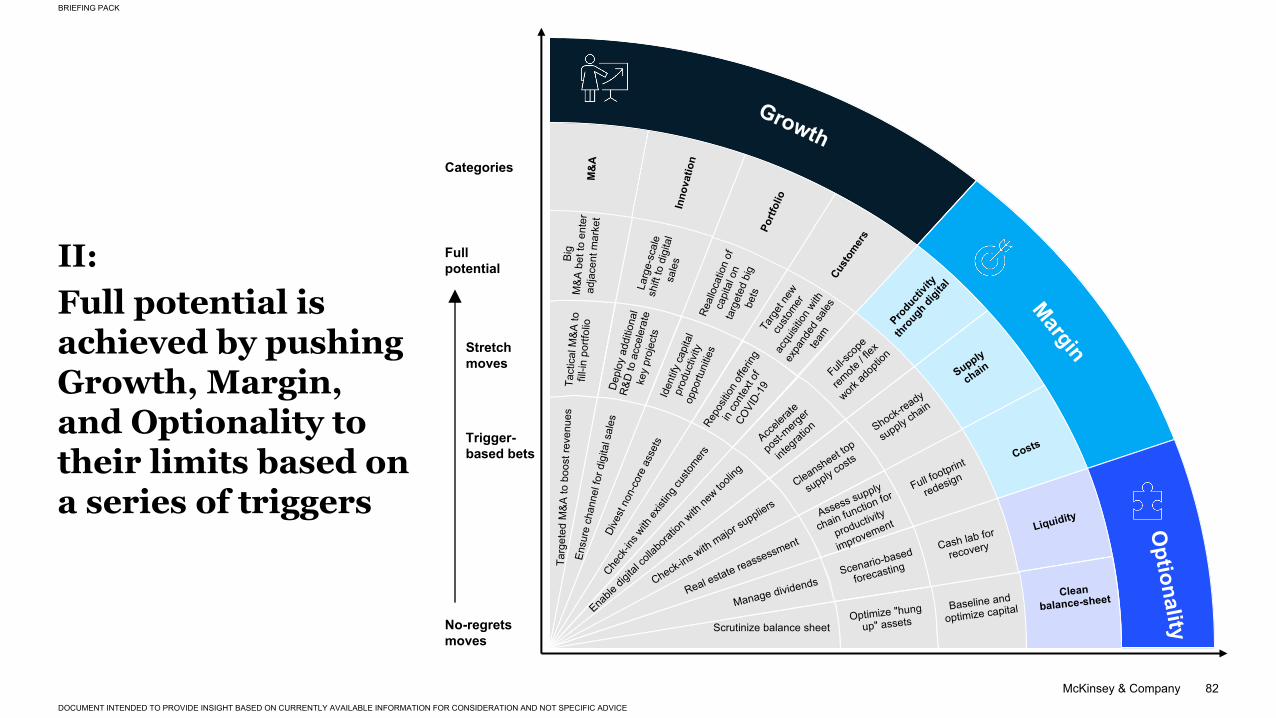
McKinsey & Company 82
Full potential is achieved by pushing Growth, Margin, and Optionality to their limits based on a series of triggers
II: Full potential
Trigger-based bets
No-regrets moves
Categories
Stretch moves
M&
A
Inno
vatio
n
Produ
ctivit
y
throu
gh di
gital
Supply
chain
Liquidity
Clean balance-sheet
Portf
olio
Custo
mer
s
Costs
Big
M&A
bet
to e
nter
ad
jace
nt m
arke
t
Larg
e-sc
ale
shift
to d
igita
l sa
les
Full-sc
ope
remote
/ flex
work ad
optio
n
Shock-ready
supply chain
Cash lab for
recovery
Baseline and
optimize capital
Full footprint
redesign
Real
loca
tion
of
capi
tal o
n ta
rget
ed b
ig
bets
Targ
et ne
w
custo
mer
acqu
isitio
n with
expa
nded
sales
team
Ensu
re c
hann
el fo
r dig
ital s
ales
Enable
digit
al co
llabo
ration
with
new to
oling
Targ
eted
M&A
to b
oost
reve
nues
Check-ins with major suppliers
Manage dividends
Scrutinize balance sheet
Real estate reassessment
Dive
st n
on-c
ore
asse
ts
Check
-ins w
ith ex
isting
custo
mers
Tact
ical
M&A
to
fill-i
n po
rtfol
io
Dep
loy
addi
tiona
l R
&D to
acc
eler
ate
key
proj
ects
Iden
tify
capi
tal
prod
uctiv
ity
oppo
rtuni
ties
Repo
sition
offe
ring
in co
ntex
t of
COVI
D-19
Acceler
ate
post-
merger
integ
ration
Cleansheet top
supply costs
Assess supply
chain function for
productivity
improvement
Scenario-based
forecasting
Optimize "hung
up" assets
Growth
Margin
Optionality
BRIEFING PACK
DOCUMENT INTENDED TO PROVIDE INSIGHT BASED ON CURRENTLY AVAILABLE INFORMATION FOR CONSIDERATION AND NOT SPECIFIC ADVICE
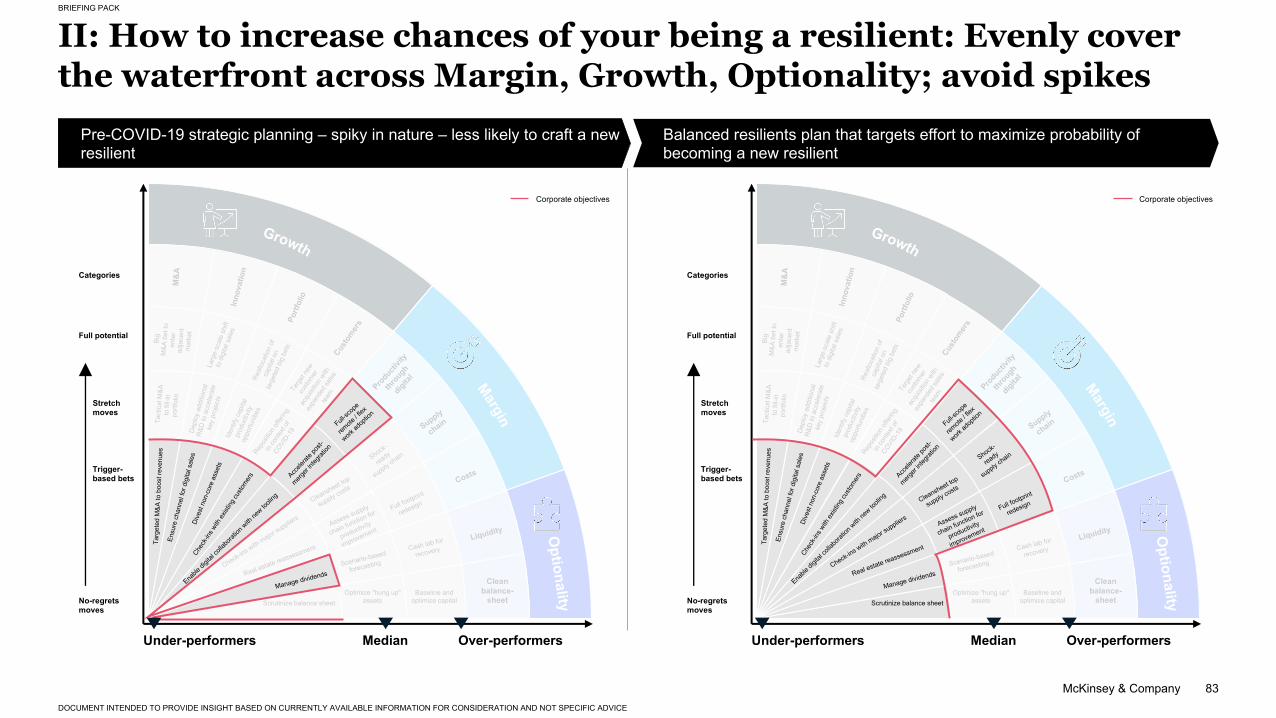
McKinsey & Company 83
II: How to increase chances of your being a resilient: Evenly cover the waterfront across Margin, Growth, Optionality; avoid spikes
Pre-COVID-19 strategic planning – spiky in nature – less likely to craft a new resilient
Balanced resilients plan that targets effort to maximize probability of becoming a new resilient
Full potential
Trigger-based bets
No-regrets moves
Categories
M&
A
Inno
vatio
n
Produ
ctivit
y
throu
gh
digita
l
Supply
chain
Liquidity
Clean balance-
sheet
Portf
olio
Custo
mer
s
Costs
Big
M&A
bet
to
ente
r ad
jace
nt
mar
ket
Larg
e-sc
ale
shift
to
dig
ital s
ales
Shock-
ready
supply chain
Cash lab for
recovery
Baseline and optimize capital
Full footprint
redesign
Real
loca
tion
of
capi
tal o
n ta
rget
ed b
ig b
ets
Targ
et ne
w
custo
mer
acqu
isitio
n with
expa
nded
sales
team
Tact
ical
M&A
to
fill-
in
portf
olio
Dep
loy
addi
tiona
l R
&D to
acc
eler
ate
key
proj
ects
Iden
tify
capi
tal
prod
uctiv
ity
oppo
rtuni
ties
Repos
ition o
fferin
g
in co
ntext
of
COVID-1
9
Cleansheet top
supply costs
Assess supply
chain function for
productivity
improvement
Scenario-based
forecasting
Optimize "hung up" assets
Stretch moves
Over-performersUnder-performers Median
Optionality
Full potential
Trigger-based bets
No-regrets moves
Categories
M&
A
Inno
vatio
n
Produ
ctivit
y
throu
gh
digita
l
Supply
chain
Liquidity
Clean balance-
sheet
Portf
olio
Custo
mer
s
Costs
Big
M&A
bet
to
ente
r ad
jace
nt
mar
ket
Larg
e-sc
ale
shift
to
dig
ital s
ales
Cash lab for
recovery
Baseline and optimize capital
Real
loca
tion
of
capi
tal o
n ta
rget
ed b
ig b
ets
Targ
et ne
w
custo
mer
acqu
isitio
n with
expa
nded
sales
team
Tact
ical
M&A
to
fill-
in
portf
olio
Dep
loy
addi
tiona
l R
&D to
acc
eler
ate
key
proj
ects
Iden
tify
capi
tal
prod
uctiv
ity
oppo
rtuni
ties
Repos
ition o
fferin
g
in co
ntext
of
COVID-1
9
Scenario-based
forecasting
Optimize "hung up" assets
Stretch moves
Over-performersUnder-performers Median
Optionality
Check-ins with major suppliers
Scrutinize balance sheet
Real estate reassessment
Full-sco
pe
remote
/ flex
work ad
optio
n
Ensu
re c
hann
el fo
r dig
ital s
ales
Targ
eted
M&A
to b
oost
reve
nues
Dive
st n
on-c
ore
asse
ts
Chec
k-ins
with
exist
ing cu
stomer
s
Manage dividendsEna
ble di
gital
colla
borat
ion w
ith ne
w tooli
ng
Accele
rate p
ost-
merger
integ
ration
Check-ins with major suppliers
Shock-
ready
supply chain
Full footprint
redesign
Scrutinize balance sheet
Real estate reassessment
Cleansheet top
supply costs
Assess supply
chain function for
productivity
improvement
Ensu
re c
hann
el fo
r dig
ital s
ales
Targ
eted
M&A
to b
oost
reve
nues
Dive
st n
on-c
ore
asse
ts
Chec
k-ins
with
exist
ing cu
stomer
s
Manage dividends
Full-sco
pe
remote
/ flex
work ad
optio
n
Enable
digit
al co
llabo
ration
with
new to
oling
Accele
rate p
ost-
merger
integ
ration
Corporate objectivesCorporate objectives
BRIEFING PACK
DOCUMENT INTENDED TO PROVIDE INSIGHT BASED ON CURRENTLY AVAILABLE INFORMATION FOR CONSIDERATION AND NOT SPECIFIC ADVICE
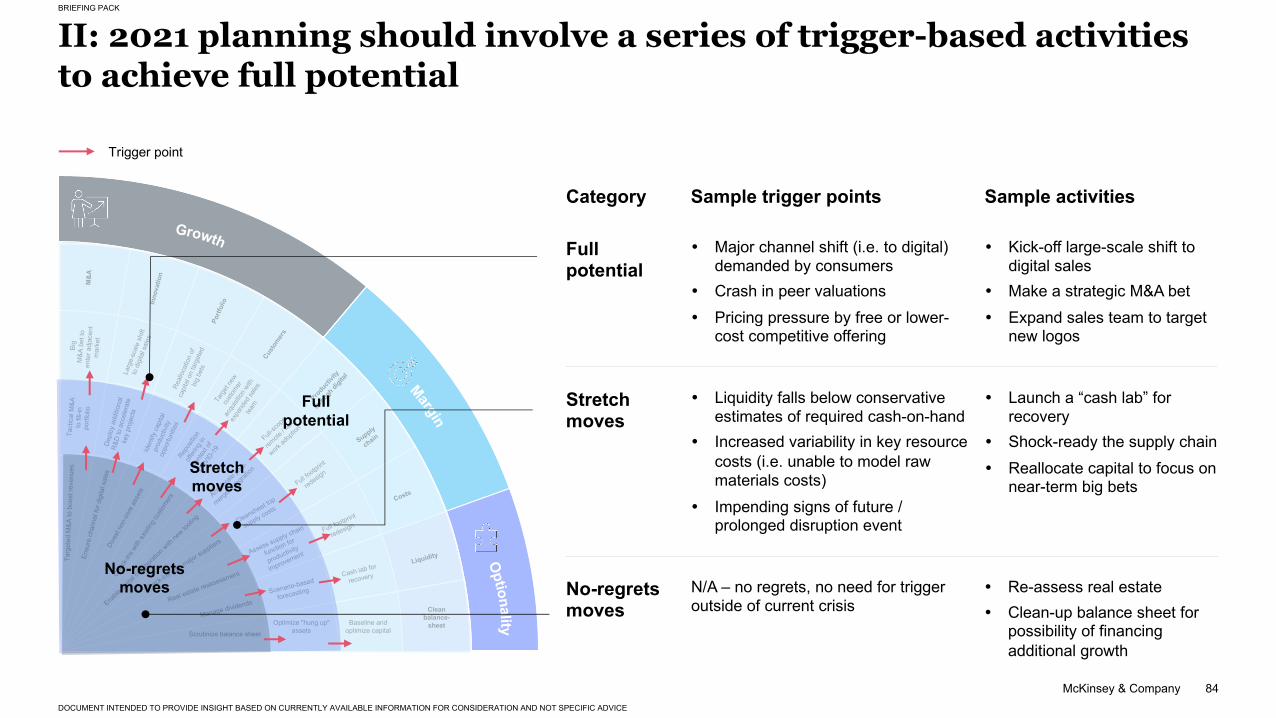
McKinsey & Company 84
II: 2021 planning should involve a series of trigger-based activities to achieve full potential
M&
A
Inno
vatio
n
Produ
ctivit
y
throu
gh di
gital
Supply
chain
Liquidity
Clean balance-
sheet
Portf
olio
Custo
mer
s
Costs
Big
M&A
bet
to
ente
r adj
acen
t m
arke
t
Larg
e-sc
ale
shift
to
dig
ital s
ales
Full-sc
ope
remote
/ flex
work ad
optio
n
Full footprint
redesign
Cash lab for
recovery
Baseline and optimize capital
Full footprint
redesign
Real
loca
tion
of
capi
tal o
n ta
rget
ed
big
bets
Targ
et ne
w
custo
mer
acqu
isitio
n with
expa
nded
sales
team
Ensu
re c
hann
el fo
r dig
ital s
ales
Enable
digit
al co
llabo
ration
with
new to
oling
Targ
eted
M&A
to b
oost
reve
nues
Check-ins with major suppliers
Manage dividends
Scrutinize balance sheet
Real estate reassessment
Dive
st no
n-co
re a
sset
s
Chec
k-ins
with
exist
ing cu
stomer
s
Tact
ical
M&A
to
fill-
in
portf
olio
Dep
loy
addi
tiona
l R
&D to
acc
eler
ate
key
proj
ects
Iden
tify
capi
tal
prod
uctiv
ity
oppo
rtuni
ties
Repos
ition
offer
ing in
co
ntext
of COVI
D-19
Acceler
ate po
st-
merger
integ
ration
Cleansheet top
supply costs
Assess supply chain
function for
productivity
improvement
Scenario-based
forecasting
Optimize "hung up" assets
Category Sample trigger points Sample activities
N/A – no regrets, no need for trigger outside of current crisis
� Re-assess real estate� Clean-up balance sheet for
possibility of financing additional growth
No-regrets moves
Full potential
� Major channel shift (i.e. to digital) demanded by consumers
� Crash in peer valuations� Pricing pressure by free or lower-
cost competitive offering
� Kick-off large-scale shift to digital sales
� Make a strategic M&A bet� Expand sales team to target
new logos
Stretch moves
� Liquidity falls below conservative estimates of required cash-on-hand
� Increased variability in key resource costs (i.e. unable to model raw materials costs)
� Impending signs of future / prolonged disruption event
� Launch a “cash lab” for recovery
� Shock-ready the supply chain� Reallocate capital to focus on
near-term big bets
No-regrets moves
Stretchmoves
Full potential
Trigger point
BRIEFING PACK
DOCUMENT INTENDED TO PROVIDE INSIGHT BASED ON CURRENTLY AVAILABLE INFORMATION FOR CONSIDERATION AND NOT SPECIFIC ADVICE
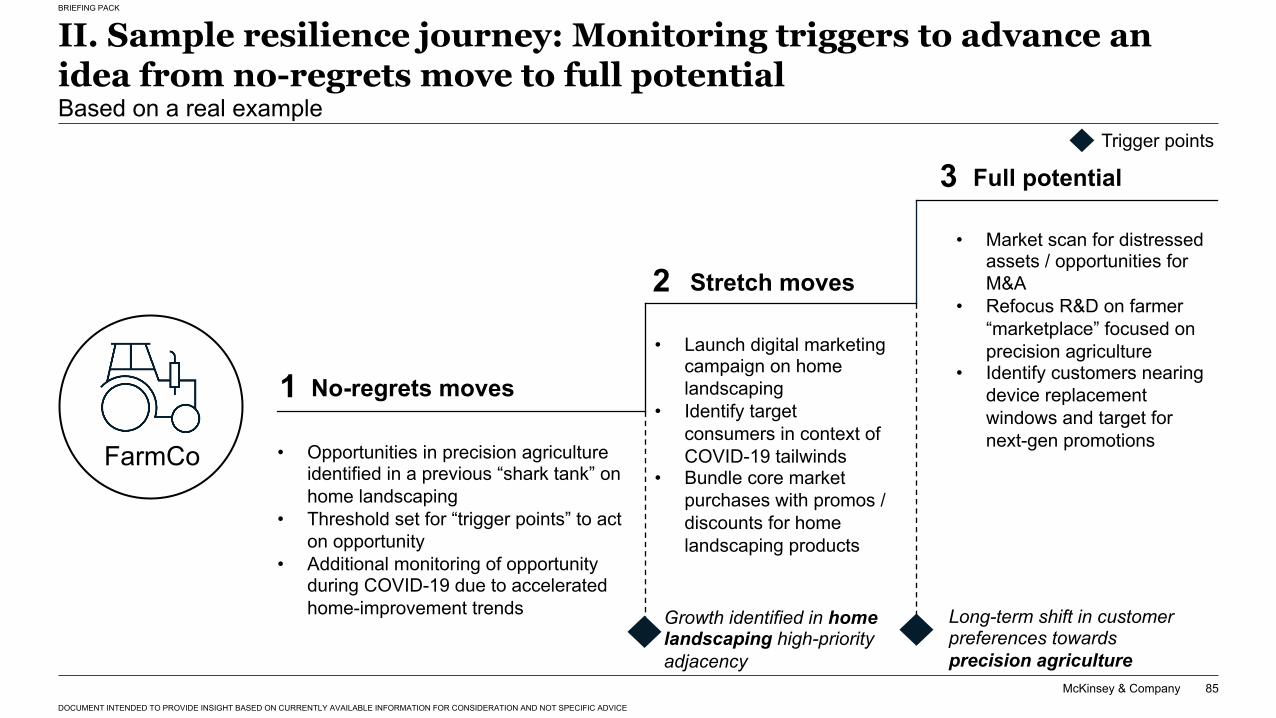
McKinsey & Company
BRIEFING PACK
DOCUMENT INTENDED TO PROVIDE INSIGHT BASED ON CURRENTLY AVAILABLE INFORMATION FOR CONSIDERATION AND NOT SPECIFIC ADVICE
85
II. Sample resilience journey: Monitoring triggers to advance an idea from no-regrets move to full potentialBased on a real example
• Market scan for distressed assets / opportunities for M&A
• Refocus R&D on farmer “marketplace” focused on precision agriculture
• Identify customers nearing device replacement windows and target for next-gen promotions• Opportunities in precision agriculture
identified in a previous “shark tank” on home landscaping
• Threshold set for “trigger points” to act on opportunity
• Additional monitoring of opportunity during COVID-19 due to accelerated home-improvement trends
• Launch digital marketing campaign on home landscaping
• Identify target consumers in context of COVID-19 tailwinds
• Bundle core market purchases with promos / discounts for home landscaping products
Full potential
Stretch moves
No-regrets moves1
2
3
Growth identified in home landscaping high-priority adjacency
Long-term shift in customer preferences towards precision agriculture
FarmCo
Trigger points
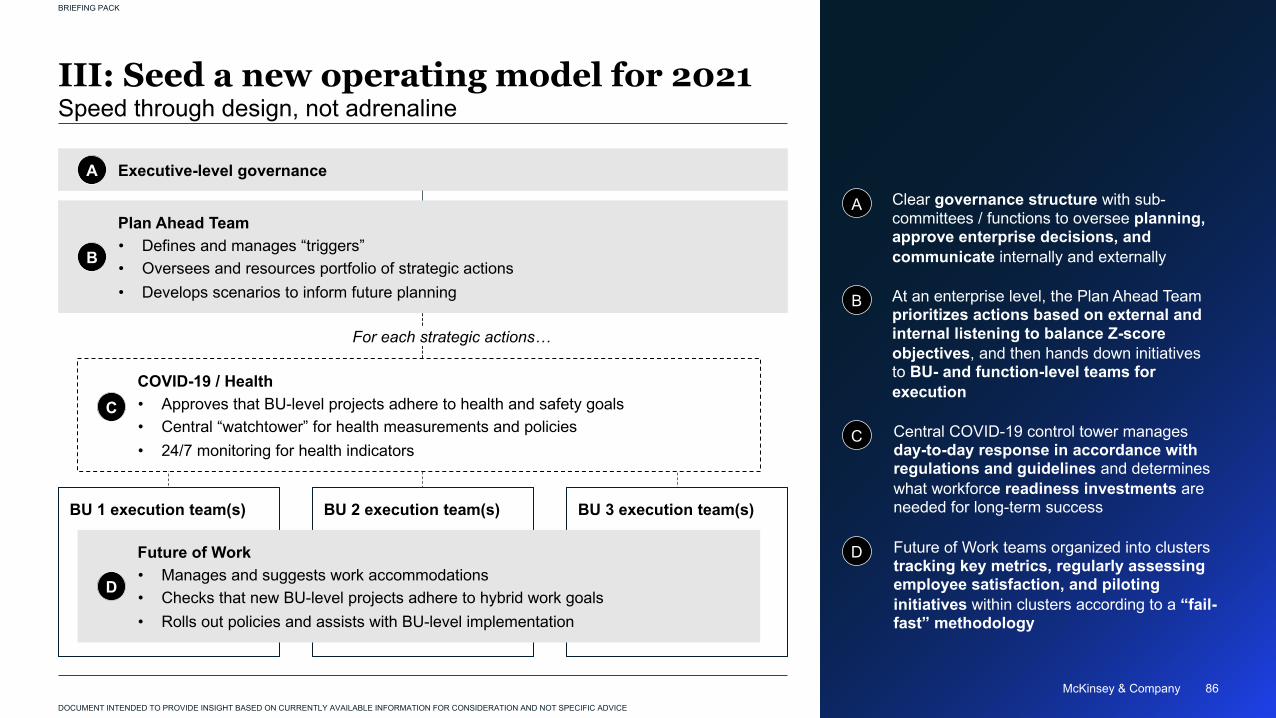
McKinsey & Company 86
BRIEFING PACK
DOCUMENT INTENDED TO PROVIDE INSIGHT BASED ON CURRENTLY AVAILABLE INFORMATION FOR CONSIDERATION AND NOT SPECIFIC ADVICE
McKinsey & Company 86
III: Seed a new operating model for 2021Speed through design, not adrenaline
A Clear governance structure with sub-committees / functions to oversee planning, approve enterprise decisions, and communicate internally and externally
B At an enterprise level, the Plan Ahead Team prioritizes actions based on external and internal listening to balance Z-score objectives, and then hands down initiatives to BU- and function-level teams for execution
C
Future of Work teams organized into clusters tracking key metrics, regularly assessing employee satisfaction, and piloting initiatives within clusters according to a “fail-fast” methodology
D
Central COVID-19 control tower manages day-to-day response in accordance with regulations and guidelines and determines what workforce readiness investments are needed for long-term success
Executive-level governanceA
Plan Ahead Team• Defines and manages “triggers”• Oversees and resources portfolio of strategic actions• Develops scenarios to inform future planning
B
BU 1 execution team(s) BU 2 execution team(s) BU 3 execution team(s)
Future of Work• Manages and suggests work accommodations• Checks that new BU-level projects adhere to hybrid work goals• Rolls out policies and assists with BU-level implementation
D
COVID-19 / Health• Approves that BU-level projects adhere to health and safety goals• Central “watchtower” for health measurements and policies• 24/7 monitoring for health indicators
C
For each strategic actions…
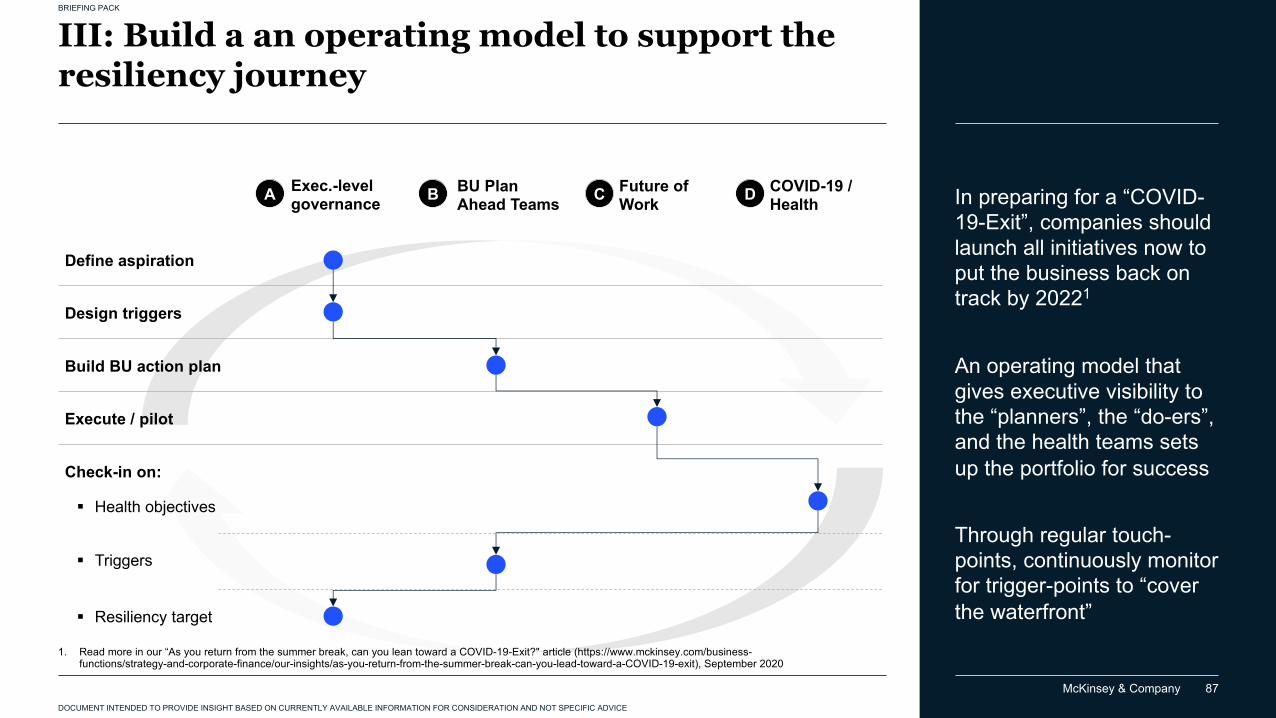
McKinsey & Company 87
BRIEFING PACK
DOCUMENT INTENDED TO PROVIDE INSIGHT BASED ON CURRENTLY AVAILABLE INFORMATION FOR CONSIDERATION AND NOT SPECIFIC ADVICE
III: Build a an operating model to support the resiliency journey
A Exec.-level governance
Design triggers
Build BU action plan
Execute / pilot
Check-in on:
§ Health objectives
§ Resiliency target
Define aspiration
COVID-19 / HealthDB Future of
WorkCBU Plan Ahead Teams
§ Triggers
In preparing for a “COVID-19-Exit”, companies should launch all initiatives now to put the business back on track by 20221
An operating model that gives executive visibility to the “planners”, the “do-ers”, and the health teams sets up the portfolio for success
Through regular touch-points, continuously monitor for trigger-points to “cover the waterfront”
1. Read more in our “As you return from the summer break, can you lean toward a COVID-19-Exit?" article (https://www.mckinsey.com/business-functions/strategy-and-corporate-finance/our-insights/as-you-return-from-the-summer-break-can-you-lead-toward-a-COVID-19-exit), September 2020
BRIEFING PACK
Contents
McKinsey & Company 88
COVID-19:The situation now
01Therapeutics and vaccines landscape overview
02
Appendix: Scenarios deep-dives
03Pathways towards a COVID-19-Exit
06Future of Work –latest learnings
05The ‘Emerging Resilients’: Achieving escape velocity
04
BRIEFING PACK
DOCUMENT INTENDED TO PROVIDE INSIGHT BASED ON CURRENTLY AVAILABLE INFORMATION FOR CONSIDERATION AND NOT SPECIFIC ADVICE

McKinsey & Company 89
Virtual WorkVirtual work may be a way of achieving some long sought after positive outcomes at work, but is the evidence clear, and do negatives outweigh the positives?
20-30%of surveyed workers across many organizations asking to work 100% virtually McKinsey & Company 89
BRIEFING PACK
DOCUMENT INTENDED TO PROVIDE INSIGHT BASED ON CURRENTLY AVAILABLE INFORMATION FOR CONSIDERATION AND NOT SPECIFIC ADVICE
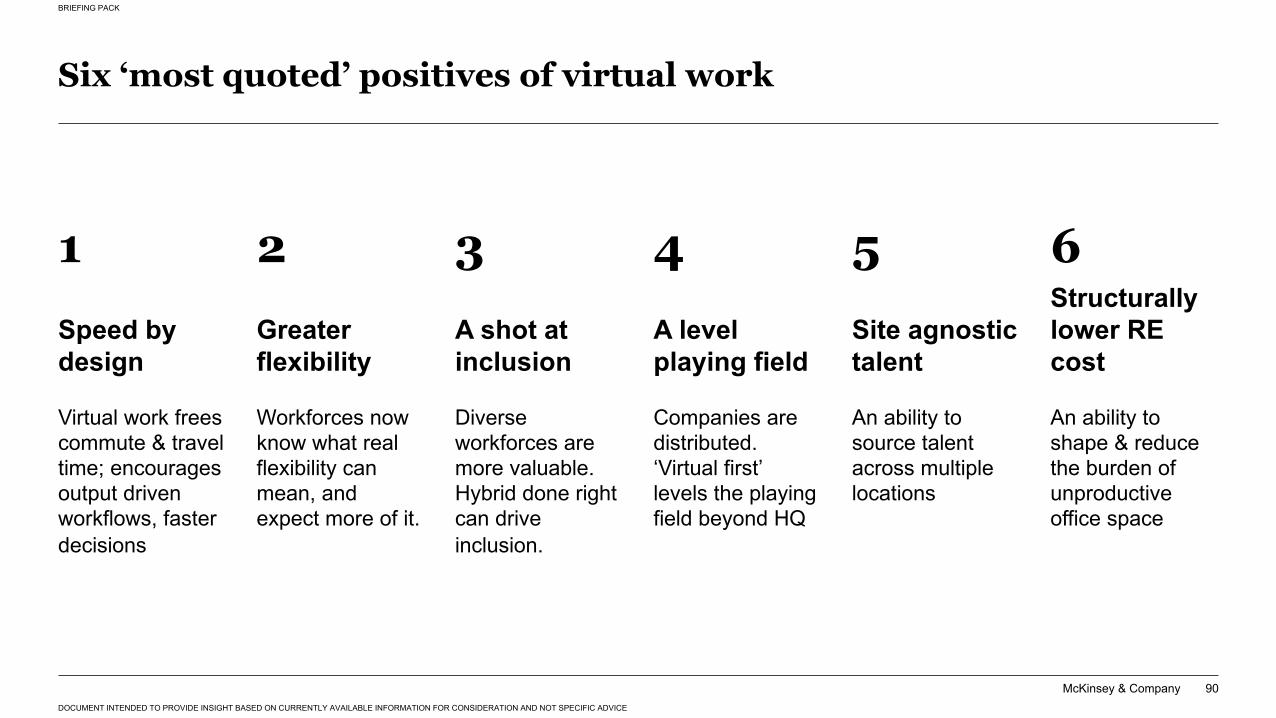
McKinsey & Company
BRIEFING PACK
DOCUMENT INTENDED TO PROVIDE INSIGHT BASED ON CURRENTLY AVAILABLE INFORMATION FOR CONSIDERATION AND NOT SPECIFIC ADVICE
90
Six ‘most quoted’ positives of virtual work
Speed by design
Virtual work frees commute & travel time; encourages output driven workflows, faster decisions
1Greater flexibility
Workforces now know what real flexibility can mean, and expect more of it.
2A shot at inclusion
Diverse workforces are more valuable. Hybrid done right can drive inclusion.
3A level playing field
Companies are distributed. ‘Virtual first’ levels the playing field beyond HQ
4Site agnostic talent
An ability to source talent across multiple locations
5Structurally lower RE cost
An ability to shape & reduce the burden of unproductive office space
6
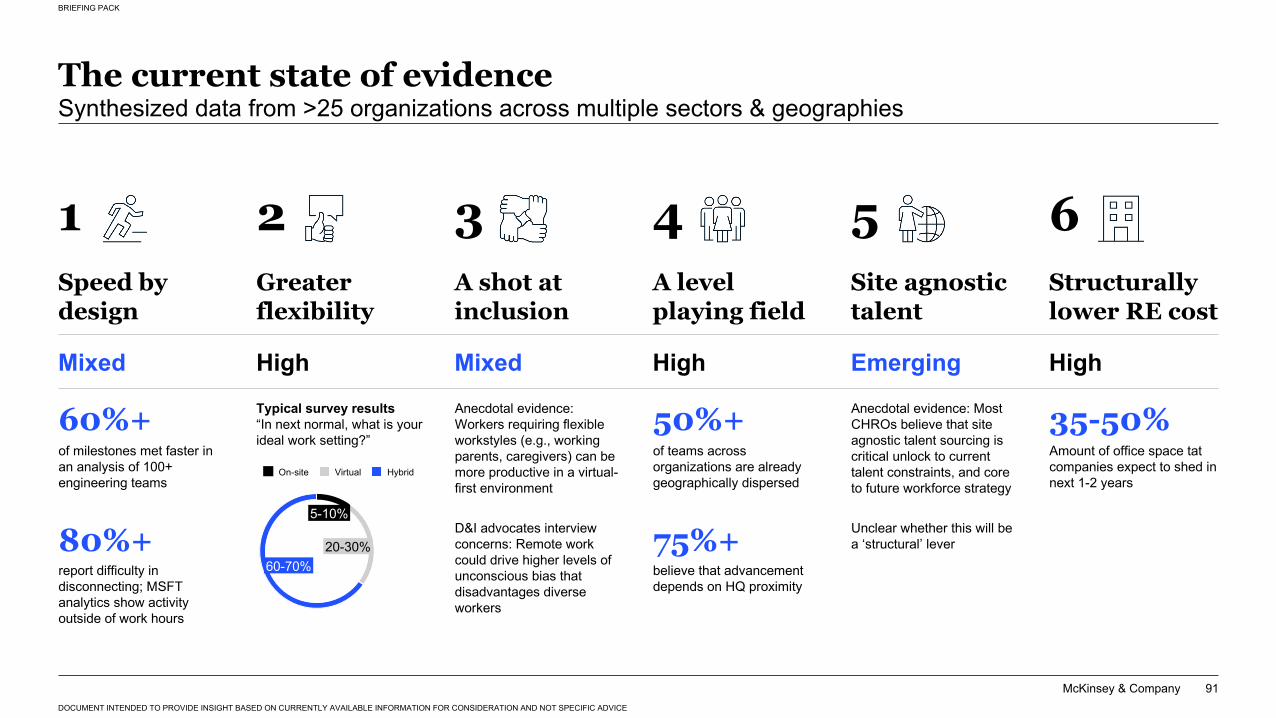
McKinsey & Company
BRIEFING PACK
DOCUMENT INTENDED TO PROVIDE INSIGHT BASED ON CURRENTLY AVAILABLE INFORMATION FOR CONSIDERATION AND NOT SPECIFIC ADVICE
91
The current state of evidenceSynthesized data from >25 organizations across multiple sectors & geographies
2 3 4 5 6
60%+of milestones met faster in an analysis of 100+ engineering teams
80%+ report difficulty in disconnecting; MSFT analytics show activity outside of work hours
Speed by design
A shot at inclusion
Anecdotal evidence: Workers requiring flexible workstyles (e.g., working parents, caregivers) can be more productive in a virtual-first environment
D&I advocates interview concerns: Remote work could drive higher levels of unconscious bias that disadvantages diverse workers
A level playing field
50%+of teams across organizations are already geographically dispersed
75%+ believe that advancement depends on HQ proximity
Site agnostic talent
Anecdotal evidence: Most CHROs believe that site agnostic talent sourcing is critical unlock to current talent constraints, and core to future workforce strategy
Unclear whether this will be a ‘structural’ lever
Structurally lower RE cost
35-50%Amount of office space tat companies expect to shed in next 1-2 years
60-70%
5-10%
20-30%
On-site HybridVirtual
Greater flexibility
Mixed Mixed High Emerging HighHighTypical survey results“In next normal, what is your ideal work setting?”
1
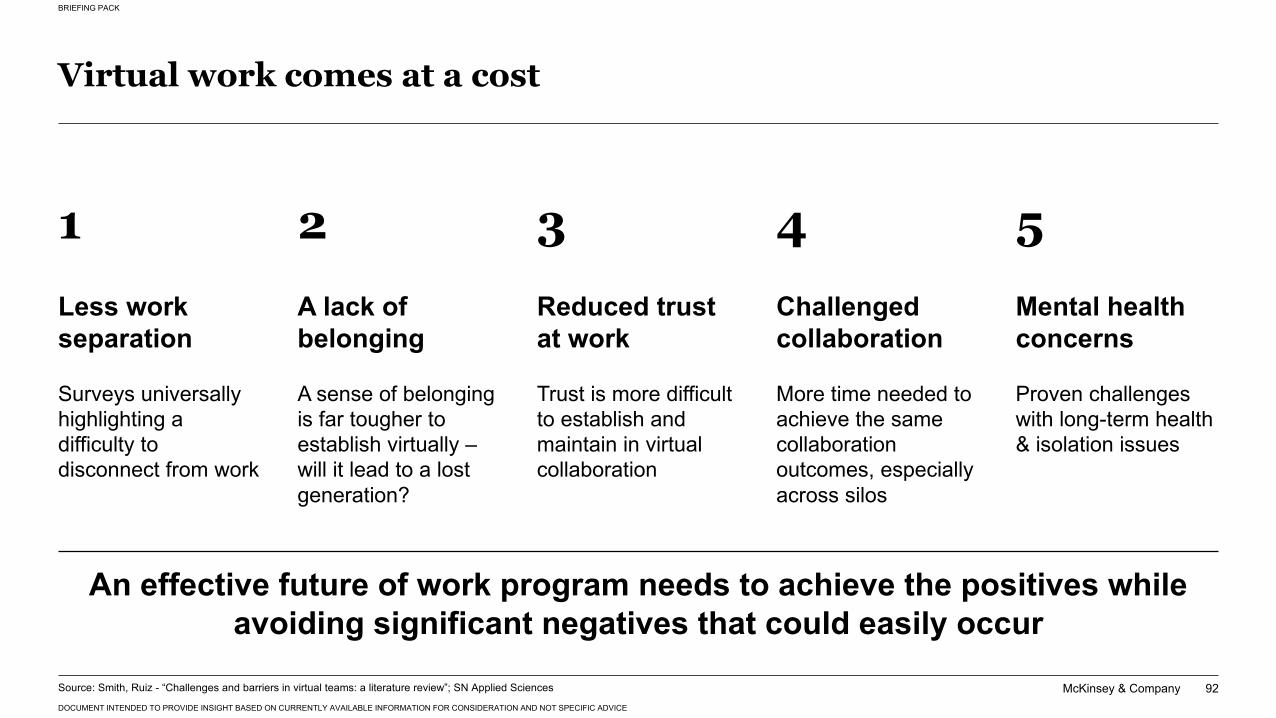
McKinsey & Company
BRIEFING PACK
DOCUMENT INTENDED TO PROVIDE INSIGHT BASED ON CURRENTLY AVAILABLE INFORMATION FOR CONSIDERATION AND NOT SPECIFIC ADVICE
92
Virtual work comes at a cost
Source: Smith, Ruiz - “Challenges and barriers in virtual teams: a literature review”; SN Applied Sciences
Less work separation
Surveys universally highlighting a difficulty to disconnect from work
1A lack of belonging
A sense of belonging is far tougher to establish virtually –will it lead to a lost generation?
2Reduced trust at work
Trust is more difficult to establish and maintain in virtual collaboration
3Challenged collaboration
More time needed to achieve the same collaboration outcomes, especially across silos
4Mental health concerns
Proven challenges with long-term health & isolation issues
5
An effective future of work program needs to achieve the positives while avoiding significant negatives that could easily occur
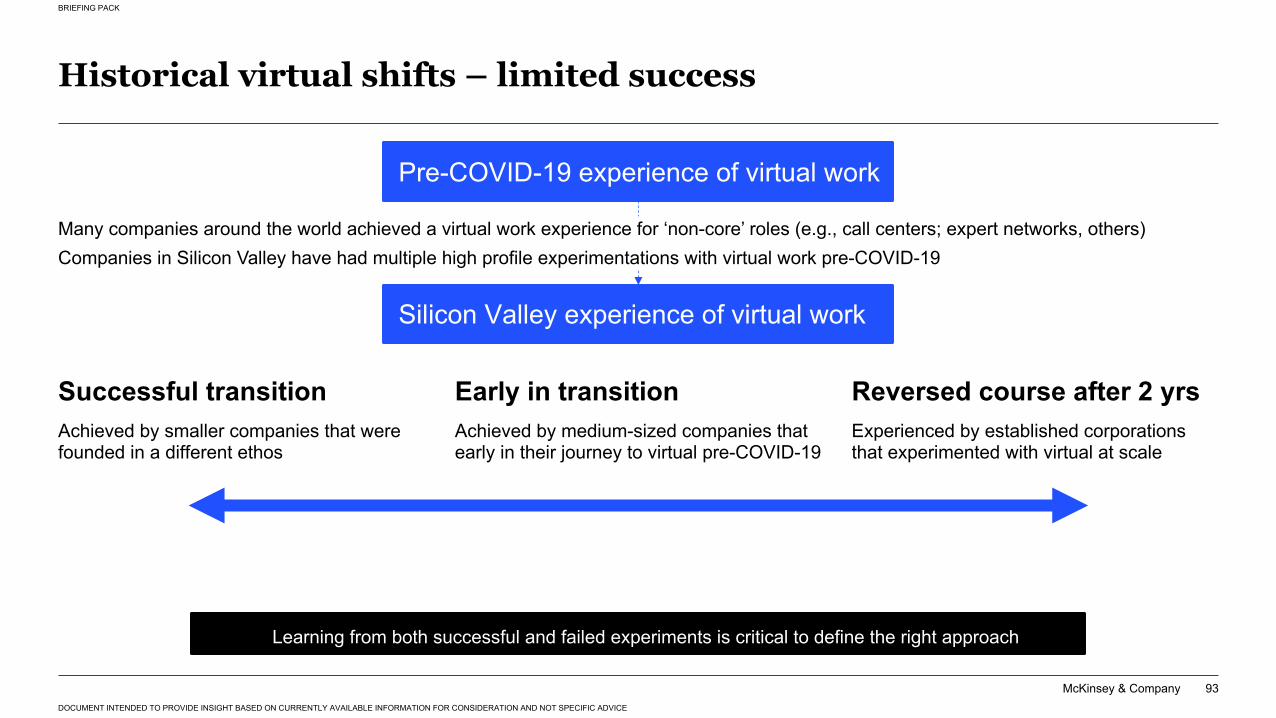
McKinsey & Company
BRIEFING PACK
DOCUMENT INTENDED TO PROVIDE INSIGHT BASED ON CURRENTLY AVAILABLE INFORMATION FOR CONSIDERATION AND NOT SPECIFIC ADVICE
93
Historical virtual shifts – limited success
Early in transitionAchieved by medium-sized companies that early in their journey to virtual pre-COVID-19
Reversed course after 2 yrsExperienced by established corporations that experimented with virtual at scale
Successful transitionAchieved by smaller companies that were founded in a different ethos
Silicon Valley experience of virtual work
Pre-COVID-19 experience of virtual work
Learning from both successful and failed experiments is critical to define the right approach
Many companies around the world achieved a virtual work experience for ‘non-core’ roles (e.g., call centers; expert networks, others)Companies in Silicon Valley have had multiple high profile experimentations with virtual work pre-COVID-19
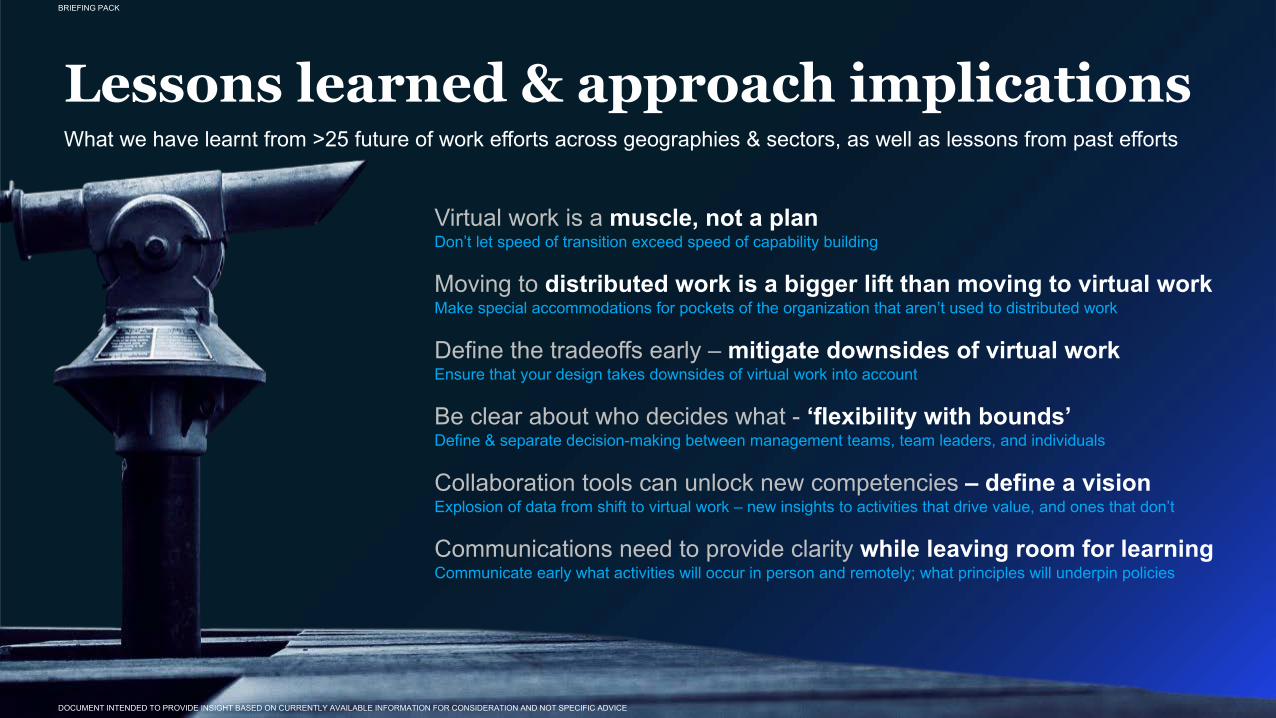
McKinsey & Company 94
Lessons learned & approach implications What we have learnt from >25 future of work efforts across geographies & sectors, as well as lessons from past efforts
Don’t let speed of transition exceed speed of capability buildingVirtual work is a muscle, not a plan
Make special accommodations for pockets of the organization that aren’t used to distributed workMoving to distributed work is a bigger lift than moving to virtual work
Communicate early what activities will occur in person and remotely; what principles will underpin policiesCommunications need to provide clarity while leaving room for learning
Ensure that your design takes downsides of virtual work into accountDefine the tradeoffs early – mitigate downsides of virtual work
Define & separate decision-making between management teams, team leaders, and individualsBe clear about who decides what - ‘flexibility with bounds’
Explosion of data from shift to virtual work – new insights to activities that drive value, and ones that don’tCollaboration tools can unlock new competencies – define a vision
BRIEFING PACK
DOCUMENT INTENDED TO PROVIDE INSIGHT BASED ON CURRENTLY AVAILABLE INFORMATION FOR CONSIDERATION AND NOT SPECIFIC ADVICE
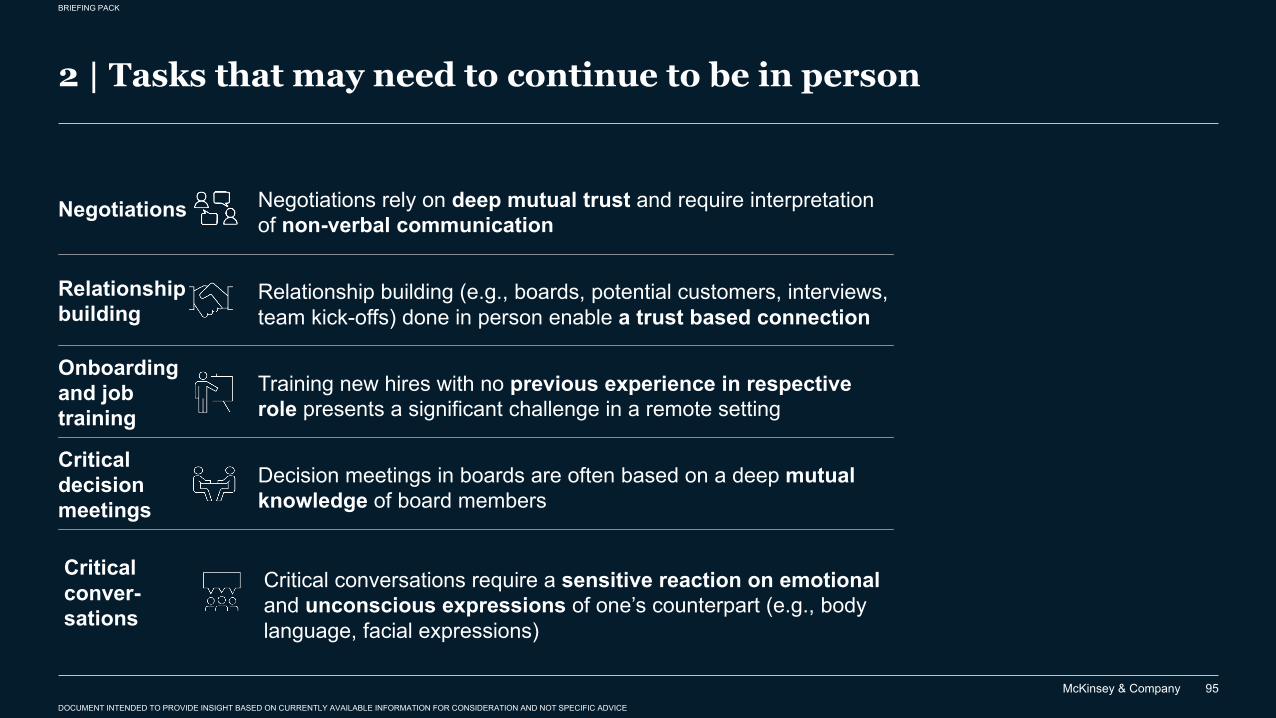
McKinsey & Company
BRIEFING PACK
DOCUMENT INTENDED TO PROVIDE INSIGHT BASED ON CURRENTLY AVAILABLE INFORMATION FOR CONSIDERATION AND NOT SPECIFIC ADVICE
95
2 | Tasks that may need to continue to be in person
Relationship building
Relationship building (e.g., boards, potential customers, interviews, team kick-offs) done in person enable a trust based connection
Critical decision meetings
Decision meetings in boards are often based on a deep mutual knowledge of board members
Critical conver-sations
Critical conversations require a sensitive reaction on emotional and unconscious expressions of one’s counterpart (e.g., body language, facial expressions)
Negotiations Negotiations rely on deep mutual trust and require interpretation of non-verbal communication
Onboarding and job training
Training new hires with no previous experience in respective role presents a significant challenge in a remote setting
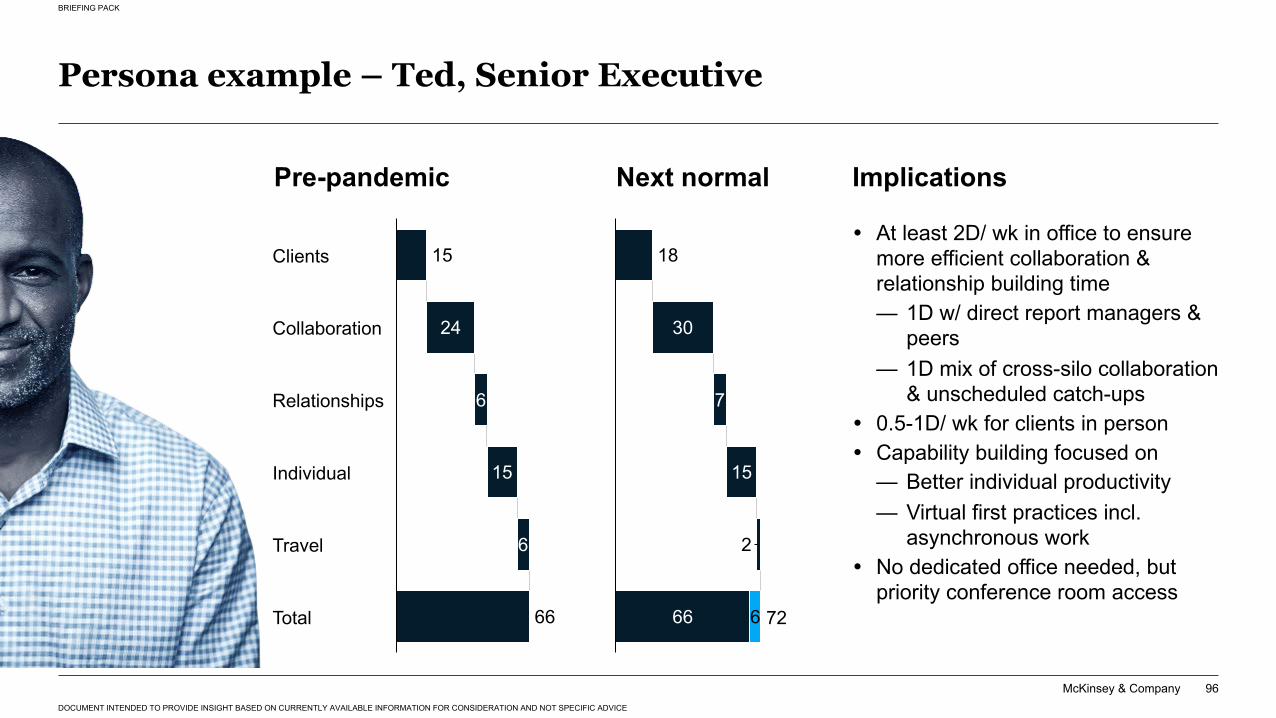
McKinsey & Company
BRIEFING PACK
DOCUMENT INTENDED TO PROVIDE INSIGHT BASED ON CURRENTLY AVAILABLE INFORMATION FOR CONSIDERATION AND NOT SPECIFIC ADVICE
96
15
66
24
6
15
6Travel
Relationships
Individual
Clients
Collaboration
Total
18
66
30
7
15
2
6 72
Next normal Implications
� At least 2D/ wk in office to ensure more efficient collaboration & relationship building time— 1D w/ direct report managers &
peers— 1D mix of cross-silo collaboration
& unscheduled catch-ups� 0.5-1D/ wk for clients in person � Capability building focused on
— Better individual productivity— Virtual first practices incl.
asynchronous work� No dedicated office needed, but
priority conference room access
Pre-pandemic
Persona example – Ted, Senior Executive
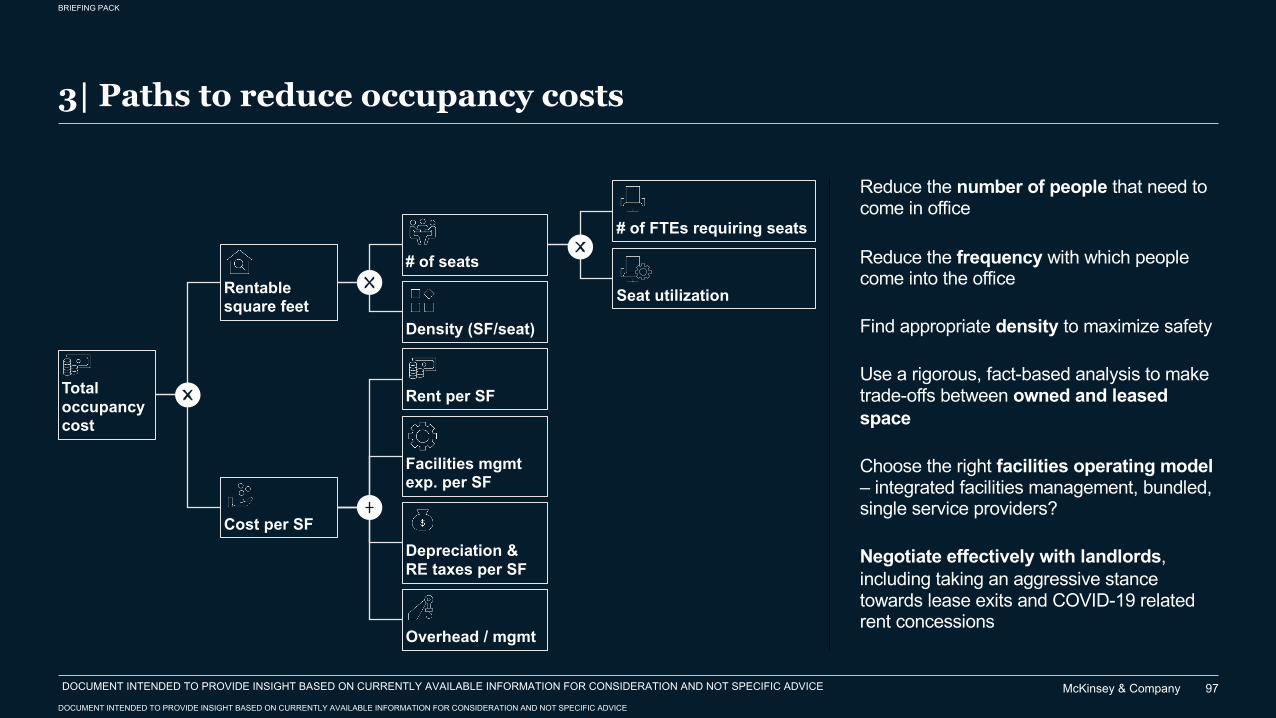
McKinsey & Company
BRIEFING PACK
DOCUMENT INTENDED TO PROVIDE INSIGHT BASED ON CURRENTLY AVAILABLE INFORMATION FOR CONSIDERATION AND NOT SPECIFIC ADVICE
97
3| Paths to reduce occupancy costs
Rentable square feet
Cost per SF
Total occupancy cost
# of seats
Density (SF/seat)
Seat utilization
# of FTEs requiring seats
Rent per SF
Facilities mgmtexp. per SF
Depreciation & RE taxes per SF
Overhead / mgmt
Reduce the number of people that need to come in office
Reduce the frequency with which people come into the office
Find appropriate density to maximize safety
Use a rigorous, fact-based analysis to make trade-offs between owned and leased space
Choose the right facilities operating model – integrated facilities management, bundled, single service providers?
Negotiate effectively with landlords, including taking an aggressive stance towards lease exits and COVID-19 related rent concessions
DOCUMENT INTENDED TO PROVIDE INSIGHT BASED ON CURRENTLY AVAILABLE INFORMATION FOR CONSIDERATION AND NOT SPECIFIC ADVICE
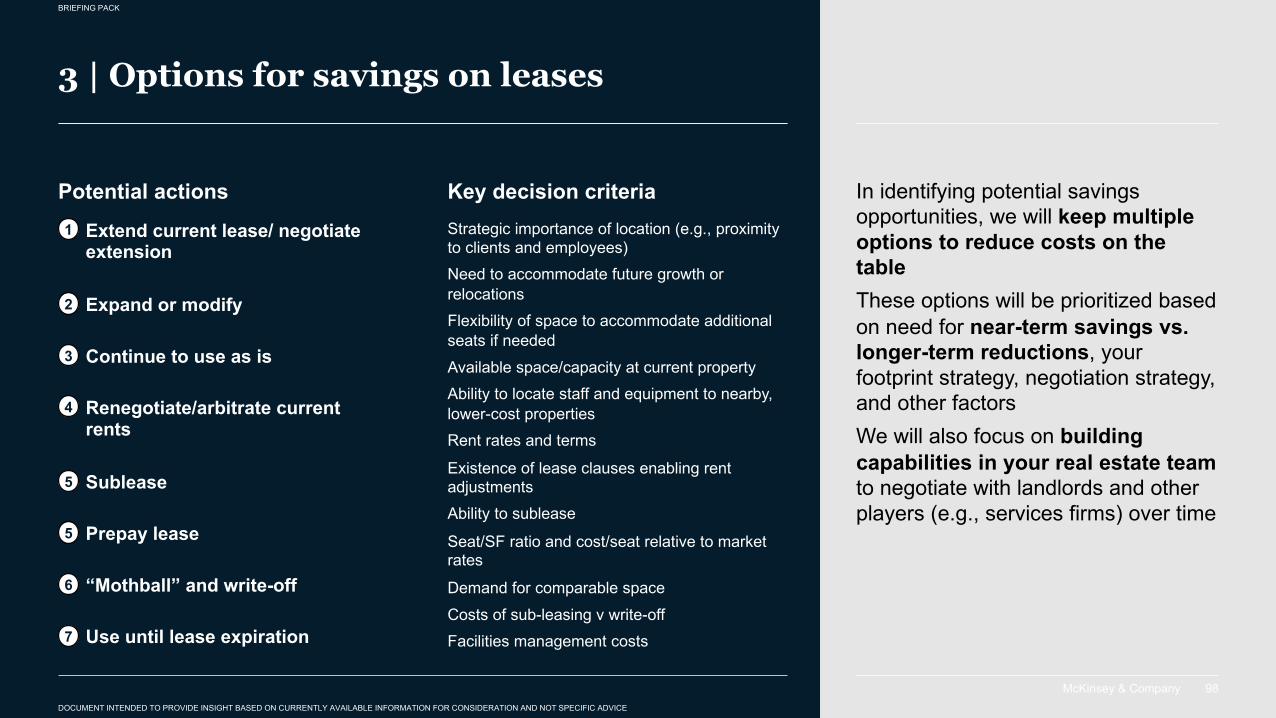
McKinsey & Company 98
BRIEFING PACK
DOCUMENT INTENDED TO PROVIDE INSIGHT BASED ON CURRENTLY AVAILABLE INFORMATION FOR CONSIDERATION AND NOT SPECIFIC ADVICE
Potential actions Key decision criteriaStrategic importance of location (e.g., proximity to clients and employees)Need to accommodate future growth or relocationsFlexibility of space to accommodate additional seats if neededAvailable space/capacity at current propertyAbility to locate staff and equipment to nearby, lower-cost propertiesRent rates and terms
Existence of lease clauses enabling rent adjustmentsAbility to sublease
Seat/SF ratio and cost/seat relative to market rates
Demand for comparable spaceCosts of sub-leasing v write-offFacilities management costs
Extend current lease/ negotiate extension
1
Expand or modify2
Continue to use as is3
Renegotiate/arbitrate current rents
4
Sublease5
Prepay lease5
“Mothball” and write-off6
Use until lease expiration7
3 | Options for savings on leases
In identifying potential savings opportunities, we will keep multiple options to reduce costs on the tableThese options will be prioritized based on need for near-term savings vs. longer-term reductions, your footprint strategy, negotiation strategy, and other factorsWe will also focus on building capabilities in your real estate team to negotiate with landlords and other players (e.g., services firms) over time

McKinsey & Company 99
BRIEFING PACK
DOCUMENT INTENDED TO PROVIDE INSIGHT BASED ON CURRENTLY AVAILABLE INFORMATION FOR CONSIDERATION AND NOT SPECIFIC ADVICE
3 | Prioritize landlord negotiations with higher savings opportunities and stronger leverage
Represent 70% of total savings opportunity across NA landlord
Credible leverage with 27 closure candidates
Strategic partner with ability to open new stores or concepts
Offices have significant reduction potential and lease expenses are rising
Prioritization of landlord A and BStrength of leverage xx Savings
Savings potential
Small Medium Large
High
Medium
Low
$XX
$XX
$XX
$XX
$XX
$XX
$XX
$XX
Landlord A Landlord B
Landlord C
Landlord F
Landlord E
Landlord D
Landlord G
Landlord H
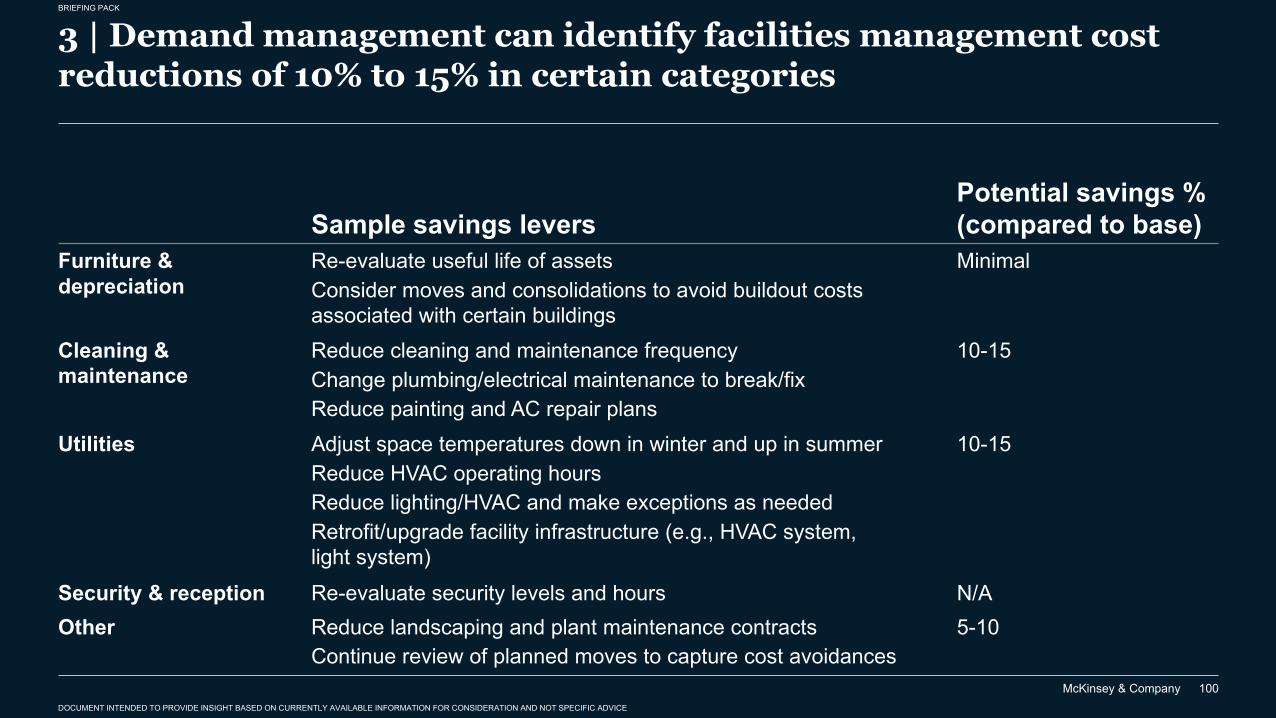
McKinsey & Company
BRIEFING PACK
DOCUMENT INTENDED TO PROVIDE INSIGHT BASED ON CURRENTLY AVAILABLE INFORMATION FOR CONSIDERATION AND NOT SPECIFIC ADVICE
100
3 | Demand management can identify facilities management cost reductions of 10% to 15% in certain categories
Potential savings %(compared to base)Minimal
Sample savings leversRe-evaluate useful life of assetsConsider moves and consolidations to avoid buildout costs associated with certain buildings
Furniture & depreciation
N/ARe-evaluate security levels and hoursSecurity & reception
10-15Adjust space temperatures down in winter and up in summerReduce HVAC operating hoursReduce lighting/HVAC and make exceptions as neededRetrofit/upgrade facility infrastructure (e.g., HVAC system, light system)
Utilities
10-15Reduce cleaning and maintenance frequencyChange plumbing/electrical maintenance to break/fixReduce painting and AC repair plans
Cleaning & maintenance
5-10Reduce landscaping and plant maintenance contractsContinue review of planned moves to capture cost avoidances
Other

McKinsey & Company 101
Shifting to next normalMany businesses are facing challenges defining and making the shift to the next normal; making sure that ambitions on the next normal keep pace with capability is critical to success
McKinsey & Company 101
BRIEFING PACK
DOCUMENT INTENDED TO PROVIDE INSIGHT BASED ON CURRENTLY AVAILABLE INFORMATION FOR CONSIDERATION AND NOT SPECIFIC ADVICE
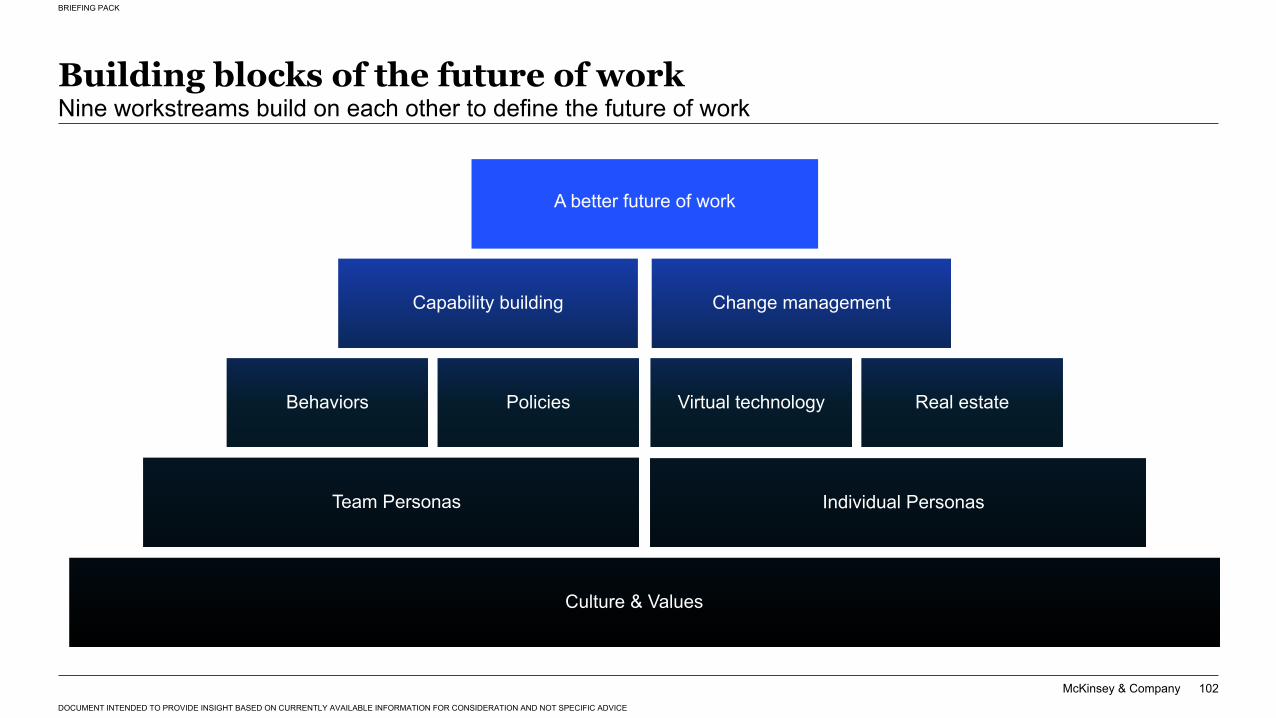
McKinsey & Company
BRIEFING PACK
DOCUMENT INTENDED TO PROVIDE INSIGHT BASED ON CURRENTLY AVAILABLE INFORMATION FOR CONSIDERATION AND NOT SPECIFIC ADVICE
102
Building blocks of the future of workNine workstreams build on each other to define the future of work
Culture & Values
Capability building Change management
Behaviors Policies Virtual technology Real estate
A better future of work
Team Personas Individual Personas
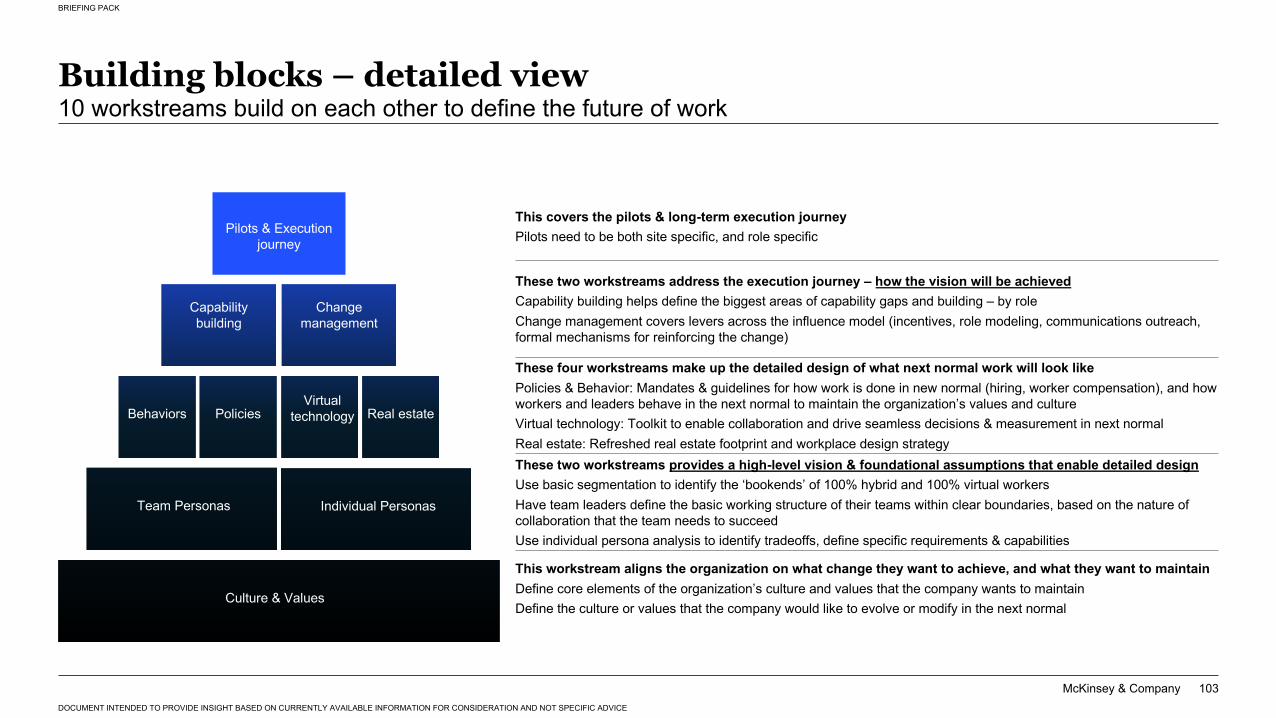
McKinsey & Company
BRIEFING PACK
DOCUMENT INTENDED TO PROVIDE INSIGHT BASED ON CURRENTLY AVAILABLE INFORMATION FOR CONSIDERATION AND NOT SPECIFIC ADVICE
103
Building blocks – detailed view10 workstreams build on each other to define the future of work
Culture & Values
Capability building
Change management
Behaviors PoliciesVirtual
technology Real estate
Pilots & Execution journey
Team Personas Individual Personas
These two workstreams provides a high-level vision & foundational assumptions that enable detailed designUse basic segmentation to identify the ‘bookends’ of 100% hybrid and 100% virtual workersHave team leaders define the basic working structure of their teams within clear boundaries, based on the nature of collaboration that the team needs to succeedUse individual persona analysis to identify tradeoffs, define specific requirements & capabilities
This workstream aligns the organization on what change they want to achieve, and what they want to maintainDefine core elements of the organization’s culture and values that the company wants to maintainDefine the culture or values that the company would like to evolve or modify in the next normal
These four workstreams make up the detailed design of what next normal work will look likePolicies & Behavior: Mandates & guidelines for how work is done in new normal (hiring, worker compensation), and how workers and leaders behave in the next normal to maintain the organization’s values and cultureVirtual technology: Toolkit to enable collaboration and drive seamless decisions & measurement in next normalReal estate: Refreshed real estate footprint and workplace design strategy
These two workstreams address the execution journey – how the vision will be achievedCapability building helps define the biggest areas of capability gaps and building – by roleChange management covers levers across the influence model (incentives, role modeling, communications outreach, formal mechanisms for reinforcing the change)
This covers the pilots & long-term execution journeyPilots need to be both site specific, and role specific
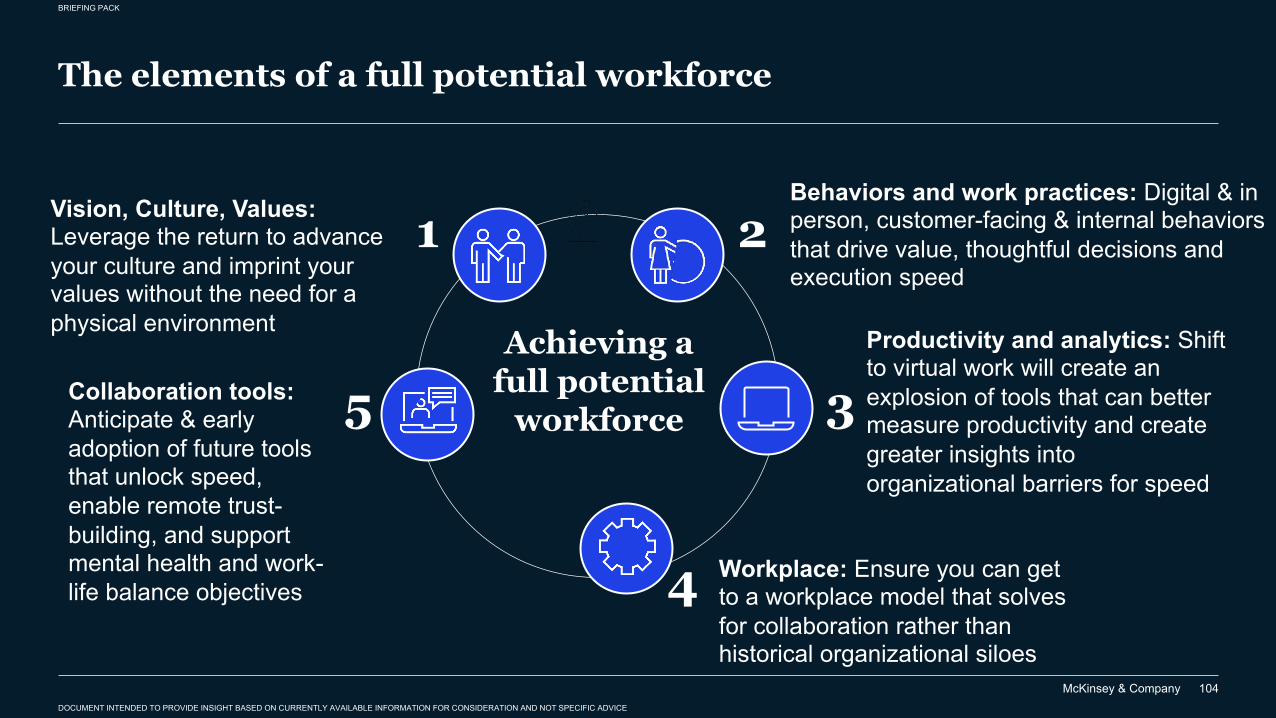
McKinsey & Company
BRIEFING PACK
DOCUMENT INTENDED TO PROVIDE INSIGHT BASED ON CURRENTLY AVAILABLE INFORMATION FOR CONSIDERATION AND NOT SPECIFIC ADVICE
104
The elements of a full potential workforce
Workplace: Ensure you can get to a workplace model that solves for collaboration rather than historical organizational siloes
Collaboration tools: Anticipate & early adoption of future tools that unlock speed, enable remote trust-building, and support mental health and work-life balance objectives
Productivity and analytics: Shift to virtual work will create an explosion of tools that can better measure productivity and create greater insights into organizational barriers for speed
Vision, Culture, Values: Leverage the return to advance your culture and imprint your values without the need for a physical environment
Behaviors and work practices: Digital & in person, customer-facing & internal behaviors that drive value, thoughtful decisions and execution speed
1
5
4
2
3Achieving a
full potential workforce
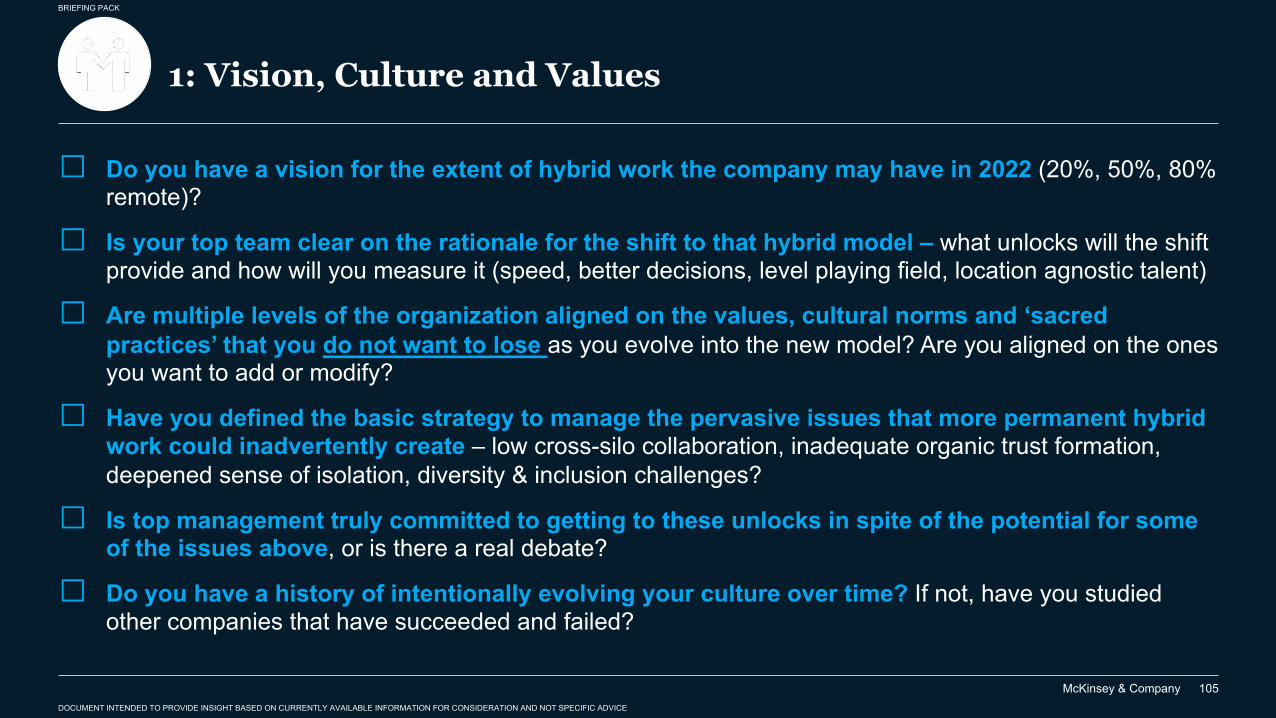
McKinsey & Company
BRIEFING PACK
DOCUMENT INTENDED TO PROVIDE INSIGHT BASED ON CURRENTLY AVAILABLE INFORMATION FOR CONSIDERATION AND NOT SPECIFIC ADVICE
105
1: Vision, Culture and Values
□ Do you have a vision for the extent of hybrid work the company may have in 2022 (20%, 50%, 80% remote)?
□ Is your top team clear on the rationale for the shift to that hybrid model – what unlocks will the shift provide and how will you measure it (speed, better decisions, level playing field, location agnostic talent)
□ Are multiple levels of the organization aligned on the values, cultural norms and ‘sacred practices’ that you do not want to lose as you evolve into the new model? Are you aligned on the ones you want to add or modify?
□ Have you defined the basic strategy to manage the pervasive issues that more permanent hybrid work could inadvertently create – low cross-silo collaboration, inadequate organic trust formation, deepened sense of isolation, diversity & inclusion challenges?
□ Is top management truly committed to getting to these unlocks in spite of the potential for some of the issues above, or is there a real debate?
□ Do you have a history of intentionally evolving your culture over time? If not, have you studied other companies that have succeeded and failed?
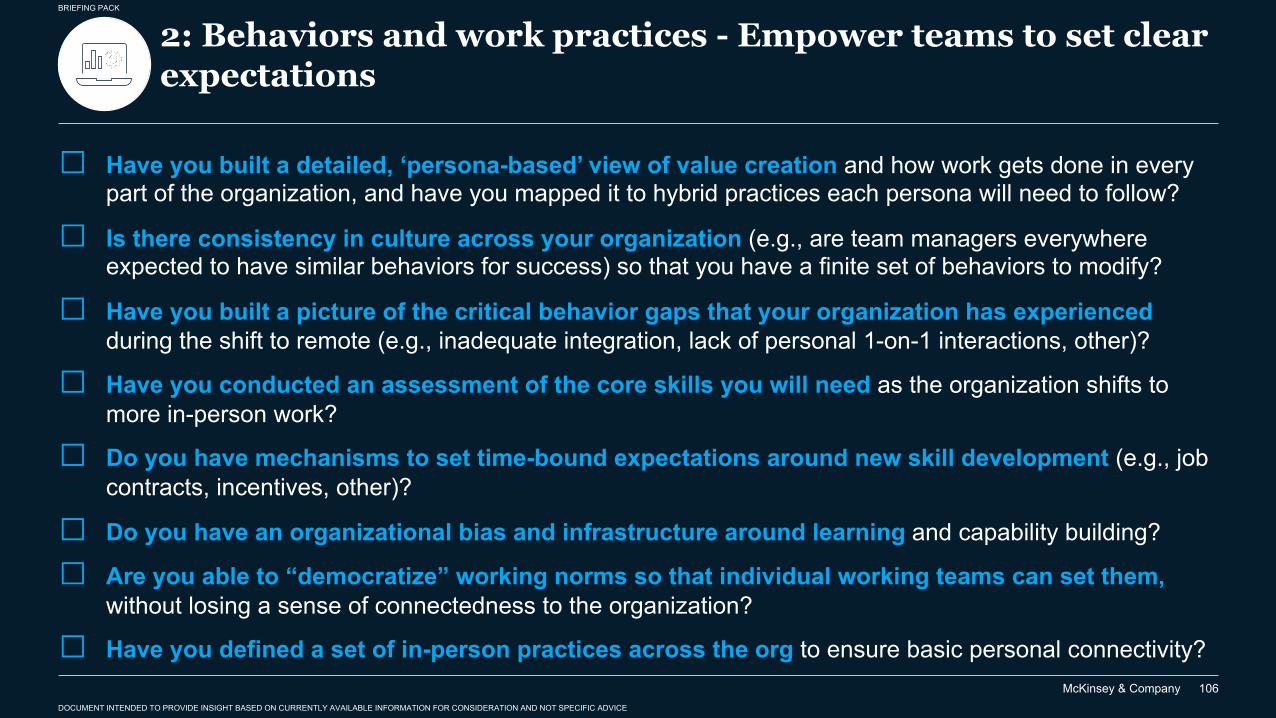
McKinsey & Company
BRIEFING PACK
DOCUMENT INTENDED TO PROVIDE INSIGHT BASED ON CURRENTLY AVAILABLE INFORMATION FOR CONSIDERATION AND NOT SPECIFIC ADVICE
106
2: Behaviors and work practices - Empower teams to set clear expectations
□ Have you built a detailed, ‘persona-based’ view of value creation and how work gets done in every part of the organization, and have you mapped it to hybrid practices each persona will need to follow?
□ Is there consistency in culture across your organization (e.g., are team managers everywhere expected to have similar behaviors for success) so that you have a finite set of behaviors to modify?
□ Have you built a picture of the critical behavior gaps that your organization has experienced during the shift to remote (e.g., inadequate integration, lack of personal 1-on-1 interactions, other)?
□ Have you conducted an assessment of the core skills you will need as the organization shifts to more in-person work?
□ Do you have mechanisms to set time-bound expectations around new skill development (e.g., job contracts, incentives, other)?
□ Do you have an organizational bias and infrastructure around learning and capability building?
□ Are you able to “democratize” working norms so that individual working teams can set them, without losing a sense of connectedness to the organization?
□ Have you defined a set of in-person practices across the org to ensure basic personal connectivity?
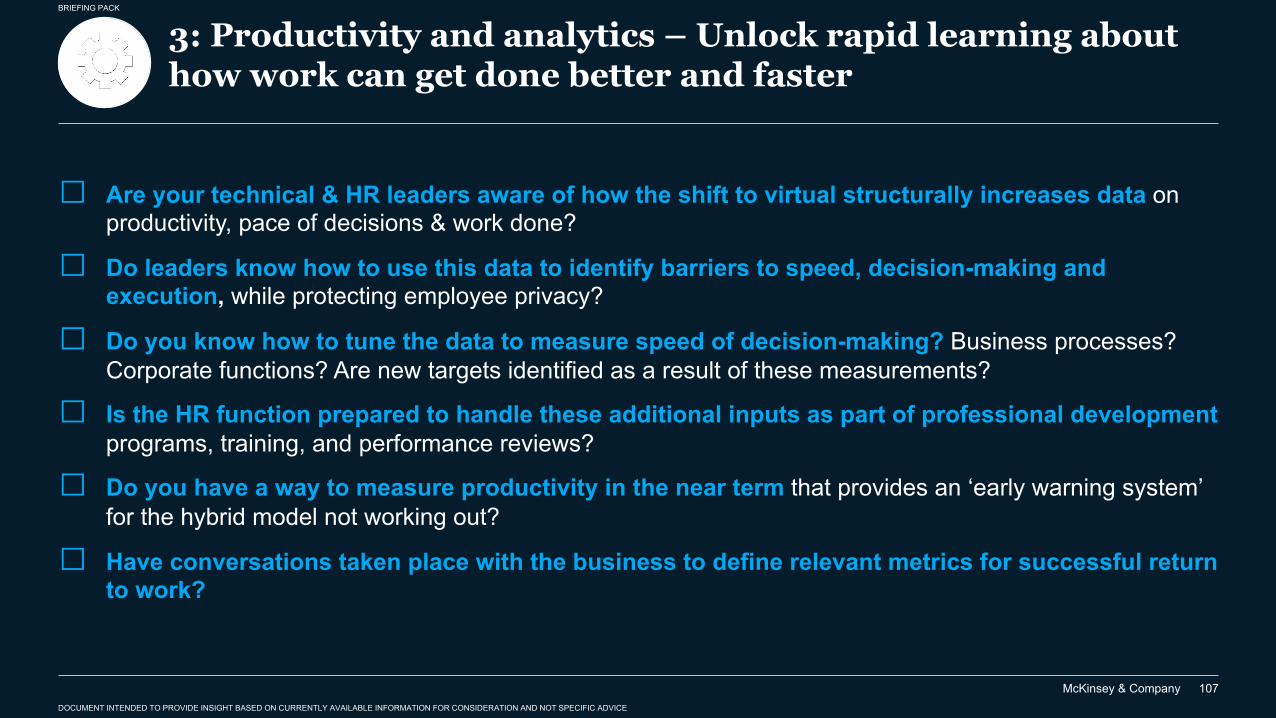
McKinsey & Company
BRIEFING PACK
DOCUMENT INTENDED TO PROVIDE INSIGHT BASED ON CURRENTLY AVAILABLE INFORMATION FOR CONSIDERATION AND NOT SPECIFIC ADVICE
107
3: Productivity and analytics – Unlock rapid learning about how work can get done better and faster
□ Are your technical & HR leaders aware of how the shift to virtual structurally increases data on productivity, pace of decisions & work done?
□ Do leaders know how to use this data to identify barriers to speed, decision-making and execution, while protecting employee privacy?
□ Do you know how to tune the data to measure speed of decision-making? Business processes? Corporate functions? Are new targets identified as a result of these measurements?
□ Is the HR function prepared to handle these additional inputs as part of professional development programs, training, and performance reviews?
□ Do you have a way to measure productivity in the near term that provides an ‘early warning system’ for the hybrid model not working out?
□ Have conversations taken place with the business to define relevant metrics for successful return to work?
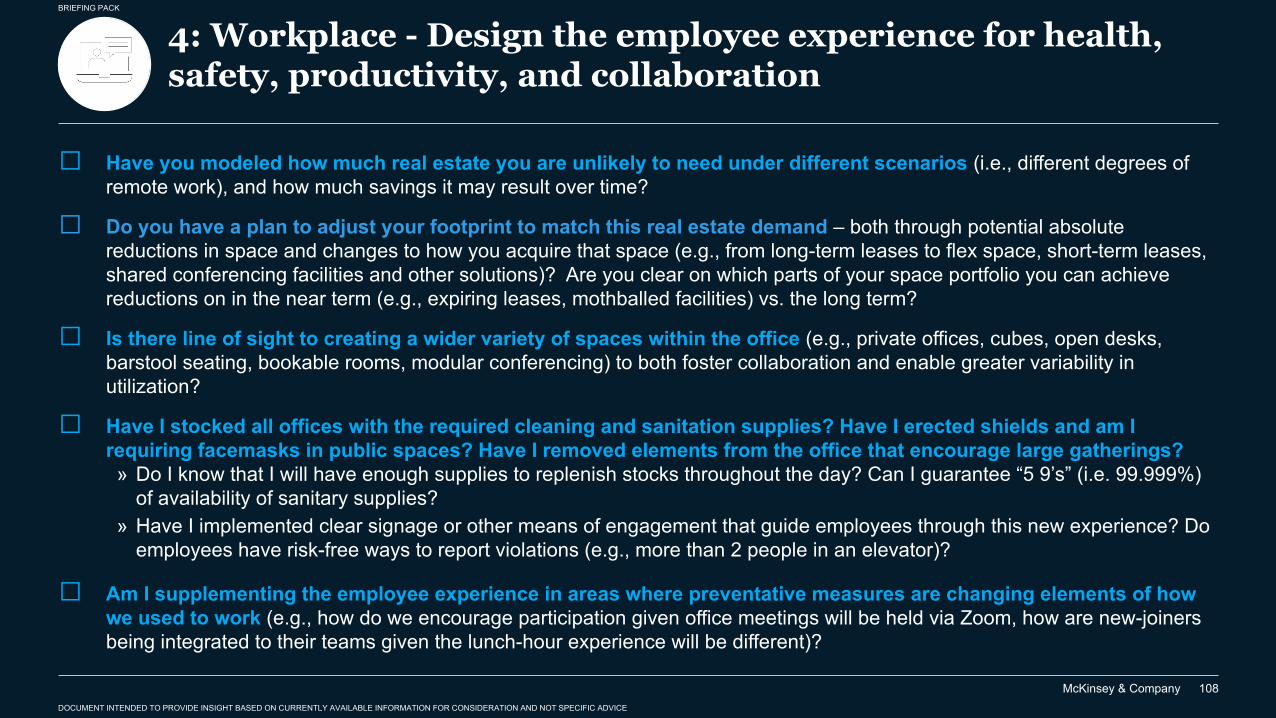
McKinsey & Company
BRIEFING PACK
DOCUMENT INTENDED TO PROVIDE INSIGHT BASED ON CURRENTLY AVAILABLE INFORMATION FOR CONSIDERATION AND NOT SPECIFIC ADVICE
108
4: Workplace - Design the employee experience for health, safety, productivity, and collaboration
□ Have you modeled how much real estate you are unlikely to need under different scenarios (i.e., different degrees of remote work), and how much savings it may result over time?
□ Do you have a plan to adjust your footprint to match this real estate demand – both through potential absolute reductions in space and changes to how you acquire that space (e.g., from long-term leases to flex space, short-term leases, shared conferencing facilities and other solutions)? Are you clear on which parts of your space portfolio you can achieve reductions on in the near term (e.g., expiring leases, mothballed facilities) vs. the long term?
□ Is there line of sight to creating a wider variety of spaces within the office (e.g., private offices, cubes, open desks, barstool seating, bookable rooms, modular conferencing) to both foster collaboration and enable greater variability in utilization?
□ Have I stocked all offices with the required cleaning and sanitation supplies? Have I erected shields and am I requiring facemasks in public spaces? Have I removed elements from the office that encourage large gatherings?» Do I know that I will have enough supplies to replenish stocks throughout the day? Can I guarantee “5 9’s” (i.e. 99.999%)
of availability of sanitary supplies?» Have I implemented clear signage or other means of engagement that guide employees through this new experience? Do
employees have risk-free ways to report violations (e.g., more than 2 people in an elevator)?
□ Am I supplementing the employee experience in areas where preventative measures are changing elements of how we used to work (e.g., how do we encourage participation given office meetings will be held via Zoom, how are new-joiners being integrated to their teams given the lunch-hour experience will be different)?
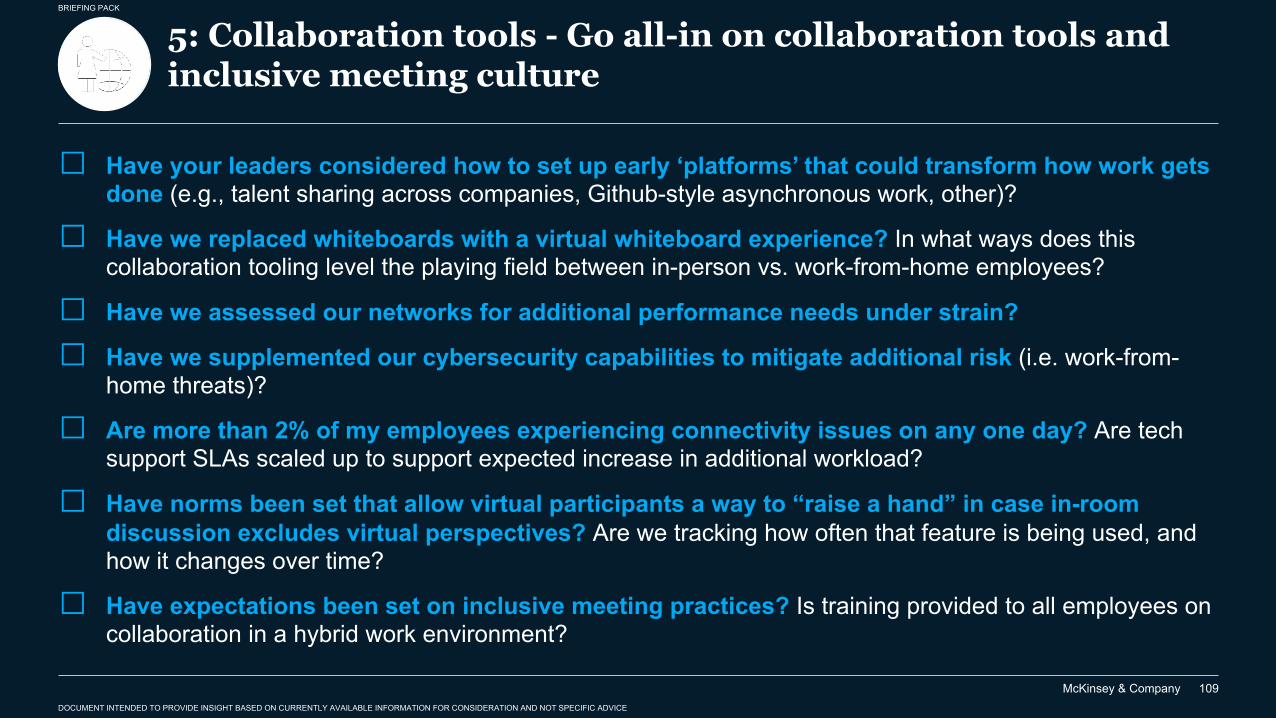
McKinsey & Company
BRIEFING PACK
DOCUMENT INTENDED TO PROVIDE INSIGHT BASED ON CURRENTLY AVAILABLE INFORMATION FOR CONSIDERATION AND NOT SPECIFIC ADVICE
109
5: Collaboration tools - Go all-in on collaboration tools and inclusive meeting culture
□ Have your leaders considered how to set up early ‘platforms’ that could transform how work gets done (e.g., talent sharing across companies, Github-style asynchronous work, other)?
□ Have we replaced whiteboards with a virtual whiteboard experience? In what ways does this collaboration tooling level the playing field between in-person vs. work-from-home employees?
□ Have we assessed our networks for additional performance needs under strain?
□ Have we supplemented our cybersecurity capabilities to mitigate additional risk (i.e. work-from-home threats)?
□ Are more than 2% of my employees experiencing connectivity issues on any one day? Are tech support SLAs scaled up to support expected increase in additional workload?
□ Have norms been set that allow virtual participants a way to “raise a hand” in case in-room discussion excludes virtual perspectives? Are we tracking how often that feature is being used, and how it changes over time?
□ Have expectations been set on inclusive meeting practices? Is training provided to all employees on collaboration in a hybrid work environment?
BRIEFING PACK
Contents
McKinsey & Company 110
COVID-19:The situation now
01Therapeutics and vaccines landscape overview
02
Appendix: Scenarios deep-dives
03Pathways towards a COVID-19-Exit
06The ‘Return to Work checklist’
05The ‘Emerging Resilients’: Achieving escape velocity
04
BRIEFING PACK
DOCUMENT INTENDED TO PROVIDE INSIGHT BASED ON CURRENTLY AVAILABLE INFORMATION FOR CONSIDERATION AND NOT SPECIFIC ADVICE
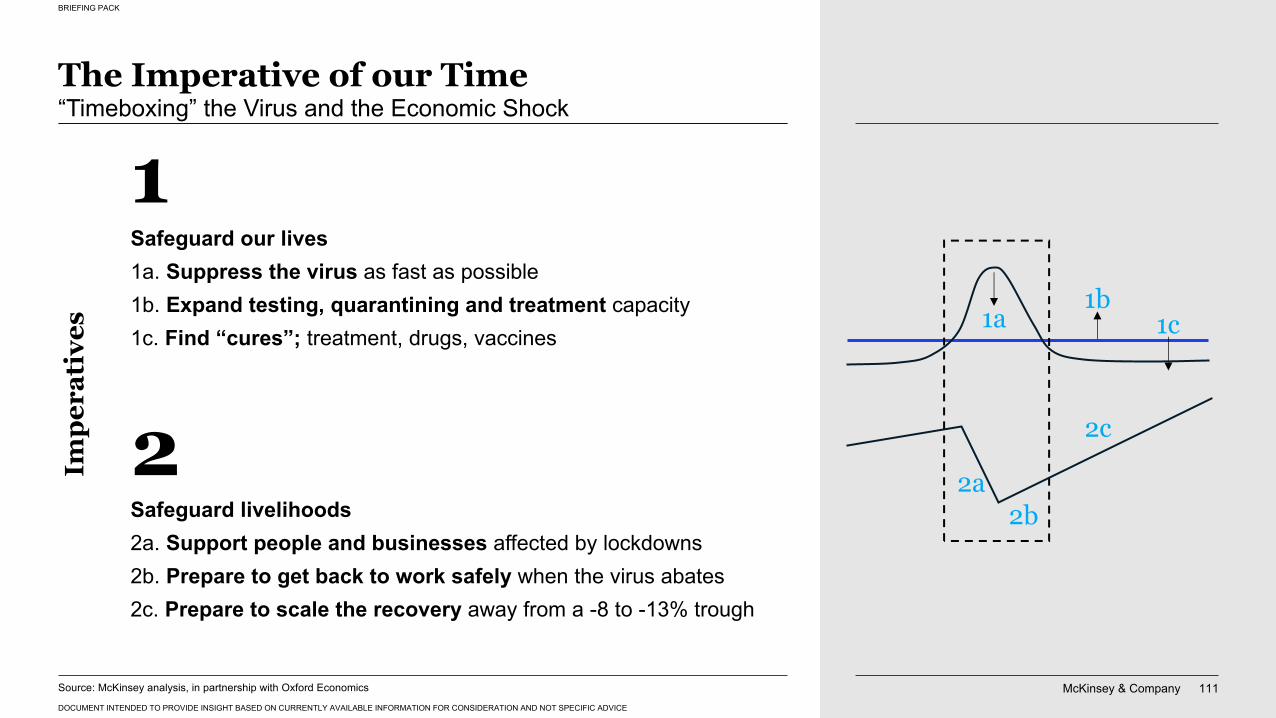
McKinsey & Company 111
BRIEFING PACK
DOCUMENT INTENDED TO PROVIDE INSIGHT BASED ON CURRENTLY AVAILABLE INFORMATION FOR CONSIDERATION AND NOT SPECIFIC ADVICE
The Imperative of our Time“Timeboxing” the Virus and the Economic Shock
Safeguard our lives1a. Suppress the virus as fast as possible1b. Expand testing, quarantining and treatment capacity1c. Find “cures”; treatment, drugs, vaccines
Impe
rati
ves
2Safeguard livelihoods2a. Support people and businesses affected by lockdowns2b. Prepare to get back to work safely when the virus abates2c. Prepare to scale the recovery away from a -8 to -13% trough
1
Source: McKinsey analysis, in partnership with Oxford Economics
1a1b
1c
2a2b
2c
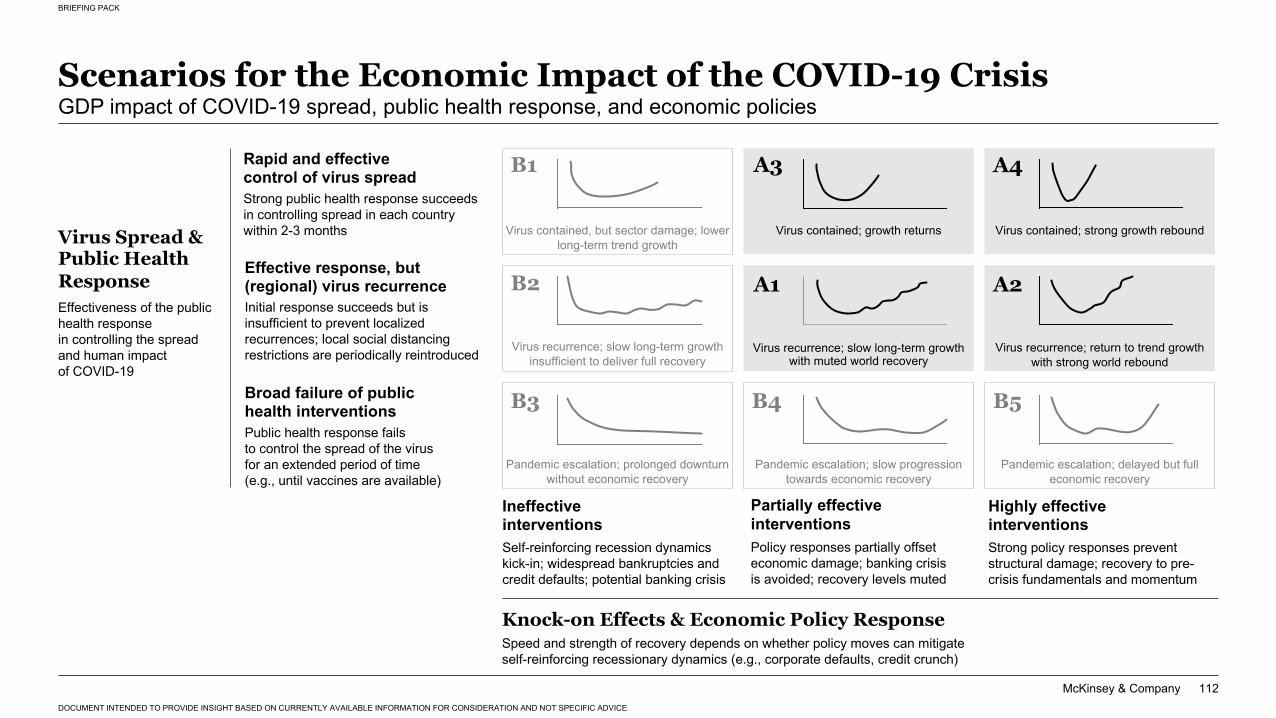
McKinsey & Company
BRIEFING PACK
DOCUMENT INTENDED TO PROVIDE INSIGHT BASED ON CURRENTLY AVAILABLE INFORMATION FOR CONSIDERATION AND NOT SPECIFIC ADVICE
112
Virus recurrence; slow long-term growthwith muted world recovery
Virus contained; growth returnsVirus contained, but sector damage; lower long-term trend growth
Virus recurrence; slow long-term growth insufficient to deliver full recovery
Pandemic escalation; prolonged downturn without economic recovery
Pandemic escalation; slow progression towards economic recovery
Virus contained; strong growth rebound
Virus recurrence; return to trend growthwith strong world rebound
Pandemic escalation; delayed but full economic recovery
A3
A1 A2
A4B1
B2
B3 B4 B5
Scenarios for the Economic Impact of the COVID-19 CrisisGDP impact of COVID-19 spread, public health response, and economic policies
Virus Spread & Public Health ResponseEffectiveness of the public health responsein controlling the spread and human impactof COVID-19
Effective response, but (regional) virus recurrenceInitial response succeeds but is insufficient to prevent localized recurrences; local social distancing restrictions are periodically reintroduced
Broad failure of public health interventions
Rapid and effective control of virus spreadStrong public health response succeeds in controlling spread in each country within 2-3 months
Public health response failsto control the spread of the virusfor an extended period of time(e.g., until vaccines are available)
Knock-on Effects & Economic Policy ResponseSpeed and strength of recovery depends on whether policy moves can mitigate self-reinforcing recessionary dynamics (e.g., corporate defaults, credit crunch)
Ineffective interventions
Policy responses partially offset economic damage; banking crisisis avoided; recovery levels muted
Partially effective interventions
Self-reinforcing recession dynamics kick-in; widespread bankruptcies and credit defaults; potential banking crisis
Strong policy responses prevent structural damage; recovery to pre-crisis fundamentals and momentum
Highly effective interventions
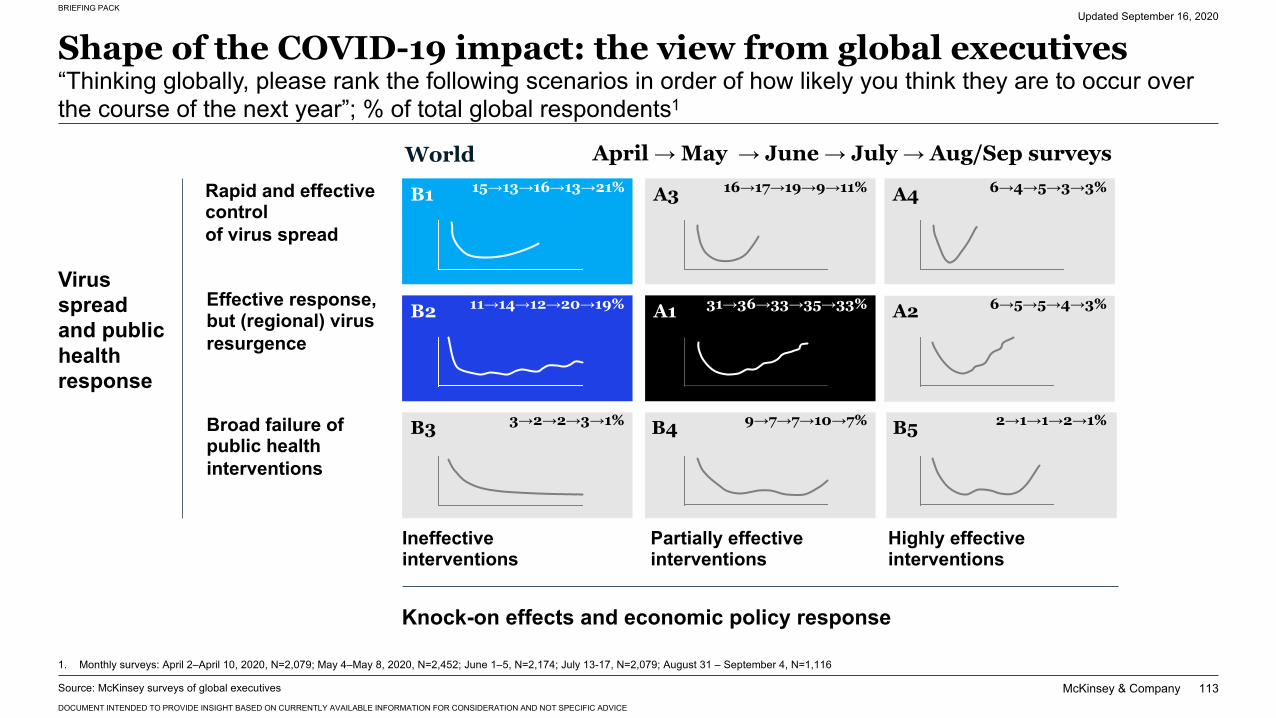
McKinsey & Company
BRIEFING PACK
DOCUMENT INTENDED TO PROVIDE INSIGHT BASED ON CURRENTLY AVAILABLE INFORMATION FOR CONSIDERATION AND NOT SPECIFIC ADVICE
113Source: McKinsey surveys of global executives
Shape of the COVID-19 impact: the view from global executives“Thinking globally, please rank the following scenarios in order of how likely you think they are to occur over the course of the next year”; % of total global respondents1
Updated September 16, 2020
1. Monthly surveys: April 2–April 10, 2020, N=2,079; May 4–May 8, 2020, N=2,452; June 1–5, N=2,174; July 13-17, N=2,079; August 31 – September 4, N=1,116
Virus spread and public health response
Effective response, but (regional) virus resurgence
Broad failure of public health interventions
Rapid and effective controlof virus spread
Knock-on effects and economic policy response
Ineffective interventions
Partially effective interventions
Highly effective interventions
A3
A1 A2
A4B1
B2
B3 B4 B5
World April → May → June→ July → Aug/Sep surveys15→13→16→13→21%
11→14→12→20→19%
3→2→2→3→1%
16→17→19→9→11%
31→36→33→35→33%
9→7→7→10→7%
6→4→5→3→3%
6→5→5→4→3%
2→1→1→2→1%
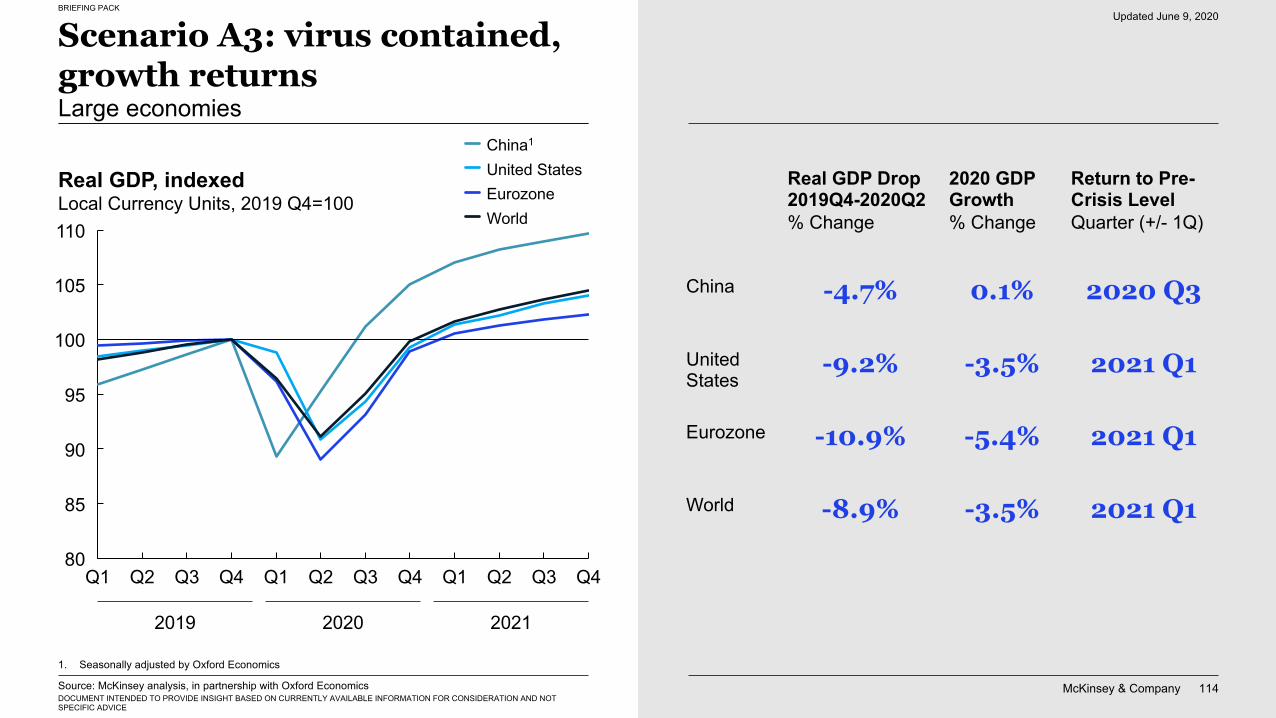
McKinsey & Company 114
BRIEFING PACK
DOCUMENT INTENDED TO PROVIDE INSIGHT BASED ON CURRENTLY AVAILABLE INFORMATION FOR CONSIDERATION AND NOT SPECIFIC ADVICE
90
85
100
80
95
105
110
Q2Q1 Q3Q3 Q4 Q1 Q2 Q4 Q1 Q2 Q3 Q4
Scenario A3: virus contained, growth returnsLarge economies
Real GDP, indexedLocal Currency Units, 2019 Q4=100
World
China1
EurozoneUnited States
2019 2020 2021
Source: McKinsey analysis, in partnership with Oxford Economics
1. Seasonally adjusted by Oxford Economics
-4.7% 2020 Q30.1%China
-9.2% 2021 Q1-3.5%United States
-10.9% 2021 Q1-5.4%Eurozone
-8.9% 2021 Q1-3.5%World
Real GDP Drop 2019Q4-2020Q2 % Change
2020 GDP Growth% Change
Return to Pre-Crisis LevelQuarter (+/- 1Q)
Updated June 9, 2020
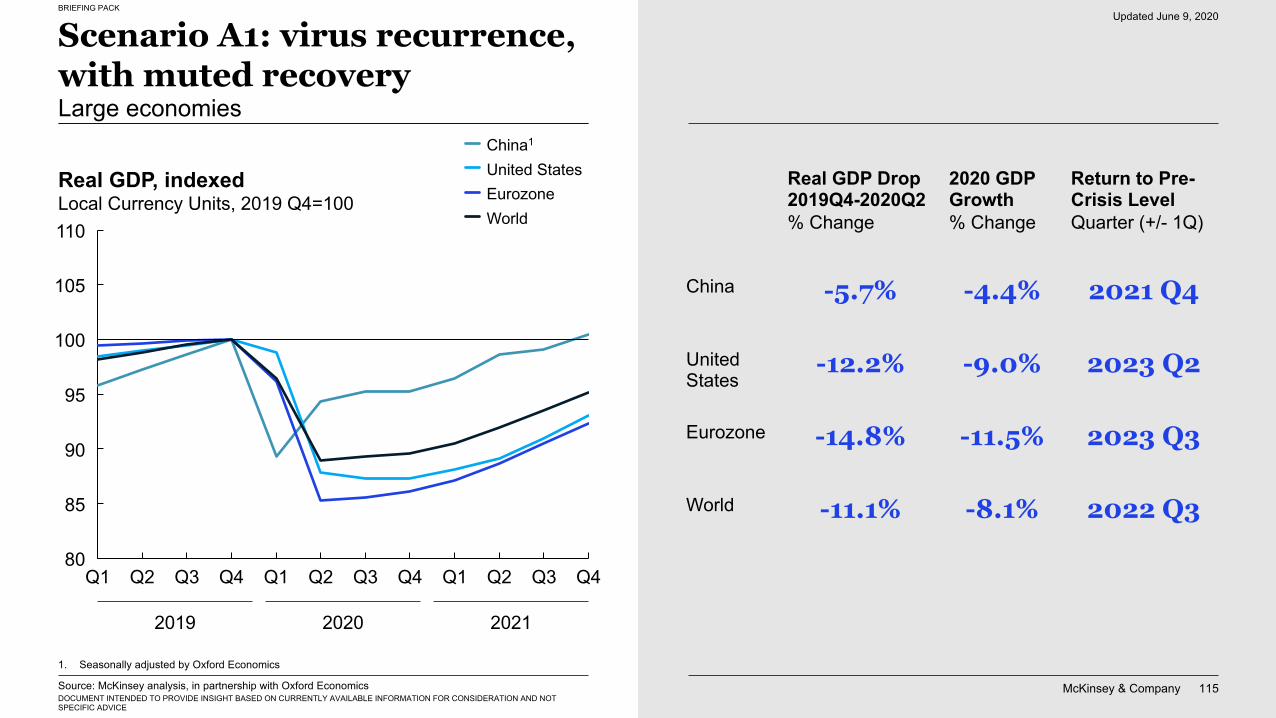
McKinsey & Company 115
BRIEFING PACK
DOCUMENT INTENDED TO PROVIDE INSIGHT BASED ON CURRENTLY AVAILABLE INFORMATION FOR CONSIDERATION AND NOT SPECIFIC ADVICE
Scenario A1: virus recurrence, with muted recoveryLarge economies
110
100
85
80
90
95
105
Q1Q1 Q2Q4Q2 Q3 Q4 Q2 Q3 Q1 Q3 Q4
Real GDP, indexedLocal Currency Units, 2019 Q4=100
World
China1
United StatesEurozone
2019 2020 2021
Source: McKinsey analysis, in partnership with Oxford Economics
1. Seasonally adjusted by Oxford Economics
-5.7% 2021 Q4-4.4%China
-12.2% 2023 Q2-9.0%United States
-14.8% 2023 Q3-11.5%Eurozone
-11.1% 2022 Q3-8.1%World
Real GDP Drop 2019Q4-2020Q2 % Change
2020 GDP Growth% Change
Return to Pre-Crisis LevelQuarter (+/- 1Q)
Updated June 9, 2020
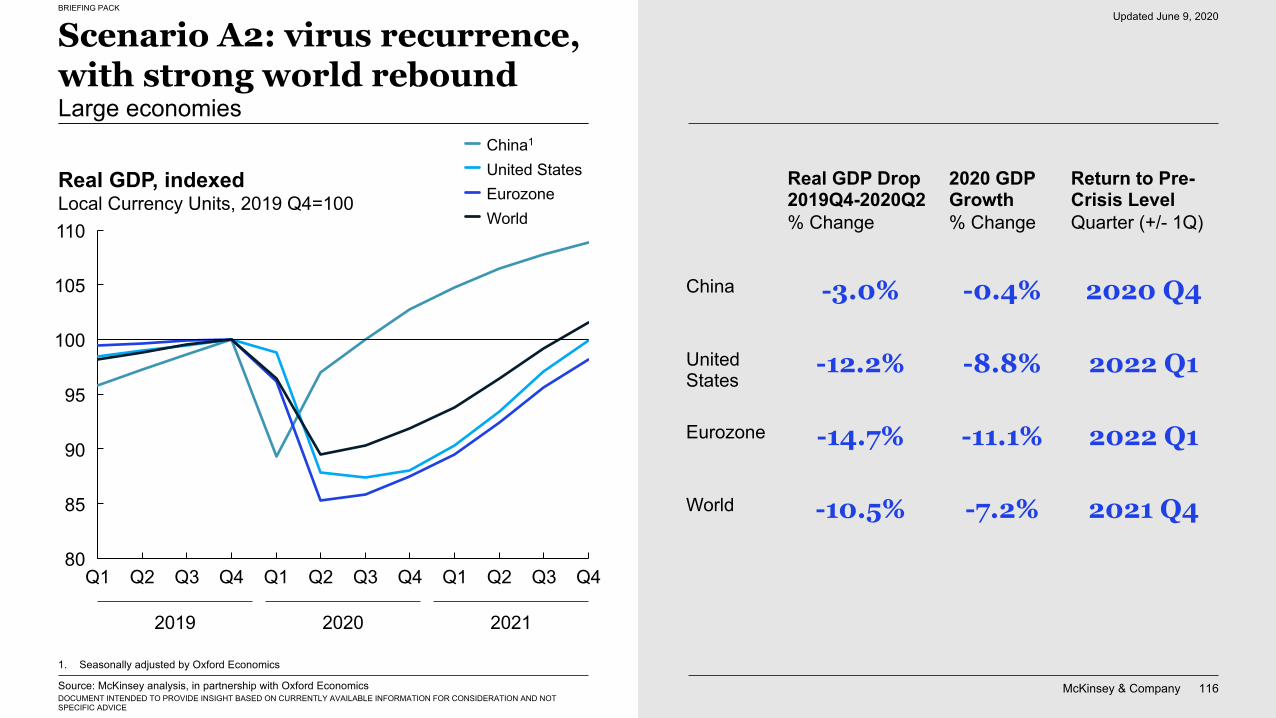
McKinsey & Company 116
BRIEFING PACK
DOCUMENT INTENDED TO PROVIDE INSIGHT BASED ON CURRENTLY AVAILABLE INFORMATION FOR CONSIDERATION AND NOT SPECIFIC ADVICE
105
80
95
85
100
90
110
Q1 Q2 Q2Q3 Q4 Q1 Q4Q3 Q1 Q2 Q3 Q4
Scenario A2: virus recurrence, with strong world reboundLarge economies
Real GDP, indexedLocal Currency Units, 2019 Q4=100 Eurozone
China1
World
United States
2019 2020 2021
Source: McKinsey analysis, in partnership with Oxford Economics
1. Seasonally adjusted by Oxford Economics
-3.0% 2020 Q4-0.4%China
-12.2% 2022 Q1-8.8%United States
-14.7% 2022 Q1-11.1%Eurozone
-10.5% 2021 Q4-7.2%World
Real GDP Drop 2019Q4-2020Q2 % Change
2020 GDP Growth% Change
Return to Pre-Crisis LevelQuarter (+/- 1Q)
Updated June 9, 2020
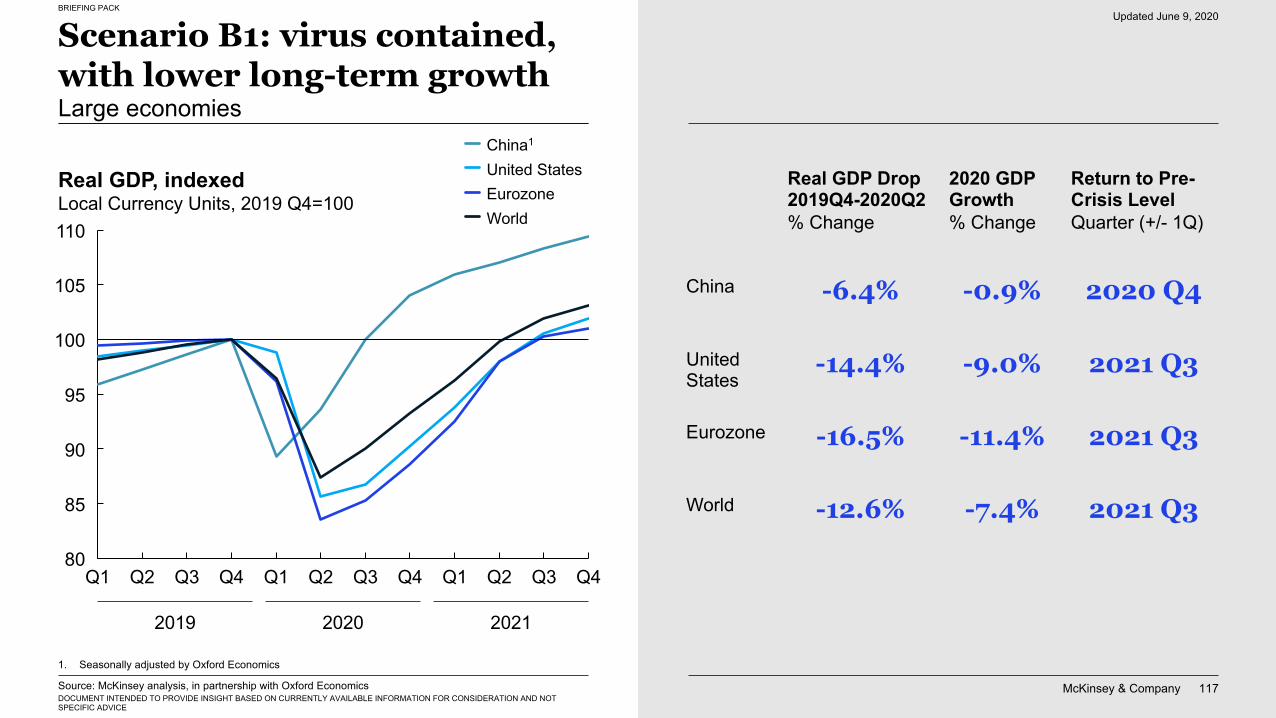
McKinsey & Company 117
BRIEFING PACK
DOCUMENT INTENDED TO PROVIDE INSIGHT BASED ON CURRENTLY AVAILABLE INFORMATION FOR CONSIDERATION AND NOT SPECIFIC ADVICE
Scenario B1: virus contained, with lower long-term growthLarge economies
110
85
100
80
90
95
105
Q3Q1 Q2 Q4 Q4Q1 Q2 Q3 Q1 Q2 Q3 Q4
Real GDP, indexedLocal Currency Units, 2019 Q4=100
China1
United StatesEurozoneWorld
2019 2020 2021
1. Seasonally adjusted by Oxford Economics
-6.4% 2020 Q4-0.9%China
-14.4% 2021 Q3-9.0%United States
-16.5% 2021 Q3-11.4%Eurozone
-12.6% 2021 Q3-7.4%World
Real GDP Drop 2019Q4-2020Q2 % Change
2020 GDP Growth% Change
Return to Pre-Crisis LevelQuarter (+/- 1Q)
Source: McKinsey analysis, in partnership with Oxford Economics
Updated June 9, 2020
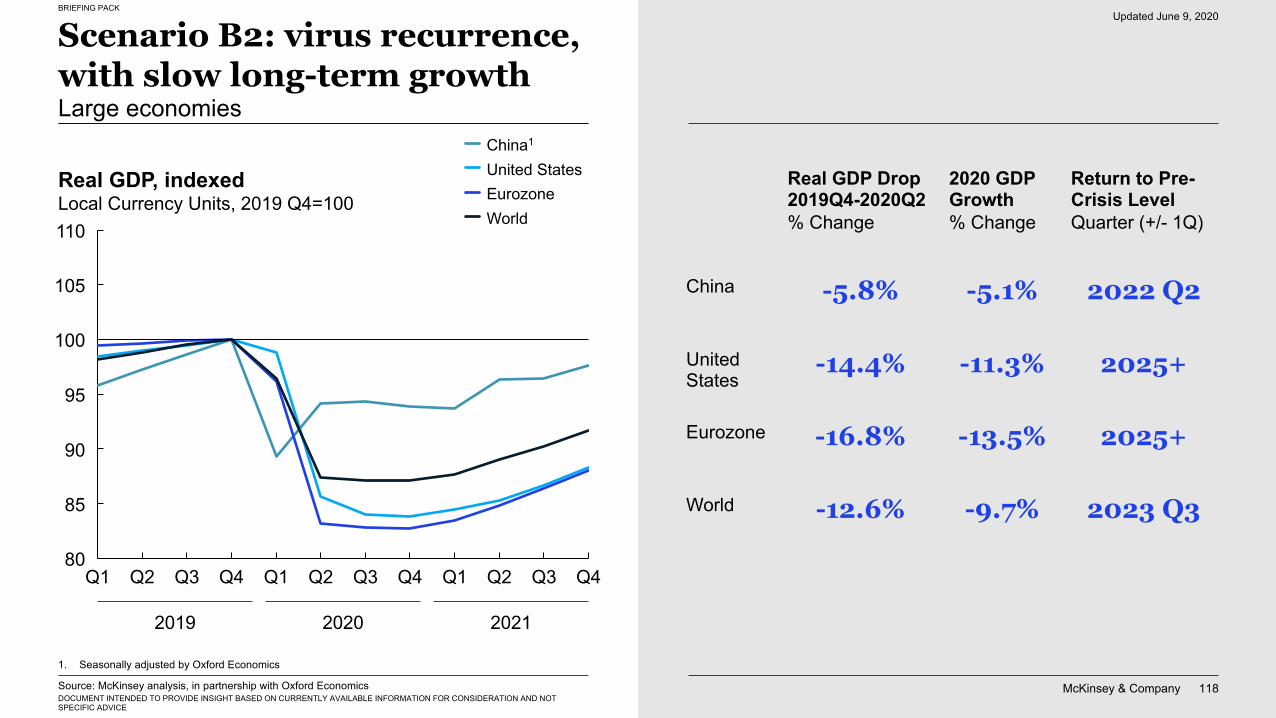
McKinsey & Company 118
BRIEFING PACK
DOCUMENT INTENDED TO PROVIDE INSIGHT BASED ON CURRENTLY AVAILABLE INFORMATION FOR CONSIDERATION AND NOT SPECIFIC ADVICE
Scenario B2: virus recurrence, with slow long-term growth Large economies
80
110
85
90
95
100
105
Q3Q2Q2Q1 Q2Q3 Q4 Q1Q1 Q3 Q4 Q4
Real GDP, indexedLocal Currency Units, 2019 Q4=100
United StatesChina1
EurozoneWorld
2019 2020 2021
1. Seasonally adjusted by Oxford Economics
-5.8% 2022 Q2-5.1%China
-14.4% 2025+-11.3%United States
-16.8% 2025+-13.5%Eurozone
-12.6% 2023 Q3-9.7%World
Real GDP Drop 2019Q4-2020Q2 % Change
2020 GDP Growth% Change
Return to Pre-Crisis LevelQuarter (+/- 1Q)
Source: McKinsey analysis, in partnership with Oxford Economics
Updated June 9, 2020
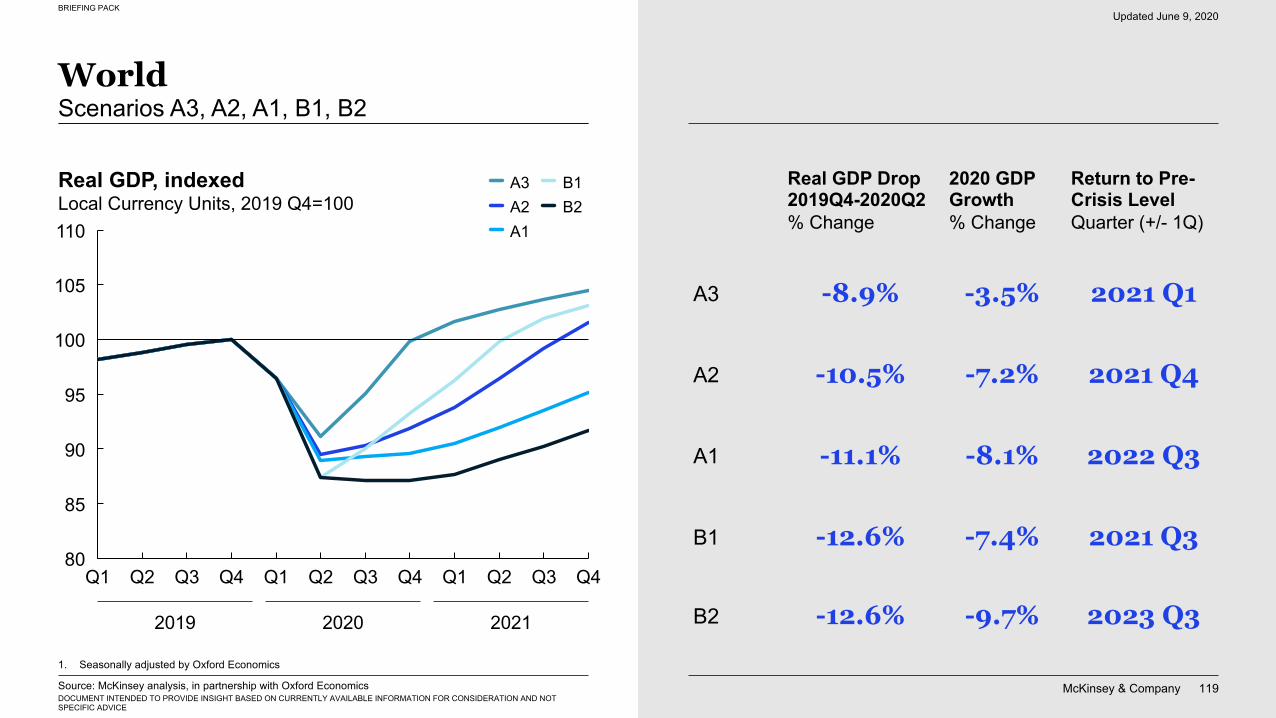
McKinsey & Company 119
BRIEFING PACK
DOCUMENT INTENDED TO PROVIDE INSIGHT BASED ON CURRENTLY AVAILABLE INFORMATION FOR CONSIDERATION AND NOT SPECIFIC ADVICE
95
80
110
90
85
100
105
Q2Q2Q1 Q1Q2 Q3 Q4 Q3 Q4 Q3Q1 Q4
WorldScenarios A3, A2, A1, B1, B2
Real GDP, indexedLocal Currency Units, 2019 Q4=100
2019 2020 2021
Source: McKinsey analysis, in partnership with Oxford Economics
1. Seasonally adjusted by Oxford Economics
-8.9% 2021 Q1-3.5%A3
-10.5% 2021 Q4-7.2%A2
-11.1% 2022 Q3-8.1%A1
-12.6% 2021 Q3-7.4%B1
Real GDP Drop 2019Q4-2020Q2 % Change
2020 GDP Growth% Change
Return to Pre-Crisis LevelQuarter (+/- 1Q)
A3A2
B1B2
A1
-12.6% 2023 Q3-9.7%B2
Updated June 9, 2020
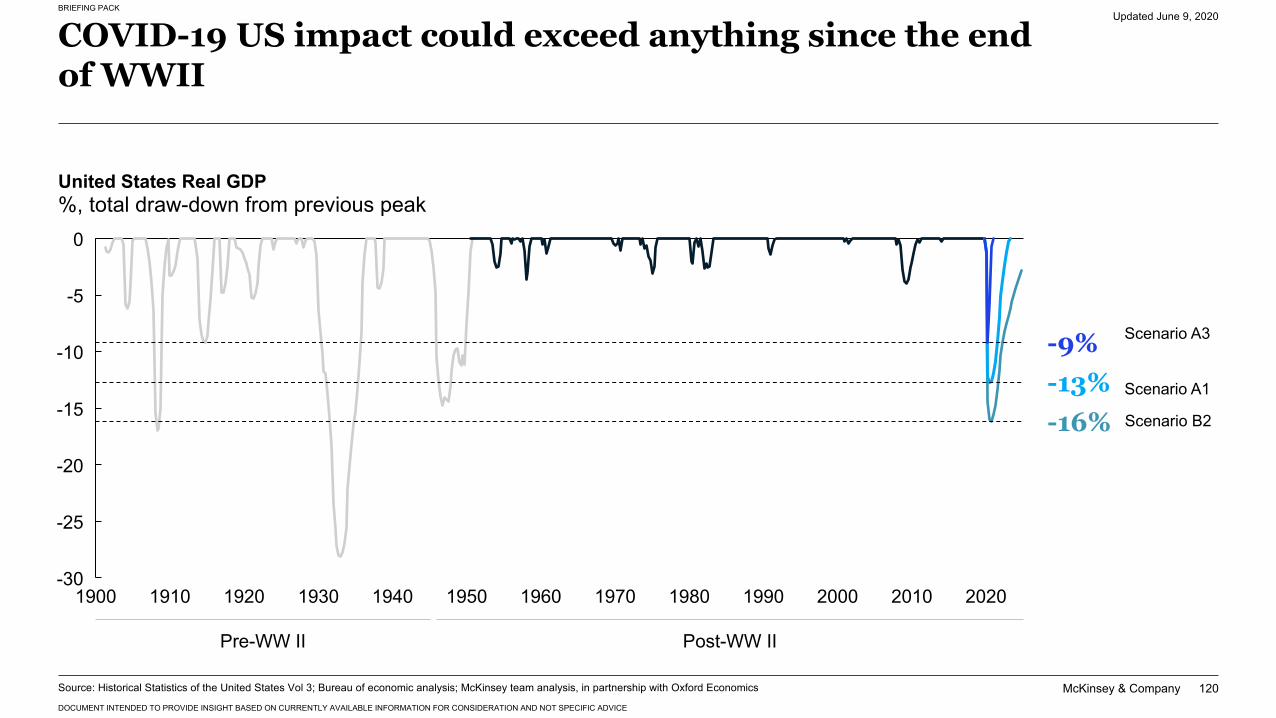
McKinsey & Company
BRIEFING PACK
DOCUMENT INTENDED TO PROVIDE INSIGHT BASED ON CURRENTLY AVAILABLE INFORMATION FOR CONSIDERATION AND NOT SPECIFIC ADVICE
120
-5
-30
-25
-20
-15
0
-10
1900 1930 195019401910 1920 20101960 1970 1980 1990 2000 2020
-9%-13%-16%
COVID-19 US impact could exceed anything since the end of WWII
Source: Historical Statistics of the United States Vol 3; Bureau of economic analysis; McKinsey team analysis, in partnership with Oxford Economics
Scenario A1
Scenario A3
Pre-WW II Post-WW II
United States Real GDP %, total draw-down from previous peak
Scenario B2
Updated June 9, 2020
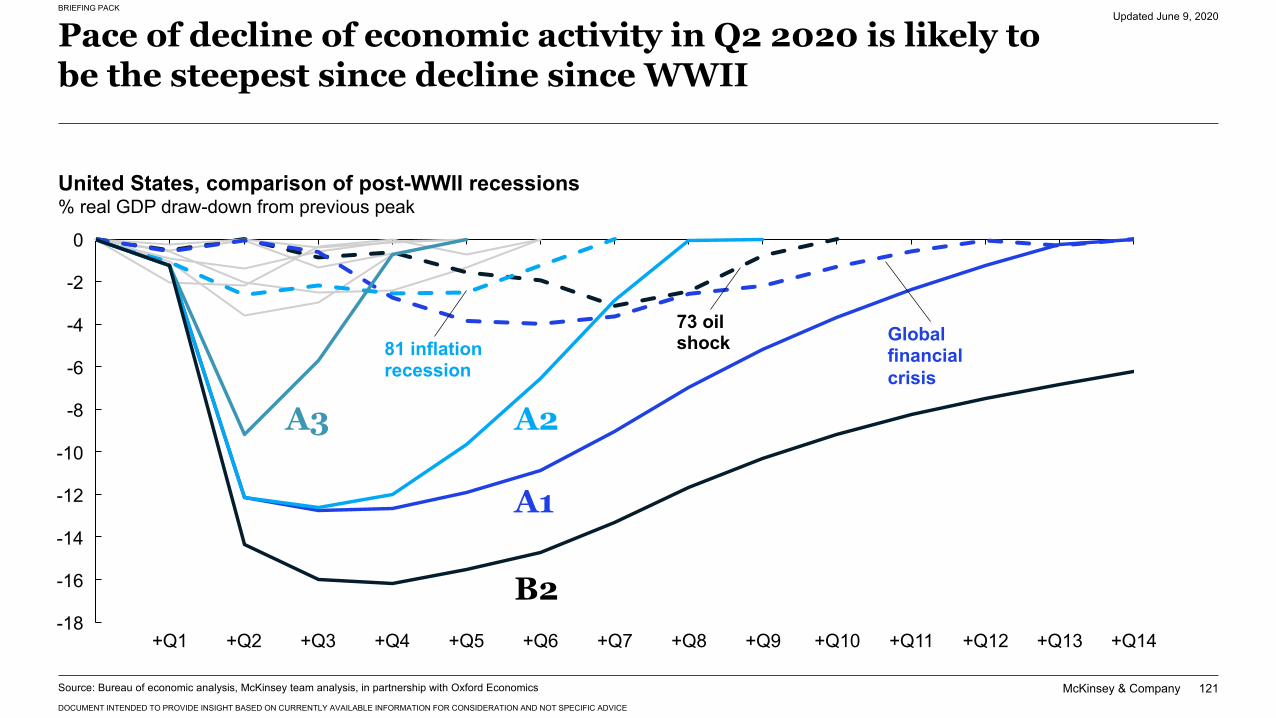
McKinsey & Company
BRIEFING PACK
DOCUMENT INTENDED TO PROVIDE INSIGHT BASED ON CURRENTLY AVAILABLE INFORMATION FOR CONSIDERATION AND NOT SPECIFIC ADVICE
121
A1
B2-18
-4
-16
-6
-14
-12
-8
-10
-2
0
+Q7 +Q10 +Q11 +Q14+Q1 +Q2 +Q3 +Q4 +Q5 +Q6 +Q8 +Q9 +Q12 +Q13
Pace of decline of economic activity in Q2 2020 is likely to be the steepest since decline since WWII
United States, comparison of post-WWII recessions% real GDP draw-down from previous peak
Source: Bureau of economic analysis, McKinsey team analysis, in partnership with Oxford Economics
A3
Global financial crisis
73 oil shock81 inflation
recession
A2
Updated June 9, 2020
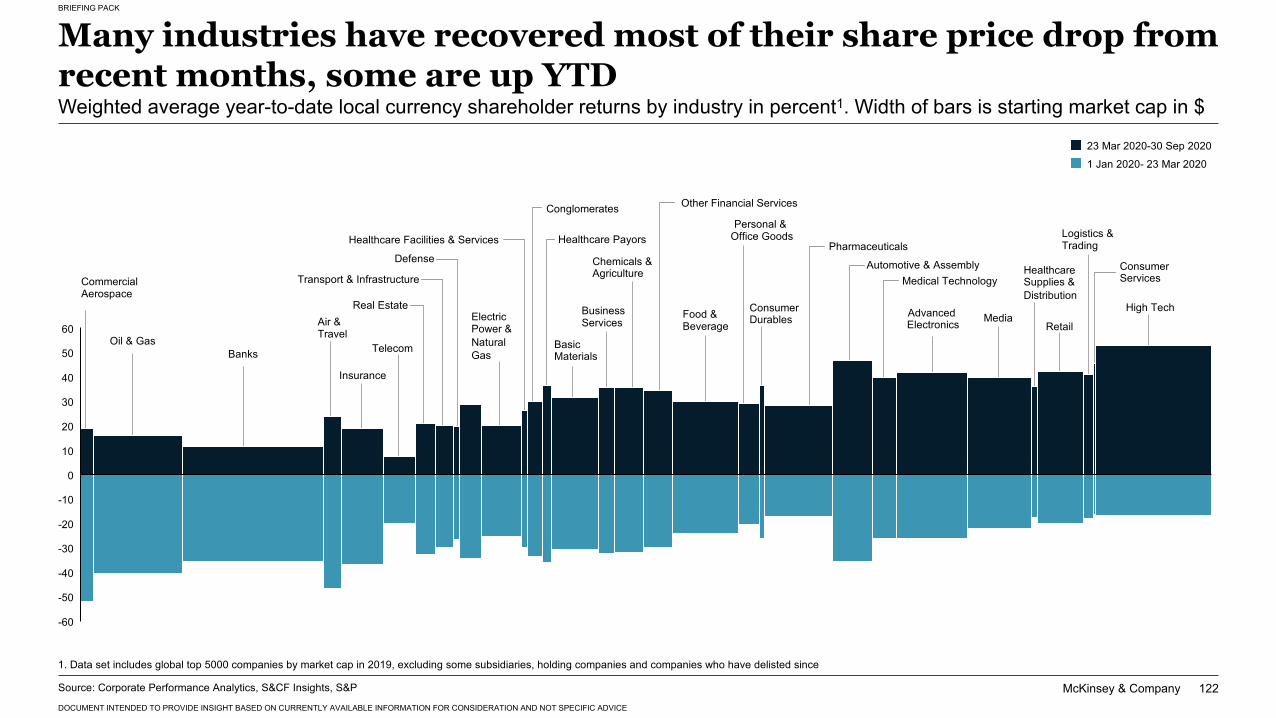
McKinsey & Company
BRIEFING PACK
DOCUMENT INTENDED TO PROVIDE INSIGHT BASED ON CURRENTLY AVAILABLE INFORMATION FOR CONSIDERATION AND NOT SPECIFIC ADVICE
122
Many industries have recovered most of their share price drop from recent months, some are up YTDWeighted average year-to-date local currency shareholder returns by industry in percent1. Width of bars is starting market cap in $
23 Mar 2020-30 Sep 2020
1 Jan 2020- 23 Mar 2020
Commercial Aerospace
Air & TravelOil & Gas
Banks
Insurance
Telecom
Real Estate
Transport & Infrastructure
Electric Power & Natural Gas
Defense
Healthcare Facilities & Services Healthcare Payors
Basic Materials
Business Services
Chemicals & Agriculture
Other Financial Services
Consumer Durables
Pharmaceuticals
Automotive & AssemblyMedical Technology
Advanced Electronics Media
Healthcare Supplies & Distribution
Logistics & Trading
Consumer Services
High Tech
Retail
Personal & Office Goods
Food & Beverage
Conglomerates
Source: Corporate Performance Analytics, S&CF Insights, S&P
1. Data set includes global top 5000 companies by market cap in 2019, excluding some subsidiaries, holding companies and companies who have delisted since
60
50
40
-10
0
-30
-40
-50
-20
-60
20
30
10
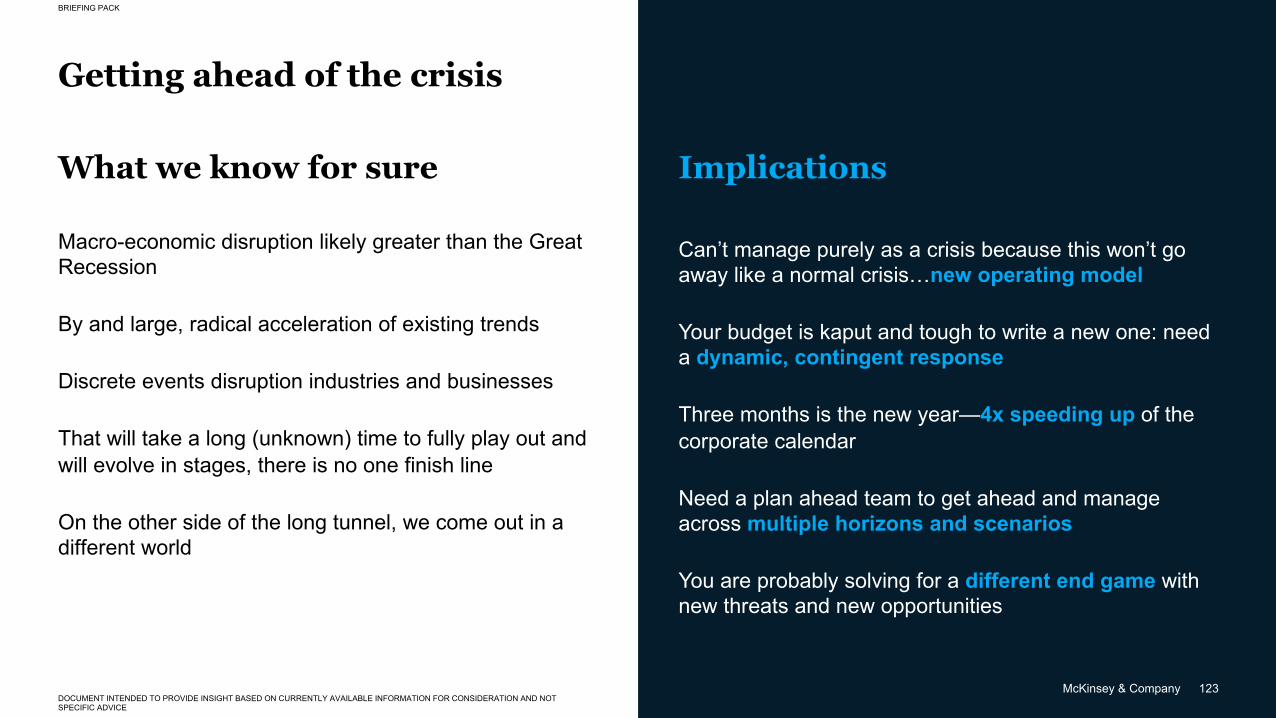
McKinsey & Company 123
BRIEFING PACK
DOCUMENT INTENDED TO PROVIDE INSIGHT BASED ON CURRENTLY AVAILABLE INFORMATION FOR CONSIDERATION AND NOT SPECIFIC ADVICE
Getting ahead of the crisis
What we know for sure
Macro-economic disruption likely greater than the Great Recession
By and large, radical acceleration of existing trends
Discrete events disruption industries and businesses
That will take a long (unknown) time to fully play out and will evolve in stages, there is no one finish line
On the other side of the long tunnel, we come out in a different world
Implications
Can’t manage purely as a crisis because this won’t go away like a normal crisis…new operating model
Your budget is kaput and tough to write a new one: need a dynamic, contingent response
Three months is the new year—4x speeding up of the corporate calendar
Need a plan ahead team to get ahead and manage across multiple horizons and scenarios
You are probably solving for a different end game with new threats and new opportunities
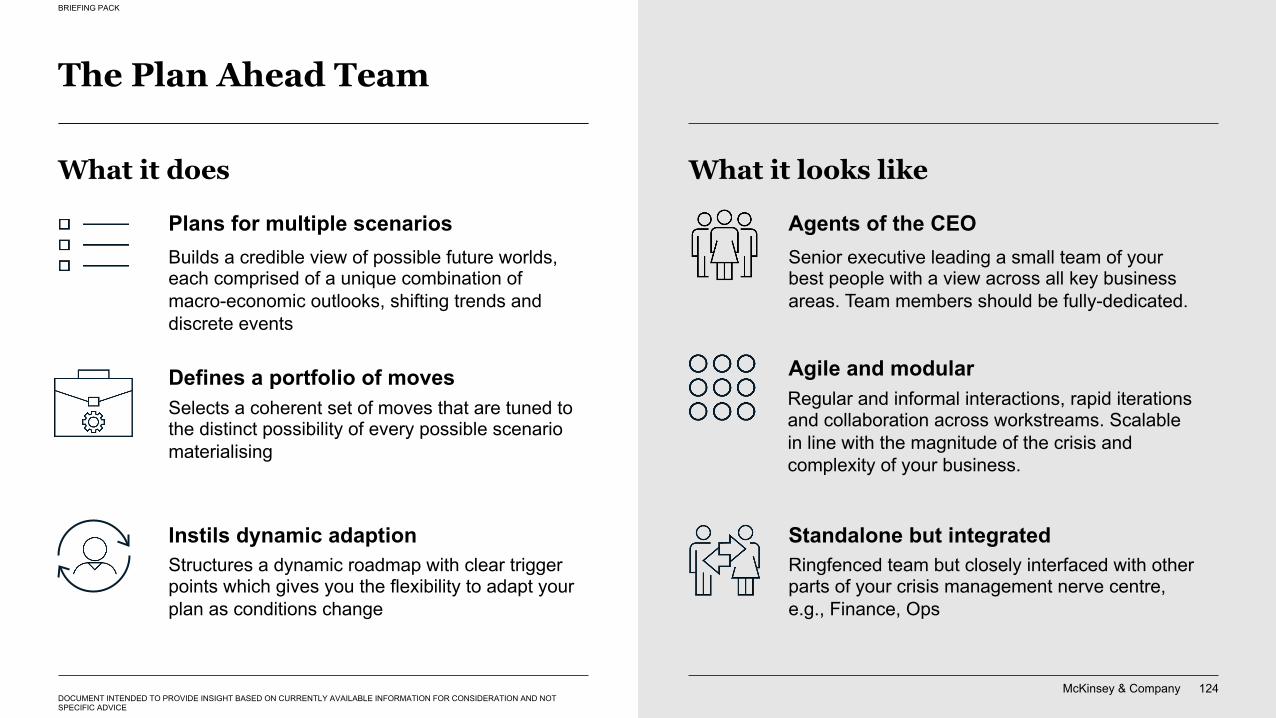
McKinsey & Company 124
BRIEFING PACK
DOCUMENT INTENDED TO PROVIDE INSIGHT BASED ON CURRENTLY AVAILABLE INFORMATION FOR CONSIDERATION AND NOT SPECIFIC ADVICE
The Plan Ahead Team
What it looks like
Senior executive leading a small team of your best people with a view across all key business areas. Team members should be fully-dedicated.
Agents of the CEO
Standalone but integrated
Defines a portfolio of movesSelects a coherent set of moves that are tuned to the distinct possibility of every possible scenario materialising
Instils dynamic adaptionStructures a dynamic roadmap with clear trigger points which gives you the flexibility to adapt your plan as conditions change
Plans for multiple scenariosBuilds a credible view of possible future worlds, each comprised of a unique combination of macro-economic outlooks, shifting trends and discrete events
What it does
Ringfenced team but closely interfaced with other parts of your crisis management nerve centre, e.g., Finance, Ops
Agile and modular Regular and informal interactions, rapid iterations and collaboration across workstreams. Scalable in line with the magnitude of the crisis and complexity of your business.
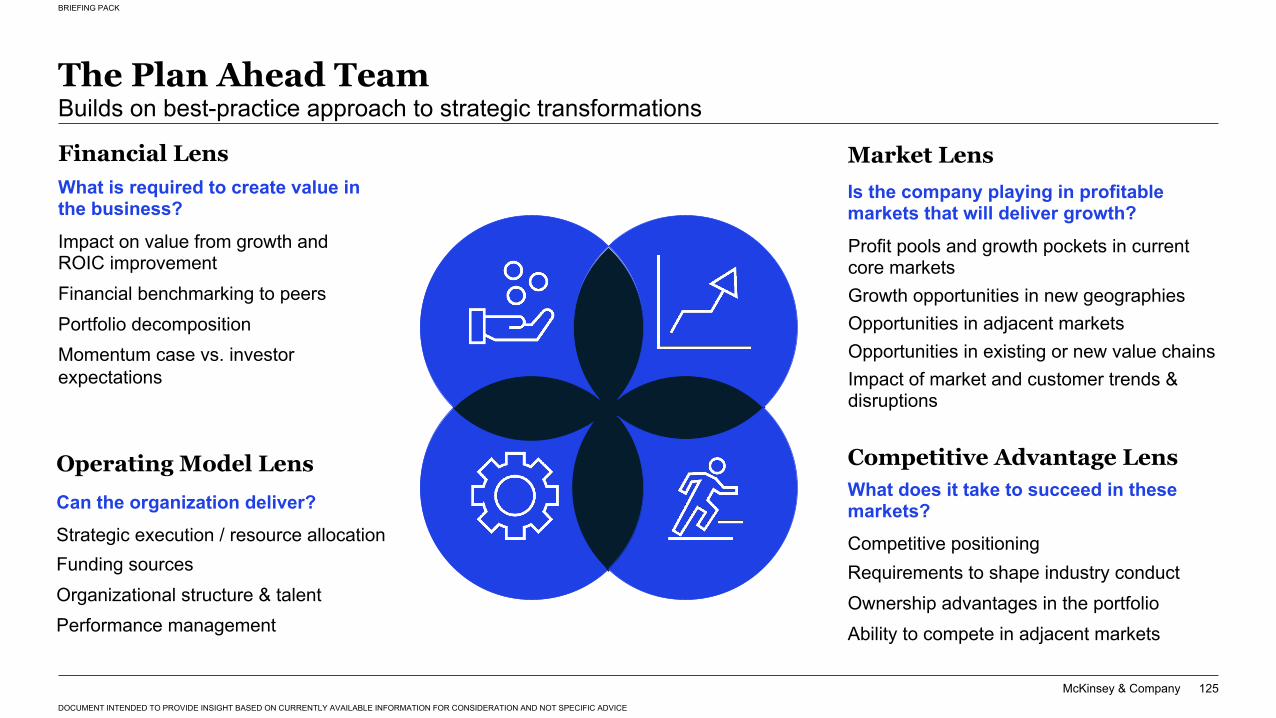
McKinsey & Company
BRIEFING PACK
DOCUMENT INTENDED TO PROVIDE INSIGHT BASED ON CURRENTLY AVAILABLE INFORMATION FOR CONSIDERATION AND NOT SPECIFIC ADVICE
125
The Plan Ahead TeamBuilds on best-practice approach to strategic transformations
Is the company playing in profitable markets that will deliver growth?
Market LensWhat is required to create value in the business?
Financial Lens
Impact on value from growth and ROIC improvementFinancial benchmarking to peersPortfolio decompositionMomentum case vs. investor expectations
Profit pools and growth pockets in current core markets Growth opportunities in new geographiesOpportunities in adjacent marketsOpportunities in existing or new value chainsImpact of market and customer trends & disruptions
What does it take to succeed in these markets?
Competitive Advantage Lens
Can the organization deliver?
Operating Model Lens
Strategic execution / resource allocationFunding sourcesOrganizational structure & talentPerformance management
Competitive positioningRequirements to shape industry conductOwnership advantages in the portfolioAbility to compete in adjacent markets
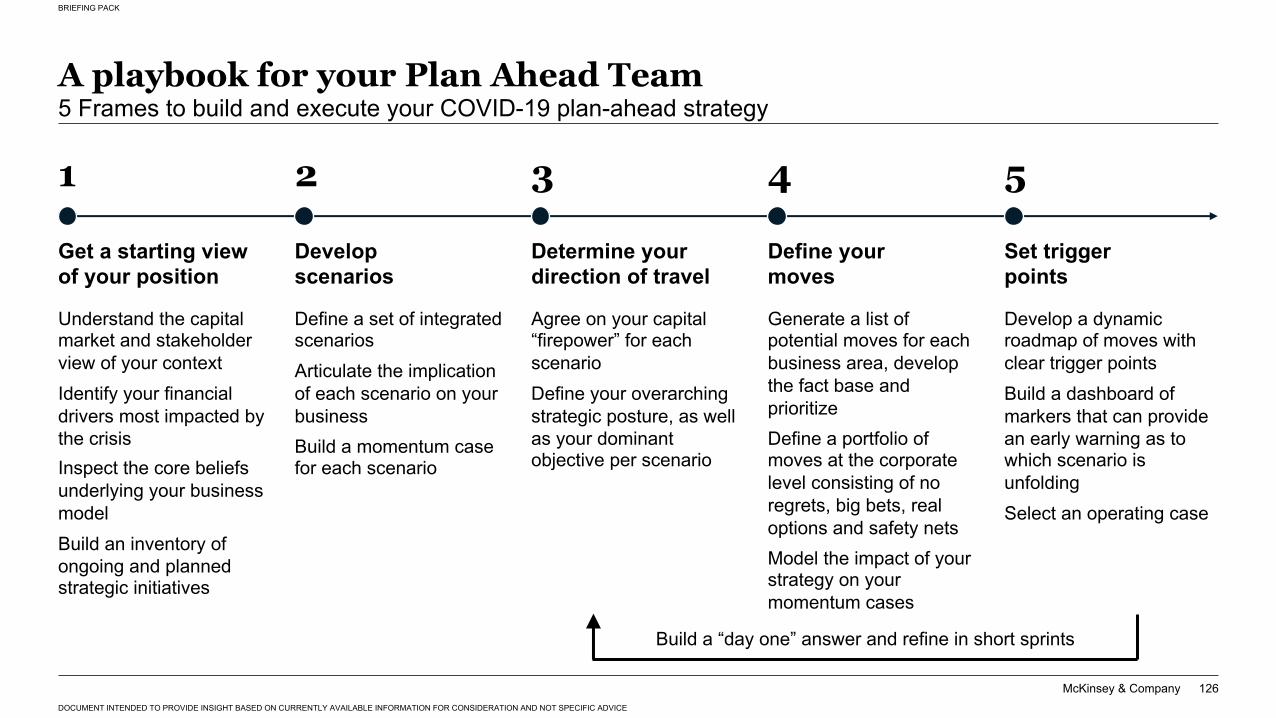
McKinsey & Company
BRIEFING PACK
DOCUMENT INTENDED TO PROVIDE INSIGHT BASED ON CURRENTLY AVAILABLE INFORMATION FOR CONSIDERATION AND NOT SPECIFIC ADVICE
126
A playbook for your Plan Ahead Team5 Frames to build and execute your COVID-19 plan-ahead strategy
Understand the capital market and stakeholder view of your contextIdentify your financial drivers most impacted by the crisisInspect the core beliefs underlying your business modelBuild an inventory of ongoing and planned strategic initiatives
Define a set of integrated scenariosArticulate the implication of each scenario on your business Build a momentum case for each scenario
Agree on your capital “firepower” for each scenarioDefine your overarching strategic posture, as well as your dominant objective per scenario
Generate a list of potential moves for each business area, develop the fact base and prioritizeDefine a portfolio of moves at the corporate level consisting of no regrets, big bets, real options and safety netsModel the impact of your strategy on your momentum cases
Develop a dynamic roadmap of moves with clear trigger points Build a dashboard of markers that can provide an early warning as to which scenario is unfoldingSelect an operating case
Get a starting view of your position
Developscenarios
Determine yourdirection of travel
Define your moves
Set triggerpoints
1 2 3 4 5
Build a “day one” answer and refine in short sprints
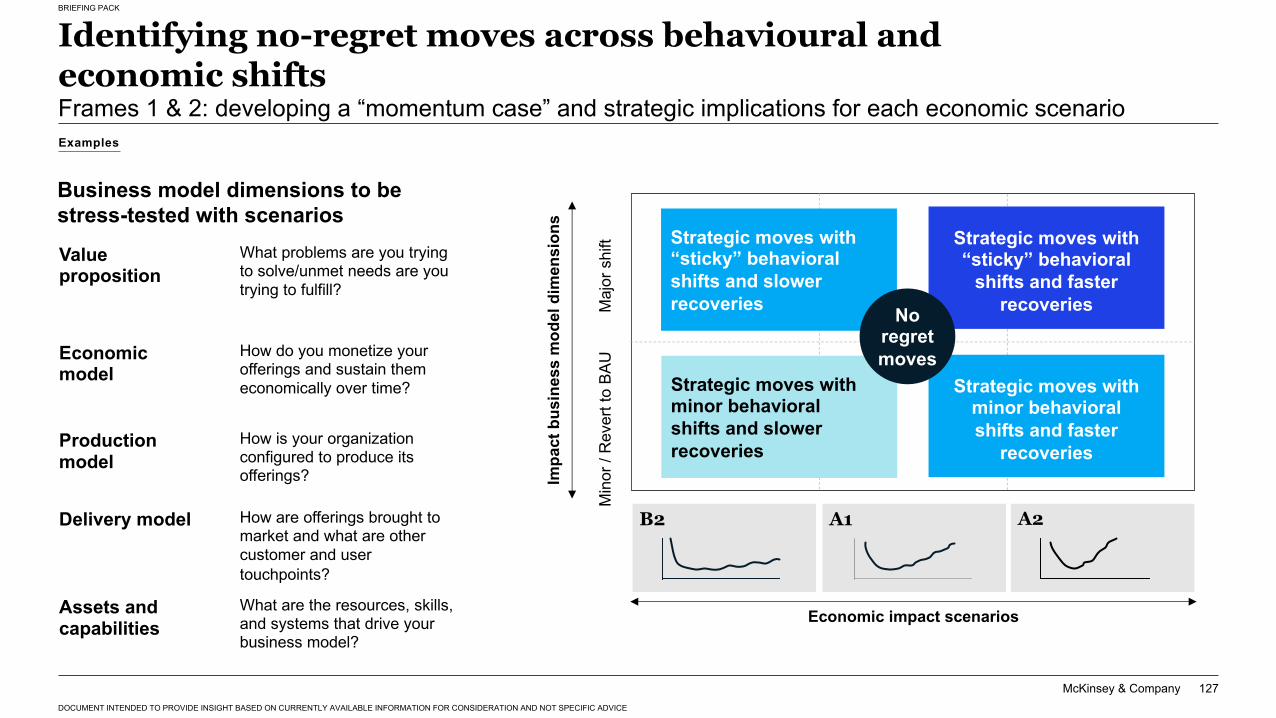
McKinsey & Company
BRIEFING PACK
DOCUMENT INTENDED TO PROVIDE INSIGHT BASED ON CURRENTLY AVAILABLE INFORMATION FOR CONSIDERATION AND NOT SPECIFIC ADVICE
127
Identifying no-regret moves across behavioural and economic shifts Frames 1 & 2: developing a “momentum case” and strategic implications for each economic scenario
Business model dimensions to be stress-tested with scenarios
Impa
ct b
usin
ess
mod
el d
imen
sion
s
Economic impact scenariosM
inor
/ R
ever
t to
BAU
Maj
or s
hift
A2A1B2
Production model
Delivery model
Assets and capabilities
Economic model
Value proposition
How is your organization configured to produce its offerings?
How are offerings brought to market and what are other customer and user touchpoints?
What are the resources, skills, and systems that drive your business model?
How do you monetize your offerings and sustain them economically over time?
What problems are you trying to solve/unmet needs are you trying to fulfill?
Examples
Strategic moves with “sticky” behavioral
shifts and faster recoveries
Strategic moves with minor behavioral shifts and slower recoveries
Strategic moves with “sticky” behavioral shifts and slower recoveries
Strategic moves with minor behavioral shifts and faster
recoveries
No regret moves

McKinsey & Company
BRIEFING PACK
DOCUMENT INTENDED TO PROVIDE INSIGHT BASED ON CURRENTLY AVAILABLE INFORMATION FOR CONSIDERATION AND NOT SPECIFIC ADVICE
128
The Plan Ahead TeamThe playbook to guide your strategic transformation
The Plan Ahead