COVID-19 Economic Data Tracker
12
Securities and insurance products and services – Are not FDIC or any other government agency insured | are not bank guaranteed | may lose value Week 23 – June 11, 2021 Michael Skordeles, AIF ® Senior U.S. Macro Strategist COVID-19 economic data tracker Trend watch and what’s new this week Key virus trends in the U.S. continue grinding lower (slide 3). Both new cases and hospitalizations are now at levels last seen in March 2020. Also, the pace of U.S. vaccinations started to rebound following the Memorial Day holiday, to 1.1 million per day (slide 4). This week, we highlight COVID-19 deaths by month (slide 6), which show a sharp decline in deaths coinciding with the vaccine rollout. We are keeping an eye on India and Brazil (slide 7). There has been a sharp decline in new infections in India following regional lockdowns. But, virus trends in Brazil, where politicians eschewed restrictions, remain a serious issue. We revisit apartment rental payments (slide 8), which appear to be heading towards the long-term rate. We also revisit vaccine hesitancy (slide 9), showing that the reasons are more nuanced than simply a red/blue political divide or North/South. The main determinant appears to be the level of education, along with urban/rural and age (slide 9). With respect to reopening, we are encouraged that public transit usage is ramping up in the top 11 U.S. cities, although it remains one of the most negatively-impacted aspects of daily life. Nonetheless, ridership in Miami is already well-above pre-pandemic levels. That said, Miami-Dade Transit suspended fares in March 2020 and ridership has slipped since fares were reinstated on June 1, 2021. Lastly, we show restaurant reservations on Saturdays (slide 11), which are the most important day for eateries. Saturday reservations nationally are nearly back to pre-pandemic levels. Bottom line It is starting off as a “hot” summer in several respects. Dramatically improving virus trends are triggering further state-level reopenings, allowing for more activities in the coming weeks. Also, demand is surging for travel, as reflected in restaurant reservations, hotel occupancy, and airline passenger counts (slide 5). Accordingly, we anticipate that the U.S. economy will continue to gather positive economic momentum over the summer. That said, everything is not fully recovered. For instance, we continue to see the impact of bottlenecks and production issues for key components, such as semiconductors. Moreover, many items that are on the way are backed up in the continuous heavy volume of imported goods, which is what freight experts are calling the ‘perpetual peak.’ Also, as the virus relapses in India and Brazil show, the global recovery is lagging the speed of the recoveries in China and the U.S.
Transcript of COVID-19 Economic Data Tracker

Securities and insurance products and services –Are not FDIC or any other government agency insured | are not bank guaranteed | may lose value
Week 23 – June 11, 2021Michael Skordeles, AIF®
Senior U.S. Macro Strategist
COVID-19 economic data tracker
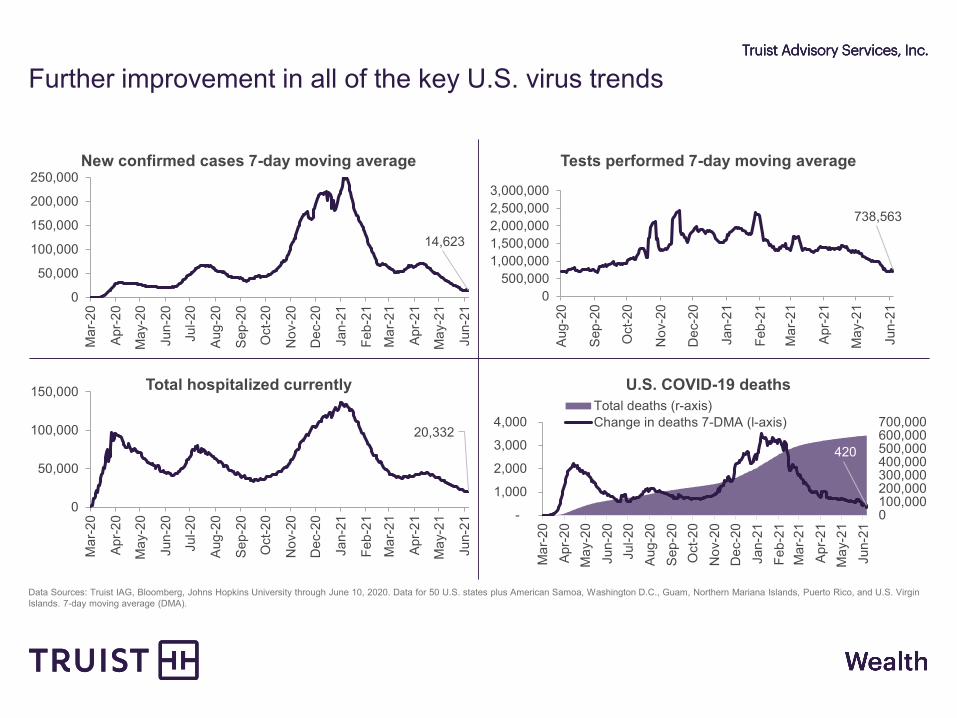
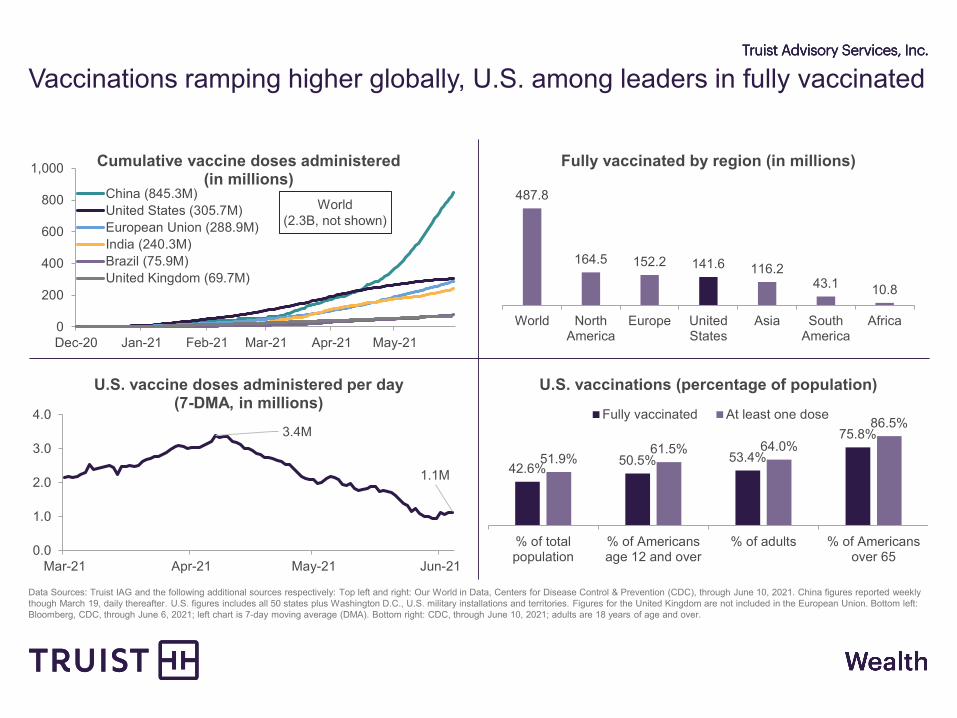
Trend watch and what’s new this weekKey virus trends in the U.S. continue grinding lower (slide 3). Both new cases and hospitalizations are now at levels last seen in March 2020. Also, the pace of U.S. vaccinations started to rebound following the Memorial Day holiday, to 1.1 million per day (slide 4).
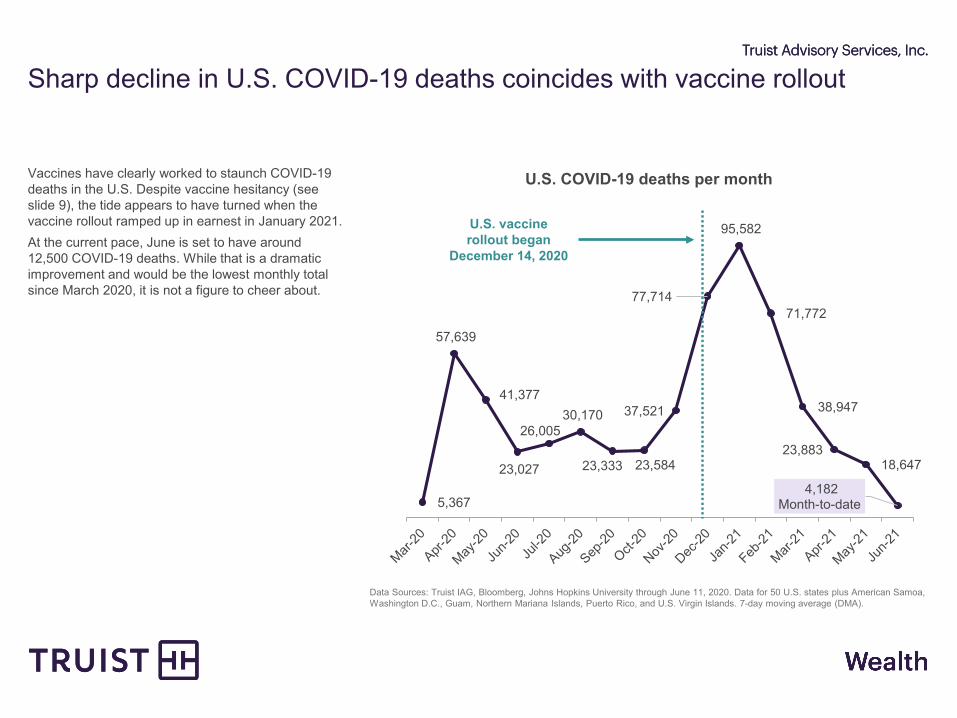
This week, we highlight COVID-19 deaths by month (slide 6), which show a sharp decline in deaths coinciding with the vaccine rollout.
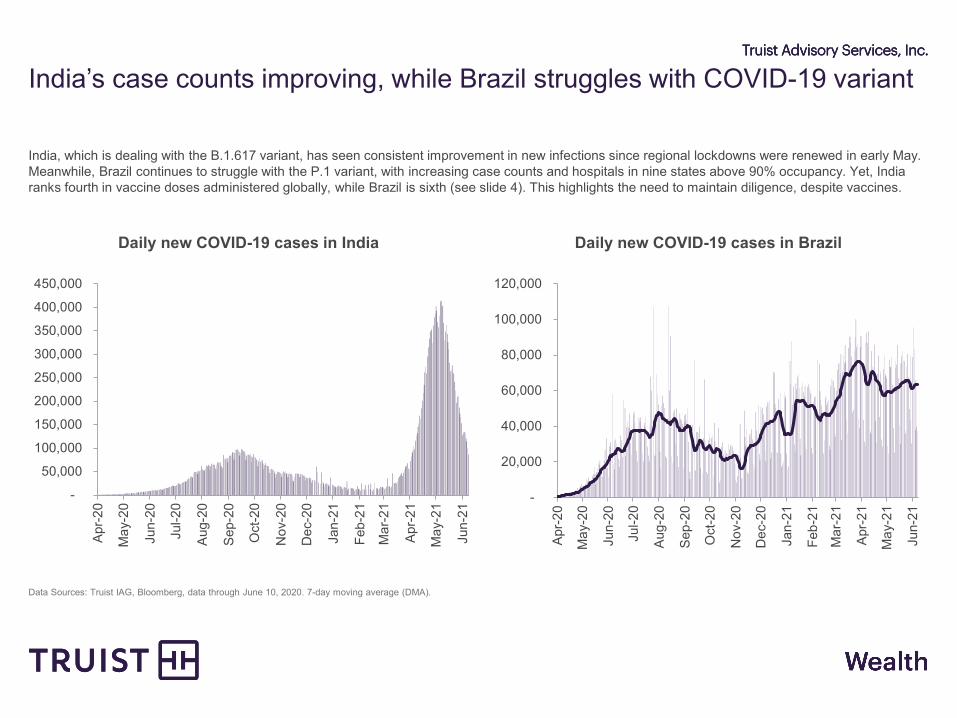
We are keeping an eye on India and Brazil (slide 7). There has been a sharp decline in new infections in India following regional lockdowns. But, virus trends in Brazil, where politicians eschewed restrictions, remain a serious issue.
We revisit apartment rental payments (slide 8), which appear to be heading towards the long-term rate.
We also revisit vaccine hesitancy (slide 9), showing that the reasons are more nuanced than simply a red/blue political divide or North/South. The main determinant appears to be the level of education, along with urban/rural and age (slide 9).
With respect to reopening, we are encouraged that public transit usage is ramping up in the top 11 U.S. cities, although it remains one of the most negatively-impacted aspects of daily life. Nonetheless, ridership in Miami is already well-above pre-pandemic levels. That
said, Miami-Dade Transit suspended fares in March 2020 and ridership has slipped since fares were reinstated on June 1, 2021.
Lastly, we show restaurant reservations on Saturdays (slide 11), which are the most important day for eateries. Saturday reservations nationally are nearly back to pre-pandemic levels.
Bottom lineIt is starting off as a “hot” summer in several respects. Dramatically improving virus trends are triggering further state-level reopenings, allowing for more activities in the coming weeks. Also, demand is surging for travel, as reflected in restaurant reservations, hotel occupancy, and airline passenger counts (slide 5). Accordingly, we anticipate that the U.S. economy will continue to gather positive economic momentum over the summer.
That said, everything is not fully recovered. For instance, we continue to see the impact of bottlenecks and production issues for key components, such as semiconductors. Moreover, many items that are on the way are backed up in the continuous heavy volume of imported goods, which is what freight experts are calling the ‘perpetual peak.’ Also, as the virus relapses in India and Brazil show, the global recovery is lagging the speed of the recoveries in China and the U.S.

U.S. COVID-19 economic data tracker matrix
I n d i c a t o r R e l a t i v e t r e n d W h a t w e ’ r e w a t c h i n g
U.S. state reopenings Vaccination rates are starting to climb once again, rising to 1.14M per day – the fastest pace in 10 days. New cases, hospitalizations, and deaths have fallen to March 2020 levels. As such, several more states eased restrictions beginning on June 1, which will lead to more activity.
TSA air passenger throughput Weekly passengers jumped 3.1% WoW, the seventh straight WoW jump, to 12.6 million. Passenger counts are
now -22.2% below the 2019 weekly average of 16.1 million. Warmer weather and vaccine rates are helping.
OpenTable restaurant bookings
Ticked down to -10.5% compared to pre-pandemic levels. NY state (-45%) backtracking, no others under -30%. San Fran, NYC, and DC are under -50%. The top states are Nevada (+58.4%), Florida (+26.5%), and Arizona (+15.5%). The top city is Miami (+73.5%), followed by Las Vegas (+55.8%) and Ft. Lauderdale (+54.7%).
Google mobility Parks jumped to 48% from 33% three weeks ago. 7-day average relative to 2020: Transit -18%, Residential +5%, Grocery/Pharmacy +5%, Retail/Restaurant/Recreation -4%, Workplaces -24%.
Hotel occupancy Occupancy rose to 61.9%, the highest level since the start of the pandemic. Miami and Tampa have seen the largest increases compared to 2019 levels. The overall average daily rate increased to $123.49.
Apartment rent payments
Rent payments through June 6 were 77.0%, down from 80.0% in May ’21 and 80.8% June ’20. Full month rents for May ’21 were 94.6%. That is basically flat from April ‘21 (95.0%) and in-line with the post-pandemic average of 94.6%, but down from May ’20 (95.1%).
Freight Container volumes at Long Beach, the U.S.’s second largest port, spiked 22% higher in May and was 8% above the prior all-time record. Rail carloads fell 7.7% WoW during the holiday week, vehicle shipments are also down due to carmakers’ bottlenecks. Freight experts are now calling the continuous heavy volume ‘perpetual peak’.
Staffing index Slipped modestly to 95.1 from 95.9, but remains above the mid-March peak of 94.9 and marks the highest level since December 2019. It is also well-above the low for this cycle of 59.6 set back in April 2020.
Trend relative to whether it is favorable for economic growth:Positive Negative Neutral / Mixed
Data Sources: Truist IAG, Bloomberg, Our World in Data, Transportation Security Administration, OpenTable, Google COVID-19 Community Mobility Report, STR/CoStar, National Multifamily Housing Council Rent Payment Tracker, American Staffing Association. Week-over-weak and year-over-year change are abbreviated as WoW and YoY, respectively.
Data Sources: Truist IAG, Bloomberg, Johns Hopkins University through June 10, 2020. Data for 50 U.S. states plus American Samoa, Washington D.C., Guam, Northern Mariana Islands, Puerto Rico, and U.S. Virgin Islands. 7-day moving average (DMA).
Further improvement in all of the key U.S. virus trends
738,563
0500,000
1,000,0001,500,0002,000,0002,500,0003,000,000
Aug-
20
Sep-
20
Oct
-20
Nov
-20
Dec
-20
Jan-
21
Feb-
21
Mar
-21
Apr-2
1
May
-21
Jun-
21
Tests performed 7-day moving average
14,623
0
50,000
100,000
150,000
200,000
250,000
Mar
-20
Apr-2
0
May
-20
Jun-
20
Jul-2
0
Aug-
20
Sep-
20
Oct
-20
Nov
-20
Dec
-20
Jan-
21
Feb-
21
Mar
-21
Apr-2
1
May
-21
Jun-
21
New confirmed cases 7-day moving average
20,332
0
50,000
100,000
150,000
Mar
-20
Apr-2
0
May
-20
Jun-
20
Jul-2
0
Aug-
20
Sep-
20
Oct
-20
Nov
-20
Dec
-20
Jan-
21
Feb-
21
Mar
-21
Apr-2
1
May
-21
Jun-
21
Total hospitalized currently
420
0100,000200,000300,000400,000500,000600,000700,000
Mar
-20
Apr-2
0M
ay-2
0Ju
n-20
Jul-2
0Au
g-20
Sep-
20O
ct-2
0N
ov-2
0D
ec-2
0Ja
n-21
Feb-
21M
ar-2
1Ap
r-21
May
-21
Jun-
21
-
1,000
2,000
3,000
4,000
U.S. COVID-19 deathsTotal deaths (r-axis)Change in deaths 7-DMA (l-axis)
0
200
400
600
800
1,000
Dec-20 Jan-21 Feb-21 Mar-21 Apr-21 May-21
Cumulative vaccine doses administered (in millions)
China (845.3M)United States (305.7M)European Union (288.9M)India (240.3M)Brazil (75.9M)United Kingdom (69.7M)
Data Sources: Truist IAG and the following additional sources respectively: Top left and right: Our World in Data, Centers for Disease Control & Prevention (CDC), through June 10, 2021. China figures reported weekly though March 19, daily thereafter. U.S. figures includes all 50 states plus Washington D.C., U.S. military installations and territories. Figures for the United Kingdom are not included in the European Union. Bottom left: Bloomberg, CDC, through June 6, 2021; left chart is 7-day moving average (DMA). Bottom right: CDC, through June 10, 2021; adults are 18 years of age and over.
Vaccinations ramping higher globally, U.S. among leaders in fully vaccinated
World(2.3B, not shown)
487.8
164.5 152.2 141.6 116.243.1 10.8
World NorthAmerica
Europe UnitedStates
Asia SouthAmerica
Africa
Fully vaccinated by region (in millions)
3.4M
1.1M
0.0
1.0
2.0
3.0
4.0
Mar-21 Apr-21 May-21 Jun-21
U.S. vaccine doses administered per day (7-DMA, in millions)
42.6% 50.5% 53.4%
75.8%
51.9%61.5% 64.0%
86.5%
% of totalpopulation
% of Americansage 12 and over
% of adults % of Americansover 65
U.S. vaccinations (percentage of population)
Fully vaccinated At least one dose

Data Sources: Truist IAG and the following additional sources respectively: Top left: Bloomberg, NY Federal Reserve Weekly Economic Index through June 5, 2021. Top right: (U.S. Community Mobility) Google COVID-19 Community Mobility Reports 7-day average through June 7. Bottom left: Bloomberg, OpenTable 7-day average through June 10. Bottom right: Bloomberg, Transportation Security Administration (TSA) 7-day average through June 10.
Reopening trends continue improving, adding to the momentum
10.0%
-12%-8%-4%0%4%8%
12%16%
NY Fed weekly economic index
1,797,060
0
500,000
1,000,000
1,500,000
2,000,000
2,500,000
Jan-
20Fe
b-20
Mar
-20
Apr-2
0M
ay-2
0Ju
n-20
Jul-2
0Au
g-20
Sep-
20O
ct-2
0N
ov-2
0D
ec-2
0Ja
n-21
Feb-
21M
ar-2
1Ap
r-21
May
-21
Jun-
21
TSA checkpoint traveler throughput (7-day average)
-100-75-50-25
0255075
Mar
-20
Apr-2
0
May
-20
Jun-
20
Jul-2
0
Aug-
20
Sep-
20
Oct
-20
Nov
-20
Dec
-20
Jan-
21
Feb-
21
Mar
-21
Apr-2
1
May
-21
Jun-
21
U.S. community mobility (7-day average)
Grocery & Pharmacy TransitWorkplaces ParksResidential Retail & Recreation
-10.5%
-100%-80%-60%-40%-20%
0%20%
Mar
-20
Apr-2
0
May
-20
Jun-
20
Jul-2
0
Aug-
20
Sep-
20
Oct
-20
Nov
-20
Dec
-20
Jan-
21
Feb-
21
Mar
-21
Apr-2
1
May
-21
Jun-
21
OpenTable bookings year-over-year % change (7-day average)
Sharp decline in U.S. COVID-19 deaths coincides with vaccine rollout
Vaccines have clearly worked to staunch COVID-19 deaths in the U.S. Despite vaccine hesitancy (see slide 9), the tide appears to have turned when the vaccine rollout ramped up in earnest in January 2021. At the current pace, June is set to have around 12,500 COVID-19 deaths. While that is a dramatic improvement and would be the lowest monthly total since March 2020, it is not a figure to cheer about.
Data Sources: Truist IAG, Bloomberg, Johns Hopkins University through June 11, 2020. Data for 50 U.S. states plus American Samoa, Washington D.C., Guam, Northern Mariana Islands, Puerto Rico, and U.S. Virgin Islands. 7-day moving average (DMA).
5,367
57,639
41,377
23,027
26,005 30,170
23,333 23,584
37,521
77,714
95,582
71,772
38,947
23,883 18,647
4,182 Month-to-date
U.S. COVID-19 deaths per month
U.S. vaccine rollout began
December 14, 2020
India’s case counts improving, while Brazil struggles with COVID-19 variant
India, which is dealing with the B.1.617 variant, has seen consistent improvement in new infections since regional lockdowns were renewed in early May. Meanwhile, Brazil continues to struggle with the P.1 variant, with increasing case counts and hospitals in nine states above 90% occupancy. Yet, India ranks fourth in vaccine doses administered globally, while Brazil is sixth (see slide 4). This highlights the need to maintain diligence, despite vaccines.
Data Sources: Truist IAG, Bloomberg, data through June 10, 2020. 7-day moving average (DMA).
-
20,000
40,000
60,000
80,000
100,000
120,000
Apr-2
0
May
-20
Jun-
20
Jul-2
0
Aug-
20
Sep-
20
Oct
-20
Nov
-20
Dec
-20
Jan-
21
Feb-
21
Mar
-21
Apr-2
1
May
-21
Jun-
21
Daily new COVID-19 cases in Brazil
-
50,000
100,000
150,000
200,000
250,000
300,000
350,000
400,000
450,000
Apr-2
0
May
-20
Jun-
20
Jul-2
0
Aug-
20
Sep-
20
Oct
-20
Nov
-20
Dec
-20
Jan-
21
Feb-
21
Mar
-21
Apr-2
1
May
-21
Jun-
21
Daily new COVID-19 cases in India

Apartment rental payments heading towards the long-term rate
Overall payments of apartment rents have been surprisingly steady over the past two years. Contrary to popular belief, the weakest period was not during the lockdowns, but occurred during the heart of the winter months from November 2020 to February 2021. Although full-month rental payments remain modestly below historical rates, the 3-month average has been steadily climbing back toward the pre-pandemic average of 96.0%.
Data Source: Truist IAG, National Multifamily Housing Council (NMHC); percentage of payments made at professionally managed units; full month payments; data through May 2021.
95.2%
90%
92%
94%
96%
98%
100%
Jun-
19Ju
l-19
Aug-
19Se
p-19
Oct
-19
Nov
-19
Dec
-19
Jan-
20Fe
b-20
Mar
-20
Apr-2
0M
ay-2
0Ju
n-20
Jul-2
0Au
g-20
Sep-
20O
ct-2
0N
ov-2
0D
ec-2
0Ja
n-21
Feb-
21M
ar-2
1Ap
r-21
May
-21
Apartment rental payment rate, 3-month average

80%
58% 64% 67%55%
12%
26%25% 18%
25%
8% 15% 9% 14% 17%
Collegegraduates
Non-collegegraduates
Urban Suburban Rural
U.S. vaccine willingness
Vaccinated Wait & see Defitinitely not
U.S. vaccine hesitancy/willingness appears to be related to education levels, urban/rural, and ageA recent Harris Poll suggests that age is also a contributing factor to vaccine hesitancy or willingness. A recent Kaiser Family Foundation survey suggests that the level of education is a key determinant, though urban/rural also seems to be a contributing factor. The latter could also be linked to access or convenience, such as being too far for some rural residents or awaiting a dispensary in their community.
Data Sources: left chart: Truist IAG, Kaiser Family Foundation, survey of 2,097 adults conducted between April 15-29, 2021. Vaccinated category includes both those who indicated they been vaccinated and those who responded ‘as soon as possible’; Wait & see includes those that indicated ‘wait & see’ and ‘only if required’. Totals may not equal 100% due to rounding and other factors. Right chart: Truist IAG, Harris Poll, survey of 2,014 adults conducted between June 4-6, 2021. ‘Vaccinated & ASAP’ includes those willing to receive the vaccine as soon as available in their area; ‘wait & see’ includes “when I get around to it” responses.
45% 46%
61%
78%
38% 38%
24%
10%17% 16% 15% 12%
Gen Z(ages 18-24)
Millenials(ages 25-40)
Gen X(ages 41-56)
Baby Boomer+(over age 57)
U.S. COVID-19 vaccine mindset
Vaccinated & ASAP Wait & see Definitely not

Public transit usage ramping up – Miami already above pre-pandemic levels
Public transit ridership has been steadily climbing nationally in 2021, which coincides with vaccine rollouts. Miami has already surpassed pre-pandemic usage, but Seattle and San Francisco remain down more than 50% compared to pre-pandemic levels. However, one important note: Miami-Dade Transit suspended fares in March 2020, and ridership has declined since fares were reinstated on June 1, 2021.
Data Sources: Truist IAG, Bloomberg, Moovit; data through June 9, 2021. Index compares use of Moovitapp for public transit, including bus, train, tram, subway/metro, and cable cars, to the week of January 8, 2020. Left chart shows 7-day moving average (DMA).
-30.6%
-80%
-70%
-60%
-50%
-40%
-30%
-20%
-10%
0%
10%
20%
Feb-
20M
ar-2
0
Apr-2
0
May
-20
Jun-
20
Jul-2
0
Aug-
20
Sep-
20
Oct
-20
Nov
-20
Dec
-20
Jan-
21
Feb-
21M
ar-2
1
Apr-2
1
May
-21
Jun-
21
Average change in public transit usage top 11 U.S. cities
13.7%
-100%
-80%
-60%
-40%
-20%
0%
20%
40%
Feb-
20M
ar-2
0
Apr-2
0M
ay-2
0
Jun-
20Ju
l-20
Aug-
20
Sep-
20O
ct-2
0
Nov
-20
Dec
-20
Jan-
21
Feb-
21M
ar-2
1
Apr-2
1M
ay-2
1
Jun-
21
Change in public transit usage by cityDC HoustonDallas Los AngelesSeattle PhiladelphiaSan Francisco ChicagoBoston MiamiNYC

State reopenings helping fine dining restaurants recover
Fast-food and fast-casual restaurant formats boomed during the pandemic as they continued serving patrons while maintaining social distancing with drive-thru windows and curbside pickup. But, fine dining was been hit particularly hard. And, Saturdays tend to be the best day of the week for fine dining restaurants. Saturday fine dining reservations have steadily improved since restrictions by states and major cities have eased in the spring. Weekly reservations nationally are down just 2.5% compared to the pre-pandemic levels. Several of the Florida cities—Naples (+66.7%), Ft. Lauderdale (+64.6%), Miami (+55.5%)—along with Las Vegas (+54.2%) were the busiest. However, reservations in a handful of cities, such as San Francisco (-59.2%) and New York City (-48.6%), remain greatly impacted.
Data Sources: Truist IAG, Bloomberg, OpenTable; data through June 5, 2021.
-2.5%
-100%
-80%
-60%
-40%
-20%
0%
U.S. OpenTable reservations on Saturdays year-over-year change

DisclosuresAdvisory managed account programs entail risks, including possible loss of principal and may not be suitable for all investors. Please speak to your advisor to request a firm brochure which includes program details, including risks, fees and expenses.Truist Wealth is a marketing name used by Truist Financial Corporation. Services offered by the following affiliates of Truist Financial Corporation: Banking products and services, including loans and deposit accounts, are provided by SunTrust Bank and Branch Banking and Trust Company, both now Truist Bank, Member FDIC. Trust and investment management services are provided by SunTrust Bank and Branch Banking and Trust Company, both now Truist Bank, and SunTrust Delaware Trust Company. Securities, brokerage accounts and /or insurance (including annuities) are offered by Truist Investment Services, Inc., and P.J. Robb Variable Corp., which are each SEC registered broker-dealers, members FINRA, SIPC, and a licensed insurance agency where applicable. Life insurance products are offered through Truist Life Insurance Services, a division of Crump Life Insurance Services, Inc., AR license #100103477, a wholly owned subsidiary of Truist Insurance Holdings, Inc. Investment advisory services are offered by Truist Advisory Services, Inc., GFO Advisory Services, LLC, Sterling Capital Management, LLC, and Precept Advisory Group, LLC, each SEC registered investment advisers. Sterling Capital Funds are advised by Sterling Capital Management, LLC.While this information is believed to be accurate, Truist Financial Corporation, including its affiliates, does not guarantee the accuracy, completeness or timeliness of, or otherwise endorse these analyses or market data.The opinions and information contained herein have been obtained or derived from sources believed to be reliable, but Truist Financial Corporation makes no representation or guarantee as to their timeliness, accuracy or completeness or for their fitness for any particular purpose. The information contained herein does not purport to be a complete analysis of any security, company, or industry involved. This material is not to be construed as an offer to sell or a solicitation of an offer to buy any security. Opinions and information expressed herein are subject to change without notice. TIS and/or its affiliates, including your Advisor, may have issued materials that are inconsistent with or may reach different conclusions than those represented in this commentary, and all opinions and information are believed to be reflective of judgments and opinions as of the date that material was originally published. TIS is under no obligation to ensure that other materials are brought to the attention of any recipient of this commentary. Comments regarding tax implications are informational only. Truist and its representatives do not provide tax or legal advice. You should consult your individual tax or legal professional before taking any action that may have tax or legal consequences.Investments involve risk and an investor may incur either profits or losses. Past performance should not be taken as an indication or guarantee of future performance. TIS/TAS shall accept no liability for any loss arising from the use of this material, nor shall TIS/TAS treat any recipient of this material as a customer or client simply by virtue of the receipt of this material. The information herein is for persons residing in the United States of America only and is not intended for any person in any other jurisdiction. The information contained in this material is produced and copyrighted by Truist Financial Corporation and any unauthorized use, duplication, redistribution or disclosure is prohibited by law. TIS/TAS’s officers, employees, agents and/or affiliates may have positions in securities, options, rights, or warrants mentioned or discussed in this material.
© 2021 Truist Financial Corporation. Truist, the Truist logo and Truist purple are service marks of Truist Financial Corporation
CN2021-2350 EXP 12-2021