
COVID-19 Age-Mortality Curves Are Flatter in Developing ...
33
Policy Research Working Paper 9313 COVID-19 Age-Mortality Curves Are Flatter in Developing Countries Gabriel Demombynes Human Development Global Practice July 2020 Public Disclosure Authorized Public Disclosure Authorized Public Disclosure Authorized Public Disclosure Authorized
Transcript of COVID-19 Age-Mortality Curves Are Flatter in Developing ...
Policy Research Working Paper 9313
COVID-19 Age-Mortality Curves Are Flatter in Developing Countries
Gabriel Demombynes
Human Development Global Practice July 2020
Pub
lic D
iscl
osur
e A
utho
rized
Pub
lic D
iscl
osur
e A
utho
rized
Pub
lic D
iscl
osur
e A
utho
rized
Pub
lic D
iscl
osur
e A
utho
rized
Produced by the Research Support Team
Abstract
The Policy Research Working Paper Series disseminates the findings of work in progress to encourage the exchange of ideas about development issues. An objective of the series is to get the findings out quickly, even if the presentations are less than fully polished. The papers carry the names of the authors and should be cited accordingly. The findings, interpretations, and conclusions expressed in this paper are entirely those of the authors. They do not necessarily represent the views of the International Bank for Reconstruction and Development/World Bank and its affiliated organizations, or those of the Executive Directors of the World Bank or the governments they represent.
Policy Research Working Paper 9313
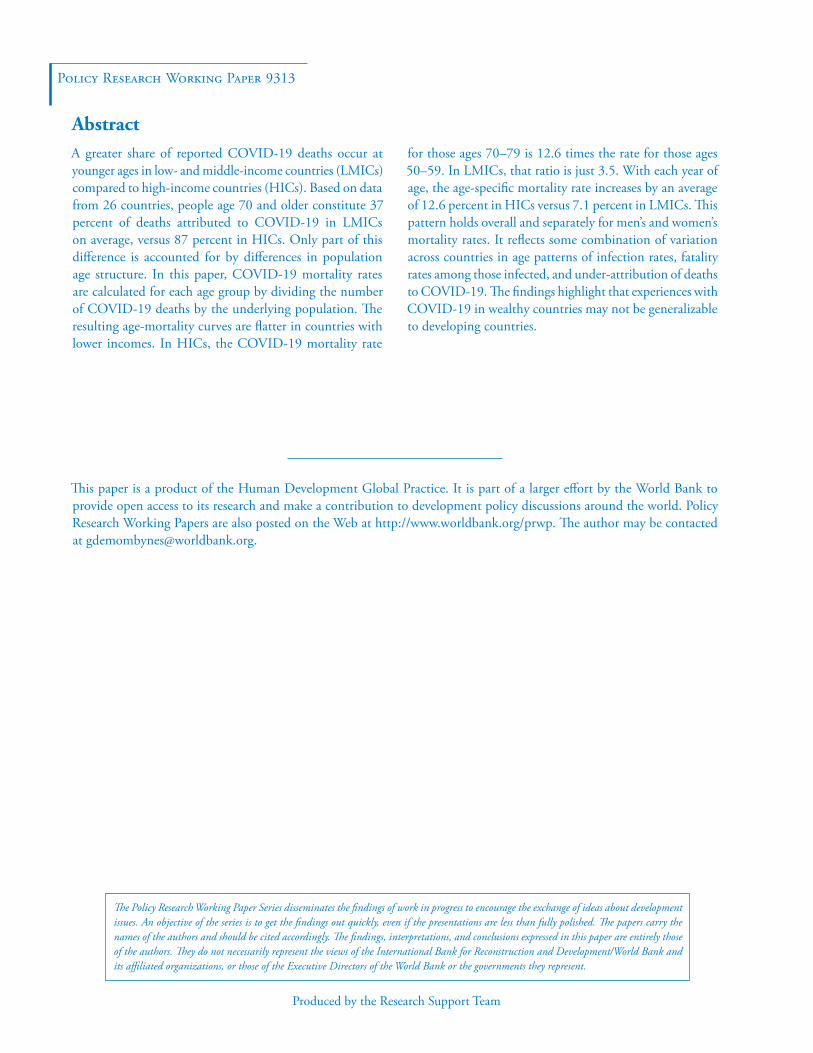
A greater share of reported COVID-19 deaths occur at younger ages in low- and middle-income countries (LMICs) compared to high-income countries (HICs). Based on data from 26 countries, people age 70 and older constitute 37 percent of deaths attributed to COVID-19 in LMICs on average, versus 87 percent in HICs. Only part of this difference is accounted for by differences in population age structure. In this paper, COVID-19 mortality rates are calculated for each age group by dividing the number of COVID-19 deaths by the underlying population. The resulting age-mortality curves are flatter in countries with lower incomes. In HICs, the COVID-19 mortality rate
for those ages 70–79 is 12.6 times the rate for those ages 50–59. In LMICs, that ratio is just 3.5. With each year of age, the age-specific mortality rate increases by an average of 12.6 percent in HICs versus 7.1 percent in LMICs. This pattern holds overall and separately for men’s and women’s mortality rates. It reflects some combination of variation across countries in age patterns of infection rates, fatality rates among those infected, and under-attribution of deaths to COVID-19. The findings highlight that experiences with COVID-19 in wealthy countries may not be generalizable to developing countries.
This paper is a product of the Human Development Global Practice. It is part of a larger effort by the World Bank to provide open access to its research and make a contribution to development policy discussions around the world. Policy Research Working Papers are also posted on the Web at http://www.worldbank.org/prwp. The author may be contacted at [email protected].
COVID-19 Age-Mortality Curves Are Flatter in Developing Countries
Gabriel Demombynes1
World Bank
JEL Classification: I18, O57, J10
Keywords: Coronavirus, Pandemic, Developing Countries, Mortality
1 The author expresses appreciation to Damien de Walque, Joshua R. Goldstein, Young Eun Kim, Ronald D. Lee, Norman Loayza, Andrew Noymer, Robert Oelrichs, Sharon Piza, and Piedad Urdinola for helpful suggestions, many World Bank colleagues for help in identifying data sources, and to Jill Adona for excellent research assistance.
2
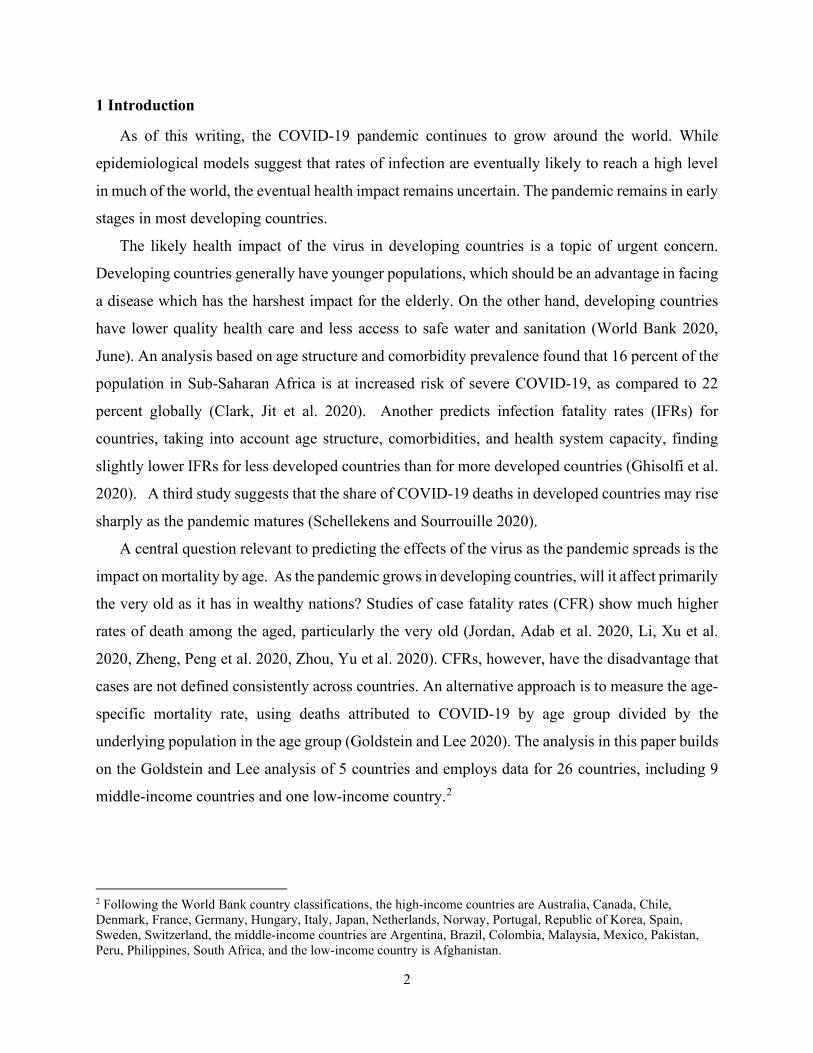
1 Introduction
As of this writing, the COVID-19 pandemic continues to grow around the world. While
epidemiological models suggest that rates of infection are eventually likely to reach a high level
in much of the world, the eventual health impact remains uncertain. The pandemic remains in early
stages in most developing countries.
The likely health impact of the virus in developing countries is a topic of urgent concern.
Developing countries generally have younger populations, which should be an advantage in facing
a disease which has the harshest impact for the elderly. On the other hand, developing countries
have lower quality health care and less access to safe water and sanitation (World Bank 2020,
June). An analysis based on age structure and comorbidity prevalence found that 16 percent of the
population in Sub-Saharan Africa is at increased risk of severe COVID-19, as compared to 22
percent globally (Clark, Jit et al. 2020). Another predicts infection fatality rates (IFRs) for
countries, taking into account age structure, comorbidities, and health system capacity, finding
slightly lower IFRs for less developed countries than for more developed countries (Ghisolfi et al.
2020). A third study suggests that the share of COVID-19 deaths in developed countries may rise
sharply as the pandemic matures (Schellekens and Sourrouille 2020).
A central question relevant to predicting the effects of the virus as the pandemic spreads is the
impact on mortality by age. As the pandemic grows in developing countries, will it affect primarily
the very old as it has in wealthy nations? Studies of case fatality rates (CFR) show much higher
rates of death among the aged, particularly the very old (Jordan, Adab et al. 2020, Li, Xu et al.
2020, Zheng, Peng et al. 2020, Zhou, Yu et al. 2020). CFRs, however, have the disadvantage that
cases are not defined consistently across countries. An alternative approach is to measure the age-
specific mortality rate, using deaths attributed to COVID-19 by age group divided by the
underlying population in the age group (Goldstein and Lee 2020). The analysis in this paper builds
on the Goldstein and Lee analysis of 5 countries and employs data for 26 countries, including 9
middle-income countries and one low-income country.2
2 Following the World Bank country classifications, the high-income countries are Australia, Canada, Chile, Denmark, France, Germany, Hungary, Italy, Japan, Netherlands, Norway, Portugal, Republic of Korea, Spain, Sweden, Switzerland, the middle-income countries are Argentina, Brazil, Colombia, Malaysia, Mexico, Pakistan, Peru, Philippines, South Africa, and the low-income country is Afghanistan.
3
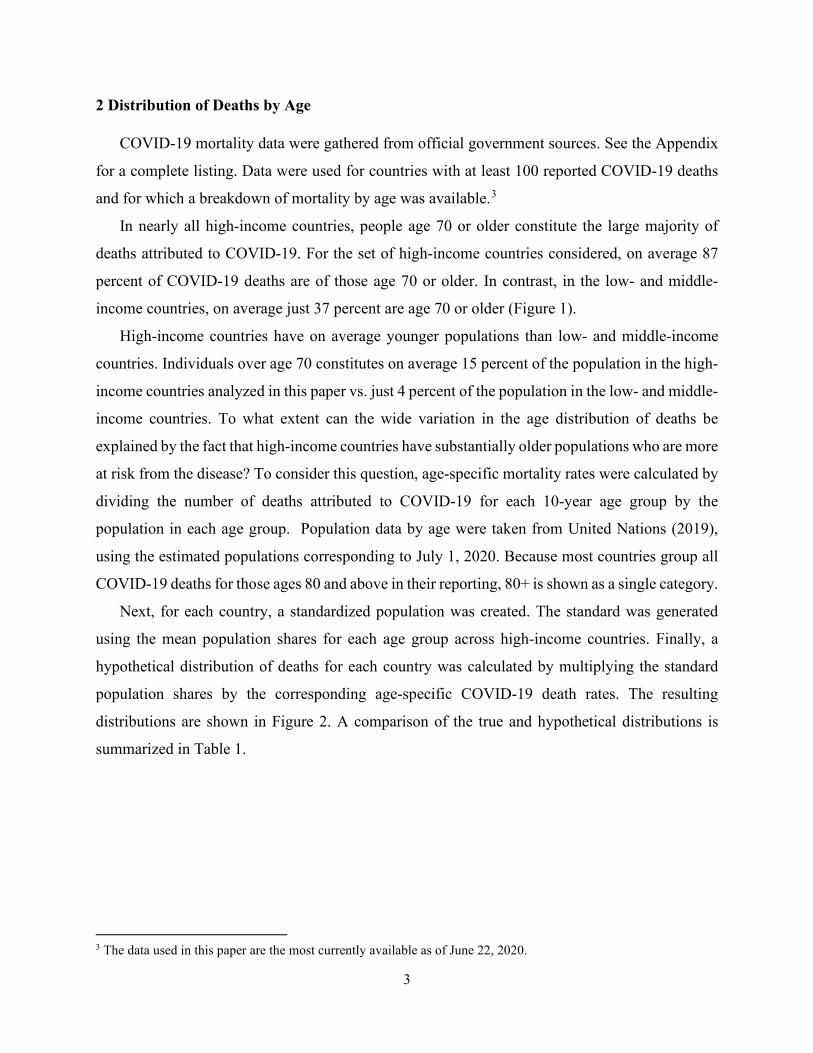
2 Distribution of Deaths by Age
COVID-19 mortality data were gathered from official government sources. See the Appendix
for a complete listing. Data were used for countries with at least 100 reported COVID-19 deaths
and for which a breakdown of mortality by age was available.3
In nearly all high-income countries, people age 70 or older constitute the large majority of
deaths attributed to COVID-19. For the set of high-income countries considered, on average 87
percent of COVID-19 deaths are of those age 70 or older. In contrast, in the low- and middle-
income countries, on average just 37 percent are age 70 or older (Figure 1).
High-income countries have on average younger populations than low- and middle-income
countries. Individuals over age 70 constitutes on average 15 percent of the population in the high-
income countries analyzed in this paper vs. just 4 percent of the population in the low- and middle-
income countries. To what extent can the wide variation in the age distribution of deaths be
explained by the fact that high-income countries have substantially older populations who are more
at risk from the disease? To consider this question, age-specific mortality rates were calculated by
dividing the number of deaths attributed to COVID-19 for each 10-year age group by the
population in each age group. Population data by age were taken from United Nations (2019),
using the estimated populations corresponding to July 1, 2020. Because most countries group all
COVID-19 deaths for those ages 80 and above in their reporting, 80+ is shown as a single category.
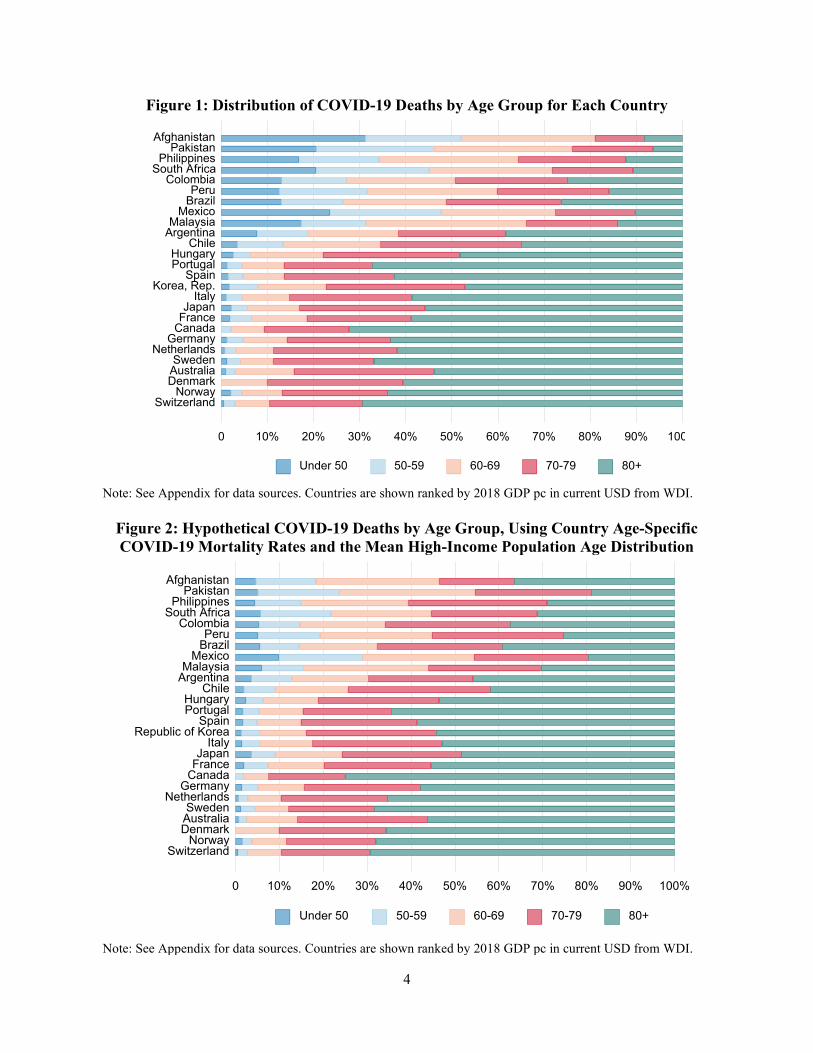
Next, for each country, a standardized population was created. The standard was generated
using the mean population shares for each age group across high-income countries. Finally, a
hypothetical distribution of deaths for each country was calculated by multiplying the standard
population shares by the corresponding age-specific COVID-19 death rates. The resulting
distributions are shown in Figure 2. A comparison of the true and hypothetical distributions is
summarized in Table 1.
3 The data used in this paper are the most currently available as of June 22, 2020.
4
Figure 1: Distribution of COVID-19 Deaths by Age Group for Each Country
Note: See Appendix for data sources. Countries are shown ranked by 2018 GDP pc in current USD from WDI.
Figure 2: Hypothetical COVID-19 Deaths by Age Group, Using Country Age-Specific COVID-19 Mortality Rates and the Mean High-Income Population Age Distribution
Note: See Appendix for data sources. Countries are shown ranked by 2018 GDP pc in current USD from WDI.
0 10% 20% 30% 40% 50% 60% 70% 80% 90% 100
SwitzerlandNorway
DenmarkAustraliaSweden
NetherlandsGermany
CanadaFranceJapan
ItalyKorea, Rep.
SpainPortugalHungary
ChileArgentinaMalaysia
MexicoBrazilPeru
ColombiaSouth Africa
PhilippinesPakistan
Afghanistan
Under 50 50-59 60-69 70-79 80+
0 10% 20% 30% 40% 50% 60% 70% 80% 90% 100%
SwitzerlandNorway
DenmarkAustraliaSweden
NetherlandsGermany
CanadaFranceJapan
ItalyRepublic of Korea
SpainPortugalHungary
ChileArgentinaMalaysia
MexicoBrazilPeru
ColombiaSouth Africa
PhilippinesPakistan
Afghanistan
Under 50 50-59 60-69 70-79 80+
5
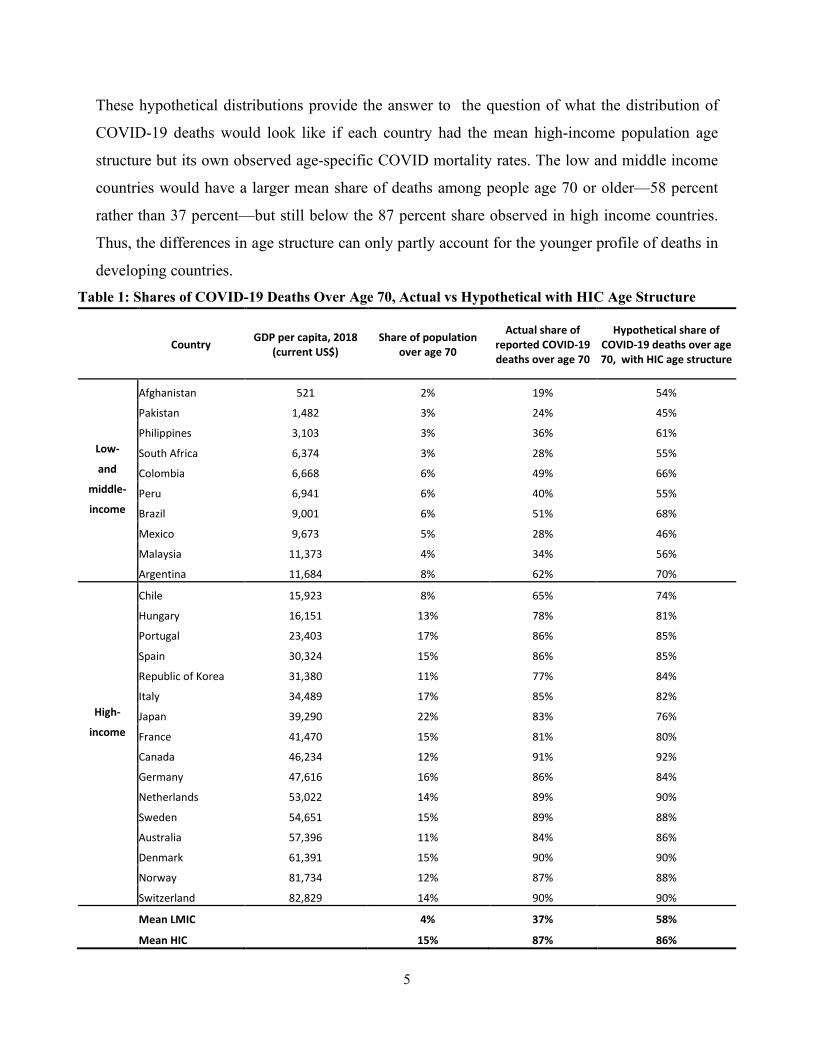
These hypothetical distributions provide the answer to the question of what the distribution of
COVID-19 deaths would look like if each country had the mean high-income population age
structure but its own observed age-specific COVID mortality rates. The low and middle income
countries would have a larger mean share of deaths among people age 70 or older—58 percent
rather than 37 percent—but still below the 87 percent share observed in high income countries.
Thus, the differences in age structure can only partly account for the younger profile of deaths in
developing countries. Table 1: Shares of COVID-19 Deaths Over Age 70, Actual vs Hypothetical with HIC Age Structure
Country GDP per capita, 2018 (current US$)
Share of population over age 70
Actual share of reported COVID-19 deaths over age 70
Hypothetical share of COVID-19 deaths over age 70, with HIC age structure
Afghanistan 521 2% 19% 54% Pakistan 1,482 3% 24% 45%
Philippines 3,103 3% 36% 61% Low- South Africa 6,374 3% 28% 55% and Colombia 6,668 6% 49% 66%
middle- Peru 6,941 6% 40% 55% income Brazil 9,001 6% 51% 68%
Mexico 9,673 5% 28% 46% Malaysia 11,373 4% 34% 56% Argentina 11,684 8% 62% 70% Chile 15,923 8% 65% 74% Hungary 16,151 13% 78% 81%
Portugal 23,403 17% 86% 85% Spain 30,324 15% 86% 85%
Republic of Korea 31,380 11% 77% 84% Italy 34,489 17% 85% 82%
High- Japan 39,290 22% 83% 76% income France 41,470 15% 81% 80%
Canada 46,234 12% 91% 92% Germany 47,616 16% 86% 84% Netherlands 53,022 14% 89% 90% Sweden 54,651 15% 89% 88% Australia 57,396 11% 84% 86% Denmark 61,391 15% 90% 90% Norway 81,734 12% 87% 88% Switzerland 82,829 14% 90% 90% Mean LMIC 4% 37% 58% Mean HIC 15% 87% 86%
6
3 Age-Mortality Profiles
The remainder of this discussion considers the differences across countries in age-specific
COVID-19 mortality rates, which in effect net out differences in age structure. Age-specific
mortality rates are calculated by dividing deaths attributed to COVID by the underlying population
count. They are distinct from a case fatality rate (CFR), which is the number of deaths divided by
the number of recognized cases, and also from the infection fatality rate (IFR), which is the number
of deaths divided by the number of people infected. The age-specific mortality calculations rely
on United Nations population counts by age, which depend on the quality and availability of census
and/or population registry data. Afghanistan last had a census in 1979, so its population estimates
are likely to be particularly imprecise. Sweden adopted a register-based approach in 1995. All the
other countries considered here have recent censuses.
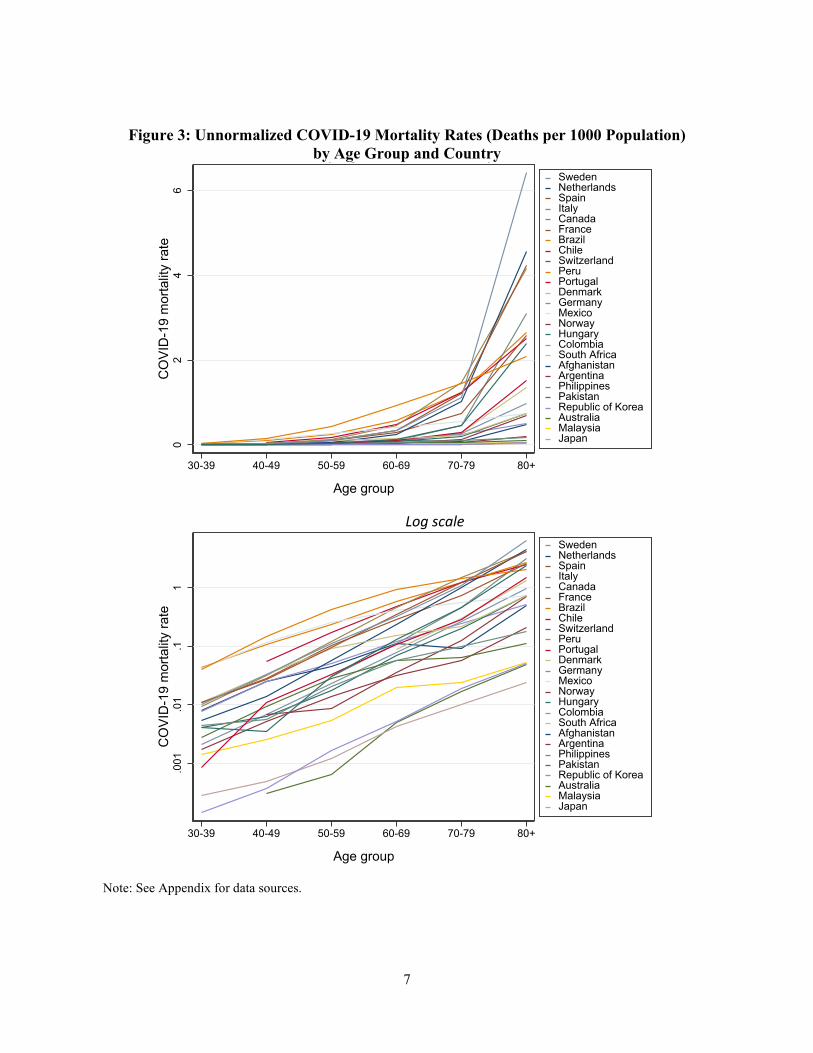
For this analysis, a country-specific adjustment factor is applied to the 80+ mortality rates to
account for the fact that the age distribution of the 80+ age group varies across countries. See the
Appendix for details. The full set of mortality rates are shown in Figure 3. Because different
countries have very different overall COVID-19 mortality, the age-specific mortality rates are at
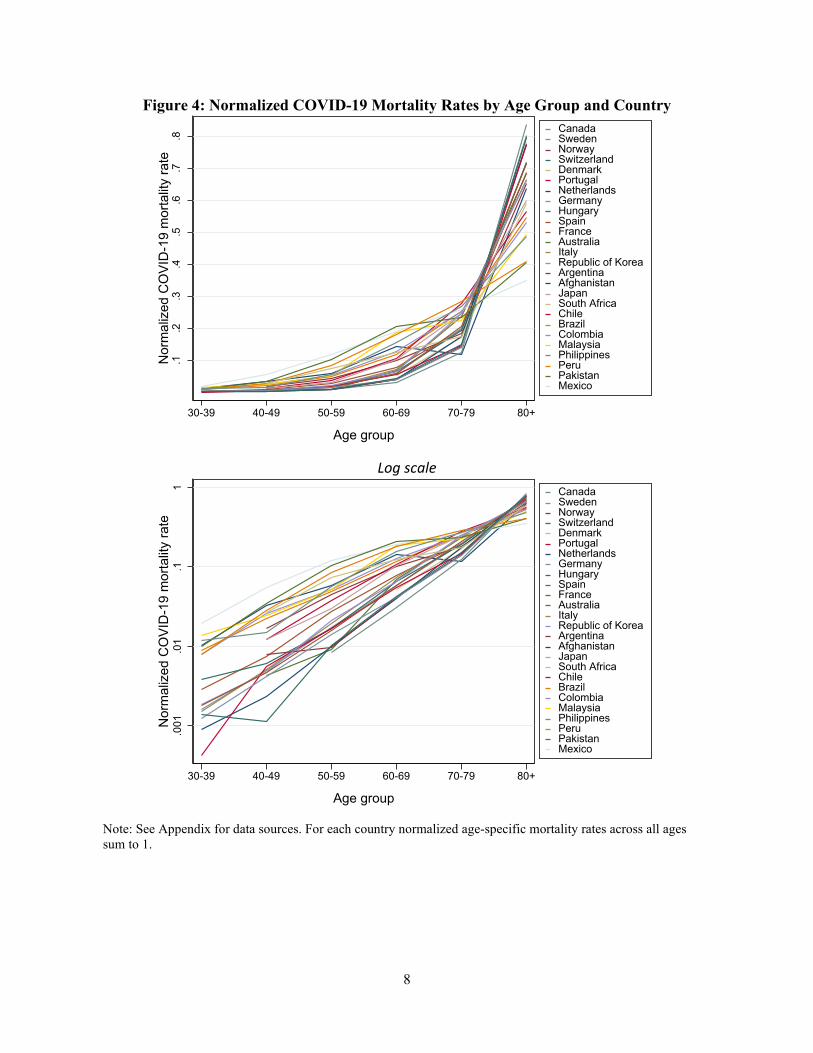
different levels. To compare the shape of the age-mortality curve across countries, normalized
COVID-19 mortality rates were calculated for each country by summing up the mortality rates
across age groups and then dividing the age-specific rates by this sum, so that they sum to one for
any given country.
Normalized age-mortality curves are shown in Figure 4. In interpreting the normalized curves,
it is important to recognize that they are only useful for comparing the shapes of the curves across
countries. A comparison between countries of the normalized mortality rate for any particular age
group is not informative.
The normalized curves make readily apparent the differences in curve shape across countries.
Overall, higher income nations show steeper curves, i.e. in those countries death rates are much
higher for the oldest groups (70-79 and 80+) than for those in the slightly younger groups (40-49,
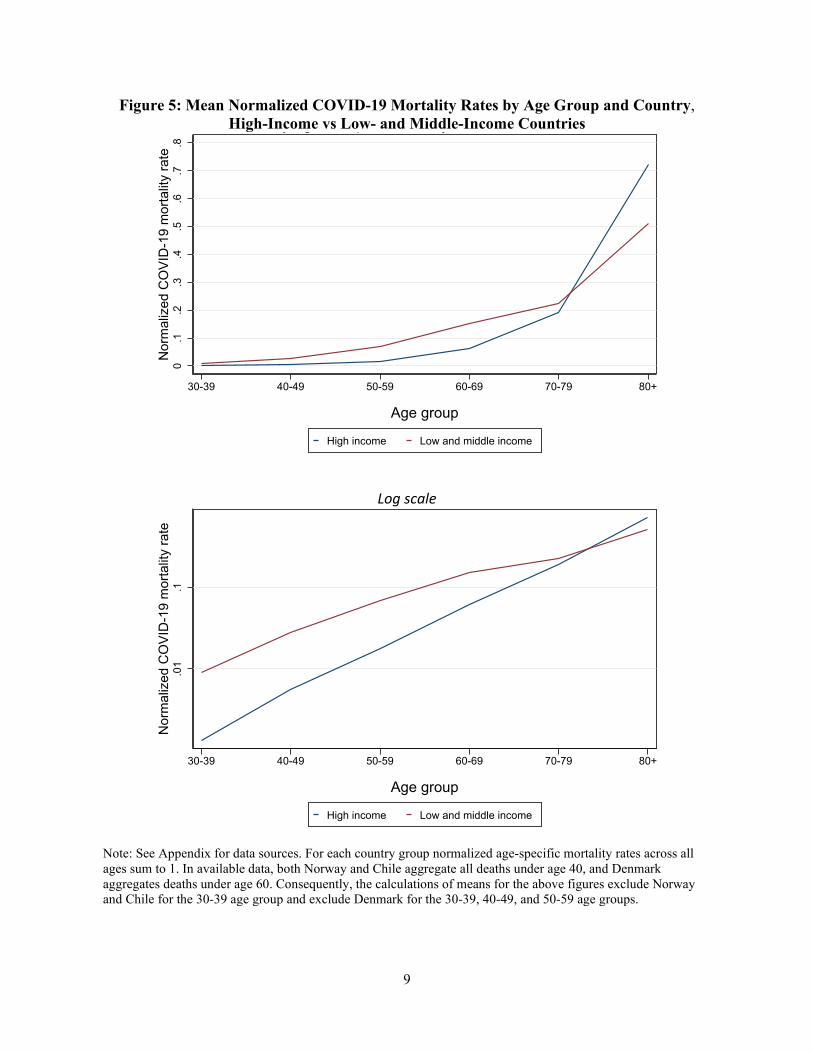
50-59, and 60-69). The average age-specific mortality rates for the high-income countries and
separately the low- and middle-income countries are shown in Figure 5. The plot of the figure on
a log scale shows that the average age-specific mortality rate increases slightly with age in the
high-income countries. In the low- and middle-income countries, on average, the mortality rate is
flatter between ages 60-69 and 70-79.
7
Figure 3: Unnormalized COVID-19 Mortality Rates (Deaths per 1000 Population) by Age Group and Country
Log scale
Note: See Appendix for data sources.
02
46
CO
VID
-19
mor
talit
y ra
te
30-39 40-49 50-59 60-69 70-79 80+
Age group
SwedenNetherlandsSpainItalyCanadaFranceBrazilChileSwitzerlandPeruPortugalDenmarkGermanyMexicoNorwayHungaryColombiaSouth AfricaAfghanistanArgentinaPhilippinesPakistanRepublic of KoreaAustraliaMalaysiaJapan
y g p y
.001
.01
.11
CO
VID
-19
mor
talit
y ra
te
30-39 40-49 50-59 60-69 70-79 80+
Age group
SwedenNetherlandsSpainItalyCanadaFranceBrazilChileSwitzerlandPeruPortugalDenmarkGermanyMexicoNorwayHungaryColombiaSouth AfricaAfghanistanArgentinaPhilippinesPakistanRepublic of KoreaAustraliaMalaysiaJapan
8
Figure 4: Normalized COVID-19 Mortality Rates by Age Group and Country
Log scale
Note: See Appendix for data sources. For each country normalized age-specific mortality rates across all ages sum to 1.
.1.2
.3.4
.5.6
.7.8
Nor
mal
ized
CO
VID
-19
mor
talit
y ra
te
30-39 40-49 50-59 60-69 70-79 80+
Age group
CanadaSwedenNorwaySwitzerlandDenmarkPortugalNetherlandsGermanyHungarySpainFranceAustraliaItalyRepublic of KoreaArgentinaAfghanistanJapanSouth AfricaChileBrazilColombiaMalaysiaPhilippinesPeruPakistanMexico
.001
.01
.11
Nor
mal
ized
CO
VID
-19
mor
talit
y ra
te
30-39 40-49 50-59 60-69 70-79 80+
Age group
CanadaSwedenNorwaySwitzerlandDenmarkPortugalNetherlandsGermanyHungarySpainFranceAustraliaItalyRepublic of KoreaArgentinaAfghanistanJapanSouth AfricaChileBrazilColombiaMalaysiaPhilippinesPeruPakistanMexico
9
Figure 5: Mean Normalized COVID-19 Mortality Rates by Age Group and Country, High-Income vs Low- and Middle-Income Countries
Log scale
Note: See Appendix for data sources. For each country group normalized age-specific mortality rates across all ages sum to 1. In available data, both Norway and Chile aggregate all deaths under age 40, and Denmark aggregates deaths under age 60. Consequently, the calculations of means for the above figures exclude Norway and Chile for the 30-39 age group and exclude Denmark for the 30-39, 40-49, and 50-59 age groups.
0.1
.2.3
.4.5
.6.7
.8N
orm
aliz
ed C
OVI
D-1
9 m
orta
lity
rate
30-39 40-49 50-59 60-69 70-79 80+
Age group
High income Low and middle income
y g p y
.01
.1N
orm
aliz
ed C
OVI
D-1
9 m
orta
lity
rate
30-39 40-49 50-59 60-69 70-79 80+
Age group
High income Low and middle income
10
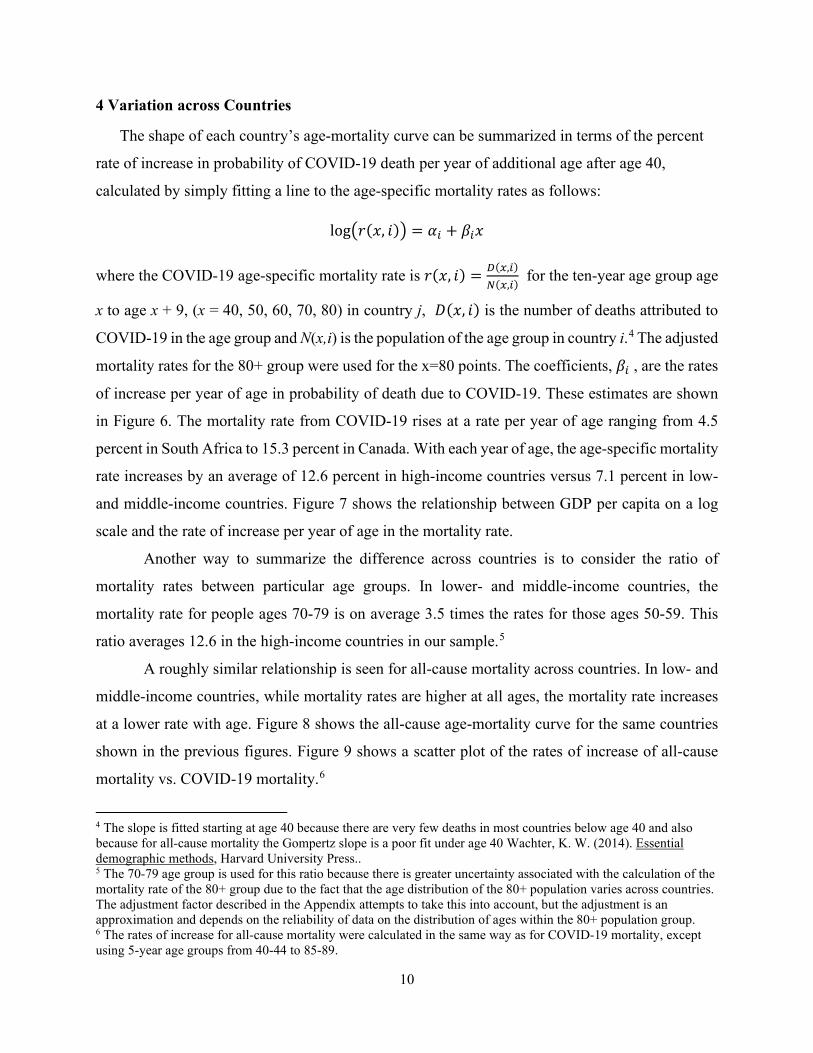
4 Variation across Countries
The shape of each country’s age-mortality curve can be summarized in terms of the percent
rate of increase in probability of COVID-19 death per year of additional age after age 40,
calculated by simply fitting a line to the age-specific mortality rates as follows:
log�𝑟𝑟(𝑥𝑥, 𝑖𝑖)� = 𝛼𝛼𝑖𝑖 + 𝛽𝛽𝑖𝑖𝑥𝑥
where the COVID-19 age-specific mortality rate is 𝑟𝑟(𝑥𝑥, 𝑖𝑖) = 𝐷𝐷(𝑥𝑥,𝑖𝑖)𝑁𝑁(𝑥𝑥,𝑖𝑖)
for the ten-year age group age
x to age x + 9, (x = 40, 50, 60, 70, 80) in country j, 𝐷𝐷(𝑥𝑥, 𝑖𝑖) is the number of deaths attributed to
COVID-19 in the age group and N(x,i) is the population of the age group in country i.4 The adjusted
mortality rates for the 80+ group were used for the x=80 points. The coefficients, 𝛽𝛽𝑖𝑖 , are the rates
of increase per year of age in probability of death due to COVID-19. These estimates are shown
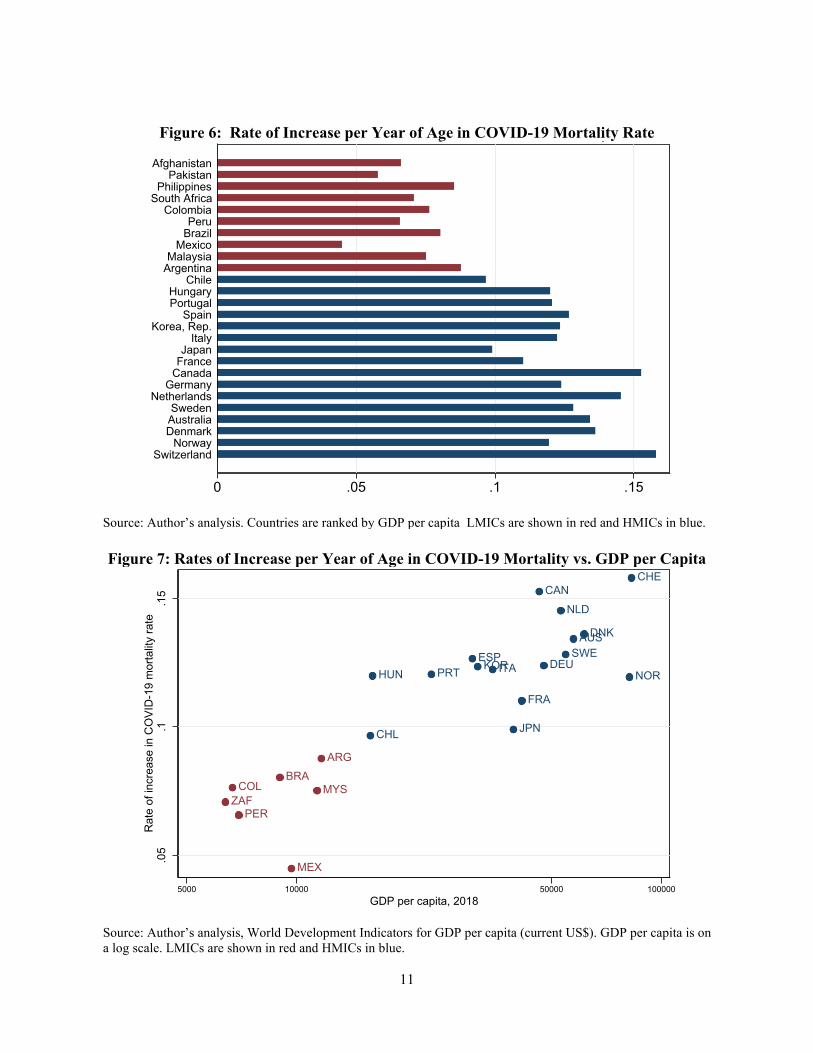
in Figure 6. The mortality rate from COVID-19 rises at a rate per year of age ranging from 4.5
percent in South Africa to 15.3 percent in Canada. With each year of age, the age-specific mortality
rate increases by an average of 12.6 percent in high-income countries versus 7.1 percent in low-
and middle-income countries. Figure 7 shows the relationship between GDP per capita on a log
scale and the rate of increase per year of age in the mortality rate.
Another way to summarize the difference across countries is to consider the ratio of
mortality rates between particular age groups. In lower- and middle-income countries, the
mortality rate for people ages 70-79 is on average 3.5 times the rates for those ages 50-59. This
ratio averages 12.6 in the high-income countries in our sample.5
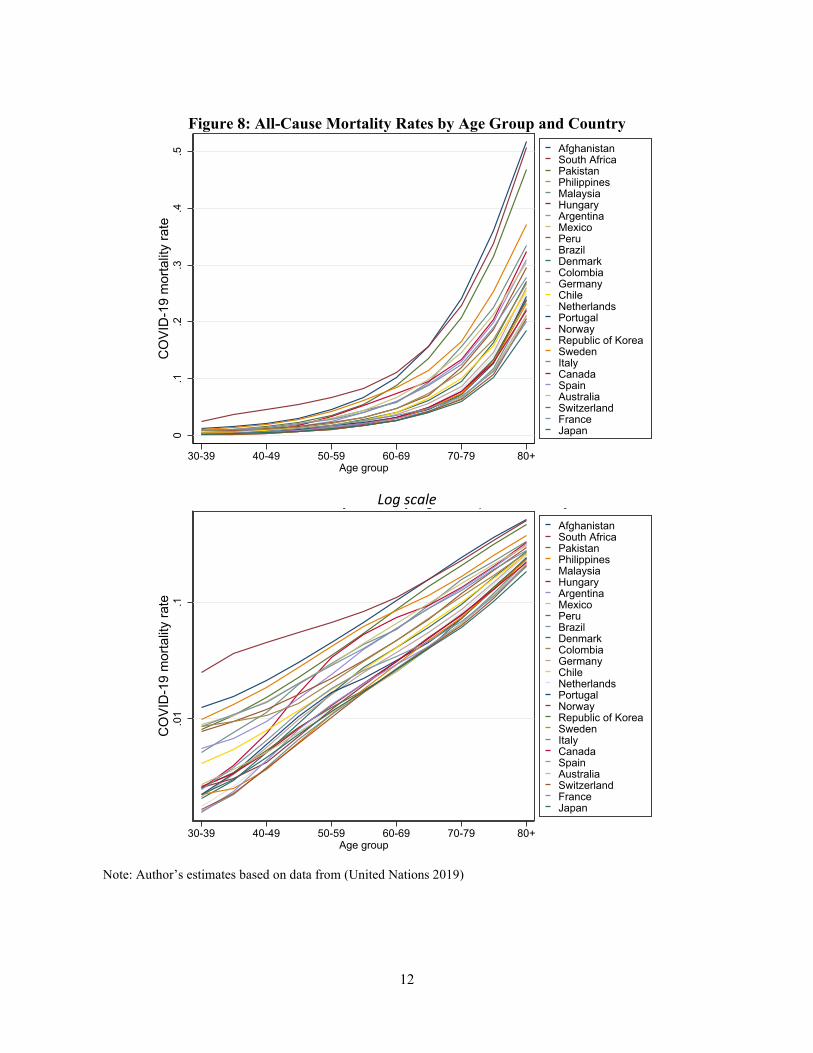
A roughly similar relationship is seen for all-cause mortality across countries. In low- and
middle-income countries, while mortality rates are higher at all ages, the mortality rate increases
at a lower rate with age. Figure 8 shows the all-cause age-mortality curve for the same countries
shown in the previous figures. Figure 9 shows a scatter plot of the rates of increase of all-cause
mortality vs. COVID-19 mortality.6
4 The slope is fitted starting at age 40 because there are very few deaths in most countries below age 40 and also because for all-cause mortality the Gompertz slope is a poor fit under age 40 Wachter, K. W. (2014). Essential demographic methods, Harvard University Press.. 5 The 70-79 age group is used for this ratio because there is greater uncertainty associated with the calculation of the mortality rate of the 80+ group due to the fact that the age distribution of the 80+ population varies across countries. The adjustment factor described in the Appendix attempts to take this into account, but the adjustment is an approximation and depends on the reliability of data on the distribution of ages within the 80+ population group. 6 The rates of increase for all-cause mortality were calculated in the same way as for COVID-19 mortality, except using 5-year age groups from 40-44 to 85-89.
11
Figure 6: Rate of Increase per Year of Age in COVID-19 Mortality Rate
Source: Author’s analysis. Countries are ranked by GDP per capita LMICs are shown in red and HMICs in blue.
Figure 7: Rates of Increase per Year of Age in COVID-19 Mortality vs. GDP per Capita
Source: Author’s analysis, World Development Indicators for GDP per capita (current US$). GDP per capita is on a log scale. LMICs are shown in red and HMICs in blue.
0 .05 .1 .15
SwitzerlandNorway
DenmarkAustraliaSweden
NetherlandsGermany
CanadaFranceJapan
ItalyKorea, Rep.
SpainPortugalHungary
ChileArgentinaMalaysia
MexicoBrazilPeru
ColombiaSouth AfricaPhilippines
PakistanAfghanistan
p g y
AUS
CAN
CHL
DNK
FRA
DEUHUN ITA
JPN
NLD
NORPRT KORESP SWE
CHE
ARGBRA
COL MYS
MEX
PERZAF
.05
.1.1
5R
ate
of in
crea
se in
CO
VID
-19
mor
talit
y ra
te
5000 10000 50000 100000GDP per capita, 2018
12
Figure 8: All-Cause Mortality Rates by Age Group and Country
Log scale
Note: Author’s estimates based on data from (United Nations 2019)
0.1
.2.3
.4.5
CO
VID
-19
mor
talit
y ra
te
30-39 40-49 50-59 60-69 70-79 80+Age group
AfghanistanSouth AfricaPakistanPhilippinesMalaysiaHungaryArgentinaMexicoPeruBrazilDenmarkColombiaGermanyChileNetherlandsPortugalNorwayRepublic of KoreaSwedenItalyCanadaSpainAustraliaSwitzerlandFranceJapan
.01
.1C
OVI
D-1
9 m
orta
lity
rate
30-39 40-49 50-59 60-69 70-79 80+Age group
AfghanistanSouth AfricaPakistanPhilippinesMalaysiaHungaryArgentinaMexicoPeruBrazilDenmarkColombiaGermanyChileNetherlandsPortugalNorwayRepublic of KoreaSwedenItalyCanadaSpainAustraliaSwitzerlandFranceJapan
y y g p y
13
Figure 9: Rates of Increase per Year of Age in COVID-19 Mortality vs. Rate of Increase per Year of Age in All-Cause Mortality by Country
Source: Author’s analysis. LMICs are shown in red and HMICs in blue.
The pattern of mortality risk by age across countries from COVID-19 resembles the pattern
for all-cause mortality, matching the observation that the patterns of mortality from COVID-19
resemble those for mortality generally. The disease kills principally those who were already at
highest risk of death: the aged and those with comorbidities. Likewise, in the United States
African-Americans are at higher risk of death from COVID-19 and have higher mortality risk
overall at all ages (Yancy 2020). Similarly, ethnic minorities in the United Kingdom are at
highest risk of dying of COVID-19 (Public Health England 2020).
5 Possible Explanations for Variation across Countries
Rules and practices for classifying deaths by particular causes vary by country, and the
same is true for classification of COVID-19 deaths. The extent to which deaths are attributed to
COVID-19 varies depending on the overall effectiveness of the country’s vital statistics system in
generating cause of death information, the country’s guidelines for attributing deaths to COVID-
19, and the extent to which accurate COVID-19 diagnosis through testing and other means is
available. In virtually all countries with a substantial number of COVID-19 deaths, it is likely that
AUS
CAN
CHL
DNK
FRA
DEUHUN ITA
JPN
NLD
NORPRT KORESP SWE
CHE
AFG
ARGBRA
COLMYS
MEX
PAK
PER
PHL
ZAF
.05
.1.1
5R
ate
of in
crea
se in
CO
VID
-19
mor
talit
y ra
te
.06 .07 .08 .09 .1Rate of increase in all-cause mortality rate
y y y
14
some deaths due to COVID-19 are not attributed to the disease. The magnitude of under-attribution
may also vary by age. Differences across countries in the relative levels of under-attribution by
age group could contribute to generating differences in the observed COVID-19 age-mortality
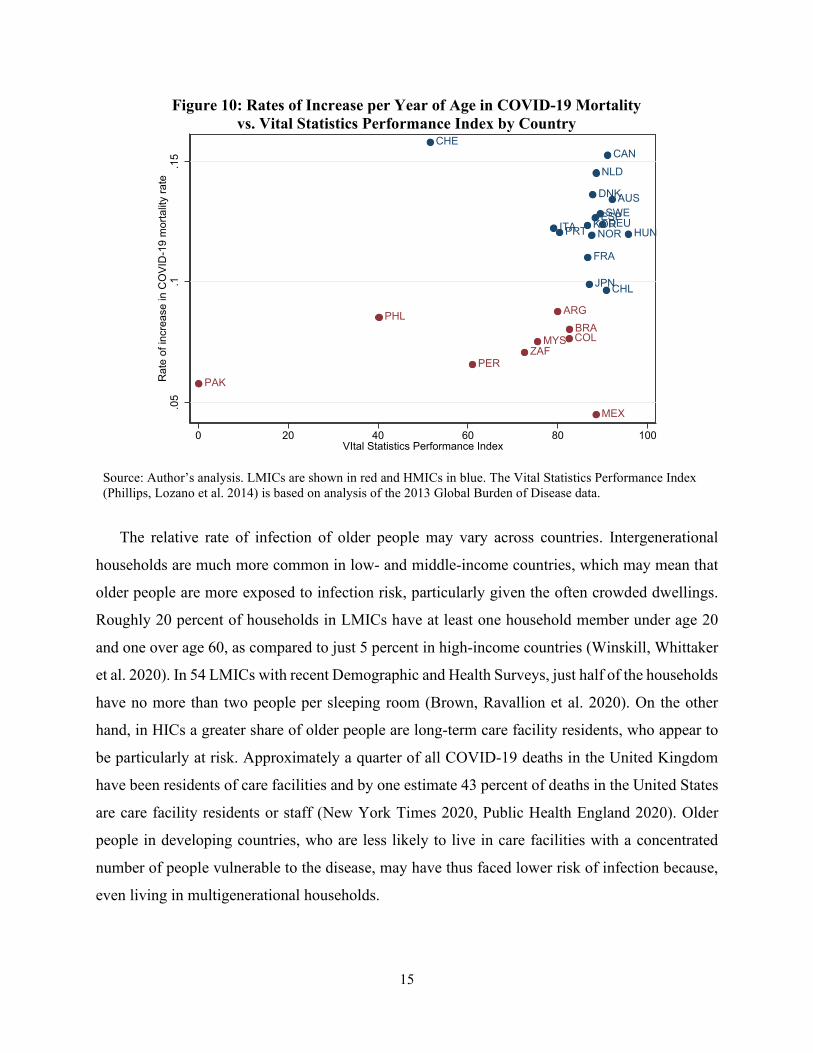
curves. Figure 10 shows the rate of increase of the COVID-19 mortality rate plotted against a
measure of the overall quality of death reporting data.7 A few of the middle-income countries with
flatter age-mortality curves—Pakistan, the Philippines, and Peru—rate low by this index, but other
middle-income countries have death reporting systems considered equal in quality to those of high-
income countries. Thus, the variation across countries in the slope of the age-mortality curves
cannot be fully explained by the overall quality of cause of death data. However, differences in
COVID-19 death attribution among older people could be responsible for part or even all of the
observed difference between advanced and developing countries. It is likely that deaths due to
COVID-19 are more likely to be correctly attributed to the disease when the death occurs in a
hospital. In wealthy countries, a large share of deaths occurs in hospitals and other institutions. In
developing countries, where a larger fraction die outside of hospitals, if deaths of older people are
seen as more expected (given higher mortality rates for older people generally), their deaths may
be especially likely to be under-attributed to COVID.
If the flatter COVID-19 age-mortality curves in developing countries do reflect in part the
underlying reality and not only differences in data collection and attribution, the possible
explanations fall into two broad categories. The varying patterns by age across countries may
reflect 1) differences in infection rates and/or 2) mortality rates among those infected.
7 The Vital Statistics Performance Index is a country-level composite index of measures of cause of death data: quality of cause of death reporting, quality of age and sex reporting, internal consistency, completeness of death reporting, level of cause-specific detail, and data availability/timeliness.
15
Figure 10: Rates of Increase per Year of Age in COVID-19 Mortality vs. Vital Statistics Performance Index by Country
Source: Author’s analysis. LMICs are shown in red and HMICs in blue. The Vital Statistics Performance Index (Phillips, Lozano et al. 2014) is based on analysis of the 2013 Global Burden of Disease data.
The relative rate of infection of older people may vary across countries. Intergenerational
households are much more common in low- and middle-income countries, which may mean that
older people are more exposed to infection risk, particularly given the often crowded dwellings.
Roughly 20 percent of households in LMICs have at least one household member under age 20
and one over age 60, as compared to just 5 percent in high-income countries (Winskill, Whittaker
et al. 2020). In 54 LMICs with recent Demographic and Health Surveys, just half of the households
have no more than two people per sleeping room (Brown, Ravallion et al. 2020). On the other
hand, in HICs a greater share of older people are long-term care facility residents, who appear to
be particularly at risk. Approximately a quarter of all COVID-19 deaths in the United Kingdom
have been residents of care facilities and by one estimate 43 percent of deaths in the United States
are care facility residents or staff (New York Times 2020, Public Health England 2020). Older
people in developing countries, who are less likely to live in care facilities with a concentrated
number of people vulnerable to the disease, may have thus faced lower risk of infection because,
even living in multigenerational households.
AUS
CAN
CHL
DNK
FRA
DEUHUNITA
JPN
KOR
NLD
NORPRTESPSWE
CHE
ARGBRACOLMYS
MEX
PAK
PER
PHL
ZAF
.05
.1.1
5R
ate
of in
crea
se in
CO
VID
-19
mor
talit
y ra
te
0 20 40 60 80 100VItal Statistics Performance Index
16
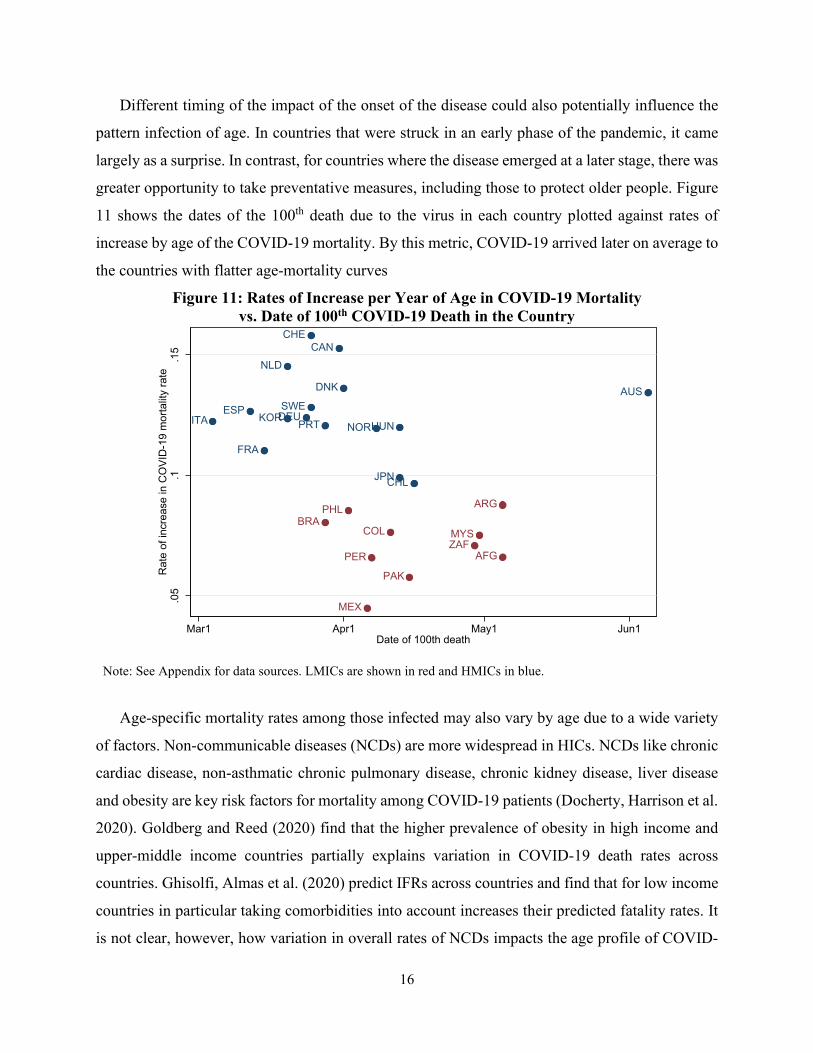
Different timing of the impact of the onset of the disease could also potentially influence the
pattern infection of age. In countries that were struck in an early phase of the pandemic, it came
largely as a surprise. In contrast, for countries where the disease emerged at a later stage, there was
greater opportunity to take preventative measures, including those to protect older people. Figure
11 shows the dates of the 100th death due to the virus in each country plotted against rates of
increase by age of the COVID-19 mortality. By this metric, COVID-19 arrived later on average to
the countries with flatter age-mortality curves
Figure 11: Rates of Increase per Year of Age in COVID-19 Mortality vs. Date of 100th COVID-19 Death in the Country
Note: See Appendix for data sources. LMICs are shown in red and HMICs in blue.
Age-specific mortality rates among those infected may also vary by age due to a wide variety
of factors. Non-communicable diseases (NCDs) are more widespread in HICs. NCDs like chronic
cardiac disease, non-asthmatic chronic pulmonary disease, chronic kidney disease, liver disease
and obesity are key risk factors for mortality among COVID-19 patients (Docherty, Harrison et al.
2020). Goldberg and Reed (2020) find that the higher prevalence of obesity in high income and
upper-middle income countries partially explains variation in COVID-19 death rates across
countries. Ghisolfi, Almas et al. (2020) predict IFRs across countries and find that for low income
countries in particular taking comorbidities into account increases their predicted fatality rates. It
is not clear, however, how variation in overall rates of NCDs impacts the age profile of COVID-
AUS
CAN
CHL
DNK
FRA
DEUHUNITA
JPN
NLD
NORPRTKORESP SWE
CHE
AFG
ARGBRA
COL MYS
MEX
PAK
PER
PHL
ZAF
.05
.1.1
5R
ate
of in
crea
se in
CO
VID
-19
mor
talit
y ra
te
Mar1 Apr1 May1 Jun1Date of 100th death
g
17
19 mortality. In a comment on Dowd, Andriano et al. (2020), Nepomuceno, Acosta et al. (2020)
compare the age profiles across Italy, Brazil, and Nigeria of major COVID-19 risk factors. They
note higher rates of chronic kidney disease and chronic obstructive pulmonary disease across the
age distribution in Brazil and Nigeria and also point out that in those countries, as compared to
Italy, cardiovascular disease is much more prevalent in younger ages but less common at older
ages. They conclude that it is possible that “younger individuals in low- and middle-income
countries may be at a substantially higher risk of severe COVID-19 illness than individuals of the
same age in high-income settings once age-related health conditions are considered.” The authors
of the original article responded, agreeing that “less-healthy countries may see a shift toward a
younger age distribution of COVID-19 deaths relative to wealthier and healthier countries,
consistent with high rates of comorbidities such as diabetes and hypertension in Latin American
countries” (Dowd, Andriano et al. 2020).
A related point is that a form of survivor bias may come into play. High quality in medical care
in wealthier nations keeps many older people alive despite weak health conditions that make them
vulnerable to COVID-19. Older people in developing countries could be on average healthier than
those in wealthier countries because those with non-COVID-19 conditions would have been at
high risk for death at a younger age. If this is the case, older people in developing countries might
be more resilient to the disease.
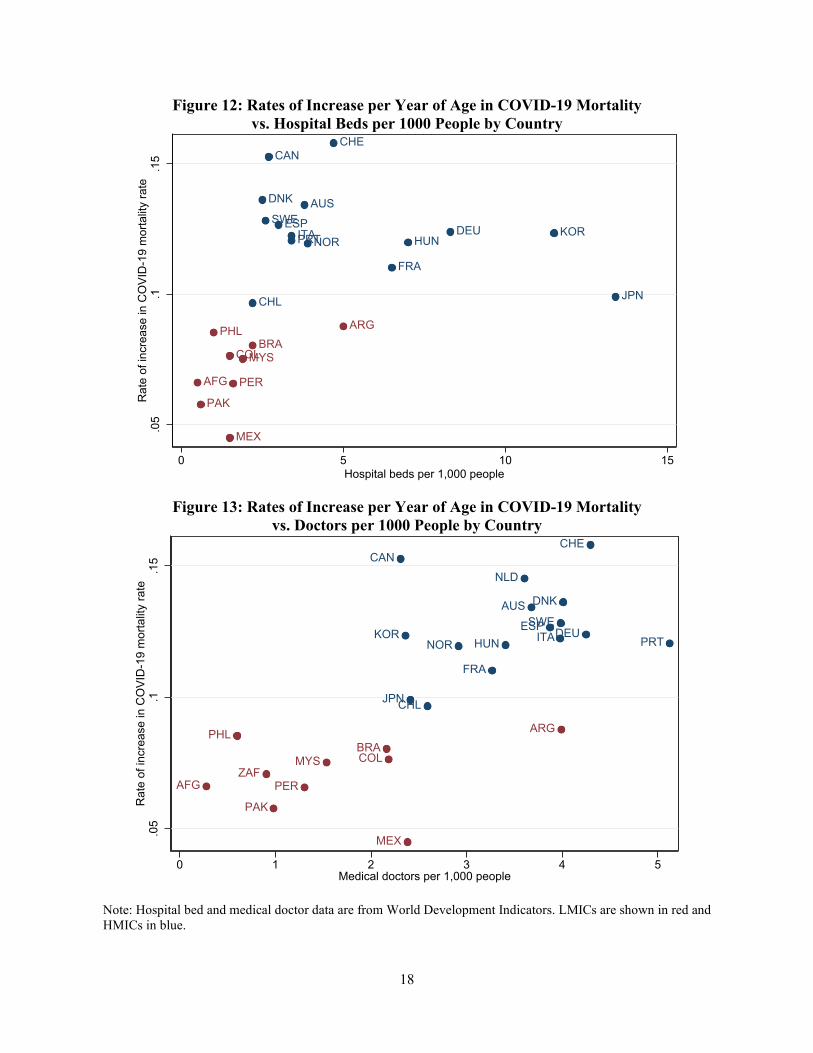
Differences in health system capacity and quality are another potential driver of differences in
age-specific mortality rates among those infected. More limited access to health care would be
expected to increase mortality rates for severe COVID-19 patients, regardless of age. Rough
measures of health system capacity and quality—the number of hospital beds and doctors per 1,000
population—are correlated with GDP per capita and thus with the steepness of the COVID-19 age-
mortality curves, as shown in Figures 12 and 13.
18
Figure 12: Rates of Increase per Year of Age in COVID-19 Mortality vs. Hospital Beds per 1000 People by Country
Figure 13: Rates of Increase per Year of Age in COVID-19 Mortality
vs. Doctors per 1000 People by Country
Note: Hospital bed and medical doctor data are from World Development Indicators. LMICs are shown in red and HMICs in blue.
AUS
CAN
CHL
DNK
FRA
DEUHUNITA
JPN
KORNORPRT
ESPSWE
CHE
AFG
ARGBRA
COLMYS
MEX
PAK
PER
PHL
.05
.1.1
5R
ate
of in
crea
se in
CO
VID
-19
mor
talit
y ra
te
0 5 10 15Hospital beds per 1,000 people
AUS
CAN
CHL
DNK
FRA
DEUHUN ITA
JPN
KOR
NLD
NOR PRTESPSWE
CHE
AFG
ARGBRACOLMYS
MEX
PAK
PER
PHL
ZAF
.05
.1.1
5R
ate
of in
crea
se in
CO
VID
-19
mor
talit
y ra
te
0 1 2 3 4 5Medical doctors per 1,000 people
19
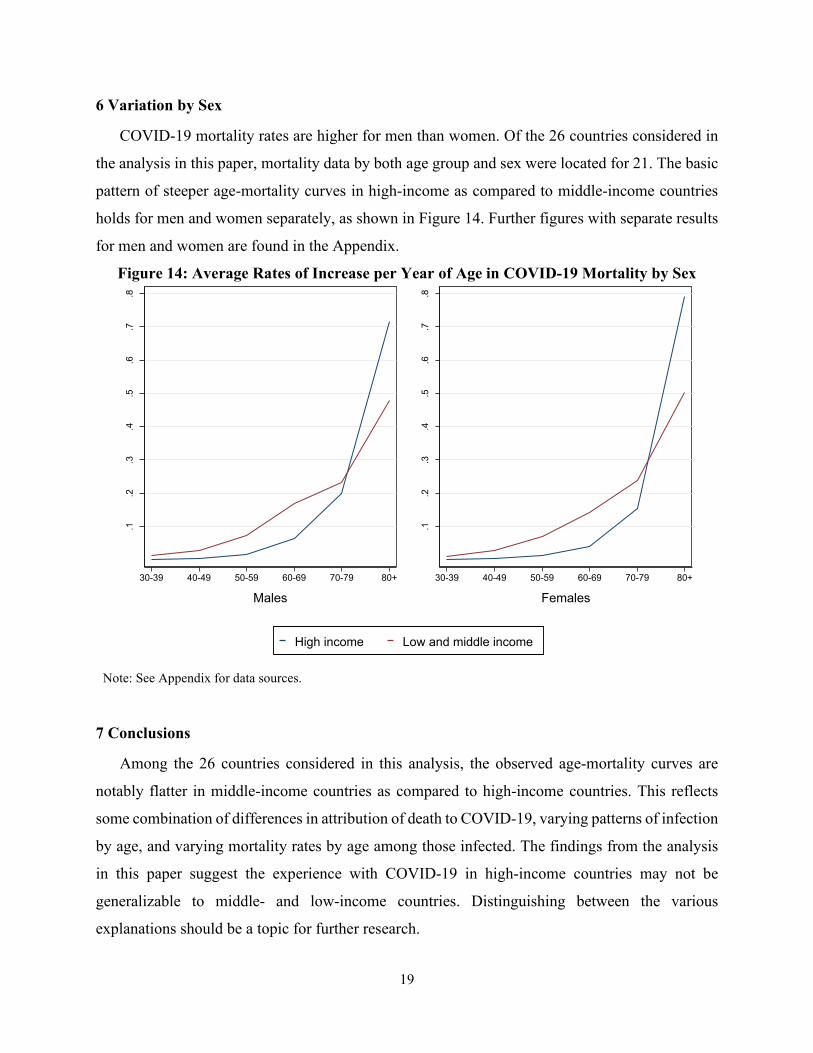
6 Variation by Sex
COVID-19 mortality rates are higher for men than women. Of the 26 countries considered in
the analysis in this paper, mortality data by both age group and sex were located for 21. The basic
pattern of steeper age-mortality curves in high-income as compared to middle-income countries
holds for men and women separately, as shown in Figure 14. Further figures with separate results
for men and women are found in the Appendix.
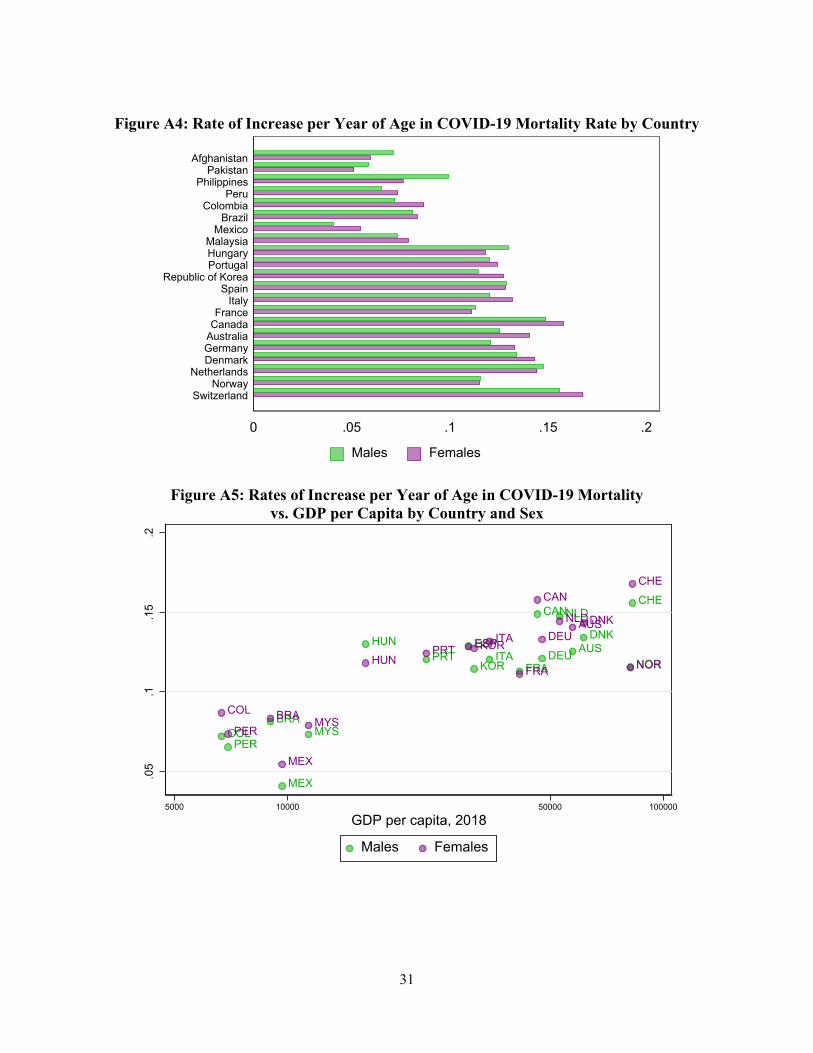
Figure 14: Average Rates of Increase per Year of Age in COVID-19 Mortality by Sex
Note: See Appendix for data sources.
7 Conclusions
Among the 26 countries considered in this analysis, the observed age-mortality curves are
notably flatter in middle-income countries as compared to high-income countries. This reflects
some combination of differences in attribution of death to COVID-19, varying patterns of infection
by age, and varying mortality rates by age among those infected. The findings from the analysis
in this paper suggest the experience with COVID-19 in high-income countries may not be
generalizable to middle- and low-income countries. Distinguishing between the various
explanations should be a topic for further research.
.1.2
.3.4
.5.6
.7.8
30-39 40-49 50-59 60-69 70-79 80+
Males
.1.2
.3.4
.5.6
.7.8
30-39 40-49 50-59 60-69 70-79 80+
Females
High income Low and middle income
20
One approach to considering these issues is by analyzing death on all-cause mortality during
the COVID-19 period and making comparisons to previous years. Such an analysis of “excess
mortality” by age group could contribute to an understanding of the extent to which the flatter age-
mortality profile in middle-income countries is a real phenomenon rather than one generated by
differences across countries in attribution. There are challenges in using excess mortality data,
however. For developing countries, such data are typically available only with a long time lag, if
at all, and currently such data are not available with an age breakdown for the COVID-19 period
for any of the countries considered here. Excess mortality data are also challenging to interpret
because the pandemic has both direct and indirect effects.
The analysis in this paper is also a reminder of the value of demographic data as a tool amidst
the COVID-19 crisis. Governments have been widely varying in the extent to which they have
been transparent with COVID-19 data. Some countries release only very limited data, while others
make regularly updated microdata of cases and deaths available to the public. Countries that have
been the most forthcoming with data have benefitted because wide scrutiny of the data has allowed
deficiencies to be identified and corrected, and analysis by the broad research community has
helped inform government responses. Greater data transparency should be encouraged as a public
good to help the global community understand and better address the pandemic.
21
References
Brown, C. S., M. Ravallion and D. van de Walle (2020). Can the World’s Poor Protect Themselves from the New Coronavirus? National Bureau of Economic Research Working Paper Series. Cambridge, MA, National Bureau of Economic Research.
Clark, A., M. Jit, C. Warren-Gash, B. Guthrie, H. H. X. Wang, S. W. Mercer, C. Sanderson, M. McKee, C. Troeger, K. L. Ong, F. Checchi, P. Perel, S. Joseph, H. P. Gibbs, A. Banerjee, R. M. Eggo, E. S. Nightingale, K. O'Reilly, T. Jombart, W. J. Edmunds, A. Rosello, F. Y. Sun, K. E. Atkins, N. I. Bosse, S. Clifford, T. W. Russell, A. K. Deol, Y. Liu, S. R. Procter, Q. J. Leclerc, G. Medley, G. Knight, J. D. Munday, A. J. Kucharski, C. A. B. Pearson, P. Klepac, K. Prem, R. M. G. J. Houben, A. Endo, S. Flasche, N. G. Davies, C. Diamond, K. van Zandvoort, S. Funk, M. Auzenbergs, E. M. Rees, D. C. Tully, J. C. Emery, B. J. Quilty, S. Abbott, C. J. Villabona-Arenas, S. Hué, J. Hellewell, A. Gimma and C. I. Jarvis (2020). "Global, regional, and national estimates of the population at increased risk of severe COVID-19 due to underlying health conditions in 2020: a modelling study." The Lancet Global Health.
Docherty, A. B., E. M. Harrison, C. A. Green, H. E. Hardwick, R. Pius, L. Norman, K. A. Holden, J. M. Read, F. Dondelinger, G. Carson, L. Merson, J. Lee, D. Plotkin, L. Sigfrid, S. Halpin, C. Jackson, C. Gamble, P. W. Horby, J. S. Nguyen-Van-Tam, A. Ho, C. D. Russell, J. Dunning, P. J. Openshaw, J. K. Baillie and M. G. Semple (2020). "Features of 20 133 UK patients in hospital with covid-19 using the ISARIC WHO Clinical Characterisation Protocol: prospective observational cohort study." BMJ 369: m1985.
Dowd, J. B., L. Andriano, D. M. Brazel, V. Rotondi, P. Block, X. Ding, Y. Liu and M. C. Mills (2020). "Demographic science aids in understanding the spread and fatality rates of COVID-19." Proceedings of the National Academy of Sciences 117(18): 9696-9698.
Dowd, J. B., L. Andriano, D. M. Brazel, V. Rotondi, P. Block, X. Ding and M. C. Mills (2020). "Reply to Nepomuceno et al.: A renewed call for detailed social and demographic COVID-19 data from all countries." Proceedings of the National Academy of Sciences 117(25): 13884-13885.
Ghisolfi, S., I. I. Almas, J. Sandefur, T. von Carnap, J. Heitner and T. Bold (2020). Predicted COVID-19 fatality rates based on age, sex, comorbidities, and health system capacity. Center for Global Development.
Goldberg, P. K. and T. Reed (2020). "The effects of the coronavirus pandemic in emerging markets and developing economies: An optimistic preliminary account." Brookings Papers on Economic Activity
Goldstein, J. R. and R. D. Lee (2020). Demographic Perspectives on Mortality of Covid-19 and Other Epidemics. National Bureau of Economic Research Working Paper Series, National Bureau of Economic Research.
Jordan, R. E., P. Adab and K. Cheng (2020). "Covid-19: risk factors for severe disease and death." BMJ 368: m1198.
Li, X., S. Xu, M. Yu, K. Wang, Y. Tao, Y. Zhou, J. Shi, M. Zhou, B. Wu and Z. Yang (2020). "Risk factors for severity and mortality in adult COVID-19 inpatients in Wuhan." Journal of Allergy and Clinical Immunology.
22
Nepomuceno, M. R., E. Acosta, D. Alburez-Gutierrez, J. M. Aburto, A. Gagnon and C. M. Turra (2020). "Besides population age structure, health and other demographic factors can contribute to understanding the COVID-19 burden." Proceedings of the National Academy of Sciences 117(25): 13881-13883.
New York Times (2020). "43% of U.S. Coronavirus Deaths Are Linked to Nursing Homes". New York Times.
Phillips, D. E., R. Lozano, M. Naghavi, C. Atkinson, D. Gonzalez-Medina, L. Mikkelsen, C. J. L. Murray and A. D. Lopez (2014). "A composite metric for assessing data on mortality and causes of death: the vital statistics performance index." Population Health Metrics 12(1): 14.
Public Health England (2020). Disparities in the risk and outcomes of COVID-19.
Schellekens, P. and D. M. Sourrouille (2020). "COVID-19 Mortality in Rich and Poor Countries: A Tale of Two Pandemics?" World Bank Policy Research Working Paper(9260).
United Nations (2019). World Population Prospects 2019.
Wachter, K. W. (2014). Essential demographic methods, Harvard University Press.
Winskill, P., C. Whittaker, P. Walker, O. Watson, D. Laydon, N. Imai, G. Cuomo-Dannenburg, K. Ainslie, M. Baguelin, S. Bhatt, A. Boonyasiri, L. Cattarino, C. Ciavarella, L. Cooper, H. Coupland, Z. M. Cucunubá, S. van Elsland, R. Fitzjohn, S. Flaxman and A. Ghani (2020). Report 22: Equity in response to the COVID-19 pandemic: an assessment of the direct and indirect impacts on disadvantaged and vulnerable populations in low-and lower middle-income countries WHO Collaborating Centre for Infectious Disease Modelling MRC Centre for Global Infectious Disease Analysis.
World Bank (2020, June). Global Economic Prospects. Washington, D.C.
Yancy, C. W. (2020). "COVID-19 and African Americans." JAMA 323(19): 1891-1892.
Zheng, Z., F. Peng, B. Xu, J. Zhao, H. Liu, J. Peng, Q. Li, C. Jiang, Y. Zhou and S. Liu (2020). "Risk factors of critical & mortal COVID-19 cases: A systematic literature review and meta-analysis." Journal of Infection.
Zhou, F., T. Yu, R. Du, G. Fan, Y. Liu, Z. Liu, J. Xiang, Y. Wang, B. Song and X. Gu (2020). "Clinical course and risk factors for mortality of adult inpatients with COVID-19 in Wuhan, China: a retrospective cohort study." The Lancet.
23
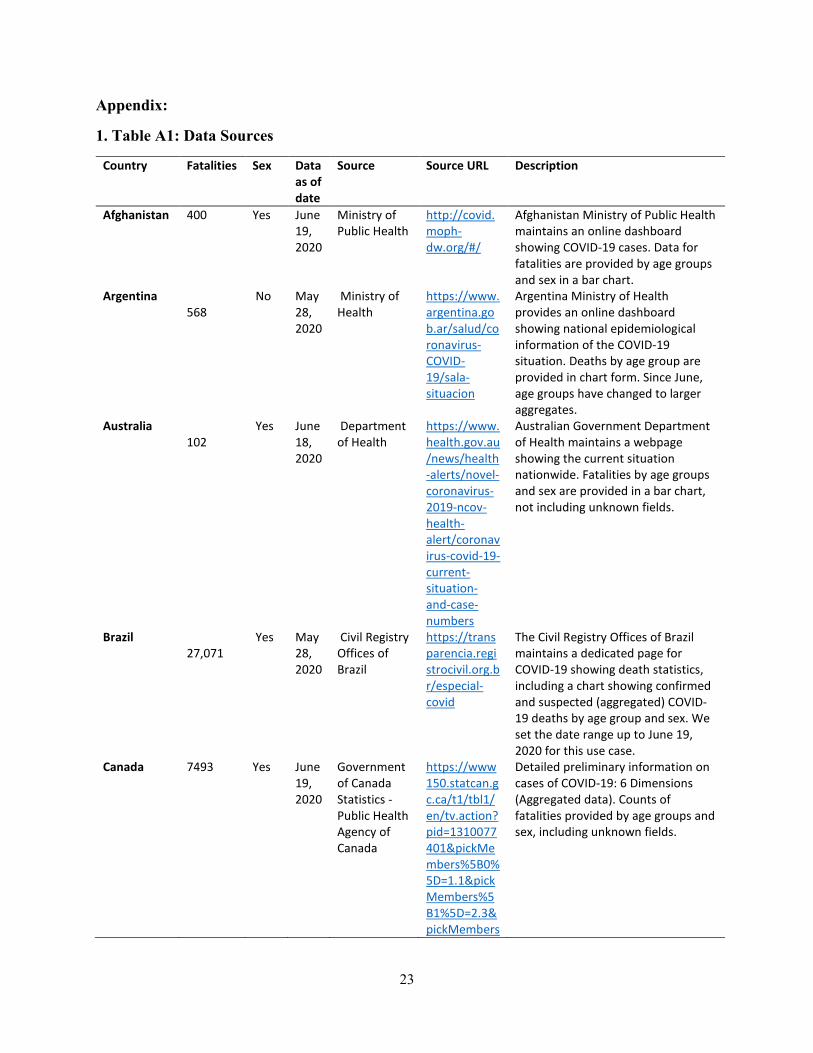
Appendix:
1. Table A1: Data Sources
Country Fatalities Sex Data as of date
Source Source URL Description
Afghanistan 400 Yes June 19, 2020
Ministry of Public Health
http://covid.moph-dw.org/#/
Afghanistan Ministry of Public Health maintains an online dashboard showing COVID-19 cases. Data for fatalities are provided by age groups and sex in a bar chart.
Argentina 568
No May 28, 2020
Ministry of Health
https://www.argentina.gob.ar/salud/coronavirus-COVID-19/sala-situacion
Argentina Ministry of Health provides an online dashboard showing national epidemiological information of the COVID-19 situation. Deaths by age group are provided in chart form. Since June, age groups have changed to larger aggregates.
Australia 102
Yes June 18, 2020
Department of Health
https://www.health.gov.au/news/health-alerts/novel-coronavirus-2019-ncov-health-alert/coronavirus-covid-19-current-situation-and-case-numbers
Australian Government Department of Health maintains a webpage showing the current situation nationwide. Fatalities by age groups and sex are provided in a bar chart, not including unknown fields.
Brazil 27,071
Yes May 28, 2020
Civil Registry Offices of Brazil
https://transparencia.registrocivil.org.br/especial-covid
The Civil Registry Offices of Brazil maintains a dedicated page for COVID-19 showing death statistics, including a chart showing confirmed and suspected (aggregated) COVID-19 deaths by age group and sex. We set the date range up to June 19, 2020 for this use case.
Canada 7493 Yes June 19, 2020
Government of Canada Statistics - Public Health Agency of Canada
https://www150.statcan.gc.ca/t1/tbl1/en/tv.action?pid=1310077401&pickMembers%5B0%5D=1.1&pickMembers%5B1%5D=2.3&pickMembers
Detailed preliminary information on cases of COVID-19: 6 Dimensions (Aggregated data). Counts of fatalities provided by age groups and sex, including unknown fields.
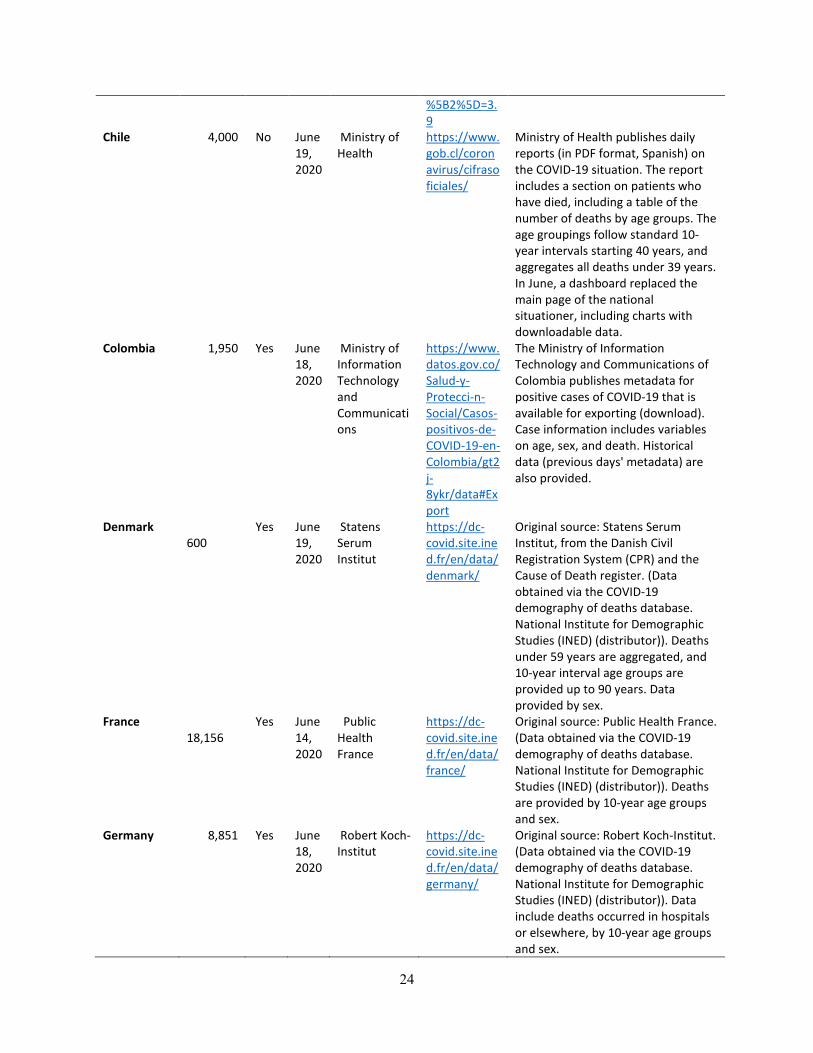
24
%5B2%5D=3.9
Chile 4,000 No June 19, 2020
Ministry of Health
https://www.gob.cl/coronavirus/cifrasoficiales/
Ministry of Health publishes daily reports (in PDF format, Spanish) on the COVID-19 situation. The report includes a section on patients who have died, including a table of the number of deaths by age groups. The age groupings follow standard 10-year intervals starting 40 years, and aggregates all deaths under 39 years. In June, a dashboard replaced the main page of the national situationer, including charts with downloadable data.
Colombia 1,950 Yes June 18, 2020
Ministry of Information Technology and Communications
https://www.datos.gov.co/Salud-y-Protecci-n-Social/Casos-positivos-de-COVID-19-en-Colombia/gt2j-8ykr/data#Export
The Ministry of Information Technology and Communications of Colombia publishes metadata for positive cases of COVID-19 that is available for exporting (download). Case information includes variables on age, sex, and death. Historical data (previous days' metadata) are also provided.
Denmark 600
Yes June 19, 2020
Statens Serum Institut
https://dc-covid.site.ined.fr/en/data/denmark/
Original source: Statens Serum Institut, from the Danish Civil Registration System (CPR) and the Cause of Death register. (Data obtained via the COVID-19 demography of deaths database. National Institute for Demographic Studies (INED) (distributor)). Deaths under 59 years are aggregated, and 10-year interval age groups are provided up to 90 years. Data provided by sex.
France 18,156
Yes June 14, 2020
Public Health France
https://dc-covid.site.ined.fr/en/data/france/
Original source: Public Health France. (Data obtained via the COVID-19 demography of deaths database. National Institute for Demographic Studies (INED) (distributor)). Deaths are provided by 10-year age groups and sex.
Germany 8,851 Yes June 18, 2020
Robert Koch-Institut
https://dc-covid.site.ined.fr/en/data/germany/
Original source: Robert Koch-Institut. (Data obtained via the COVID-19 demography of deaths database. National Institute for Demographic Studies (INED) (distributor)). Data include deaths occurred in hospitals or elsewhere, by 10-year age groups and sex.
25
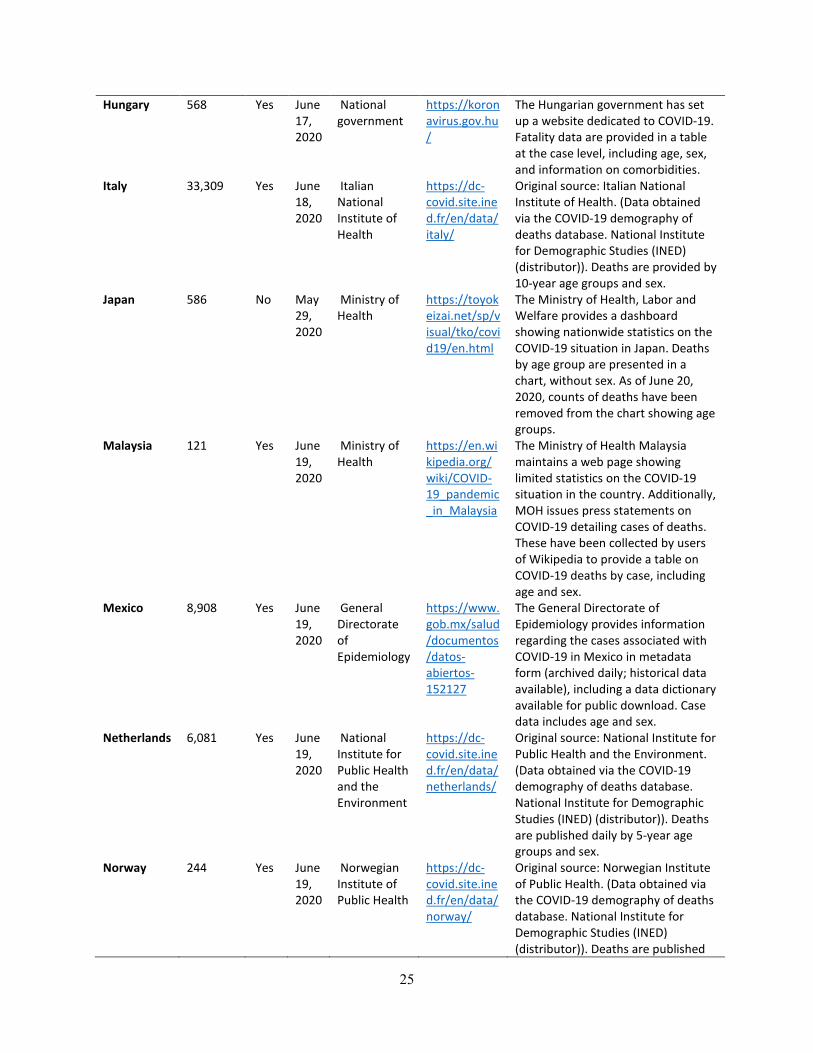
Hungary 568 Yes June 17, 2020
National government
https://koronavirus.gov.hu/
The Hungarian government has set up a website dedicated to COVID-19. Fatality data are provided in a table at the case level, including age, sex, and information on comorbidities.
Italy 33,309 Yes June 18, 2020
Italian National Institute of Health
https://dc-covid.site.ined.fr/en/data/italy/
Original source: Italian National Institute of Health. (Data obtained via the COVID-19 demography of deaths database. National Institute for Demographic Studies (INED) (distributor)). Deaths are provided by 10-year age groups and sex.
Japan 586 No May 29, 2020
Ministry of Health
https://toyokeizai.net/sp/visual/tko/covid19/en.html
The Ministry of Health, Labor and Welfare provides a dashboard showing nationwide statistics on the COVID-19 situation in Japan. Deaths by age group are presented in a chart, without sex. As of June 20, 2020, counts of deaths have been removed from the chart showing age groups.
Malaysia 121 Yes June 19, 2020
Ministry of Health
https://en.wikipedia.org/wiki/COVID-19_pandemic_in_Malaysia
The Ministry of Health Malaysia maintains a web page showing limited statistics on the COVID-19 situation in the country. Additionally, MOH issues press statements on COVID-19 detailing cases of deaths. These have been collected by users of Wikipedia to provide a table on COVID-19 deaths by case, including age and sex.
Mexico 8,908 Yes June 19, 2020
General Directorate of Epidemiology
https://www.gob.mx/salud/documentos/datos-abiertos-152127
The General Directorate of Epidemiology provides information regarding the cases associated with COVID-19 in Mexico in metadata form (archived daily; historical data available), including a data dictionary available for public download. Case data includes age and sex.
Netherlands 6,081 Yes June 19, 2020
National Institute for Public Health and the Environment
https://dc-covid.site.ined.fr/en/data/netherlands/
Original source: National Institute for Public Health and the Environment. (Data obtained via the COVID-19 demography of deaths database. National Institute for Demographic Studies (INED) (distributor)). Deaths are published daily by 5-year age groups and sex.
Norway 244 Yes June 19, 2020
Norwegian Institute of Public Health
https://dc-covid.site.ined.fr/en/data/norway/
Original source: Norwegian Institute of Public Health. (Data obtained via the COVID-19 demography of deaths database. National Institute for Demographic Studies (INED) (distributor)). Deaths are published
26
daily by 10-year age groups and sex, however, deaths under age 40 are aggregated.
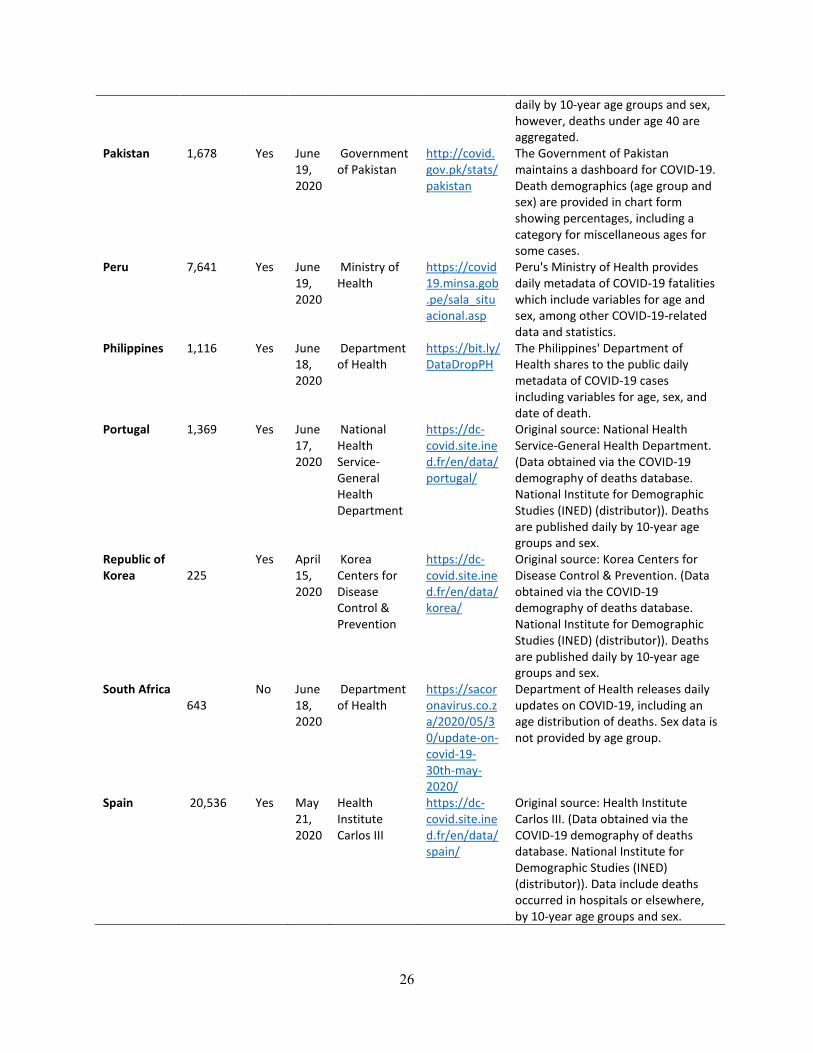
Pakistan 1,678 Yes June 19, 2020
Government of Pakistan
http://covid.gov.pk/stats/pakistan
The Government of Pakistan maintains a dashboard for COVID-19. Death demographics (age group and sex) are provided in chart form showing percentages, including a category for miscellaneous ages for some cases.
Peru 7,641 Yes June 19, 2020
Ministry of Health
https://covid19.minsa.gob.pe/sala_situacional.asp
Peru's Ministry of Health provides daily metadata of COVID-19 fatalities which include variables for age and sex, among other COVID-19-related data and statistics.
Philippines 1,116 Yes June 18, 2020
Department of Health
https://bit.ly/DataDropPH
The Philippines' Department of Health shares to the public daily metadata of COVID-19 cases including variables for age, sex, and date of death.
Portugal 1,369 Yes June 17, 2020
National Health Service-General Health Department
https://dc-covid.site.ined.fr/en/data/portugal/
Original source: National Health Service-General Health Department. (Data obtained via the COVID-19 demography of deaths database. National Institute for Demographic Studies (INED) (distributor)). Deaths are published daily by 10-year age groups and sex.
Republic of Korea
225
Yes April 15, 2020
Korea Centers for Disease Control & Prevention
https://dc-covid.site.ined.fr/en/data/korea/
Original source: Korea Centers for Disease Control & Prevention. (Data obtained via the COVID-19 demography of deaths database. National Institute for Demographic Studies (INED) (distributor)). Deaths are published daily by 10-year age groups and sex.
South Africa 643
No June 18, 2020
Department of Health
https://sacoronavirus.co.za/2020/05/30/update-on-covid-19-30th-may-2020/
Department of Health releases daily updates on COVID-19, including an age distribution of deaths. Sex data is not provided by age group.
Spain 20,536 Yes May 21, 2020
Health Institute Carlos III
https://dc-covid.site.ined.fr/en/data/spain/
Original source: Health Institute Carlos III. (Data obtained via the COVID-19 demography of deaths database. National Institute for Demographic Studies (INED) (distributor)). Data include deaths occurred in hospitals or elsewhere, by 10-year age groups and sex.
27
Sweden 5,053 No June 18, 2020
National Board of Health and Welfare (NBHW)
https://dc-covid.site.ined.fr/en/data/sweden/
Original source: National Board of Health and Welfare. (Data obtained via the COVID-19 demography of deaths database. National Institute for Demographic Studies (INED) (distributor)). Data include deaths by 10-year age groups.
Switzerland 1678 Yes June 18, 2020
Federal Office of Public Health
https://www.bag.admin.ch/bag/en/home/krankheiten/ausbrueche-epidemien-pandemien/aktuelle-ausbrueche-epidemien/novel-cov/situation-schweiz-und-international.html#-1199962081
FOPH website on the COVID-19 situation in Switzerland, providing data on epidemiological situation. Count of deaths by age groups and sex is provided.
2. Adjustment for 80+ Mortality
An adjustment is used for the COVID-19 mortality rate of the 80+ age group to account for the fact that the age structure of the 80+ population varies across countries. Low- and middle-income countries typically have younger populations overall, and the population of those age 80 and older is on average younger than in high-income countries. The adjustment is done with reference to a standard mortality schedule sM(x). United States all-cause mortality is used as the standard.
The indirect standardized 80+ mortality rate for each country j: sM(80+, j) = ∑� 𝑠𝑠𝑠𝑠(𝑥𝑥)∗ 𝑁𝑁(𝑥𝑥,𝑗𝑗)�
∑𝑁𝑁(𝑥𝑥,𝑗𝑗)
where N(x,j) is the count of people in the age group x to x=4 in country j (x = 80, 85, 90, 95). The adjustment factor for country j is as follows: 𝜃𝜃(𝑗𝑗) = 𝑠𝑠𝑠𝑠(80+,USA)
𝑠𝑠𝑠𝑠(80+,𝑗𝑗) where sM(80+, USA) is the all-cause mortality rate for the 80+ age group in the standard.
28
This factor can be used to scale the observed COVID-19 mortality of the 80+ age group to adjust for age-structure effects: 𝑎𝑎𝑎𝑎𝑗𝑗𝑎𝑎(80+, 𝑗𝑗)𝐶𝐶19 = 𝜃𝜃(𝑗𝑗) ∗ 𝑜𝑜𝑜𝑜𝑜𝑜𝑎𝑎(80+, 𝑗𝑗)𝐶𝐶19 where 𝑎𝑎𝑎𝑎𝑗𝑗𝑎𝑎(80+, 𝑗𝑗)𝐶𝐶19is the adjusted COVID-19 mortality rate of the 80+ age group for country j and 𝑜𝑜𝑜𝑜𝑜𝑜𝑎𝑎(80+, 𝑗𝑗)𝐶𝐶19is the observed COVID-19 mortality rate of the 80+ age group for country j.
3. Additional Figures and Table
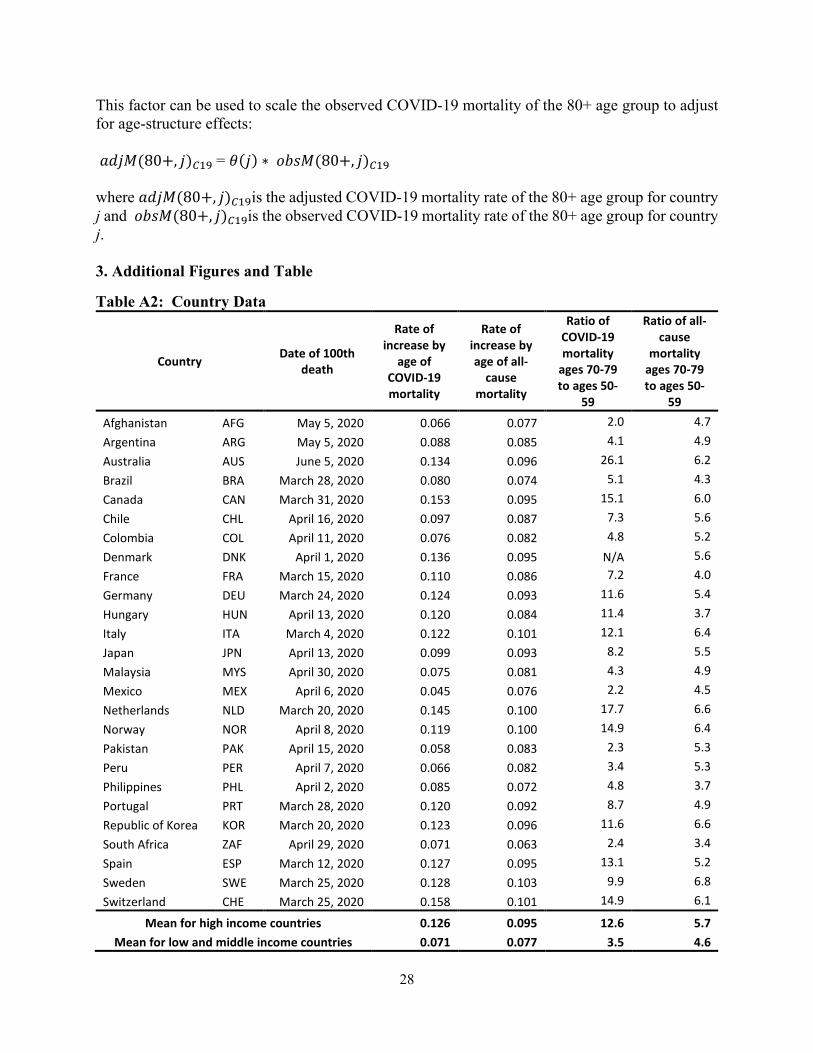
Table A2: Country Data
Country Date of 100th death
Rate of increase by
age of COVID-19 mortality
Rate of increase by age of all-
cause mortality
Ratio of COVID-19 mortality
ages 70-79 to ages 50-
59
Ratio of all-cause
mortality ages 70-79 to ages 50-
59
Afghanistan AFG May 5, 2020 0.066 0.077 2.0 4.7 Argentina ARG May 5, 2020 0.088 0.085 4.1 4.9 Australia AUS June 5, 2020 0.134 0.096 26.1 6.2 Brazil BRA March 28, 2020 0.080 0.074 5.1 4.3 Canada CAN March 31, 2020 0.153 0.095 15.1 6.0 Chile CHL April 16, 2020 0.097 0.087 7.3 5.6 Colombia COL April 11, 2020 0.076 0.082 4.8 5.2 Denmark DNK April 1, 2020 0.136 0.095 N/A 5.6 France FRA March 15, 2020 0.110 0.086 7.2 4.0 Germany DEU March 24, 2020 0.124 0.093 11.6 5.4 Hungary HUN April 13, 2020 0.120 0.084 11.4 3.7 Italy ITA March 4, 2020 0.122 0.101 12.1 6.4 Japan JPN April 13, 2020 0.099 0.093 8.2 5.5 Malaysia MYS April 30, 2020 0.075 0.081 4.3 4.9 Mexico MEX April 6, 2020 0.045 0.076 2.2 4.5 Netherlands NLD March 20, 2020 0.145 0.100 17.7 6.6 Norway NOR April 8, 2020 0.119 0.100 14.9 6.4 Pakistan PAK April 15, 2020 0.058 0.083 2.3 5.3 Peru PER April 7, 2020 0.066 0.082 3.4 5.3 Philippines PHL April 2, 2020 0.085 0.072 4.8 3.7 Portugal PRT March 28, 2020 0.120 0.092 8.7 4.9 Republic of Korea KOR March 20, 2020 0.123 0.096 11.6 6.6 South Africa ZAF April 29, 2020 0.071 0.063 2.4 3.4 Spain ESP March 12, 2020 0.127 0.095 13.1 5.2 Sweden SWE March 25, 2020 0.128 0.103 9.9 6.8 Switzerland CHE March 25, 2020 0.158 0.101 14.9 6.1
Mean for high income countries 0.126 0.095 12.6 5.7 Mean for low and middle income countries 0.071 0.077 3.5 4.6
29
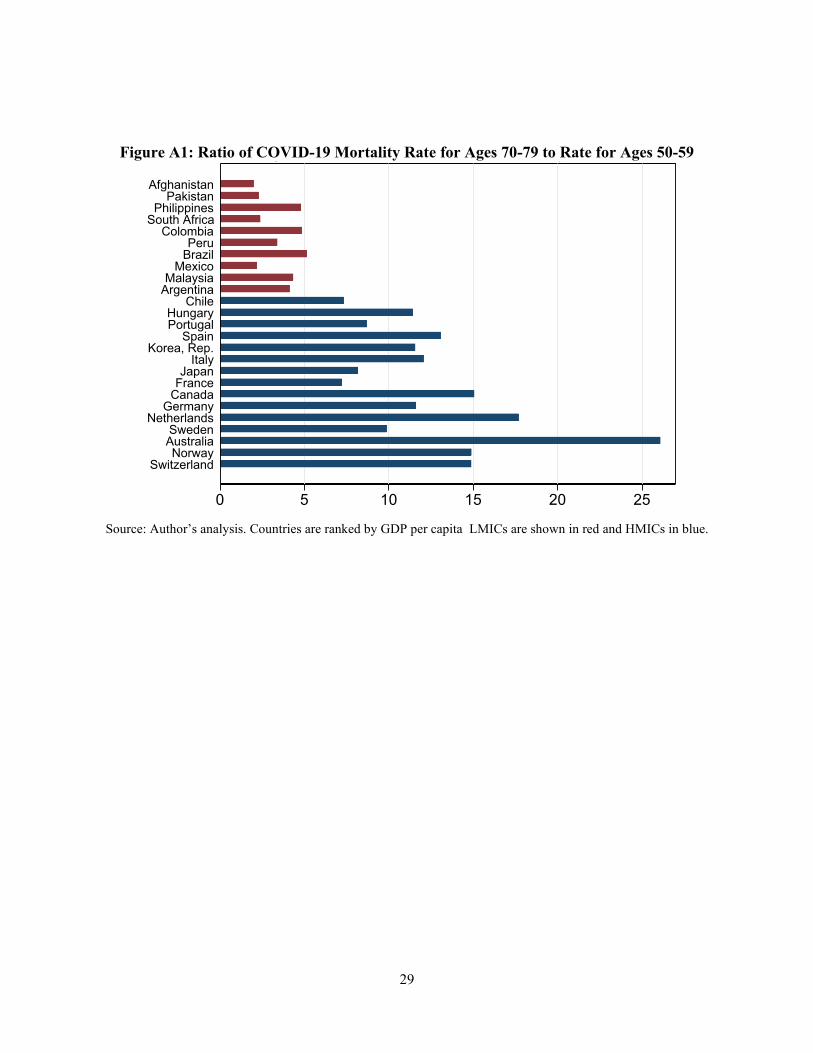
Figure A1: Ratio of COVID-19 Mortality Rate for Ages 70-79 to Rate for Ages 50-59
Source: Author’s analysis. Countries are ranked by GDP per capita LMICs are shown in red and HMICs in blue.
0 5 10 15 20 25
SwitzerlandNorway
AustraliaSweden
NetherlandsGermany
CanadaFranceJapan
ItalyKorea, Rep.
SpainPortugalHungary
ChileArgentinaMalaysia
MexicoBrazilPeru
ColombiaSouth AfricaPhilippines
PakistanAfghanistan
g y
30
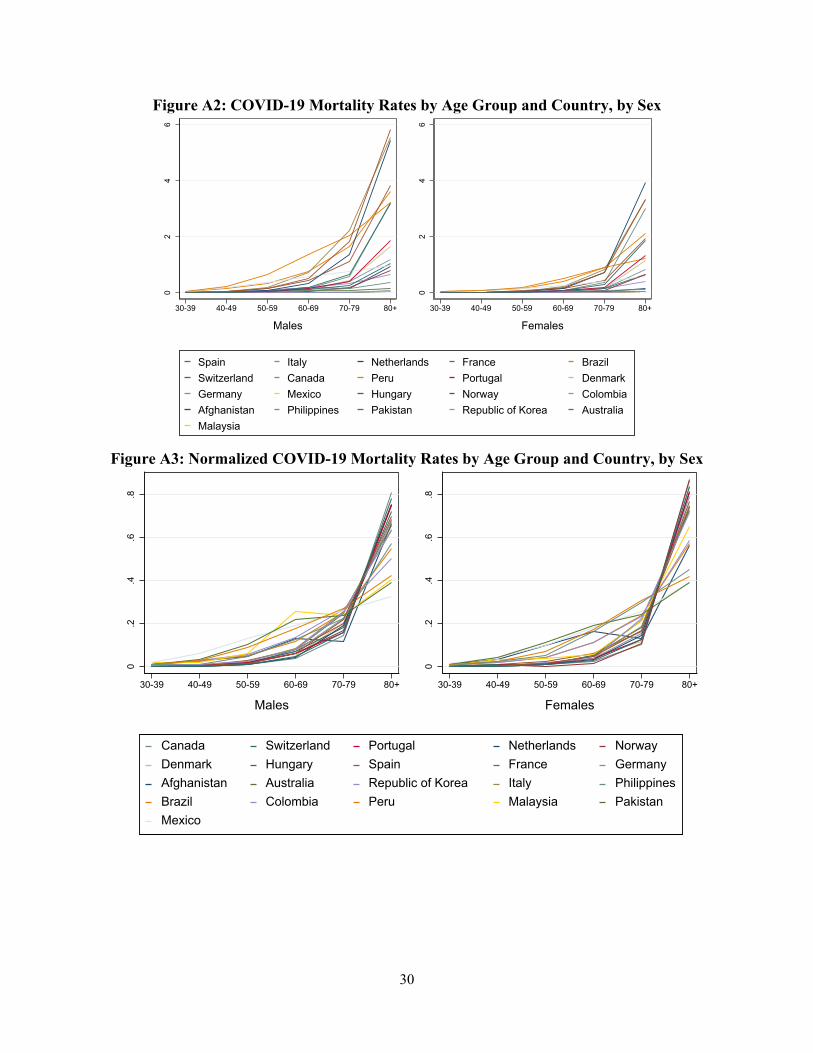
Figure A2: COVID-19 Mortality Rates by Age Group and Country, by Sex
Figure A3: Normalized COVID-19 Mortality Rates by Age Group and Country, by Sex
02
46
30-39 40-49 50-59 60-69 70-79 80+
Males
02
46
30-39 40-49 50-59 60-69 70-79 80+
Females
Spain Italy Netherlands France BrazilSwitzerland Canada Peru Portugal DenmarkGermany Mexico Hungary Norway ColombiaAfghanistan Philippines Pakistan Republic of Korea AustraliaMalaysia
0.2
.4.6
.8
30-39 40-49 50-59 60-69 70-79 80+
Males
0.2
.4.6
.8
30-39 40-49 50-59 60-69 70-79 80+
Females
Canada Switzerland Portugal Netherlands NorwayDenmark Hungary Spain France GermanyAfghanistan Australia Republic of Korea Italy PhilippinesBrazil Colombia Peru Malaysia PakistanMexico
31
Figure A4: Rate of Increase per Year of Age in COVID-19 Mortality Rate by Country
Figure A5: Rates of Increase per Year of Age in COVID-19 Mortality
vs. GDP per Capita by Country and Sex
0 .05 .1 .15 .2
SwitzerlandNorway
NetherlandsDenmarkGermanyAustraliaCanadaFrance
ItalySpain
Republic of KoreaPortugalHungaryMalaysia
MexicoBrazil
ColombiaPeru
PhilippinesPakistan
Afghanistan
Males Females
AUS
BRA
CAN
COL
DNK
FRADEU
HUNITA
MYS
MEX
NLD
NOR
PER
PRTKOR
ESP
CHE
AUS
BRA
CAN
COL
DNK
FRA
DEU
HUN
ITA
MYS
MEX
NLD
NOR
PER
PRT KORESP
CHE
.05
.1.1
5.2
5000 10000 50000 100000
GDP per capita, 2018
Males Females