
Coversheet - pure.au.dkpure.au.dk/portal/files/121618139/How_Leaders_Respond_to_Diversity... ·...
48
General Rights Copyright and moral rights for the publications made accessible in the public portal are retained by the authors and/or other copyright owners and it is a condition of accessing publications that users recognize and abide by the legal requirements associated with these rights. • Users may download and print one copy of any publication from the public portal for the purpose of private study or research. • You may not further distribute the material or use it for any profit-making activity or commercial gain • You may freely distribute the URL identifying the publication in the public portal If you believe that this document breaches copyright please contact us providing details, and we will remove access to the work immediately and investigate your claim. This coversheet template is made available by AU Library Version 1.0, October 2016 Coversheet This is the accepted manuscript (post-print version) of the article. Contentwise, the post-print version is identical to the final published version, but there may be differences in typography and layout. How to cite this publication Please cite the final published version: Andersen, S. C., & Moynihan, D. P. (2016). How Leaders Respond to Diversity: The Moderating Role of Organizational Culture on Performance Information Use. Journal of Public Administration Research and Theory, 26(3), 448-460. DOI: 10.1093/jopart/muv038 Publication metadata Title: How Leaders Respond to Diversity: The Moderating Role of Organizational Culture on Performance Information Use Author(s): Andersen, S. C., & Moynihan, D. P. Journal: Journal of Public Administration Research and Theory, 26(3), 448-460 DOI/Link: http://dx.doi.org/10.1093/jopart/muv038 Document version: Accepted manuscript (post-print)
Transcript of Coversheet - pure.au.dkpure.au.dk/portal/files/121618139/How_Leaders_Respond_to_Diversity... ·...
General Rights Copyright and moral rights for the publications made accessible in the public portal are retained by the authors and/or other copyright owners and it is a condition of accessing publications that users recognize and abide by the legal requirements associated with these rights.
• Users may download and print one copy of any publication from the public portal for the purpose of private study or research. • You may not further distribute the material or use it for any profit-making activity or commercial gain • You may freely distribute the URL identifying the publication in the public portal
If you believe that this document breaches copyright please contact us providing details, and we will remove access to the work immediately and investigate your claim.
This coversheet template is made available by AU Library Version 1.0, October 2016
Coversheet
This is the accepted manuscript (post-print version) of the article.
Contentwise, the post-print version is identical to the final published version, but there may be differences in typography and layout.
How to cite this publication Please cite the final published version:
Andersen, S. C., & Moynihan, D. P. (2016). How Leaders Respond to Diversity:
The Moderating Role of Organizational Culture on Performance Information Use. Journal of Public Administration Research and Theory, 26(3), 448-460. DOI: 10.1093/jopart/muv038
Publication metadata Title: How Leaders Respond to Diversity: The Moderating Role of
Organizational Culture on Performance Information Use
Author(s): Andersen, S. C., & Moynihan, D. P.
Journal: Journal of Public Administration Research and Theory, 26(3), 448-460
DOI/Link: http://dx.doi.org/10.1093/jopart/muv038
Document version: Accepted manuscript (post-print)
1
How Leaders Respond to Diversity: The Moderating Role of Organizational
Culture on Performance Information Use1
Simon Calmar Andersen, Aarhus University
Bartholins Allé 7, Building 1340, 327
8000 Aarhus C, Denmark
&
Donald P. Moynihan, University of Wisconsin-Madison
1225 Observatory Drive, Madison WI, 53706
1 We would like to thank Helena Skyt Nielsen that has been a co-investigator on the field
experiment on which we draw in this paper. We would also thank colleagues at Department of
Political Science, Aarhus University for – as always – valuable comments. Finally, we thank
three anonymous reviewers for the constructive feedback that helped improve the paper.
Professor Moynihan received funding from the Graduate School at University of Wisconsin-
Madison for this study.
2
Abstract
Two central governance challenges are directing leadership attention to performance data, and
the management of diversity. This paper examines connections between the two, asking if the
introduction of diversity, as a form of organizational change, is associated with greater
leadership use of performance data. Diversity is theorized as a double-edged sword for
organizations, generating greater innovation, creativity, and performance, but also conflict. We
propose that leaders will be motivated to use performance data to understand, manage, and
explain the effects of diversity. To study this question we employ a randomized controlled field
experiment where organizations are assigned new employees that bring role and educational
diversity. We find that leaders are more responsive to these two types of functional diversity
when they view their organization as lacking an innovative organizational culture.
3
Introduction
Given the reliance in contemporary governance on performance data for accountability
and improvement purposes, the use of performance information has been framed as a “big
question” for public management scholarship (Moynihan and Pandey 2010; see also Kroll 2015;
Heinrich 1999; Van Dooren and Van de Walle 2008). We know relatively little about leadership
use of performance data, or how organizational change alters performance information use. To
cast some insights on these questions we consider how diversifying the role and education of
employees matters to leadership performance information use. If employees are core to
organizational identity, then changing the nature of those people represents a fundamental form
of organizational change.
How, then, do leaders respond to the diversification of the workforce? Diversifying an
organization can be justified on the basis of increased innovation, creativity and performance,
but may also create friction between employees (Joshi and Roh 2009). In this study we suggest
that both the form that diversity takes and the culture in which it is embedded affect leader
reactions.
Diversity is popularly understood and frequently examined in terms of bio-demographic
factors, such as race, ethnicity, and gender.2 This framing of diversity is dominant in public
management studies of the topic. In this paper we focus on functional diversity: an alternative
framing of diversity as reflecting the mix of skills, educations, backgrounds and experiences in
2 We use the term bio-demographic in this paper, but this broad category of variance between
individuals has also been referred to as surface-level diversity (Harrison et al 2002), identity
diversity (Hong and Page 2004) or relations-oriented diversity (Jackson, May, and Whitney,
1995; Joshi and Roh 2009).
4
groups. The mixed effects of diversity appear to partly relate to the type of diversity or particular
industry setting (Johsi and Roh 2009), but may also be driven by contextual factors such as the
growth orientation and innovation strategy of the organization (Richard 2000; Richard et al.
2003). Our hypotheses extend theory on how diversity works in organizations by incorporating
variables that reflect the organizational context. This is an area where a recent review of
scholarship notes that more work is needed (Joshi and Roh 2009, 621): “Aspects of
organizational context such as managerial demography, climate, culture, and leadership also
merit closer scrutiny in future research.” Yet, attention to organizational context in prior work is
constrained by the neutralization of contextual factors in lab experiments, and potential
endogeneity between diversity and contextual factors in observational studies.
We overcome these limitations by using a randomized controlled field experiment that
allows us to observe the effects of introducing different types of functional diversity into actual
organizations (schools in Denmark), and to account for the role of contextual factors such as
leadership and culture. The treatments vary functional diversity in terms of educational
background and role differentiation. In the first treatment new employees with the same
educational background as existing teachers in a classroom were hired to fulfill an existing
organizational role of co-teacher in a classroom (the “status quo” treatment). In the second
treatment, schools can hire an employee from any other educational background to fulfill the
same co-teacher role (“educational diversity” treatment). In the third treatment, schools hire an
individual who shares the educational background of existing teachers to fulfill a novel
organizational role: observing and providing advice to teachers (the “role diversity” treatment).
Both the educational and role diversity treatments provide two different functional diversity
treatments. The effects of these treatments were compared to schools that were assigned no
5
additional resources (the control group). Having both a control group and a status quo treatment
enables us to rule out the possibility of alternative explanations for our results, e.g., the effects
are driven by the addition of a new employee or resources, or a “Hawthorne” effect of simply
being observed.
Contributions
The study offers a number of contributions to the research literatures on performance
information use and diversity. First, we introduce alternate conceptualizations of diversity to a
public management audience. Previous studies in the field have focused predominantly on race
and gender. We examine educational and role diversity in public organizations.
Second, we examine how leaders respond to the introduction of diversity in their
organization. Despite the existence of a careful research literature on diversity effects, there has
been little attention to the role of leadership generally (Somech 2006, 133), and especially to the
specific question we pose. Prior work documents how leaders manage diversity, but not how
leaders respond to diversity. If the introduction of diversity does indeed change internal
organizational factors, leaders may feel compelled to understand, manage and explain those
changes. Conflicts must be resolved, new innovations must be corralled or championed.
Specifically, we examine if leaders direct more attention to performance data after functional
diversity is added to their organization.
Third, the analysis contributes to the growing literature on performance information use.
Experimental designs have increasingly offered insights into role of leadership, job design, and
motivation on public sector performance (e.g., Bellè 2014; Brewer and Brewer 2011), and have
facilitated an understanding of how citizens (James 2011) and elected officials (Nielsen and
6
Baekgaard 2013) use performance data. But a recent review of this literature notes that the topic
remains dominated by cross-sectional survey designs (Kroll 2015). Beyond the methodological
limitations, the static nature of cross-sectional data are so unsuited to theoretical questions that
center on temporal effects as to leave them largely unaddressed (Oberfield 2014). As a result, we
know little about how organizational change matters to performance information use, even as
performance data provides a relatively novel tool by which managers can assess the effect of and
respond to such change. Our study represents the first field experiment we are aware of that
introduces real organizational change and assesses its effects on performance information use.
A final contribution is to examine the moderating effect of organizational culture.
Previous research suggests that the benefits of diversity depend on the organizational culture in
which it is embedded (Jayne and Dipboye 2004; Curtis and Dreachslin 2008). If diversity does
indeed bring both conflict and innovation, leadership response to diversity may be contingent on
perceptions of existing organizational needs (Richard 2000). In organizations perceived as
lacking an innovative culture, leaders may become more responsive to functional diversity.
Our results provide evidence that diversity generates greater managerial use of
performance information. Consistent with our hypothesis, the status quo treatment has no effect
relative to a control group, but the “educational diversity” and “role diversity” treatments are
associated with higher leadership use of performance information in organizations perceived as
less innovative. These two treatments generate greater performance information use in
organizations where leaders perceive a lack of innovation.
In the next section, we examine different conceptualizations of diversity and review
research on its effects. We then offer hypotheses that relate diversity changes and culture to
performance information use, before presenting our analytical strategy and results.
7
Theories of Diversity
We treat diversity as arising “from any attribute people use to tell themselves that another
person is different” (Williams and Reilly 1998, 81). This description of diversity is broad enough
to make clear that what constitutes diversity varies according to particular contexts, and how
individuals identify and construe differences in that context.
Different theoretical frameworks help to further explain the mixed effects of diversity
(summarized in greater detail in Williams and O’ Reilly 1998; Mannix and Neale 2005; Pitts and
Jarry 2007). The potential for conflict arises from social identity (Ashforth and Mael 1989) or
similarity-attraction processes (Byrne 1971). Both similarity-attraction and social identity start
with the assumption that individuals engage in social categorization of others. This process relies
on observable cues to assess if individuals hold common or divergent attributes with the observer
or dominant group, then placing others in an “in-group” or a less favorable “out-group.”
Since “surface-level” or bio-demographic factors such as race, gender, and age are mostly
easily observable (Harrison et al. 2002) and may be tied to underlying individual biases, social
categorization processes tend to result in exclusion and conflict. Even if the basis of
differentiation is objectively a poor predictor of an individual’s ability to complete a task, social
categorizations largely correlate with negative processes and outcomes. Individuals categorized
in the “out-group” may be assumed to be less capable, cooperative, or trustworthy, and given
little chance to overcome these prejudices. Individuals enjoy smoother working relationships
with those in the “in-group.” Shared characteristics become a basis for higher interpersonal
comfort and trust, and reinforcement of norms.

8
The information/decision-making approach is an alternate theoretical framework that has
generated more positive accounts of diversity (Ely 2004; Mannix and Neale 2005). The approach
assumes that more diverse groups have an inherent advantage over homogenous groups by virtue
of access to a wider array of knowledge to generate, interpret, and respond to information (Hong
and Page 2004). To the extent conflict arises it is part of a productive exchange of views that
facilitates problem-solving, rather than an ongoing tension triggered by underlying prejudices
and group status. The additional capacities provided by diversity are expected to offset the
potential cost of conflict. Because this perspective is associated with the expertise, skills and
experiences of individuals, it fits more easily with the functional diversity framing and is the
primary basis for positive accounts for why diversity improves organizational performance.
The role of diversity has been widely examined across the social sciences featuring
studies at the group, organizational, and community level (Esteban, Mayoral and Ray 2012;
Laitin and Jeon 2013; Page 2007). The level of analysis, and associated findings, tends to vary
by discipline, and by which theoretical framework is used. Social psychologists generally rely
more on an information/decision-making approach and examine how diversity improves
performance on specific tasks. Political scientists and economists who relate diversity to ethnic
conflict and societal instability are more critical (Laitin and Jeon 2013).
Studies of diversity within organizations tend to also offer a mixed picture, reflecting
Milliken and Martins’ (1996, 403) formulation of diversity as “a double-edged sword, increasing
the opportunity for creativity as well as the likelihood that group members will be dissatisfied
and fail to identify with the group.” Literature reviews and meta-analyses give credence to the
double-edged sword metaphor. In general, diversity is associated with greater creativity, and
performance, but it may also reduce social cohesion, generate conflict and delay decisions (Bell

9
et al. 2011; Joshi and Rohi 2009; Horowitz and Horowitz 2007; Mannix and Neale 2005;
Williams and Reilly 1998).
Conceptualizing Diversity: Bio-demographic and Functional Approaches
There are not only competing multiple theories of diversity, there are also different ways
to conceptualize and measure diversity. In this section we detail the differences between these
conceptualizations in order to distinguish how our functional approach is distinct from the bio-
demographic approach more typical in public management scholarship.
Public sector scholarship has framed diversity issues in terms of representative
bureaucracy (the match between a public employee and the broader population or client group),
the effect of diversity on outcomes such as organizational performance, and how diversity is
managed. Collectively the empirical work on diversity in the public sector reflects diversity in
terms of variance in bio-demographic factors: race, ethnicity, age, and gender. In part, this
reflects the fact that governments, and diversity management programs, define diversity in bio-
demographic terms. A reliance on bio-demographic markers may also reflect normative
arguments about representation in a democratic context, basic fairness in the distribution of
public goods, and reducing group-based discrimination in the workplace. Such concerns animate
studies of diversity in non-public settings also, e.g. studies of bias and discrimination in hiring
practices (e.g. Betran and Mullainthain 2004).
Empirical assessments of bio-demographic diversity on performance in public
organizations are mixed, but largely negative (Choi and Rainey 2010; Pitts 2005; Pitts and Jarry
2007; Pitts et al. 2010). By contrast, there is consistent evidence “that when public organizations
manage diversity well, they will perform better” (Oberfield 2014, 779). Well-managed diversity
10
programs are associated with positive outcomes on variables such as turnover intention (Choi
2009; Groeneveld 2011), organizational commitment (Ashikali and Groeneveld 2013), job
satisfaction (Choi and Rainey 2014; Pitts 2009) and perceived organizational performance (Choi
and Rainey 2010; Oberfield 2014; Pitts 2009). Functional diversity rests on differences that alter how people encode and solve problems
(Hong and Page 2004, 1685) and has been studied as variance in inter-group skill, education,
functional background, experiences and perspectives.34 In the experimental design that follows,
we vary diversity on two dimensions of functional diversity. For the educational diversity
treatment, employees with a different educational background than those of existing employees
are introduced. For the role diversity treatment, the new employees share the dominant
educational background as existing members, but are asked to fulfill a novel role: observing and
giving feedback to existing teachers rather than helping to teach students. Common to both forms
of diversity is the expectation is that the new employees will bring a new perspective to task
performance that disrupts taken-for-granted assumptions, resulting in heightened dialogue within
the organization about process and outcomes.
3 Though research has not sought to explicitly examine such overlaps, it is of course plausible
that the two categories of diversity overlap in practice.
4 While we seek clarity by using existing conceptual language from diversity studies, we note the
possibility of some confusion of terms here. First, functional diversity is also sometimes referred
to as task or cognitive diversity (Joshi and Roh 2009; Horowitz and Horowitz 2007). Second, the
functional background of the individual (i.e. if they worked in different types of jobs) is one
aspect of the broader category of functional diversity, which refers to different ways in which
individuals view or approach a task.

11
How Leaders Respond to Diversity
While it is not contentious to claim that the benefits of functional diversity likely depend
upon some control of how the process and group is managed (Mannix and Neale 2005), there has
been limited attention to the role of leadership in models of diversity. One stream of scholarship
deals with diversity management, concentrating on formal programs or managerial strategies to
limit the potential negative effects of bio-demographic diversity (Curtis and Dreachslin 2008;
Groeneveld 2011; Oberfield 2014; Pitts et al. 2010). For example, Choi and Rainey (2010) find
that the negative relationship between racial diversity and perceived organizational performance
actually becomes positive when effective diversity management practices are accounted for.
While such work indicates the promise of understanding diversity management, we focus on how
diversity influences other forms of management behavior.
There is also some limited research on how leadership style moderates the effect of
diversity, with support for the hypothesis that more diverse teams function and perform better
when effective (Lovelace, Shapiro and Weingart 2001), task-oriented (Klein et al. 2011),
participatory (Somech 2006) or transformational (Ashikali and Groeneveld 2013; Kearney and
Gebert 2009; Shin et al. 2012) leaders are present. Again, this research approach is slightly
different from our question, examining how diverse groups respond to leadership style, rather
than how leaders respond to diversity.
The limited existing attention to leadership in diversity studies has, in turn, limited
attention to the centrality of leaders in responding to diversity. A fundamental structural
characteristic of actual organizations is to channel both the positive (innovation) and negative
(conflict) aspects of group diversity to higher levels of authority for resolution (Hammond 1986).

12
New innovations may need additional resources or permission to be implemented, while leaders
will be called on to resolve conflict and move decisions forward. In the next section, we present
one plausible way leaders might respond to diversity, which is to invest greater effort in
understanding and integrating the effects of diversity on organizational performance.
Leadership Use of Performance Information
At the broadest level, we are interested in whether the introduction of organizational
change fosters the use of performance data – whether organizational leaders are spurred to direct
more attention to performance information in order to better understand the effects of
organizational change. There has also been limited attention to the role of leadership and
performance information use. In general, leadership has been treated as an important variable in
terms of understanding the performance information use of followers (Kroll 2015). Existing
work points to ways that new leaders facing unfamiliar environments are motivated to use
performance information to improve performance (Boyne et al. 2010) and to a relationship
between leadership and performance information use. For example, transformational leadership
style increases performance information use (Moynihan, Pandey and Wright 2012) and even
performance among followers (Bellé 2014).
In particular, we propose that as organizational changes are more novel – represented by
more diverse new personnel – the impetus to seek out performance data becomes greater relative
to conditions of no change, or where change is familiar (represented by new personnel who are
not diverse). Performance information becomes more important as a way of knowing when
organizational actors know relatively little about a phenomenon. The introduction of diversity
represents an ideal way to study these propositions. One source of agreement across the

13
competing theoretical frameworks detailed above is that diversity has a strong potential for
disrupting existing arrangements.
Our propositions on the role of change and performance information use have not
previously been tested, though some circumstantial evidence comes from the effect of variables
that test managerial experience, which has been shown to correlate negatively with performance
information use studies (Moynihan and Hawes 2012; see also Kroll 2015). This suggests that as
managers believe they have less organizational knowledge, performance information use is
viewed as a means to compensate. Our hypothesis encodes a similar logic: as novel changes are
introduced into the organization, leaders turn to performance data to assess the effect of and
respond to those changes. The diversity literature suggests that diverse personnel generate both
friction and innovation, which should further strengthen leadership interest in understanding and
managing the impact of change. Indeed a post-experiment evaluation of the treatments we study
confirmed significant effects on student outcomes.5
We propose that the introduction of diversity will encourage leaders to seek out
performance data for three related purposes: to understand if change is having an effect, to
manage change, and to explain it. With the introduction of diversity in the organization, leaders
may simply be curious whether these new type of employees are making any difference in
legitimized measures of performance. New types of employees represent a new type of input or
technology and leaders may wish to assess if and how this investment matters to performance.
5 In general, the results found that the provision of teaching assistants (the status quo and team
diversity treatments) improved reading scores, but not math scores, while the role diversity
treatments helped improve outcomes most for classrooms with students with special needs
(author identifying reference).
14
Diversity should introduce some disruptive effects in the organization, effects that the
leader may be compelled to manage. In our experiment, co-teachers who come from a non-
traditional background may question existing modes of teaching, offer new ideas, generate
conflict with existing staff, or raise concerns about whether their presence is undermining
classroom outcomes. In the context of team-based work environments, they offer a disruptive
presence that may require other employees to change their own work approach. New employees
who play the unusual role of systematically assessing teachers and giving them feedback are also
likely to generate some novel ideas about how teachers might approach their job. If adopted,
these ideas could engender both conflict and frustration among the teachers being observed as
well as new processes. Leaders are likely to be the final organizational arbiter in managing the
disruption that arises from diversity, resolving conflicts and adjudicating over new processes.
Performance data provides a basis by which they can make informed decisions in managing
disruption.
Finally, a basic role of organizational leaders is to explain the organizations’ standing and
progress, and performance data provides a means to do so. This role is most apparent in studies
that have found that diversity external to the organization facilitates higher performance
information use (Bourdeaux and Chikoto 2008; Kroll 2015; Moynihan and Hawes 2012). These
studies suggest that leaders are compelled to use performance data to respond to external groups
with competing preferences, or to rely on a data-based justification for decisions. Such a logic
applies to using performance data for internal purposes also. In the aftermath of a disruptive
event leaders may turn to performance data to help them explain to employees the impact of
change and to justify choices that leaders have made.
15
H1: The introduction of functional diversity will increase leadership performance information
use.
The Moderating Role of Culture
As we consider how leaders respond to diversity, we also take into account how leaders’
assessment of the organization shapes that response. To do so, we examine one of the most
fundamental organizational factors in the form of organizational culture. In studies of diversity
effects, there are relatively few treatments of the role of culture as a moderating factor on the
effects of diversity. Growth orientation and innovation strategy have been found to increase the
effects of diversity on performance (Richard 2000; Richard et al. 2003), but these studies do not
examine leaders’ responses to diversity. More often, culture is examined in terms of how the
group understands diversity, with cultures that allow all individuals to contribute and receive a
respectful hearing more likely to benefit from diversity. Organizational cultures that value
diversity (Ely and Thomas 2001) or people generally (Jehn and Bezrukova 2004) seem to
dampen the negative effect and encourage the positive effects of organizational diversity. More
collectivist cultures with strong shared values also appear better able to overcome the potential
conflict that arises from diversity (Chatman et al. 1998; Chatman and Spataro 2005).
Prior studies also suggest that culture matters to performance information use: Cultures
supportive of performance management or rational values are associated with higher use (e.g.
Yang and Hsieh 2006; Taylor 2011). In terms of more specific organizational traits, Moynihan
and Pandey (2010) offer evidence that developmental or innovative cultures are associated with
the use of performance data, and Moynihan, Pandey and Wright (2012) suggest that the positive
16
relationship between transformational leadership behavior and performance information use is
mediated by developmental culture (see also Kroll 2015).
One shortcoming of prior studies relating culture to performance information use is a
reliance on cross-sectional designs and common-source methods. This work models
developmental culture as having a direct effect on performance information use, or uses
developmental culture to explain the impact of other variables, but has not examined how culture
interacts with diversity to influence performance information use, or how perceptions of
organizational culture shape leadership performance information use.
In their own performance information use, leaders may respond to developmental
cultures differently from followers. We propose that as leaders see their own organizational
culture as lacking a sense of innovation, the benefits of diversity loom larger: Leaders become
more responsive to functional diversity that may generate the innovation they believe does not
exist in the existing culture. In such settings, organizational leaders may recognize the need for
improvement and be more open to outside influence.
We propose that shaking things up becomes more attractive when leaders perceive the
status quo as excessively stagnant. Using the categories of understanding, managing and
explaining change described above, leaders may be more motivated on all three dimensions to
use performance data when they see the culture as dysfunctional (Boyne et al. 2010). They have
a greater reason to understand whether disruptive change is creating a positive difference.
Leaders may hope that diversity generates conflict and innovation in a stagnant culture and rely
on performance data to manage these tensions and opportunities. It may also be the case that
leaders believe that if they already enjoy an innovative culture, this will moderate the potential
negative performance effects of diversity, giving them less reason to attend to performance data.
17
For example, Choi and Rainey (2010) find that public agencies with a results-oriented culture
and age diversity have higher perceived performance. Finally, leaders may perceive that they
will have to explain the value of change that arises from diversity to a greater degree if they view
their culture as unwelcoming to innovation and therefore have to rely on an externally validated
source of information to justify change.
H2: Leaders will be more likely to use performance data as a result of functional diversity when
they perceive their organizational culture as lacking innovation.
Analytical Approach
In our analysis, we examine how leaders respond to the random assignment of functional
diversity in their organization. Oberfield (2014a) notes that while many management variables
imply temporal processes, they are addressed using atemporal research techniques, such as cross-
sectional data. In the case of diversity management, Oberfield (2014) shows that cross-sectional
designs tend to overestimate the effect of diversity management practices on perceived
performance. Cross-sectional designs may not only result in empirical problems, but also
discourage attention to questions that have a clear temporal dimension, such as the effects of
organizational change. A review of recent research on performance information use is marked by
an absence of explicitly temporal variables (Kroll 2015).
Prior work on the effects of diversity largely rests on laboratory experiments and
observational studies. By contrast, we employ a field experiment to test our hypotheses. The
field experiment was conducted in Denmark in co-operation with the Ministry of Education,
which allocated $6 million dollars to the experiment. In Denmark, schools are operated by 98
multi-purpose municipalities, and all were invited to participate in the experiment. Among the 68
18
applicants, 18 municipalities were selected with purposeful sampling to ensure variation in terms
of geography and school size.6 Details of the randomization procedure as well as a test showing
that the experimental groups balance on observed variables are presented in the appendix.
The field of education is an appropriate policy venue to expect leadership interest in
change to reflect itself in performance information use. In Denmark (Andersen 2008; Hvidman
and Andersen 2014; Greve 2006), as elsewhere (Moynihan and Hawes 2012), there has been a
turn to quantitative indicators of student outcomes as a means of holding schools accountable
and as a tool to improve performance. Performance data therefore should have high salience for
the leaders studied.
6 This raises questions of selection and generalizability between the majority of municipalities
that participated, and those that did not. To address this issue we examined schools in
participating and non-participating municipalities. Across 28 observable characteristics –
including school size, student/teacher ratio, school and other public expenditures, and
socioeconomic characteristics – there were no significant differences from schools that did
participate in the survey (results available upon request). The only exception is municipal size.
The 68 municipalities that signed up for the trial were slightly larger in terms of area and number
of schools than the 30 non-participants. We believe that larger municipalities were more likely to
sign up because their greater number of schools meant that at least some schools would be ready
to participate. Concerns about generalizability should also be tempered by the highly centralized
nature of schools in Denmark (Meier et al. 2015), making it more reasonable to assume
generalizability across the Danish setting than, for example, generalizing from education in one
US state to another.

19
Treatments: Functional Diversity
The field experiment gave participating schools resources to hire different types of new
personnel. How those employees differ from existing employees creates functional diversity
within the school, allowing us to examine if variation in the introduction in functional diversity is
associated with variation in leadership use of performance data. Schools were assigned to four
treatment conditions:
1. Control group: School principals in the control group did not receive additional human
resources.
2. Status quo treatment: School principals were granted a budget of approximately $25,000
to hire new employees, but with the stipulation that the hires have a BA in teaching. The
new hires therefore share the educational background of existing teachers, while filling
an existing organizational role as a co-teacher in the classroom for 10.5 lessons a week.
3. Educational diversity treatment: School principals were granted a budget of
approximately $25,000 to hire new employees, with the stipulation that these hires have
any educational background other than a BA in teaching. In practice, these hires have
been used as co-teachers in the classroom for 16.5 lessons a week.
4. Role diversity treatment: School principals were assigned an individual hired by the
municipality to fulfill a new organizational role: an outside observer who regularly
visited the schools, observed teaching, and gave advice and feedback to the classroom
teacher. However, these outside observers shared the same educational background of
existing teachers (a BA in teaching) and had significant teaching experience. They were
allocated to the school 2.5 hours a week.
20
We consider the educational diversity and role diversity treatments as alternate measures
of functional diversity that are more novel than the status quo treatment. In Denmark there is a
general legal requirement for teachers to have standard educational training, and exemptions are
rare partly due to the power of teacher’s’ unions. The impetus for leaders to seek out
performance data is expected to be greater for the educational and role diversity treatments.
Since the treatment is the different hiring options school principals are offered, this
design ensures full compliance: We control that school principals in the treatment group are told
what group they are assigned to, and that schools in the control group are told that they are not
going to receive any new staff. Since the control group receives no resources, one potential
concern is that effects we find are driven by the provision of resources rather than by diversity.
However, it is worth noting that status quo treatment, which we theorize will have no impact on
performance information use, is provided resources.
All schools, including the control group, delivered data to the study. Hence, all were
aware that they were part of an experiment, and any researcher effects should affect all
experimental groups equally, and therefore not affect the difference in outcomes that we use to
identify the effect of diversity. This resolves the risk that the results arise because of a
Hawthorne effect, i.e. the treatment group behaves differently not because they receive a
treatment, but because they are aware they are being studied in a way that the control group is
not. Furthermore, the status quo-group received a treatment, so comparisons between this group
and the two other interventions would be net of any Hawthorne effects pertaining specifically to
being treated.
Dependent Variable: Performance Information Use
21
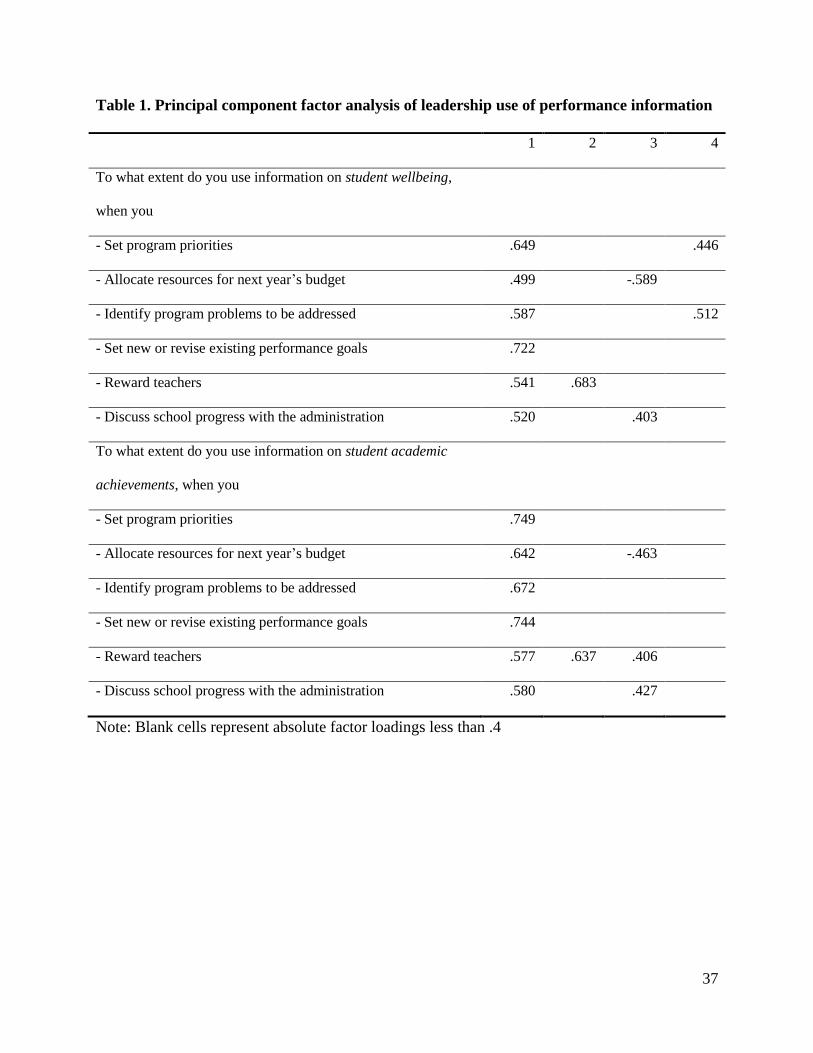
We employ performance information use as a dependent variable, based on survey
questions previously employed by the US Government Accountability Office (Lavertu and
Moynihan 2013), but adapted them to reflect the Danish educational setting. Principals were
asked about two specific types of performance data available to them. The first was on student
well-being, which 80% of principals surveyed identify as a top priority (compared to 18%
prioritizing academic test scores). The second and more conventional type of performance data
available to principals is student academic achievement. Principals were therefore asked to rank,
on a scale of 1-5, where 1 = very low extent; 5 = very high extent, “To what extent do you use
information on student well-being” and “To what extent do you use information on student
academic achievements,” when they make different types of decisions: set program priorities;
allocate resource for next year’s budget; identify program problems to be addressed; set new or
revise existing performance goals; reward teachers; and discuss school progress with the
administration. Because principals were asked about both student well-being and academic
achievements for six different types of decisions there were twelve separate responses. A
principal component factor analysis supports the use of a single index for these items (see table
1) (Cronbach’s alpha = .861). The two items on rewarding teachers could be seen as a separate
factor. However, results are similar if we leave those two items out of the index. The measure of
performance information use is based on the factor scores and is standardized to have mean 0
and standard deviation 1.
[Table 1]

22
Prior work suggests that the effects of diversity on group performance take time to occur
(Watson, Kumar and Michaelsen 1993). To allow sufficient time for the treatments to have an
effect, and to minimize the risk that these effects were purely short-term, we allowed a seven-
month gap after the provision of the treatments before we surveyed principals on performance
information use.
Moderator: Perceptions of Organizational Culture
To measure the perceived innovativeness of the organizational culture, we draw upon
previously developed measures of developmental cultures (Zamutto and Krakower, 1991).
Developmental cultures draw from a broader typology of organizational culture and are
characterized by flexibility, adaptability and readiness for change. We employ a shortened scale
with two items used in previous work (e.g. Moynihan and Pandey 2010): “My department is a
very dynamic and entrepreneurial place. People are willing to stick their necks out and take
risks” and “The glue that holds my department together is a commitment to innovation and
development” with responses on a five point scale where 1 = strongly disagree, and 5 = strongly
agree. These two items are highly correlated, with an alpha score of .763. The measure spans
from -4.1 to 1.5 with mean 0 and standard deviation 1.
In order to protect against the risk that the treatments themselves alter culture,
perceptions of culture were collected via a survey of the participating principals as the treatments
were being put in place, rather than at a later point. This also minimizes the potential of common
source bias generating artificially high correlations between the moderator and our measure of
performance information use, since, as we explain above, the dependent variable was collected at
a later time using a different survey instrument.
23
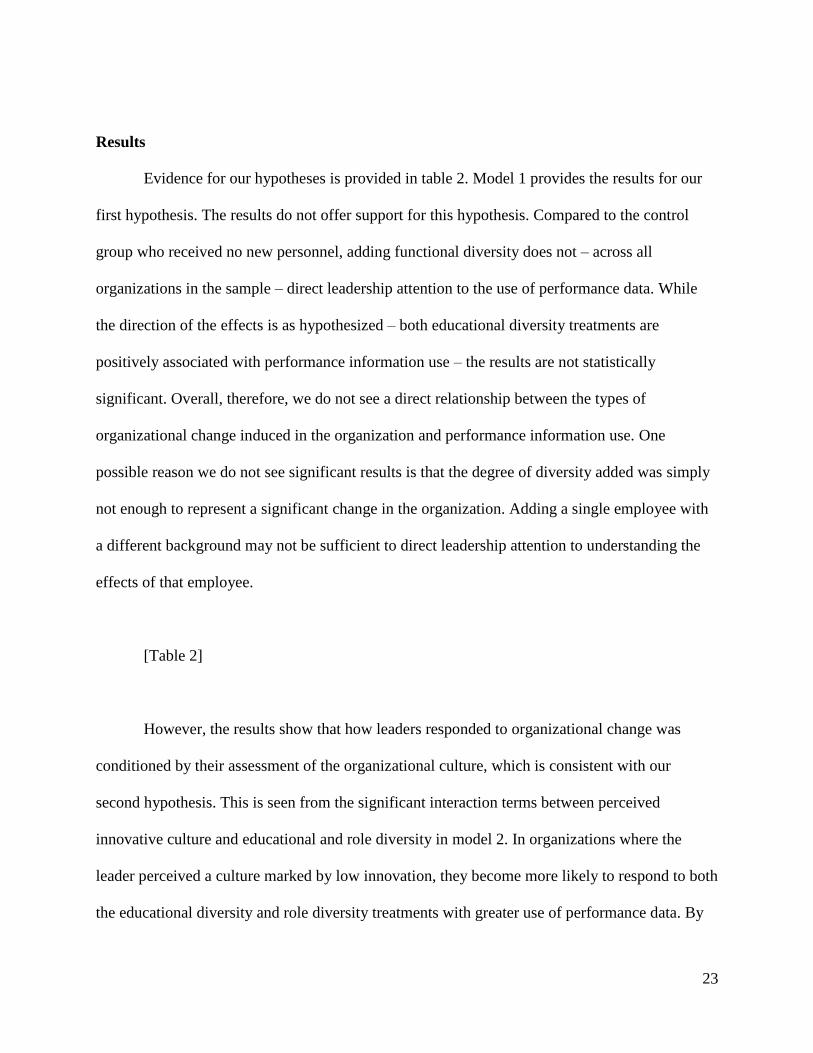
Results
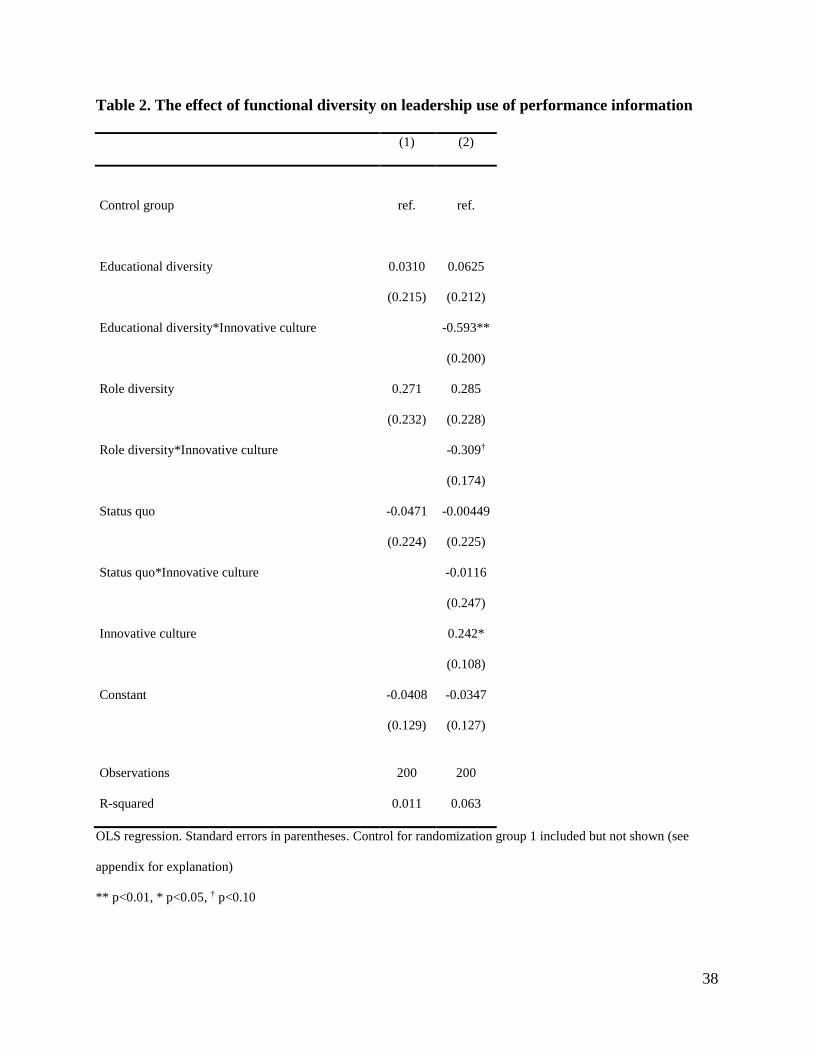
Evidence for our hypotheses is provided in table 2. Model 1 provides the results for our
first hypothesis. The results do not offer support for this hypothesis. Compared to the control
group who received no new personnel, adding functional diversity does not – across all
organizations in the sample – direct leadership attention to the use of performance data. While
the direction of the effects is as hypothesized – both educational diversity treatments are
positively associated with performance information use – the results are not statistically
significant. Overall, therefore, we do not see a direct relationship between the types of
organizational change induced in the organization and performance information use. One
possible reason we do not see significant results is that the degree of diversity added was simply
not enough to represent a significant change in the organization. Adding a single employee with
a different background may not be sufficient to direct leadership attention to understanding the
effects of that employee.
[Table 2]
However, the results show that how leaders responded to organizational change was
conditioned by their assessment of the organizational culture, which is consistent with our
second hypothesis. This is seen from the significant interaction terms between perceived
innovative culture and educational and role diversity in model 2. In organizations where the
leader perceived a culture marked by low innovation, they become more likely to respond to both
the educational diversity and role diversity treatments with greater use of performance data. By

24
contrast, the innovativeness of the organizational culture does not make leaders any more or less
likely to respond to the hiring of staff with the same background as existing staff.
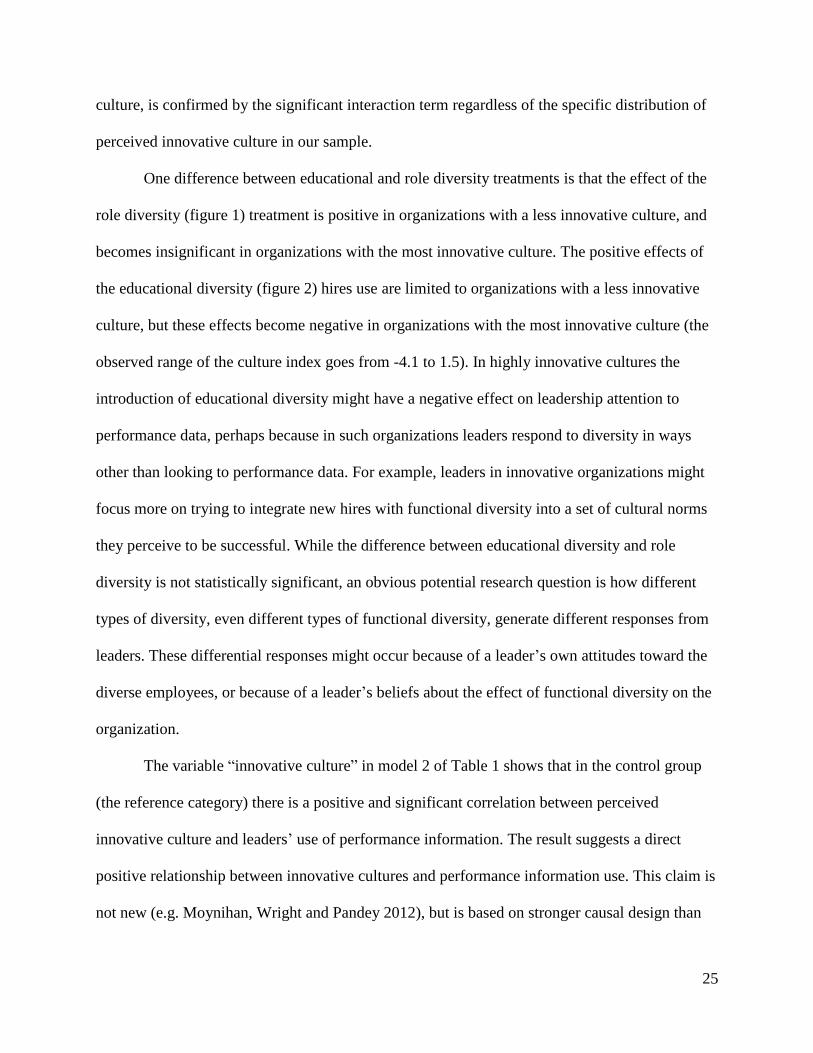
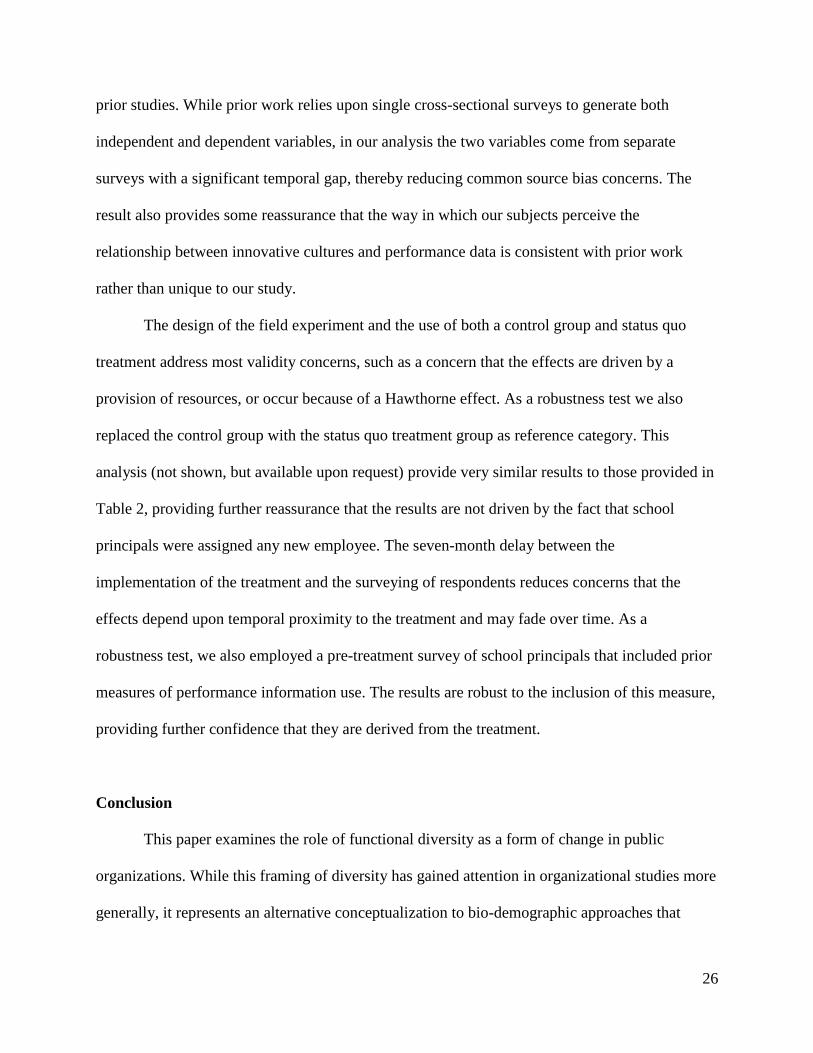
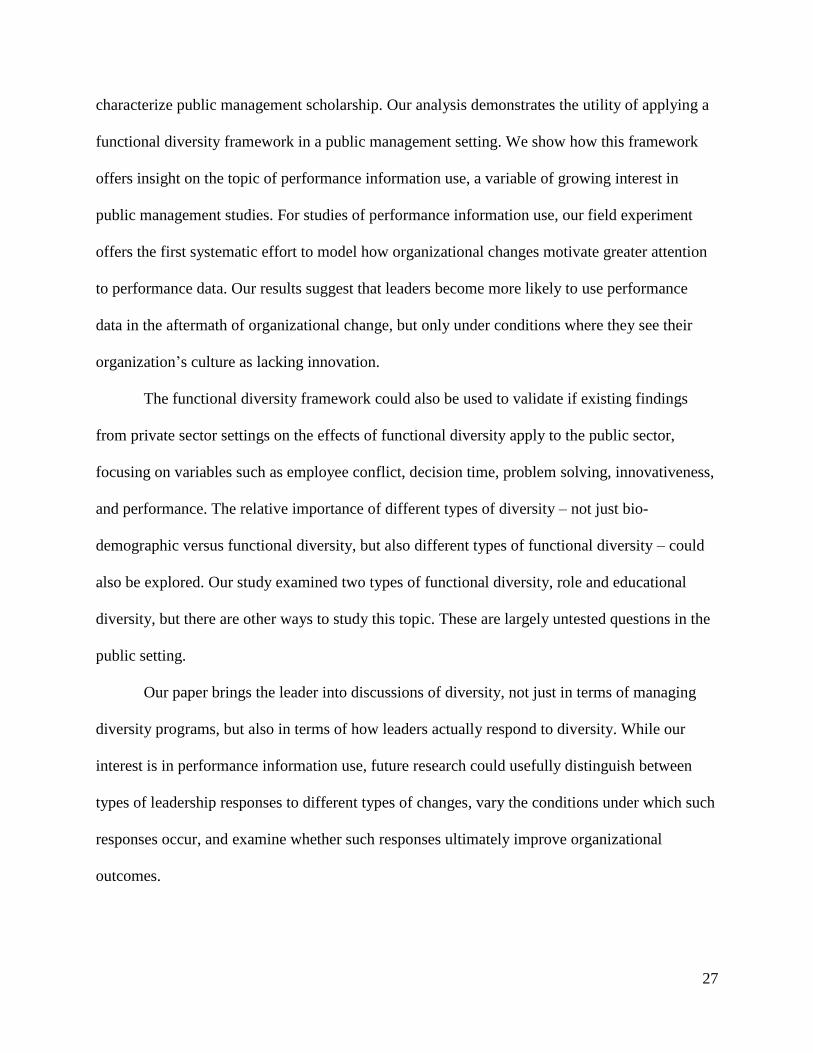
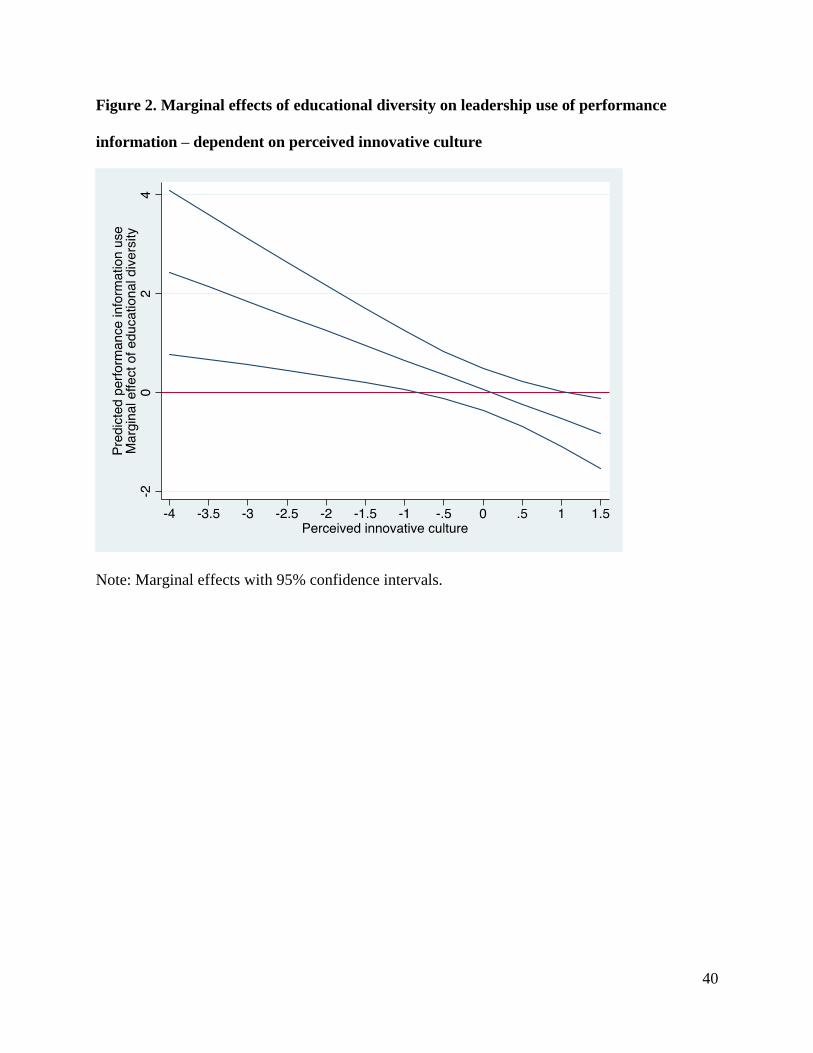
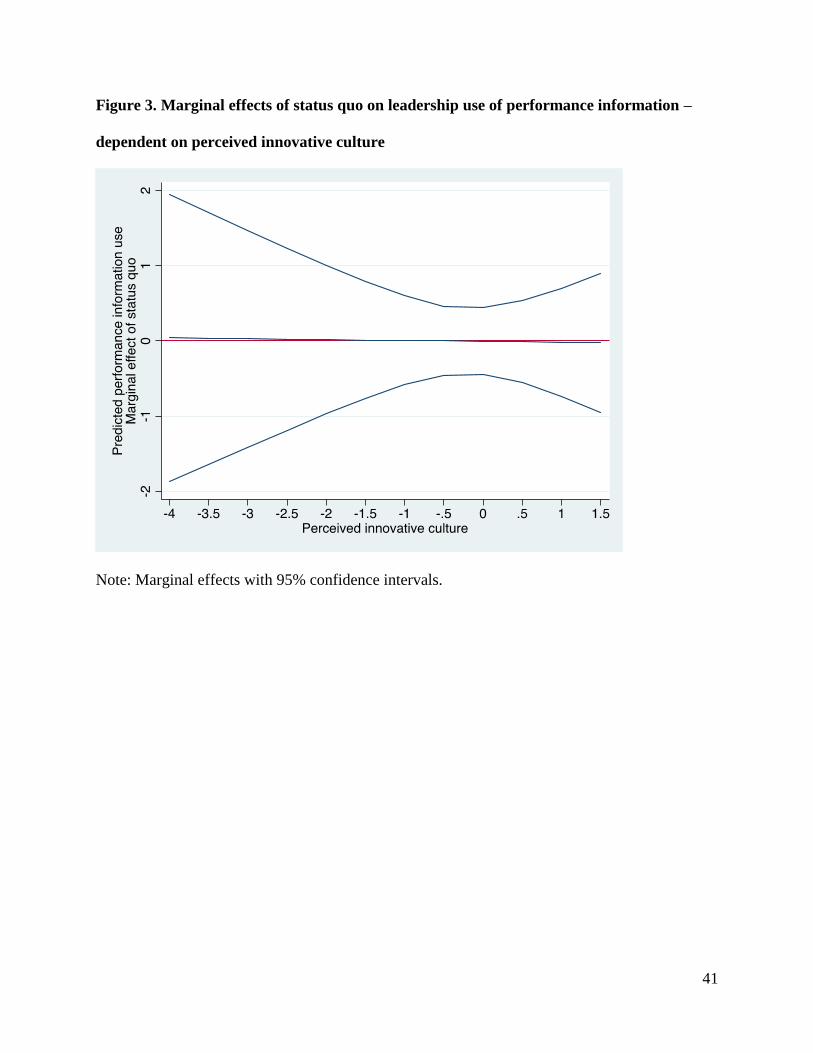
To illustrate this, figures 1, 2 and 3 demonstrate the marginal effects of each of the
treatments. The general pattern for both the role diversity and educational diversity effects are
similar (figures 1 and 2). As leaders view the organizational culture as less innovative (moving to
the left of the figure) the slope of performance information use moves upwards. By contrast, the
line for the status quo treatment (figure 3) is flat, featuring no variance in performance
information use regardless of leadership assessment of organizational culture.
[Figures 1, 2 & 3]
Another way of considering the results is to ask for what proportion of organizations we
find a statistically significant positive effect of diversity on performance information use. The
answer to that question obviously depends on level of significance used and the distribution of
innovative culture in the sample. Using 95 % confidence intervals, as we do here, the marginal
effects become significant around -1 standard deviation below the mean (the innovative culture
variable is standardized with mean 0 and standard deviation 1). That roughly corresponds to
about 16% of the schools in the sample experiencing a positive effect. Decreasing the confidence
level to 90% – which might be justified by the fact that interaction effects usually are of smaller
magnitude and thus prone to Type II errors – means that the marginal effect becomes significant
around -0.5 standard deviation corresponding to about 31 % of the organizations. However, the
general theoretical lesson, that the effect of diversity depends on how leaders’ perceive the
25
culture, is confirmed by the significant interaction term regardless of the specific distribution of
perceived innovative culture in our sample.
One difference between educational and role diversity treatments is that the effect of the
role diversity (figure 1) treatment is positive in organizations with a less innovative culture, and
becomes insignificant in organizations with the most innovative culture. The positive effects of
the educational diversity (figure 2) hires use are limited to organizations with a less innovative
culture, but these effects become negative in organizations with the most innovative culture (the
observed range of the culture index goes from -4.1 to 1.5). In highly innovative cultures the
introduction of educational diversity might have a negative effect on leadership attention to
performance data, perhaps because in such organizations leaders respond to diversity in ways
other than looking to performance data. For example, leaders in innovative organizations might
focus more on trying to integrate new hires with functional diversity into a set of cultural norms
they perceive to be successful. While the difference between educational diversity and role
diversity is not statistically significant, an obvious potential research question is how different
types of diversity, even different types of functional diversity, generate different responses from
leaders. These differential responses might occur because of a leader’s own attitudes toward the
diverse employees, or because of a leader’s beliefs about the effect of functional diversity on the
organization.
The variable “innovative culture” in model 2 of Table 1 shows that in the control group
(the reference category) there is a positive and significant correlation between perceived
innovative culture and leaders’ use of performance information. The result suggests a direct
positive relationship between innovative cultures and performance information use. This claim is
not new (e.g. Moynihan, Wright and Pandey 2012), but is based on stronger causal design than
26
prior studies. While prior work relies upon single cross-sectional surveys to generate both
independent and dependent variables, in our analysis the two variables come from separate
surveys with a significant temporal gap, thereby reducing common source bias concerns. The
result also provides some reassurance that the way in which our subjects perceive the
relationship between innovative cultures and performance data is consistent with prior work
rather than unique to our study.
The design of the field experiment and the use of both a control group and status quo
treatment address most validity concerns, such as a concern that the effects are driven by a
provision of resources, or occur because of a Hawthorne effect. As a robustness test we also
replaced the control group with the status quo treatment group as reference category. This
analysis (not shown, but available upon request) provide very similar results to those provided in
Table 2, providing further reassurance that the results are not driven by the fact that school
principals were assigned any new employee. The seven-month delay between the
implementation of the treatment and the surveying of respondents reduces concerns that the
effects depend upon temporal proximity to the treatment and may fade over time. As a
robustness test, we also employed a pre-treatment survey of school principals that included prior
measures of performance information use. The results are robust to the inclusion of this measure,
providing further confidence that they are derived from the treatment.
Conclusion
This paper examines the role of functional diversity as a form of change in public
organizations. While this framing of diversity has gained attention in organizational studies more
generally, it represents an alternative conceptualization to bio-demographic approaches that
27
characterize public management scholarship. Our analysis demonstrates the utility of applying a
functional diversity framework in a public management setting. We show how this framework
offers insight on the topic of performance information use, a variable of growing interest in
public management studies. For studies of performance information use, our field experiment
offers the first systematic effort to model how organizational changes motivate greater attention
to performance data. Our results suggest that leaders become more likely to use performance
data in the aftermath of organizational change, but only under conditions where they see their
organization’s culture as lacking innovation.
The functional diversity framework could also be used to validate if existing findings
from private sector settings on the effects of functional diversity apply to the public sector,
focusing on variables such as employee conflict, decision time, problem solving, innovativeness,
and performance. The relative importance of different types of diversity – not just bio-
demographic versus functional diversity, but also different types of functional diversity – could
also be explored. Our study examined two types of functional diversity, role and educational
diversity, but there are other ways to study this topic. These are largely untested questions in the
public setting.
Our paper brings the leader into discussions of diversity, not just in terms of managing
diversity programs, but also in terms of how leaders actually respond to diversity. While our
interest is in performance information use, future research could usefully distinguish between
types of leadership responses to different types of changes, vary the conditions under which such
responses occur, and examine whether such responses ultimately improve organizational
outcomes.
28
The field experimental approach we utilize here is ideally suited to understanding the
effects of organizational change. Such an approach can be expensive and complex to implement,
and often requires an administrative partner willing to construct experimental conditions. But it
may be possible to introduce smaller field experiments of a wide array of potential organizational
changes to observe behavioral responses by not just leaders, but managers and other employees.
We find that diversity affects leadership in organization with low perceived innovative culture.
But these organizations may also be different in other aspects. Future research could look at
alternate moderators to how leaders or other employees respond to change, such as motivation.
There are limitations to our findings, but these limitations invite further research. One
question that emerges is whether the findings hold if we move beyond the field of education,
where performance data is especially salient (Moynihan and Hawes 2012). In other policy fields,
the lower salience of performance data may limit the degree to which it is relied upon as a
response to organizational change. On the other hand, one broad change across policy fields in
recent decades is the growing salience of performance data to governance (Van Dooren,
Bouckaert and Halligan 2010). Another limitation is that leadership response might depend a
good deal on the type of changes that occur. For some changes, the use of performance data
might be a logical response, but for other changes, leaders may respond in different ways, such
as increasing attention to managing outwards via networking, for example. A final caveat to our
findings is that the effects of diversity may depend on temporal factors. Pitts and Jarry (2009)
show that time reduces the negative effect of diversity on performance in Texas schools. It may
be that leadership response to changes in employee diversity may also be temporal, varying in its
intensity across time.
29
There are practical implications of our work for organizations and leaders. While there
are obvious limitations to the external generalizability of our work, patterns of diversification
may often come as the type of top-down external pressure or requirement for diversification that
we model in our experiment. Another practical implication for leaders is about diversification
and culture. Culture is an important variable, but one that may be deeply embedded and difficult
to change (Khademian 2002). Diversity research suggests that adding functional diversity is a
way of adding innovation to an organizational culture, and our results offer a complementary
finding: If leaders find themselves in a culture they see as non-innovative, they become more
responsive to the addition of functional diversity.
30
References
Andersen, Simon Calmar. 2008. The Impact of Public Management Reforms on Student
Performance. Public Administration 86 (2): 541-58.
Ashforth, Blake, and Fred Mael. 1989. Social Identity Theory and the Organization. The
Academy of Management Review 14 (1): 20–39.
Bell, Suzanne T., Anton J. Villado, Marc A. Lukasik, Larisa Belau, and Andrea L. Briggs. 2011.
Getting Specific about Demographic Diversity Variable and Team Performance
Relationships: A Meta-Analysis. Journal of Management 37 (3): 709-43.
Bellé, Nicola. 2014. Leading to make a difference: A Field Experiment on the Performance
Effects of Transformational Leadership, Perceived Social Impact, and Public Service
Motivation Journal of Public Administration Research and Theory 24 (1): 109-36.
Bertrand, Marianne, and Sendhil Mullainathan. 2003. Are Emily and Greg more employable than
Lakisha and Jamal? A field experiment on labor market discrimination. National Bureau
of Economic Research Working Paper No. w9873.
Bourdeaux, Carolyn and Grace Chikoto. 2008. Legislative influences on performance
management reform. Public Administration Review 68 (2): 253–65.
Boyne, George A., Oliver James, Peter John, and Nicolai Petrovsky. 2010. Change at the Top:
Connecting Political and Managerial Transitions with Performance.” In Kieran Walshe,
Gill Harvey, and Pauline Jas, eds. Connecting Knowledge and Performance in Public
Services: From Knowing to Doing. Cambridge: Cambridge University Press, 128-44.
Brewer, Gene A., and Gene A. Brewer Jr. 2011. Parsing Public/Private Differences in Work
Motivation and Performance: An Experimental Study. Journal of Public Administration
Research and Theory 21 (suppl 3): 347–62.
31
Byrne, Donn. 1971. The Attraction Paradigm. New York: Academic Press.
Chatman, Jennifer A., Jeffrey T. Polzer, Sigal G. Barsade, and Margaret A. Neale. 1998. Being
different yet feeling similar: The influence of demographic composition and
organizational culture on work processes and outcomes. Administrative Science Quarterly
43 (4): 749-80.
Chatman, Jennifer A., and Sandra E. Spataro. 2005. Using self-categorization theory to
understand relational demography–based variations in people’s responsiveness to
organizational culture. Academy of Management Journal 48 (2): 321-31.
Choi, Sunjoo and Hal G. Rainey. 2010. Managing Diversity in U.S. Federal Agencies: Effects of
Diversity and Diversity Management on Employee Perceptions of Organizational
Performance. Public Administration Review 70 (1): 109-21
———. 2014. Organizational Fairness and Diversity Management in Public Organizations: Does
Fairness Matter in Managing Diversity? Review of Public Personnel Administration 34
(4): 307-31.
Curtis, Ellen Foster, and Janice L. Dreachslin. 2008. Integrative literature review: Diversity
management interventions and organizational performance: a synthesis of current
literature. Human Resource Development Review 7 (1): 107-34.
Ely, Robin and David Thomas. 2001. Cultural diversity at work: The effects of diversity
perspectives on work group processes and outcomes. Administrative Science Quarterly
46 (2): 229–73.
Ely, Robin. 2004. A Field Study of Group Diversity, Participation in Diversity Education
Programs, and Performance. Journal of Organizational Behavior 25 (6): 755–80.
Esteban, Joan, Laura Mayoral, and Debraj Ray. 2012. Ethnicity and Conflict: An Empirical

32
Study. The American Economic Review 102 (4): 1310-42.
Greve, Carsten. 2006. Public Management Reform in Denmark, Public Management Review 8
(1): 161-9.
Groeneveld, Sandra. 2011. Diversity and Employee Turnover in the Dutch Public Sector: Does
Diversity Management Make a Difference? International Journal of Public Sector
Management 24 (6): 594–612.
Hammond, Thomas H. 1986. Agenda Control, Organizational Structure, and Bureaucratic
Politics. American Journal of Political Science 30 (2): 379-420.
Harrison, David, Kenneth Price, Joanne Gavin, and Anna Florey. 2002. Time, Teams, and Task
Performance: Changing Effects of Surface-and Deep-Level Diversity on Group
Functioning. The Academy of Management Journal 45 (5): 1029–45.
Heinrich, Carolyn J. 1999. Do government bureaucrats make effective use of performance
management information? Journal of Public Administration Research and Theory 9 (3):
363-94.
Hong, Lu and Scott E. Page. 2004. Groups of diverse problem solvers can outperform groups of
high-ability problem solvers. Proceedings of the National Academy of Science 101 (46):
16385-89.
Horowitz, Sujin K. and Irwin B. Horowitz. 2007. The effects of team diversity on team
outcomes: A meta-analytic review of team demography. Journal of Management 33 (6):
987-1015.
Hvidman, Ulrik and Simon Calmar Andersen. 2014. Impact of Performance Management in
Public and Private Organizations Journal of Public Administration Research and Theory
24 (1): 35-58.
33
James, Oliver. 2011. Performance measures and democracy: Information effects on citizens in
field and laboratory experiments. Journal of Public Administration Research and Theory
21 (3): 399-418.
Jayne, Michele. E. A., and Robert L. Dipboye. 2004. Leveraging diversity to improve business
performance: Research findings and recommendations for organizations. Human
Resources Management 43 (4): 409-24.
Jehn, Karen A., and Katerina Bezrukova. 2004. A field study of group diversity, workgroup
context, and performance. Journal of Organizational Behavior 25 (6): 703–29.
Jehn, Karen A., Gregory B. Northcraft, and Margaret A. Neale. 1999. Why Differences Make a
Difference: A Field Study of Diversity, Conflict and Performance in Workgroups.
Administrative Science Quarterly 44 (4): 741-63.
Joshi, Aparna And Hyuntak Roh. 2009. The Role Of Context in Work Team Diversity Research:
A Meta-Analytic Review. Academy of Management Journal 52 (3): 987-1015.
Kearney, Eric, and Diether Gebert. 2009. Managing diversity and enhancing team outcomes: the
promise of transformational leadership. Journal of Applied Psychology 94 (1): 77-89.
Khademian, A.M. 2002. Working with Culture: How the Job Gets Done in Federal Programs.
Washington D.C.: CQ Press.
Klein, Katherine J., Andrew P. Knight, Jonathan C. Ziegert, Beng Chong Lim, and Jessica L.
Saltz. When team members’ values differ: The moderating role of team leadership.
Organizational Behavior and Human Decision Processes 114 (1): 25-36.
Kroll, Alexander. 2015. Drivers of Performance Information Use: Systematic Literature Review
and Directions for Future Research. Public Performance & Management Review 38 (3):
459-86.

34
Lavertu, Stéphane and Donald P. Moynihan. 2013. Agency Political Ideology and Reform
Implementation: Performance Management in the Bush Administration. Journal of
Public Administration Research and Theory 23 (3): 521-49.
Lovelace, Kay, Debra L. Shapiro, and Laurie R. Weingart. 2001. Maximizing cross-functional
new product teams’ innovativeness and constraint adherence: A conflict communications
perspective. Academy of Management Journal 44 (4): 779-93.
Mannix, Elizabeth, and Margaret A. Neale. 2005. What differences make a difference? The
promise and reality of diverse teams in organizations. Psychological Science in the Public
Interest 6 (2): 31-55.
Meier, Kenneth J.; Andersen, Simon Calmar; O’Toole, Laurence J.; Favero, Nathan; Winter,
Søren C. 2015. Taking Managerial Context Seriously: Public Management and
Performance in U.S. and Denmark Schools. International Public Management Journal,
18 (1): 130-50.
Moynihan, Donald and Daniel Hawes. 2012. Responsiveness to reform values: The influence of
the environment on performance information use. Public Administration Review, 72(s1):
95–105.
Moynihan, Donald, Sanjay Pandey, and Bradley Wright. 2012. Setting the table: How
transformational leadership fosters performance information use. Journal of Public
Administration Research and Theory 22 (1): 143–64.
Nielsen, Poul, and Martin Baekgaard. 2013. Performance information, blame avoidance, and
politicians’ attitudes to spending and reform: Evidence from an experiment. Journal of
Public Administration Research and Theory doi:10.1093/jopart/mut051.
Oberfield, Zachary. 2014. Accounting for Time: Comparing Temporal and Atemporal Analyses

35
of the Business Case for Diversity Management. Public Administration Review 74 (6):
777–89.
Page, Scott. E. 2007. The difference: How the power of diversity creates better groups, firms,
schools, and societies. Princeton, NJ: Princeton University Press.
Pitts, David. 2005. Diversity, Representation, and Performance: Evidence about Race and
Ethnicity in Public Organizations. Journal of Public Administration Research and Theory
15 (4): 615-31.
_____. 2009. Diversity Management, Job Satisfaction, and Performance: Evidence from U.S.
Federal Agencies. Public Administration Review 69 (2): 328–38.
Pitts, David, and Elizabeth Jarry. 2007. “Ethnic Diversity and Organizational Performance:
Assessing Diversity Effects at the Managerial and Street Levels.” International Public
Management Journal 10 (2): 233–54.
———. 2009. Getting to Know You: Ethnic Diversity, Time and Performance in Public
Organizations. Public Administration 87 (3): 503–18.
Pitts, David, Alisa K. Hicklin, Daniel P. Hawes, and Erin Melton. 2010. What Drives the
Implementation of Diversity Management Programs? Evidence from Public
Organizations Journal of Public Administration Research and Theory 20 (4): 867-86.
Richard, Orlando C. 2000. Racial diversity, business strategy, and firm performance: A resource-
based view. Academy of Management Journal 43 (2): 164–77.
Richard, Orlando C., Amy McMillan, Ken Chadwick, and Sean Dwyer. 2003. Employing an
innovation strategy in racially diverse workforces: Effects on firm performance. Group
Organization Management 28 (1):107–26.
Shin, Shung J.,Tae-Yeol Kim, Jeong-Yeon Lee and Lin Bian. 2012. Cognitive Team Diversity
36
and Individual Team Member Creativity: A Cross-Level Interaction. Academy of
Management Journal 55 (1): 197-212.
Somech, Anit. 2006. The Effects of Leadership Style and Team Process on Performance and
Innovation in Functionally Heterogeneous Teams. Journal of Management 32 (1): 132-
57.
Taylor, Jeanette. 2011. Factors influencing the use of performance information for decision
making in Australian state agencies. Public Administration 89 (4): 1316–34.
Van Dooren, Wouter and Steven Van de Walle (eds). 2008. Performance Information in the
Public Sector: How it is Used. Baskingstokem UK: Palgrave MacMillan.
Van Dooren, Wouter, Geert Bouckaert, and John Halligan. 2010. Performance Management.
New York: Routledge.
Watson, Warren E., Kamalesh Kumar, and Larry K. Michaelsen. 1993. Cultural diversity’s
impact on interaction process and performance: Comparing homogeneous and diverse
task groups. Academy of Management Journal 36 (3): 590-602.
Williams, Katherine Y., and Charles A. O’Reilly. 1998. Demography and diversity in
organizations: A review of 40 years of research. Research in Organizational Behavior 20:
77-140.
Yang, Kaifeng, and Jung Y. Hsieh. 2006. Managerial effectiveness of government performance
measurement: Testing a middle range model. Public Administration Review 67 (5):861–
79.
37
Table 1. Principal component factor analysis of leadership use of performance information
1 2 3 4
To what extent do you use information on student wellbeing,
when you
- Set program priorities .649 .446
- Allocate resources for next year’s budget .499 -.589
- Identify program problems to be addressed .587 .512
- Set new or revise existing performance goals .722
- Reward teachers .541 .683
- Discuss school progress with the administration .520 .403
To what extent do you use information on student academic
achievements, when you
- Set program priorities .749
- Allocate resources for next year’s budget .642 -.463
- Identify program problems to be addressed .672
- Set new or revise existing performance goals .744
- Reward teachers .577 .637 .406
- Discuss school progress with the administration .580 .427
Note: Blank cells represent absolute factor loadings less than .4
38
Table 2. The effect of functional diversity on leadership use of performance information
(1) (2)
Control group ref. ref.
Educational diversity 0.0310 0.0625
(0.215) (0.212)
Educational diversity*Innovative culture
-0.593**
(0.200)
Role diversity 0.271 0.285
(0.232) (0.228)
Role diversity*Innovative culture
-0.309†
(0.174)
Status quo -0.0471 -0.00449
(0.224) (0.225)
Status quo*Innovative culture
-0.0116
(0.247)
Innovative culture
0.242*
(0.108)
Constant -0.0408 -0.0347
(0.129) (0.127)
Observations 200 200
R-squared 0.011 0.063
OLS regression. Standard errors in parentheses. Control for randomization group 1 included but not shown (see
appendix for explanation)
** p<0.01, * p<0.05, † p<0.10

39
Figure 1. Marginal effects of role diversity on leadership use of performance information –
dependent on perceived innovative culture
Note: Marginal effects with 95% confidence intervals.
40
Figure 2. Marginal effects of educational diversity on leadership use of performance
information – dependent on perceived innovative culture
Note: Marginal effects with 95% confidence intervals.
41
Figure 3. Marginal effects of status quo on leadership use of performance information –
dependent on perceived innovative culture
Note: Marginal effects with 95% confidence intervals.

42
APPENDIX
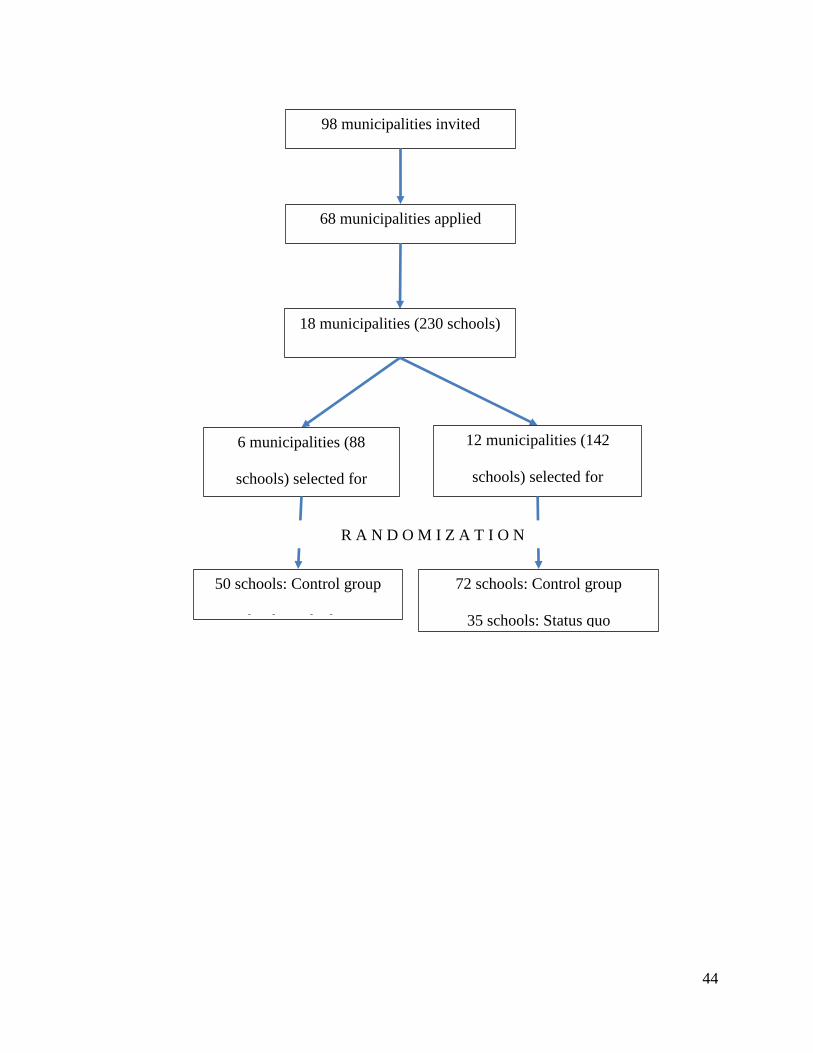
1. Description of the randomization procedure
The Danish Ministry of Education invited all 98 Danish municipalities to participate with their
schools in a randomized controlled field experiment regarding co-teaching. 68 municipalities
applied. Among the applicants, 18 municipalities were selected including 230 schools. The
municipalities were selected intentionally to create diversity in terms of geography and school
size. The 18 municipalities were divided into two groups. In Group 1 schools were assigned to
either the hiring of consultants (role diversity-treatments) or control group. In Group 2 schools
were assigned to either hiring co-teachers (status quo-treatment), teaching assistants (educational
diversity-treatment) at other schools. Within each of these two groups, schools were stratified
based on the predicted test score average of the present cohort of 6th grade students. Within each
strata schools were randomly assigned the treating conditions. In Group 1 the conditions were
either no additional hires or the role diversity hire. In Group 2 the conditions were either no
additional hires, the status quo treatment or the educational diversity group. Controlling for
Group 1 does not alter the results substantially.
Figure A1 is a diagram of the experimental randomization procedure.
43
Figure A1. The Experimental Randomization Procedure
44
98 municipalities invited
68 municipalities applied
18 municipalities (230 schools)
selected intentionally
6 municipalities (88
schools) selected for
12 municipalities (142
schools) selected for
50 schools: Control group
38 schools: Role diversity
72 schools: Control group
35 schools: Status quo
R A N D O M I Z A T I O N
45
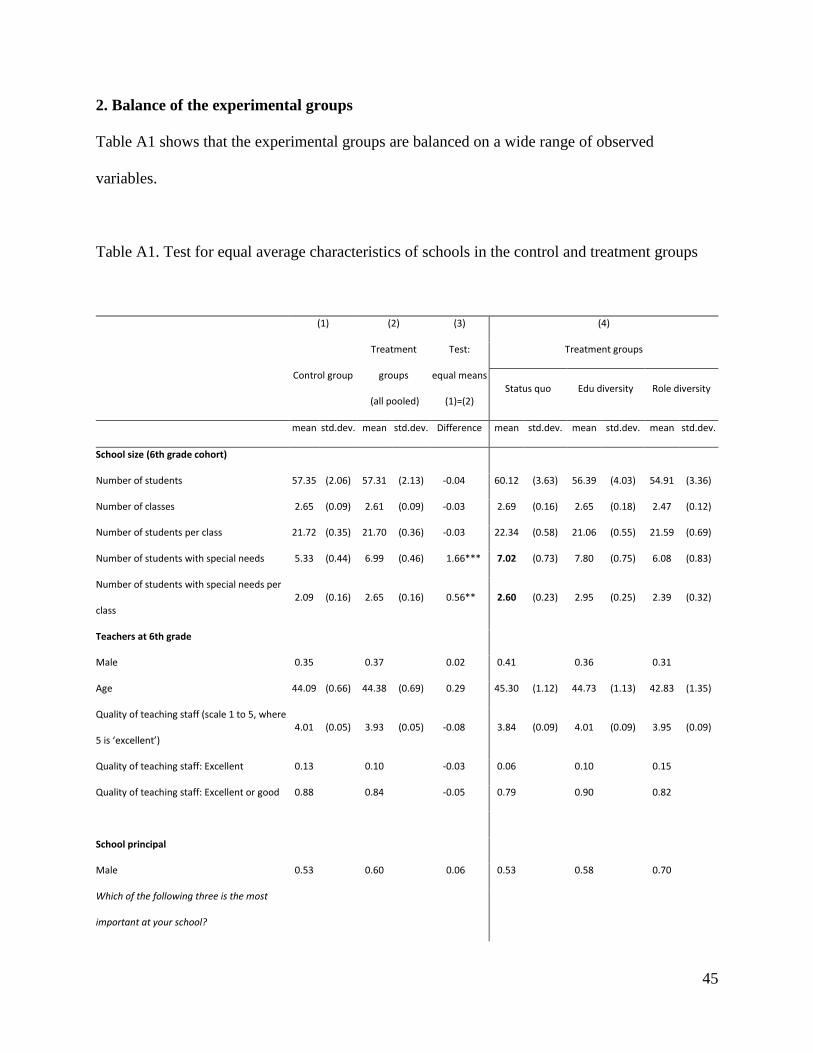
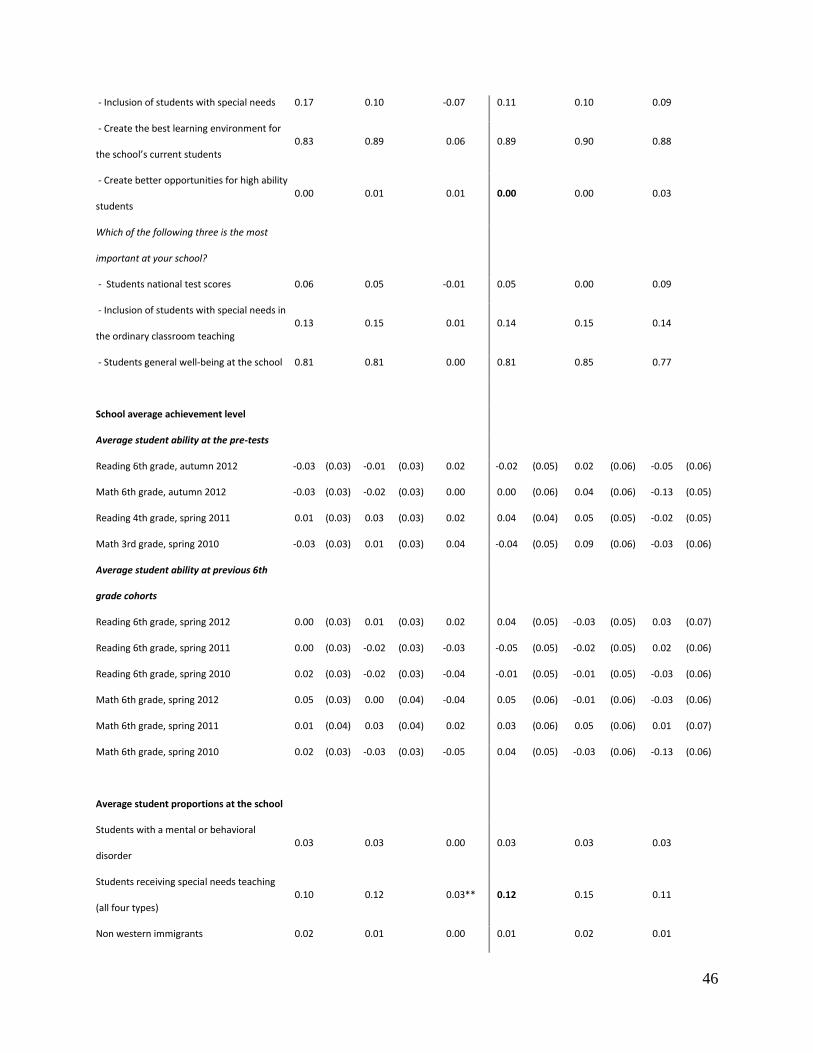
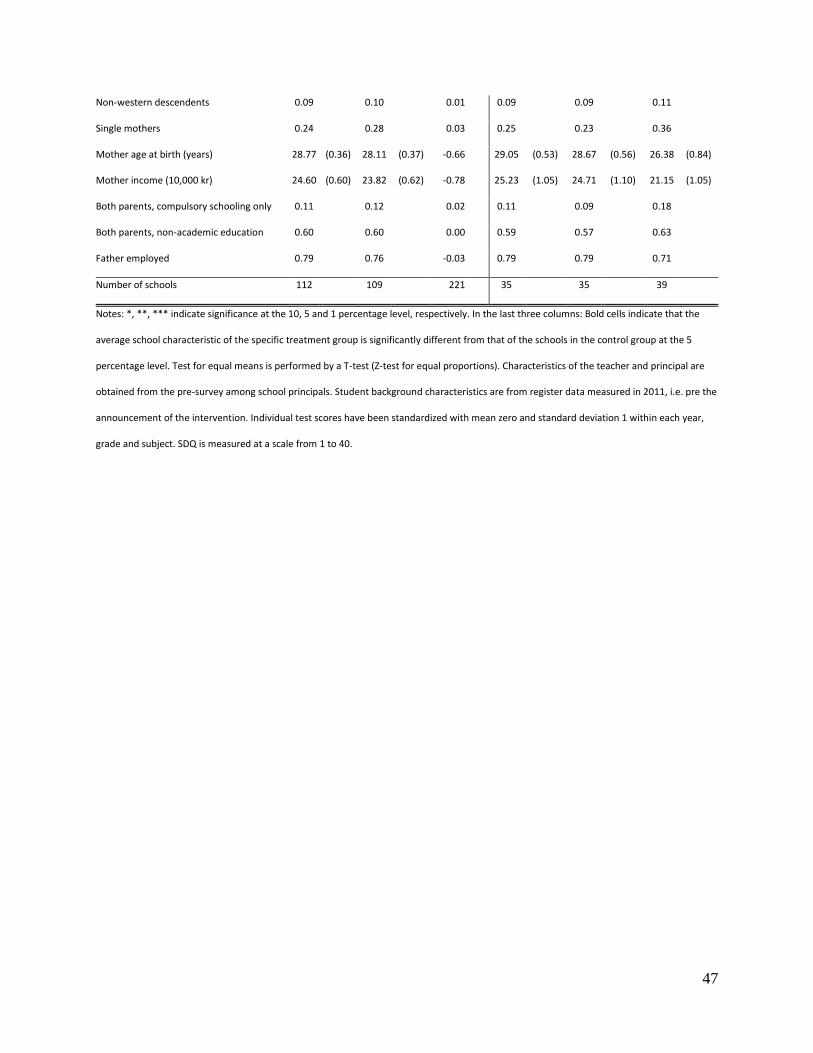
2. Balance of the experimental groups
Table A1 shows that the experimental groups are balanced on a wide range of observed
variables.
Table A1. Test for equal average characteristics of schools in the control and treatment groups
(1) (2) (3) (4)
Control group
Treatment
groups
(all pooled)
Test:
equal means
(1)=(2)
Treatment groups
Status quo Edu diversity Role diversity
mean std.dev. mean std.dev. Difference mean std.dev. mean std.dev. mean std.dev.
School size (6th grade cohort)
Number of students 57.35 (2.06) 57.31 (2.13) -0.04 60.12 (3.63) 56.39 (4.03) 54.91 (3.36)
Number of classes 2.65 (0.09) 2.61 (0.09) -0.03 2.69 (0.16) 2.65 (0.18) 2.47 (0.12)
Number of students per class 21.72 (0.35) 21.70 (0.36) -0.03 22.34 (0.58) 21.06 (0.55) 21.59 (0.69)
Number of students with special needs 5.33 (0.44) 6.99 (0.46) 1.66 *** 7.02 (0.73) 7.80 (0.75) 6.08 (0.83)
Number of students with special needs per
class 2.09 (0.16) 2.65 (0.16) 0.56 ** 2.60 (0.23) 2.95 (0.25) 2.39 (0.32)
Teachers at 6th grade
Male 0.35 0.37 0.02 0.41 0.36 0.31
Age 44.09 (0.66) 44.38 (0.69) 0.29 45.30 (1.12) 44.73 (1.13) 42.83 (1.35)
Quality of teaching staff (scale 1 to 5, where
5 is ‘excellent’) 4.01 (0.05) 3.93 (0.05) -0.08 3.84 (0.09) 4.01 (0.09) 3.95 (0.09)
Quality of teaching staff: Excellent 0.13 0.10 -0.03 0.06 0.10 0.15
Quality of teaching staff: Excellent or good 0.88 0.84 -0.05 0.79 0.90 0.82
School principal
Male 0.53 0.60 0.06 0.53 0.58 0.70
Which of the following three is the most
important at your school?
46
- Inclusion of students with special needs 0.17 0.10 -0.07 0.11 0.10 0.09
- Create the best learning environment for
the school’s current students 0.83 0.89 0.06 0.89 0.90 0.88
- Create better opportunities for high ability
students 0.00 0.01 0.01 0.00 0.00 0.03
Which of the following three is the most
important at your school?
- Students national test scores 0.06 0.05 -0.01 0.05 0.00 0.09
- Inclusion of students with special needs in
the ordinary classroom teaching 0.13 0.15 0.01 0.14 0.15 0.14
- Students general well-being at the school 0.81 0.81 0.00 0.81 0.85 0.77
School average achievement level
Average student ability at the pre-tests
Reading 6th grade, autumn 2012 -0.03 (0.03) -0.01 (0.03) 0.02 -0.02 (0.05) 0.02 (0.06) -0.05 (0.06)
Math 6th grade, autumn 2012 -0.03 (0.03) -0.02 (0.03) 0.00 0.00 (0.06) 0.04 (0.06) -0.13 (0.05)
Reading 4th grade, spring 2011 0.01 (0.03) 0.03 (0.03) 0.02 0.04 (0.04) 0.05 (0.05) -0.02 (0.05)
Math 3rd grade, spring 2010 -0.03 (0.03) 0.01 (0.03) 0.04 -0.04 (0.05) 0.09 (0.06) -0.03 (0.06)
Average student ability at previous 6th
grade cohorts
Reading 6th grade, spring 2012 0.00 (0.03) 0.01 (0.03) 0.02 0.04 (0.05) -0.03 (0.05) 0.03 (0.07)
Reading 6th grade, spring 2011 0.00 (0.03) -0.02 (0.03) -0.03 -0.05 (0.05) -0.02 (0.05) 0.02 (0.06)
Reading 6th grade, spring 2010 0.02 (0.03) -0.02 (0.03) -0.04 -0.01 (0.05) -0.01 (0.05) -0.03 (0.06)
Math 6th grade, spring 2012 0.05 (0.03) 0.00 (0.04) -0.04 0.05 (0.06) -0.01 (0.06) -0.03 (0.06)
Math 6th grade, spring 2011 0.01 (0.04) 0.03 (0.04) 0.02 0.03 (0.06) 0.05 (0.06) 0.01 (0.07)
Math 6th grade, spring 2010 0.02 (0.03) -0.03 (0.03) -0.05 0.04 (0.05) -0.03 (0.06) -0.13 (0.06)
Average student proportions at the school
Students with a mental or behavioral
disorder 0.03 0.03 0.00 0.03 0.03 0.03
Students receiving special needs teaching
(all four types) 0.10 0.12 0.03 ** 0.12 0.15 0.11
Non western immigrants 0.02 0.01 0.00 0.01 0.02 0.01
47
Non-western descendents 0.09 0.10 0.01 0.09 0.09 0.11
Single mothers 0.24 0.28 0.03 0.25 0.23 0.36
Mother age at birth (years) 28.77 (0.36) 28.11 (0.37) -0.66 29.05 (0.53) 28.67 (0.56) 26.38 (0.84)
Mother income (10,000 kr) 24.60 (0.60) 23.82 (0.62) -0.78 25.23 (1.05) 24.71 (1.10) 21.15 (1.05)
Both parents, compulsory schooling only 0.11 0.12 0.02 0.11 0.09 0.18
Both parents, non-academic education 0.60 0.60 0.00 0.59 0.57 0.63
Father employed 0.79 0.76 -0.03 0.79 0.79 0.71
Number of schools 112 109 221 35 35 39
Notes: *, **, *** indicate significance at the 10, 5 and 1 percentage level, respectively. In the last three columns: Bold cells indicate that the
average school characteristic of the specific treatment group is significantly different from that of the schools in the control group at the 5
percentage level. Test for equal means is performed by a T-test (Z-test for equal proportions). Characteristics of the teacher and principal are
obtained from the pre-survey among school principals. Student background characteristics are from register data measured in 2011, i.e. pre the
announcement of the intervention. Individual test scores have been standardized with mean zero and standard deviation 1 within each year,
grade and subject. SDQ is measured at a scale from 1 to 40.